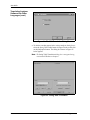
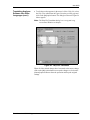
1
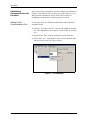
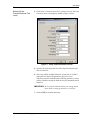
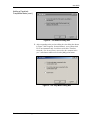
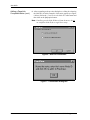
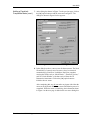
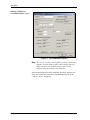
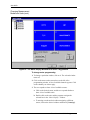
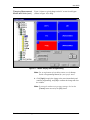
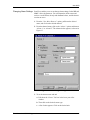
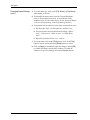
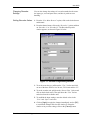
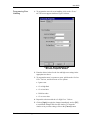
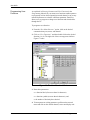
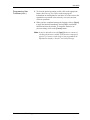
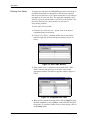
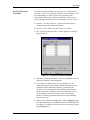
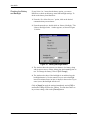
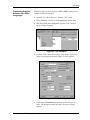
PanaView™
for MIS and MMS Series
Hygrometers
June 2003
Process Control Instruments
PanaView™ for
MIS/MMS Series Hygrometers
User’s Guide
916-089A
June 2003
Table of Contents
Introduction . . . . . . . . . . . . . . . . . . . . . . . . . . . . . . . . . . . . . . . . . . . . . . . . . . . . . . . . . . . . . . . . . . . 1
Wiring the RS232 Interface . . . . . . . . . . . . . . . . . . . . . . . . . . . . . . . . . . . . . . . . . . . . . . . . . . . . . . . 1
Establishing Communications with PanaView . . . . . . . . . . . . . . . . . . . . . . . . . . . . . . . . . . . . . . . . 2
Setting Up the Communications Port . . . . . . . . . . . . . . . . . . . . . . . . . . . . . . . . . . . . . . . . . . . . 2
Adding a PanaLink-Compatible Meter . . . . . . . . . . . . . . . . . . . . . . . . . . . . . . . . . . . . . . . . . . . 4
Programming a Meter with PanaView. . . . . . . . . . . . . . . . . . . . . . . . . . . . . . . . . . . . . . . . . . . . . . . 9
Changing Measurement Modes and Units . . . . . . . . . . . . . . . . . . . . . . . . . . . . . . . . . . . . . . . . 9
Changing a Matrix Display to a Graph . . . . . . . . . . . . . . . . . . . . . . . . . . . . . . . . . . . . . . . . . . 12
Changing Alarm Settings . . . . . . . . . . . . . . . . . . . . . . . . . . . . . . . . . . . . . . . . . . . . . . . . . . . . 13
Changing Recorder Settings . . . . . . . . . . . . . . . . . . . . . . . . . . . . . . . . . . . . . . . . . . . . . . . . . . 15
Testing Recorder Outputs . . . . . . . . . . . . . . . . . . . . . . . . . . . . . . . . . . . . . . . . . . . . . . . . . . . . 16
Programming Error Handling . . . . . . . . . . . . . . . . . . . . . . . . . . . . . . . . . . . . . . . . . . . . . . . . . 17
Programming User Functions . . . . . . . . . . . . . . . . . . . . . . . . . . . . . . . . . . . . . . . . . . . . . . . . . 18
Entering User Tables. . . . . . . . . . . . . . . . . . . . . . . . . . . . . . . . . . . . . . . . . . . . . . . . . . . . . . . . 20
Entering Saturation Constants. . . . . . . . . . . . . . . . . . . . . . . . . . . . . . . . . . . . . . . . . . . . . . . . . 21
Checking the Battery and Backlight . . . . . . . . . . . . . . . . . . . . . . . . . . . . . . . . . . . . . . . . . . . . 22
Translating Analyzer Software into Other Languages . . . . . . . . . . . . . . . . . . . . . . . . . . . . . . . . . 23
iii
June 2003
Introduction
The PanaView™ graphical user interface offers interactive
communications between Windows-based PCs and GE Panametrics
hygrometers — the MIS Series 1 and 2, and the MMS Series 3 —
compatible with the company’s PanaLink protocol. (Compatible 32bit Windows operating systems include Windows 98SE, NT 4.0 (with
Service Pack 6), 2000, XP and ME). With PanaView, you can:
•
load and save site file data
•
create and save graph and log files
•
display text output and graphs of live measurement data
•
create custom templates for displaying text, graph and log data
•
interface with multiple GE Panametrics instruments.
This document focuses on particular applications suitable for meters
that use the GE Panametrics PanaLink protocol. For general
PanaView applications such as creating graph and log files,
displaying live measurement data, and creating custom templates,
please refer to the general PanaView User’s Manual (910-211).
Wiring the RS232
Interface
All PanaLink-protocol instruments utilize an RS232 interface to communicate with a PC. For details on wiring your RS232 interface,
please refer to the Installation chapter of your instrument’s Startup
Guide, and to the document EIA-RS Serial Communications
(916-054).
PanaView with MIS/MMS Hygrometers
1
June 2003
Establishing
Communications with
PanaView
After your hardware and software have been installed as described in
Chapters 2 (Installation) and 3 (Initial Setup) of the PanaView User’s
Manual and the instrument’s Startup Guide, the procedure for
establishing communications with a meter may be started.
Setting Up the
Communications Port
Use the steps below to establish communications with a PanaLinkcompatible meter.
1. Open the “New Meter Browser” window and expand the network
tree. Then, highlight the My Computer (Name) branch by clicking
on it.
2. Pull down the “Edit” menu by clicking on it in the menu bar.
3. Click on the “New” menu option to select it, and a submenu opens
with two choices on it (see Figure 1 below).
Figure 1: The Edit Menu
2
PanaView with MIS/MMS Hygrometers
June 2003
Setting Up the
Communications Port
(cont.)
4. Click on the “Communications Port” option to select it. The Setup
Communications screen appears similar to Figure 2 below.
Figure 2: Setup Communications Screen
5. Open the Protocol menu (the first of the drop-down menus) and
click on PanaLink.
6. Select any suitable available baud rate. A baud rate of 19,200 is
appropriate for almost all applications. However, if you
experience periodic communication reliability problems, you may
wish to consider lowering the baud rate on your instrument and in
PanaView.
IMPORTANT: Be sure all the communications port settings match
those made in setting up the meter’s serial port.
7. Click on [OK] to complete data entry.
PanaView with MIS/MMS Hygrometers
3
June 2003
Adding a PanaLinkCompatible Meter
To add a meter on the PanaLink-configured communications port,
complete the following steps:
1. Highlight the communication port to which the meter will be
added by clicking on it, and then open the “Edit” menu on the
menu bar (if the communication port is not highlighted first, the
“New Meter” option is not active in the “Edit” menu).
2. Click on the “New” option in the “Edit” menu (see Figure 3
below).
Figure 3: "New" Option in the "Edit" Menu
3. After clicking on the “New” option, the “Meter” menu option
appears. Click on this option to select it.
4. After selecting the “New” and “Meter” options, the dialog box
shown in Figure 4 on the next page appears. Select the “I don’t
know the node ID of the meter I am adding to the network” radio
button and then click on the [OK] option button.
Note: When installing the first meter on the network, even if you
know the node ID assigned to the meter, it is more foolproof to
allow PanaView to retrieve the information directly from the
meter. If the “I know the node ID of the meter I am adding to
the network.” option is selected instead, the process skips
directly to Step 7 on page 7.
4
PanaView with MIS/MMS Hygrometers
June 2003
Adding a PanaLinkCompatible Meter (cont.)
Figure 4: The Node ID Dialog Box
5. After responding to the previous dialog box, the dialog box shown
in Figure 5 below appears. In most instances, users connect their
PC to one instrument only via a direct serial cable. Therefore,
select the “It is the only meter connected to the communication
port” radio button and then click on the [OK] option button.
Figure 5: The Only Meter Dialog Box
PanaView with MIS/MMS Hygrometers
5
June 2003
Adding a PanaLinkCompatible Meter (cont.)
6. After responding to the previous dialog box, a dialog box showing
the Node ID (16 in this example) of the meter appears (see Figure
6 below). Select the “I wish to use this Node ID” radio button and
then click on the [OK] option button.
Note: PanaView gets this Node ID directly from the meter; do not
use a different Node ID for a single-meter setup.
Figure 6: Node ID Confirmation
Figure 7: Confirmation Dialog Box
6
PanaView with MIS/MMS Hygrometers
June 2003
Adding a PanaLinkCompatible Meter (cont.)
7. At the dialog box shown in Figure 7 on the previous page, click on
the [OK] option button to add the meter and configure it. The
dialog box shown in Figure 8 below appears.
Figure 8: The Add Meter Dialog Box
8. In the dialog box above, enter a name for the new meter. The Node
ID and Meter Communication Parameters have been entered
automatically by PanaView. In addition, PanaView populates
certain other fields, such as “Model Name,” “Firmware Version,”
and “PCI Order Number” with data retrieved from the GE
Panametrics instrument. Click on the [OK] option button to
initialize the new meter.
After completing this step, do not make any inputs with either the
mouse or the keyboard until the new meter initialization process is
completed. While the meter is initializing, the information shown
in Figure 9 on the next page is added to the new meter dialog box.
PanaView with MIS/MMS Hygrometers
7
June 2003
Adding a PanaLinkCompatible Meter (cont.)
Figure 9: The Initialization Screen
Note: The “Clock” text box has been filled in with the current date
and time, the meter data (a MIS2 in this example) has been
added, and the active communications status is being
displayed along the bottom of the dialog box.
After the initialization has been completed, PanaView adds the new
meter to the PanaView network tree and automatically closes the
“Add New Meter” dialog box.
8
PanaView with MIS/MMS Hygrometers
June 2003
Programming a Meter
with PanaView
PanaView enables you to remotely change the programming of the
Series 1, 2 and 3 hygrometers. In addition to displaying meter
measurements on your PC, you can vary the modes and display units
on individual pages and channels, and add, change or delete user
equations and user tables. For a complete explanation of PanaView’s
capabilities, see the PanaView User’s Manual.
Changing Measurement
Modes and Units
PanaView enables you to actually change the measurements on the
matrix display. For example, through the PC, you can switch a
window on page 2 from its original programming of measuring
oxygen in parts-per-million on Channel 2 to new programming of
measuring pressure at psig on Channel 3 — or leave the window
entirely blank.
To Open the Meter Display Window:
1. From the “File” menu, click on the “New Meter Browser” option.
2. From the network tree, click on the desired communications port
(COM 1, etc.) and meter.
3. From the expanded tree, click on the “Display” option. A list of
display pages appears. Clicking on any page opens the list of
channels, modes (temperature, hygrometry, oxygen, etc.) and
display units currently assigned for that page.
4. Double-clicking on any page opens the “Meter Display” window
Figure 10 on the next page shows a typical window for a Series 1.
Each individual blue window shows the mode and unit measured
in the corresponding window on the meter page, with the assigned
channel number in the upper left corner. A line below indicates
which page the meter is currently displaying.
5. To scroll to a particular page, click on the left or right pointer
buttons at the bottom of the window.
6. If you want to set a particular page as the page currently displayed
on the meter, scroll to that page and click on [Set Active Page].
Note: While each window shows the sensor and units measured, you
must click on the “Text Display” option from the “Output”
menu, or view the meter screen, to see the actual
measurements at any given time.
PanaView with MIS/MMS Hygrometers
9
June 2003
Changing Measurement
Modes and Units (cont.)
Figure 10: The Meter Display Window for a Series 1 Hygrometer
To change meter programming:
1. To change a particular window, click on it. The selected window
turns red.
2. Click on the meter on the network tree to the left of the
programming window. A list of available channels appears. Click
on the channel you wish to apply.
3. The tree expands to show a list of available sensors.
a. Click on the desired sensor, and the tree expands further to
show a list of available units.
b. Double-click on the unit, and the program reassigns the
selected box in the “Meter Display” window.
c. To unassign a mode and unit without assigning a different
sensor, click on the desired window and then on [Unassign].
10
PanaView with MIS/MMS Hygrometers
June 2003
Changing Measurement
Modes and Units (cont.)
Figure 11 shows a typical change on the PC screen from O2/ppm
(shown in Figure 10) to PSIg.
Figure 11: Matrix Display After Programming
Note: For an explanation of unit abbreviations, see the Startup
Guide or Programming Manual for your specific meter.
4. Click [Apply] to apply the change to the meter immediately and
continue programming, and [OK] to confirm the change and close
the window.
Note: To return the window to its previous settings, click on the
[Cancel] button instead of the [OK] button.
PanaView with MIS/MMS Hygrometers
11
June 2003
Changing a Matrix
Display to a Graph
Note: This option is not available for the MMS3.
To set a graph display of a single mode and unit:
1. Click on the [Graph Display] button. The window changes to list
the graph parameters.
2. Click on the meter icon to show lists of the available modes and
units.
3. Double-click on the desired unit, and enter the parameters for the
graph, as shown in Figure 12 below.
Figure 12: Graph Programming Window
4. Click on [Apply] to change the graph, and on [OK] to confirm the
change and close the window.
5. Click on the [Set Active Page] button to prompt the Series 1
screen to display the graph.
To toggle between the matrix display and the graph, click on the
[Matrix Display] or [Graph Display] buttons. The window returns to
the display indicated.
12
PanaView with MIS/MMS Hygrometers
June 2003
Changing Alarm Settings PanaView enables you to set or change alarm settings for the MIS and
MMS 3 Series hygrometers. You can determine which sensor and
unit serve as the alarm, the trip and deadband values, and the alarm’s
reaction to errors.
1. From the “New Meter Browser” option, pull down the desired
meter, and click on the desired channel.
2. From the channel menu, click on the “Alarms” option, and then on
“Alarm A” or “Alarm B.” The Alarm window appears, as shown in
Figure 13.
Figure 13: Alarm Programming Window
3. To set the alarm sensor and unit
a. Pull down the “Sensor” list box in the lower part of the
window.
b. Then click on the desired sensor type.
c. A list of units appears. Click on the desired unit.
PanaView with MIS/MMS Hygrometers
13
June 2003
Changing Alarm Settings
(cont.)
4. To set the alarm type, click on the [Trip Above] or [Trip Below]
radio buttons, as desired.
5. To determine the alarm values, enter the Trip and Deadband
values in the designated text boxes. (For a definition of the
Deadband value, see the section Setting Up the Alarms in Chapter
3, Advanced Programming, of the Programming Manual.)
6. To determine how the alarm will react when it encounters an error:
a. Pull down the “High” list box under the “On Error” line.
b. Then click on the desired option from the listing: “Ignore
error,” “Trip on error,” “Reset on error,” or “Hold on last
error.”
c. Repeat the procedure for the “Low” list box.
7. To test the alarm, click on the [Test] button. Click on the [Trip]
button to trip the alarm, and on the [Reset] button to reset it.
8. Click on [Apply] to immediately apply the changes, and on [OK]
to confirm the changes and close the window. (To return the
window to its previous settings, click on the [Cancel] button.)
14
PanaView with MIS/MMS Hygrometers
June 2003
Changing Recorder
Settings
You can also change the settings of a recorder attached to the meter:
the input type, zero and span values, and how it performs error
handling.
Setting Recorder Values
1. From the “New Meter Browser” option, click on the desired meter
and channel.
2. From the channel menu, click on the “Recorders” option, and then
on “Recorder A” or “Recorder B.” The Recorder Properties
window appears, as shown in Figure 14 below.
Figure 14: Recorder Programming Window
3. To set the recorder type, pull down the “Type” list box and click
on one of the three choices: 0 to 20 mA, 4 to 20 mA and 0 to 2 V.
4. To set the recorder unit, pull down the “Sensor/Class” list box and
click on the desired sensor. Then pull down the “Unit” list box
and select from the available units.
5. To establish the input settings, enter the desired values in the
“Zero” and “Span” text boxes.
6. Click on [Apply] to apply the changes immediately, and on [OK]
to confirm the changes and close the window.To return the
window to its previous settings, click on the [Cancel] button.
PanaView with MIS/MMS Hygrometers
15
June 2003
Testing Recorder
Outputs
1. To test the recorder outputs, click on the [Test] button shown in
the “Recorder Properties” window (Figure 14). A message
appears: “This will suspend Recorder #[X] on Channel [X]. Are
you sure you want to test this recorder?” Click on [OK] to
continue.
2. The “Test Recorder” window appears, as shown in Figure 15
below. At the top, slide the pointer to the desired percentage of the
full scale recorder range, and click on [OK].
Figure 15: Recorder Test Window
3. To trim the recorder outputs, scroll the arrows to the right of the
“Zero” and “Span” windows up or down until you reach the
desired values, and click on [OK]. The screen returns to the
“Recorder Properties” window.
Note: For a complete discussion of testing and trimming recorder
outputs, refer to the sections Testing the Recorder Outputs and
Trimming Recorder Outputs in Chapter 2 of the Service
Manual.
16
PanaView with MIS/MMS Hygrometers
June 2003
Programming Error
Handling
1. To program the meter for error handling, click on the “Errors”
tab. The screen appears similar to Figure 16 below.
Figure 16: Error Handling in the
Recorder Properties Window
2. Enter the desired values for the low and high error settings in the
appropriate text boxes.
3. To program the meter’s response to errors, pull down the “On Low
Error” list box, and click on one of five options:
•
Ignore error
•
Go to high limit
•
Go to low limit
•
Hold last value
•
Go to error value.
4. Repeat this selection with the “On High Error” list box.
5. Click on [Apply] to apply the changes immediately, and on [OK]
to confirm the changes and close the window. To return the
window to its previous settings, click on the [Cancel] button.
PanaView with MIS/MMS Hygrometers
17
June 2003
Programming User
Functions
As explained in Entering Constants and User Functions in the
Programming Manual for your meter, user functions enable operators
to program up to four desired equations on each channel, or to use any
measured parameter to calculate a different parameter. PanaView
allows users to program or change user functions and related tables
through the PC.
To program a user function:
1. From the “New Meter Browser” option, click on the desired
communications port, meter, and channel.
2. Click on “User Functions,” and then double-click on the desired
function (1 to 4). The right side of the screen appears similar to
Figure 17 below.
Figure 17: The User Function Window
3. Enter three parameters:
•
a function label (of no more than 16 characters)
•
a function symbol (no more than 4 characters), and
•
the number of decimal places desired.
4. To incorporate an existing parameter, pull down the network
menu and click on the desired channel, sensor and display unit.
18
PanaView with MIS/MMS Hygrometers
June 2003
Programming User
Functions (cont.)
5. To select the desired operation or table, click on the appropriate
button. (See Entering User Tables on the next page for
information on entering data for user tables.) Use the cursor in the
equation box to position values correctly, or to erase incorrect
values or operations.
6. When you have completed entering the function, click on [Apply]
to apply the function immediately, and on [OK] to confirm the
function and close the window. To return the window to its
previous settings, click on the [Cancel] button.
Note: It may be advisable to use the [Apply] button as a means of
checking the function’s validity. If the function is improperly
typed, or if a sensor is under range or not programmed, the
Equation line displays “Invalid” with a brief message.
PanaView with MIS/MMS Hygrometers
19
June 2003
Entering User Tables
To support user functions, the MIS/MMS hygrometers can hold up to
five tables (designated as A through E) of non-linear or empirical
data. Users can enter up to 16 X-Y pairs in each table. A user function
can supply an X value with Tbl(). The meter then interpolates the Y
value for a given X, and substitutes it for Tbl (X) in the function. (See
the section Entering User-Defined Tables in your meter’s
Programming Manual.)
To enter values for a user table:
1. From the “New Meter Browser” option, click on the desired
communications port and meter.
2. Click on “User Tables,” and then double-click on the desired
table.The right side of the screen appears similar to Figure 18
below.
Figure 18: User Table Window
3. Enter a name (up to 13 characters) for the table in the “Table
Name” text box, and enter up to 16 X and Y values in the
appropriate columns.The table now appears similar to Figure 19
below.
Figure 19: Completed User Table
4. When you have finished entering values, click on [Apply] to apply
the table immediately, and on [OK] to confirm the table and close
the window. To return the window to its previous settings, click on
the [Cancel] button.
20
PanaView with MIS/MMS Hygrometers
June 2003
Entering Saturation
Constants
To enter a saturation constant, you must enter 1 to 6 data points to
represent a curve of Cs (saturation constant) versus temperature. (For
more information, see Entering Saturation Constants in the
Programming Manual for your meter.) PanaView enables you to
enter a saturation constant curve for each channel. To enter a curve:
1. From the “New Meter Browser” option, click on the desired
communications port, meter, and channel.
2. From the “Edit” menu, select the “Properties” option.
3. The “Constant Saturation Table” window appears, as shown in
Figure 20 below.
Figure 20: Constant Saturation Window
4. Enter up to six data points in the text boxes to establish a curve of
saturation constants versus temperature.
5. The window also allows you to specify whether you wish
Enhanced Response for the channel. Enhanced Response uses a
dynamic moisture calibration technique to extrapolate the
moisture level to the end point when making measurements in
abrupt “dry down” conditions. (For more information, refer to
Using Computer Enhanced Response in the Programming
Manual.) Click the appropriate radio button to turn Enhanced
Response on or off.
6. When you have finished entering values, click on [Apply] to apply
the table immediately, and on [OK] to confirm the table and close
the window. To return the window to its previous settings, click on
the [Cancel] button.
PanaView with MIS/MMS Hygrometers
21
June 2003
Checking the Battery
and Backlight
If your Series 2 or 3 meter has the battery option, you can use
PanaView to check on the battery status and backlight settings. To
check on the battery from PanaView:
1. From the “New Meter Browser” option, click on the desired
communications port and meter.
2. From the network tree, double-click on “Battery/Backlight.” The
“Battery/Backlight Status” window appears, as shown in Figure
21 below.
Figure 21: Battery/Backlight Status
3. The window shows the presence (or absence) of a battery, along
with its power source, voltage, charge time and remaining time to
run. To recharge the battery, click on [Full Charge].
4. The window also shows if the backlight is on and how long the
backlight timeout is. Use the numeric keys to enter a backlight
interval in minutes from 0 to 960 (16 hours) in the text box. If you
enter 0 (zero) the backlight will turn off.
Click on [Apply] to apply the settings immediately, and on [OK] to
confirm the settings and close the window. To return the window to
its previous settings, click on the [Cancel] button.
22
PanaView with MIS/MMS Hygrometers
June 2003
Translating Analyzer
Software into Other
Languages
PanaView can be used to customize a MIS or MMS 3 analyzer for a
number of different languages.
1. Open the “New Meter Browser” from the “File” menu.
2. Fully expand the network tree and highlight the chosen meter.
3. With the desired meter highlighted, open the “Edit” menu as
shown in Figure 22 below.
Figure 22: The Edit Menu.
4. From the “Edit” menu shown above, click on the “Properties”
option. The dialog box shown in Figure 23 below appears.
Figure 23: Meter Settings
5. Click on the [Translation] option button shown in Figure 23
above. The dialog box shown in Figure 24 on the next page
appears.
PanaView with MIS/MMS Hygrometers
23
June 2003
Translating Analyzer
Software into Other
Languages (cont.)
Figure 24: The Edit Translation Dialog Box
•
To edit the text that appears in the various analyzer dialog boxes,
select the String Tables radio button in Figure 24 above and click
on the [OK] option button. The dialog box shown in Figure 25
below appears.
Note: The String Table Translation dialog box is navigated using
conventional Windows techniques.
Figure 25: String Table Translation
24
PanaView with MIS/MMS Hygrometers
June 2003
Translating Analyzer
Software into Other
Languages (cont.)
•
To edit the text that appears in the meter’s Online Help files, select
the Help Files radio button in Figure 24 on the previous page and
click on the [OK] option button. The dialog box shown in Figure 26
below appears.
Note: The Help File Translation dialog box is navigated using
conventional Windows techniques.
Figure 26: Help File Translation
When all of the desired changes have been made to the meter settings,
click on the [OK] option button to accept the changes or click on the
[Cancel] option button to abort the operation and keep the original
settings.
PanaView with MIS/MMS Hygrometers
25
June 2003
Index
A
P
Alarm Settings . . . . . . . . . . . . . . . . . . . . . . . . . 13
PanaLink protocol. . . . . . . . . . . . . . . . . . . . . . . 1
PanaView
Applications of . . . . . . . . . . . . . . . . . . . . . . . 1
Capabilities of . . . . . . . . . . . . . . . . . . . . . . . . 9
Changing Measurement Modes . . . . . . . . . . 9
Establishing Communications with . . . . . . . 2
Graph Display in . . . . . . . . . . . . . . . . . . . . . 12
Matrix Display in . . . . . . . . . . . . . . . . . . . . 12
User Functions in . . . . . . . . . . . . . . . . . . . . 18
Programming Meter Parameters . . . . . . . . . . . . 9
Programming User Functions . . . . . . . . . . . . . 18
B
Backlight
Checking in PanaView . . . . . . . . . . . . . . . . . 22
Battery
Checking in PanaView . . . . . . . . . . . . . . . . . 22
C
Changing Matrix to Graph Display . . . . . . . . . 12
Changing Recorder Settings. . . . . . . . . . . . . . . 15
Clock . . . . . . . . . . . . . . . . . . . . . . . . . . . . . . . . .8
Communications Port, Setting Up . . . . . . . . . . .2
E
Edit Menu. . . . . . . . . . . . . . . . . . . . . . . . . . . .2, 4
Enhanced Response . . . . . . . . . . . . . . . . . . . . . 21
Error Handling . . . . . . . . . . . . . . . . . . . . . . . . . 17
H
R
Recorder Outputs
Testing. . . . . . . . . . . . . . . . . . . . . . . . . . . . . 16
Trimming. . . . . . . . . . . . . . . . . . . . . . . . . . . 16
Recorder Settings . . . . . . . . . . . . . . . . . . . . . . 15
RS232 interface, wiring . . . . . . . . . . . . . . . . . . 1
S
Hygrometers, compatible . . . . . . . . . . . . . . . . . .1
Saturation Constants . . . . . . . . . . . . . . . . . . . . 21
Setup Communications screen . . . . . . . . . . . . . 3
M
T
Measurement Modes
in PanaView . . . . . . . . . . . . . . . . . . . . . . . . . .9
Measurement Units
in PanaView . . . . . . . . . . . . . . . . . . . . . . . . . .9
Menus, Edit . . . . . . . . . . . . . . . . . . . . . . . . . . . .2
Meter
Node ID . . . . . . . . . . . . . . . . . . . . . . . . . . . . .4
Meter, Adding a . . . . . . . . . . . . . . . . . . . . . . . . .4
MIS Series 1 and 2 . . . . . . . . . . . . . . . . . . . . . . .1
MMS Series 3. . . . . . . . . . . . . . . . . . . . . . . . . . .1
Testing Recorder Outputs . . . . . . . . . . . . . . . . 16
Time . . . . . . . . . . . . . . . . . . . . . . . . . . . . . . . . . 8
Translating Software . . . . . . . . . . . . . . . . . . . . 23
Trimming Recorder Outputs . . . . . . . . . . . . . . 16
U
User Functions . . . . . . . . . . . . . . . . . . . . . . . . 18
User Functions, Programming . . . . . . . . . . . . 18
User-Defined Tables,Entering. . . . . . . . . . . . . 20
N
Node ID . . . . . . . . . . . . . . . . . . . . . . . . . . .4, 5, 6
O
Operating Systems, compatible . . . . . . . . . . . . .1
Index
27
WORLDWIDE
OFFICES
MAIN OFFICES:
GE PANAMETRICS INTERNATIONAL OFFICES:
USA
GE Panametrics
221 Crescent St., Suite 1
Waltham, MA 02453-3497
USA
Telephone: 781-899-2719
Toll-Free: 800-833-9438
Fax: 781-894-8582
E-mail: [email protected]
Web: www.gepower.com/panametrics
ISO 9001 Certified
Australia
P.O. Box 234
Gymea N.S.W. 2227
Australia
Telephone 61 (02) 9525 4055
Fax 61 (02) 9526 2776
E-mail [email protected]
Japan
2F, Sumitomo Bldg.
5-41-10, Koishikawa, Bunkyo-Ku
Tokyo 112-0002
Japan
Telephone 81 (03) 5802-8701
Fax 81 (03) 5802-8706
E-mail [email protected]
Austria
Waldgasse 39
A-1100 Wien
Austria
Telephone +43-1-602 25 34
Fax +43-1-602 25 34 11
E-mail [email protected]
Korea
Kwanghee Bldg., 201, 644-2
Ilwon-dong, Kangnam-Ku
Seoul 135-945
Korea
Telephone 82-2-445-9512
Fax 82-2-445-9540
E-mail [email protected]
Benelux
Postbus 111
3870 CC Hoevelaken
The Netherlands
Telephone +31 (0) 33 253 64 44
Fax +31 (0) 33 253 72 69
E-mail [email protected]
Spain
Diamante 42
28224 Pozuelo de Alarcon
Madrid
Spain
Telephone 34 (91) 351.82.60
Fax 34 (91) 351.13.70
E-mail [email protected]
France
BP 106
11 Rue du Renard
92253 La Garenne Colombes Cedex
France
Telephone 33 (0) 1 47-82-42-81
Fax 33 (0) 1 47-86-74-90
E-mail [email protected]
Sweden
Box 160
S147 23 Tumba
Sweden
Telephone +46-(0)8-530 685 00
Fax +46-(0)8-530 357 57
E-mail [email protected]
Germany
Mess-und Pruftechnik
Robert-Bosch-Straße 20a
65719 Hofheim
Germany
Telephone +49-6122-8090
Fax +49-6122-8147
E-mail [email protected]
Taiwan
7th Fl 52, Sec 3 Nan-Kang Road
Taipei, Taiwan
ROC
Telephone 02-2788-3656
Fax 02-2782-7369
E-mail [email protected]
Italy
Via Feltre, 19/A
20132 Milano
Italy
Telephone 02-2642131
Fax 02-26414454
E-mail [email protected]
United Kingdom
Unit 2, Villiers Court
40 Upper Mulgrave Road
Cheam
Surrey SM2 7AJ
England
Telephone 020-8643-5150
Fax 020-8643-4225
E-mail [email protected]
Ireland
GE Panametrics
Shannon Industrial Estate
Shannon, Co. Clare
Ireland
Telephone 353-61-470200
Fax 353-61-471359
E-mail [email protected]
ISO 9002 Certified
January 2003
USA
GE Panametrics
221 Crescent Street, Suite 1
Waltham, MA 02453-3497
Telephone: (781) 899-2719
Toll-free: (800) 833-9438
Fax: (781) 894-8582
E-Mail: [email protected]
Web: www.gepower.com/panametrics
Ireland
GE Panametrics
Shannon Industrial Estate
Shannon, County Clare
Ireland
Telephone: 353-61-470200
Fax: 353-61-471359
E-Mail: [email protected]