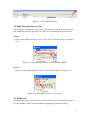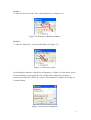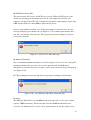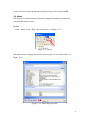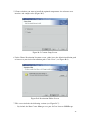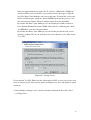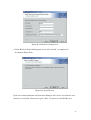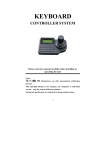
1
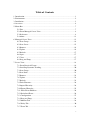
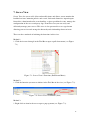
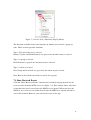
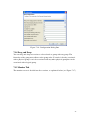
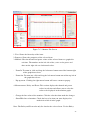
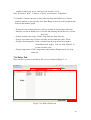
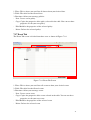
NMView
User’s Manual
Revision 1.1
SUPER MICRO COMPUTER INC.
Table of Contents
1. Introduction................................................................................................................1
2. Environment...............................................................................................................2
3. Installation..................................................................................................................3
4. Overview....................................................................................................................4
5. Menu Bar ...................................................................................................................7
5.1 Exit...................................................................................................................7
5.2 Show Managed Server View............................................................................8
5.3 Preference ........................................................................................................8
5.4 About.............................................................................................................. 11
6. Managed Server View..............................................................................................13
6.1 New Group.....................................................................................................14
6.2 New Server.....................................................................................................15
6.3 Remove ..........................................................................................................16
6.4 Update ............................................................................................................16
6.5 Refresh ...........................................................................................................17
6.6 Open...............................................................................................................17
6.7 Close ..............................................................................................................17
6.8 Drag and Drop................................................................................................17
7. Server View..............................................................................................................18
7.1 Show Received Events...................................................................................19
7.2 Start/Stop Dynamic Trending.........................................................................20
7.3 New Group.....................................................................................................20
7.4 New Node ......................................................................................................21
7.5 Remove ..........................................................................................................23
7.6 Update ............................................................................................................23
7.7 Refresh ...........................................................................................................23
7.8 Flash Firmware ..............................................................................................24
7.9 Import Hierarchy............................................................................................24
7.10 Export Hierarchy..........................................................................................25
7.11 Show Event Handlers...................................................................................26
7.12 Predefined Event..........................................................................................26
7.13 Configuration ...............................................................................................27
7.14 Drag and Drop..............................................................................................28
7.15 Monitor Tab..................................................................................................28
7.16 Policy Tab ....................................................................................................30
7.17 Event Tab .....................................................................................................31
i
7.18 Log Tab ........................................................................................................32
Appendix A. Other Techniques....................................................................................33
Appendix B. Installing a DCM Server.........................................................................34
ii
1. Introduction
NMView is an application program used to monitor computers. It can help computer
managers monitor the health of computers in real time and immediately tune it when
problems arise. Monitored items include power, temperatures, policies and events.
DCM servers communicate directly with all servers in a company and access their
databases. DCM servers obtain the power and thermal values from the servers and
then save the values to a database. A manager can use NMView to see the power and
thermal received by the DCM server, which queries all values from the database and
then updates them to the NMView. The database also saves policies, events and logs.
We can say that the DCM server is a broker for the NMView; it does everything for
the NMView including planning policies, handling events, flashing node firmware
and so on.
…
…
…
…
…
…
…
…
Figure 1-1 NMView Architecture
1
2. Environment
Before running NMView for the first time, you must install Java JRE 1.6.0 or above.
You can get it from the java website http://java.sun.com – refer to the installation
instructions to install it to your computer.
2
3. Installation
NMView supports both Windows and Linux platforms. It can be easily installed by
following a simple process.
Windows:
Double click the NMView execution file and follow the installation procedure step by
step. The DCM server is an optional item to install.
Linux:
Get the binary file of NMView, decompress it to the desired directory then finish the
setup. If you want to install the DCM server, you can find it in the DCM folder under
NMView folder. Refer to the INSTALL_LINUX.htm to install it.
3
4. Overview
Figure 4-1 shows an NMView screen with the Menu Bar, Tool Bar, Managed Server
View and Server View highlighted for illustration purposes. The Menu Bar includes
helpful functions for convenient access. The Tool Bar has a small icon to quick-start
commonly used functions. In the Managed Server View you can add, delete and
modify servers and groups. You can also refresh view and open the server view. In
Server View you can add, delete, modify and refresh nodes and groups. You can also
refresh view, flash firmware to a node over LAN, import/export hierarchies,
show/unsubscribe event handlers, register predefined events, change the DCM
configuration, and manage the policies and events of nodes and query logs. The
thermal and power status of nodes are displayed for monitoring purposes. You can
choice dynamic monitor or static view, change the refresh frequency and switch
between Celsius and Fahrenheit.
Menu Bar
Tool Bar
Server view
Managed
Server
View
Figure 4-1: NMView Main Window
We have divided this main view into four chapters to explain in more detail.
Menu Bar Commands:
File:
Exit: Closes the application.
View:
Shows Managed Server View: Opens Managed Server View.
4
Tool:
Preference: Maintains preference.
Help:
About: Shows support information about the computer, allows a user to
query the system properties and run-time properties.
Tool Bar:
Shows Managed Server View: Opens a Managed Server View.
Preference: Maintains preferences.
Exit: Closes the application.
Managed Server View:
New Group: Creates a group that can include servers, premise that the type of
selected item is group on the tree.
New Server: Creates a server that would be monitored, premise that the type of
selected item is group on the tree.
Remove: Deletes the selected item on the tree.
Update: Modifies the properties of the selected item on the tree.
Refresh: Redraws the screen to update the items on the tree.
Open: Opens the server view of the selected server.
Close: Closes the server view of the selected server.
Drag and Drop: Moves a server to one group.
Server View:
Show Received Events: Informs user of received events. Click it to show events.
Start/Stop Dynamic Trending: Starts or stops the dynamic health monitoring of
the server.
New Group: Creates a group that can include nodes, premise that the type of
selected item is group on the tree.
New Node: Creates a node that would be monitored, premise that the type of
selected item is group on the tree.
Remove: Deletes selected items on the tree.
Update: Modifies the properties of the selected item on the tree.
Refresh: Redraws the screen to update all entries in the tree.
Flash Firmware: Flashes the firmware of the node.
Import Hierarchy: Imports the tree hierarchy from an xml file.
Export Hierarchy: Exports the tree hierarchy as an xml file
Show Event Handlers: Shows how many event handlers are registered to the
5
server and subscribe event handlers that aren’t necessary.
Predefined Event: Registers the predefined events that will be received.
Configuration: Controls the global properties of the server.
Drag and Drop: Copies the selected node to another group.
Monitor Tab: Monitors the thermal and power status of an item and manages its
properties, policies and events.
Policy Tab: Manages the policies of the node.
Event Tab: Manages the events of the node.
Log Tab: Queries the logs of the node.
6
5. Menu Bar
The menu bar provides small icons to quick trigger specific functions. The functions
include closing windows, opening views, editing preferences to your liking and
checking environmental and memory variables.
5.1 Exit
You can close the NMView main window at any time. There are three methods of
closing the application:
Method 1:
1. Click “Exit” in the “File” pull-down menu (see Figure 5-1).
Figure 5-1: Close Main Window (Pull-Down Menu)
Method 2:
1. Click the “Exit Workbench” icon in the Tool Bar (see Figure 5-2).
Figure 5-2: Close Main Window (Icon)
Method 3:
1. Click the red X in the top-right corner of the application (see Figure 5-3).
7
`
Figure 5-3: Close Main Window
5.2 Show Managed Server View
After you close the managed server view, you can show it again. This function lets
you arbitrarily close and open the view. There are two methods to open the view:
Method 1:
1. Click “Show Managed Server View” in the “View” pull-down menu (see Figure
5-4).
Figure 5-4: Show Managed Server View (Pull-Down Menu)
Method 2:
1. Click the “Show Managed Server View” icon in the Tool Bar (see Figure 5-5).
Figure 5-5: Show Managed Server View (Icon)
5.3 Preference
You can change any variables that are used for system processing and tailor them to
fit your computer. There are two methods of opening the preference dialog:
8
Method 1:
1. Click “Preference” in the “Tool” pull-down menu (see Figure 5-6).
Figure 5-6: Preference (Pull-Down Menu)
Method 2:
1. Click the “Preference” icon in the Tool Bar (see Figure 5-7).
Figure 5-7: Preference (Icon)
By clicking this function, a dialog box will pop up (see Figure 5-8) that allows you to
view and modify system parameters. Be careful when setting these parameters,
because they affect the validity of a system. Each parameter’s purpose and usage are
described below.
Figure 5-8: Preference Dialog Box
9
DCM Event Listen Port:
The port selected will “listen” for DCM server events. When a DCM server event
occurs, the listening port will notify you of it. If your computer has 65536 port
numbers, its range is 0~65535. We recommend you choose a port number greater than
1000, because those less than 1000 are often already in use.
Choose a port number and then set it. If the port number is already in use, an error
message will pop up to caution you (see Figure 5-9). Try another port number until
you don’t receive this error message. Then open the preference dialog box again to
verify your selection.
Figure 5-9: “Port in Use” Error Message
Memory Threshold:
Since a minimum amount of memory is needed to open a server view, this setting will
determine whether the view of a server can be opened or not. If the Memory
Threshold is exceeded and you try to open a server view, an error message will pop up
(see Figure 5-10).
PS. This technique can prevent (but does not guarantee) running out of memory.
Figure 5-10: “Over Memory Threshold” Error Message
Example:
The Memory Threshold is set to 64MB and the user opens five server views, which
requires 70MB of memory. This means that since the 64MB threshold has been
exceeded, no additional server views can be opened unless an already opened server
10
view is closed to reduce the amount of memory being used to below 64MB.
5.4 About
This provides useful information about the computer including environmental
variables and memory status.
Method:
1. Click “About” in the “Help” pull-down menu (see Figure 5-11).
Figure 5-11: About
This information is roughly divided into two categories as described below (see
Figure 5-12).
Figure 5-12: About Properties Box
11
System Properties:
These include the environmental variables of both the computer and applications.
Computer environmental variables of used in system processing. When an application
is running, the environmental variables of both may be used any time. Environmental
variables are very important, because the valid operation of the system and the
application both depend on them.
Run Time Properties:
This shows the memory status in real-time and includes three types of memory:
Free Memory: The number of bytes available for the application.
Max Memory: The number of total bytes allocated to the application.
Total Memory: The maximum number of bytes that can be allocated to the
application.
12
6. Managed Server View
The Managed Server View lets you add, delete and modify groups and servers as well
as open a server’s node view. This allows you to manage all servers that have installed
a DCM server. A tree type layout is provided so that the user can view and arrange the
hierarchy and relationships between the servers.
There are three methods of using the Managed Server View functions:
Method 1:
1. Click the inverted triangle in the Tool Bar to open the pull-down menu (see Figure
6-1).
Figure 6-1: Managed Server View’s Functions (Pull-Down Menu)
Method 2:
1. Click directly on the function you want to initiate in the Tool Bar (see Figure 6-2).
Figure 6-2: Managed Server View’s Functions (Icon)
Method 3:
13
1. Click a group or server in the tree then right click on it to open the pop-up menu
(see Figure 6-3).
Figure 6-3: Managed Server View’s Functions (Pop-Up Menu)
The functions shown may be different depending on whether you selected a group or
a server as follows:
Type 1: The root of the tree is selected.
New Group, New Server and Refresh can be selected, the others are grayed out.
Type 2: A group is selected.
Open is grayed out. The others may be selected.
Type 3: A server is selected.
New Group and New Server are grayed out. The others may be selected.
Note: Server is by default the root of the tree, and is also a group.
6.1 New Group
A group is logical. You can include many servers and even other groups within a
group. You can create new groups to divide servers by category and by the group
level.
Step:
1. Click the “New Group” function and a dialog box appears.
2. Type in the group name. If the group name already exists, an error message will
pop up (see Figure 6-4).
14
Figure 6-4: “Name Already Existed” Error Message
3. If the name you typed does not yet exist, the group will be added to tree.
6.2 New Server
Server have installed DCM server in it. You can add them to group in the tree.
Step:
1. Click “New Server” and a pop up dialog box appears.
2. Input the properties of the server. The description is an optional field. For Type,
only DCM can be selected. For Server Name, type in the name you wish. For IP
Address, type in the IP address of the server. The Port number will be the same port
number that was specified when installing the DCM server (the default is 8688).
Continue to add the desired values for all other optional fields. When finished, click
the “OK” button to create the new server or click the “Cancel” button to revoke it
(see Figure 6-5).
Figure 6-5: New Server Dialog Box
15
2. If the mandatory field is empty, an error message will pop up (see Figure 6-6).
Likewise, if the server name you typed already exists, an error message will pop up
(see Figure 6-7).
Figure 6-6: “Empty Field” Error Message
Figure 6-7: “Pre-existing Server Name” Error message
3. If the all fields include correct information, the server will be added to the tree.
Note: You can’t include servers with the same name in one group, but you may have
servers with the same name if they reside in different groups.
6.3 Remove
Clicking the “Remove” function will delete the selected item, which may be a group
or a server. A dialog box will pop up for you to confirm (see Figure 6-8). If you want
to delete it then click the “OK” button, otherwise click the “Cancel” button.
Figure 6-8: Remove Dialog Box
6.4 Update
16
Click the “Update” function to update the item selected, which may be a group or a
server. Input a new value in the relevant fields then click the “OK” button to modify
the value or the “Cancel” button to abort the action.
6.5 Refresh
Click the “Refresh” function to redraw the items in the tree. This is done to ensure
that the content of the tree is up to date.
6.6 Open
Used to open the server view of the selected server in order to monitor and manage
the server.
There are two methods of triggering this function:
Method 1:
1. Click the “Open” function to open the server view of the selected server.
Method 2:
1. Double click on a server to open it.
6.7 Close
Used to close the server view of the selected server in order to monitor and manage
the server. Click the “Close” function to close the server view of the selected server.
6.8 Drag and Drop
You can drag and drop to move a selected server to any other group. A server can be
moved to another group at any time. If you try to move a server into a group that has a
server with the same name, an error message will pop up (see Figure 6-9).
Figure 6-9: “Existing Server Name” Error Message
17
7. Server View
Server View lets you to add, delete and modify items and allows you to monitor the
health of an item, maintain policies and events, flash node firmware, import/export
hierarchies, show/unsubscribe event handlers, register predefined events, manage the
configuration of the server and query logs. From this view you can easily and
efficiently manage your servers. This view is also presented in a tree type format
allowing you to view and arrange the hierarchy and relationships between items.
There are three methods of initiating the functions in this view:
Method 1:
1. Click the inverted triangle in the Tool Bar to open a pull-down menu (see Figure
7-1).
Figure 7-1: Server View’s Functions (Pull-Down Menu)
Method 2:
1. Click the function you want to initiate in the Tool Bar of the view (see Figure 7-2).
Figure 7-2: Server View’s Functions (Icon)
Method 3:
1. Right click an item in the tree to open a pop-up menu (see Figure 7-3).
18
Figure 7-3: Server View’s Functions (Pop-Up Menu)
The functions available in the menu depends on whether you selected a group or a
node. There are three possible situations:
Type 1: The root of the tree is selected.
Remove, Update and Flash Firmware are grayed out, the others may be selected.
Type 2: A group is selected.
Flash Firmware is grayed out, the others may be selected.
Type 3: A node is selected.
New Group and New Node are grayed out, the others may be selected.
Note: Root is the default root of the tree and is also a group.
7.1 Show Received Events
Click the “Show Received Events” function and a window will pop up that lists all
received events from the DCM server (see Figure 7-4). This window shows only those
events that have been received since the NMView was opened. When you close the
NMView, any events received until the next time the NMView is opened will not be
seen in this window. However, you can find all events in the logs.
19
Figure 7-4: Received Events
If the Received Events icon is glittered, it means there are new received events. The
server view image will also glitter to inform you which server view received the
events. When you view the received events, the glittering will stop.
7.2 Start/Stop Dynamic Trending
Click on “Start/Stop Dynamic Trending” to start or stop monitoring an item. Starting
will initiate the monitoring of thermal and power status in real-time. Stopping will
suspend the monitoring.
7.3 New Group
There are five group sub-categories as shown below, arranged in order from smallest
to largest. That is, Rack is the smallest and Logical Group is the largest. When you
add a new group, you must adhere to this order. That is, it may be added to a group
that is smaller than it but not to a group that is greater than it.
Rack < Row < Room < Datacenter < Logical Group
Example:
If the new group is a Room type, it may be specified as a Room, Rack or Row but not
as a Datacenter or Logical Group.
Each group is either a physical group or a logical group:
Physical group: Rack, Row, Room and Datacenter.
20
Logical group: Logical group.
Step:
1. Click “New Group” and a dialog box will pop up (see Figure 7-5).
Figure 7-5: New Group Dialog Box
2. Group Type and Name are mandatory fields. Select the correct type in the “Group
Type” field and add the correct values into the rest of the fields. If you added an
incorrect value, an error message will pop up as shown in Figure 7-6.
Figure 7-6: New Group Incorrect Input Error Message
3. If all fields are valid, the group will be added to the tree.
7.4 New Node
A Node is a physical entity with an IP address that allows a server to connect to and
communicate with it. A node can be included in any number of logical groups but in
only one physical group at a time.
21
Example:
To include a node in both a rack and a row group, associate the node with the rack
group and then associate the rack with the desired row.
Step:
1. Click “New Node” and a dialog box will pop up (see Figure 7-7).
2. Input the properties of the node. Name, BMC Address and Derated Power are
mandatory fields. For BMC Address, use the IP address of the node’s location.
Continue to add valid values to the rest of the fields. When finished, click the “OK”
button to create the new node or the “Cancel” button to revoke.
Figure 7-7: New Node Dialog Box
3. If you add an incorrect value to a field, an error message will pop up (see Figure
7-8). Also, if the node that you wish to add does not exist as a physical entity, an
error message will pop up (Figure 7-9). If you want override this, check “Yes” in the
Force Addition field.
22
Figure 7-8: “IP Existed” Error Message
Figure 7-9: “Node Not Reachable” Error message
3. If all the fields are valid, the node will be added to the tree.
7.5 Remove
Clicking the “Remove” function will delete the selected item, whether it is a group or
node. A confirmation window will pop up to verify the intended action (see Figure
7-10). If you want to delete it then click the “OK” button, otherwise click the
“Cancel” button.
Figure 7-10: “Remove item(s)” Confirmation
7.6 Update
Clicking “Update” will update the selected item, whether it is a group or a node. Input
valid values into the fields then click the “OK” button to modify the value or the
“Cancel” button to abort.
7.7 Refresh
Clicking “Refresh” will redraw the items in the tree. Do this to ensure that the content
23
of the items in the tree is up to date.
7.8 Flash Firmware
Click this function to flash the firmware of the node.
Step:
1. Click “Flash Firmware” and a dialog box will pop up (see Figure 7-11).
Figure 7-11: Flash Firmware Dialog Box
2. Type in the IP address of the node whose firmware you want to flash, and type in
the user name and password.
3. Click the “Select” button to select the firmware file from file system. If the selected
firmware file is valid, “File version” will show the file’s version and “Firmware
version” will show the version of the firmware of the node current and the “Flash”
button will be enabled.
4. Click the “Flash” button to start flashing the firmware to the node.
5. If the firmware fails to flash it will auto retry three times. If the flash is successful,
a “Done” message will pop up. If unsuccessful after the three attempts, you can
either retry or abort.
7.9 Import Hierarchy
Click this function to import hierarchy from a hierarchy file.
Step:
1. Click “Import Hierarchy” and a dialog box will pop up (see Figure 7-12).
24
Figure 7-12: Import Hierarchy Dialog Box
2. Select a firmware file then click “Open” to import the hierarchy.
7.10 Export Hierarchy
Click this function to export the hierarchy as an xml file.
Step:
1. Click “Export Hierarchy” and a dialog box will pop up (see Figure 7-13).
Figure 7-13: Export Hierarchy Dialog Box
25
2. Choose a location and give a name then click “Save” to export the hierarchy.
7.11 Show Event Handlers
Click this function to show and unsubscribe the event handlers.
Step:
1. Click “Show Event Handlers” and a dialog box will pop up (see Figure 7-14).
Figure 7-14: Show Event Handlers Dialog Box
2. If you want to unregister an event handler, select it and click “Unsubscribe” to
remove it.
7.12 Predefined Event
Predefined events are events that have been defined as such in the DCM server. Click
“Predefined Event” and a window will pop up (see Figure 7-15). Here, you can
choose which events will be received from the DCM server. Check the events that you
want to be received, then click the “OK” button, otherwise click the “Cancel” button
to abort.
26
Figure 7-15: Predefined Event Dialog Box
7.13 Configuration
This screen lets you set the parameters for the DCM server (see Figure 7-16).
27
Figure 7-16: Configuration Dialog Box
7.14 Drag and Drop
You can drag and drop to associate a selected node or group with any group. The
hierarchy of the group must adhere to the group order. If a node is already associated
with a physical group it can’t be associated with any other physical group but can be
associated with a logical group.
7.15 Monitor Tab
The monitor screen is divided into five sections, as explained below (see Figure 7-17).
28
Controller
Monitor
Tree
Measurements, Policy and Event
Property
Figure 7-17: Monitor Tab Screen
1. Tree: Shows the hierarchy of the items.
2. Property: Shows the properties of the selected item.
3. Monitor: Here the thermal and power values of the selected items are graphed in
real time. The numbers on the left side of the y axis are for power and
those on the right side are for thermal values.
Zoom In: To zoom in, click and drag the left mouse button toward the bottom-right
of the graph then release.
Zoom Out: To zoom out, click and drag the left mouse button toward the top-left of
the graph then release.
Pop up menu: Clicking the right mouse button will cause a menu to pop up.
4. Measurements, Policy and Event: This section displays the thermal and power
values in real time and allows you to select the
colors to be displayed in the monitor graph.
Change the line colors of the monitor: Click the color box then make the changes.
Show/Hide lines of monitor: Check the box of an item you want displayed or
uncheck it to hide it in the graph.
Note: The Policy and Event tabs only list data for the selected item. Use the Policy
29
and Event tabs in the server view to list all data for a server.
Note: W denotes “Walt”, C denotes “Celsius” and F denotes “Fahrenheit”.
5. Controller: Controls the state of data collection from the DCM server. Choose
dynamic monitor or query history data. Time Range is used to set the length of time
shown in the monitor graph.
Change the state of data collection: Click to resume or suspend data collection.
Show the version of DCM server: Click the link showing the DCM server version
for details.
Change dynamic time range: Click a range from the drop down list.
Change static time range: Choose start time and end time then click “Trend”.
Change refresh frequency: Click a second from the drop down list or input a
second then click “Apply”. You can click “Reload” to
get the real time value.
Change temperature: Click a temperature unit from the Temperature Units drop
down list.
7.16 Policy Tab
There are three sections in the Policy Tab screen as shown in Figure 7-18.
Filter
Table
Functions
Figure 7-18: Policy Tab Screen
30
1. Filter: This is where you can filter all data to show your desired data.
2. Table: The table lists the filtered data.
3. Functions: Allow you to mange policies.
New: Creates a new policy.
Copy: Copies the properties of the policy selected in the table. You can use those
properties to edit your new policy.
Edit: Modifies the properties of the selected policy.
Delete: Deletes the selected policy.
7.17 Event Tab
The Event Tab screen is divided into three areas as shown in Figure 7-19.
Filter
Table
Functions
Figure 7-19: Event Tab Screen
1. Filter: This is where you can filters all events to show your desired events.
2. Table: The table lists the filtered events.
3. Functions: Allow you to mange events.
New: Creates a new event.
Copy: Copies the properties of the event selected in the table. You can use these
properties to edit your new event.
Edit: Modifies the properties of the selected event.
Delete: Deletes the selected event.
31
7.18 Log Tab
The Log Tab screen is divided into four sections as shown in Figure 7-20.
Filter
Function
Table
Message
Figure 7-20 Log Tab Screen
1. Filter: Use these filters to show the desired logs.
2. Function: Saves the log data to a file.
3. Table: The table lists the logs that have passed the filter requirements.
4. Message: This number shows the total number of logs in the table.
32
Appendix A. Other Techniques
1. Table Sorting
This technique may be used with all NMView tables. The column heading with a
triangle may be sorted according to the orientation of the triangle (see Figure A-1):
Type 1: Inverted Triangle
This indicates the table is sorted by increasing values.
Type 2: Upright Triangle
This indicates the table is sorted by decreasing values.
Figure A-1: Table Sorting
You can re-click on the same field to change the order of sorting the data (whether
increasing or decreasing), or click on another field to sort it.
33
Appendix B. Installing a DCM Server
1. In the Choose Components screen of the NMView installer, check the DCM server
item to install it (see Figure B-1).
Figure B-1: Choose Components Screen
2. After clicking “Install” the program will begin installing the DCM server. In the
Welcome screen, click “Next” (see Figure B-2).
Figure B-2: Welcome Screen
34
3. In the Data Center Manager License Agreement screen, read the license agreement,
then select “I accept the terms in the license agreement” and click “Next” (Figure
B-3).
Figure B-3: License Screen
4. In the Customer Information screen, fill out your “User Name” and “Organization”.
Select whether you want to install the Data Center Manager only for you or for
everyone who uses the computer (Figure B-4).
Figure B-4: Customer Information Screen
35
5. Choose whether you want to install the optional components: the reference user
interface and sample codes (Figure B-5).
Figure B-5: Custom Setup Screen
6. In the Choose Destination Location screen, either leave the default installation path
or browse to your desired installation path. Click “Next” (see Figure B-6).
Figure B-6: Destination Folder Screen
7. This screen includes the following sections (see Figure B-7):
By default, the Data Center Manager uses port 1162 to listen to SNMP traps.
36
Only one application can use port 1162. If you have a Microsoft* SNMP trap
already installed, you can install a service that forwards the trap to a different
port. The Data Center Manager can listen to this port. To install the service and
choose a different port, check the “Install SNMP trap forwarding service” box
and enter the port number. The port number cannot be lower than 1024.
By default, the Data Center Manager uses the default port (1099) to listen to
Java* Remote Method Invocation (RMI) clients. To use a different port, check
“Set RMI Port” and enter the port number.
By default, the Data Center Manager uses the default port for the web service
interface, without SSL. If you want the web service interface to use SSL, check
“Use SSL”.
Figure B-7: Setting Screen
If you checked Use SSL: Either use the default port for SSL, or enter a new port. Also
enter an SSL password. You can also choose to import a key store and import a signed
certificate.
8. In the Database Setting screen, enter the database information then click “Next”
(see Figure B-8).
37
Figure B-8: Database Setting Screen
9. In the Ready to Install the Program screen, click “Install” to complete the
installation (Figure B-9).
Figure B-9: Install Screen.
Upon successful installation, the Datacenter Manager web service and reference user
interface are installed. You must use port “8688” to connect to your DCM server.
38