1
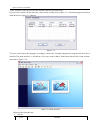
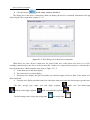
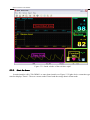
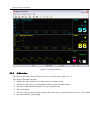
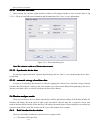
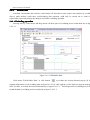
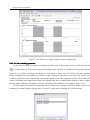
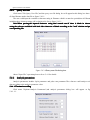
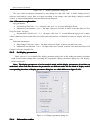
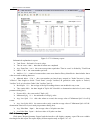
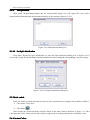
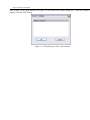
SpO 2 Assistant
USER MANUAL
2013-01-23
SpO2 Assistant User Manual
CONTENTS
1. Foreword....................................................................................................................... 1
2. Main technique specification............................................................................................ 1
2.1. Performance specification.......................................................................................... 1
2.2. Suited device............................................................................................................ 1
3. System environment Requirements....................................................................................1
4. Installation..................................................................................................................... 2
4.1. Software installation..................................................................................................2
4.2. Hardware device connection.......................................................................................2
5. Instructions for use.......................................................................................................... 3
5.1. Start SpO2 Assistant.................................................................................................. 3
5.2. Choose language....................................................................................................... 5
5.3. Real time espial mode............................................................................................... 5
5.3.1. Brief introduction............................................................................................... 5
5.3.2. Start the demo.................................................................................................... 7
5.3.3. Collect data........................................................................................................ 8
5.3.4. Set display parameter.......................................................................................... 9
5.3.5. Alarm.............................................................................................................. 10
5.3.5.1 Alarm setting.............................................................................................. 10
5.3.5.2. Alarm prompt............................................................................................. 11
5.3.6. Freeze and unfreeze waveform............................................................................11
5.3.6.1. Freeze waveform........................................................................................ 11
5.3.6.2. Unfreeze waveform..................................................................................... 12
5.3.7. Information setting............................................................................................ 12
5.3.7.1. User information......................................................................................... 12
5.3.7.2. Unit setting................................................................................................ 13
5.3.8. Device stored data............................................................................................. 13
5.3.9. Set device information....................................................................................... 14
5.3.10. Pulse sound setting.......................................................................................... 14
5.3.11. Real time data store......................................................................................... 15
5.3.12. Synchronize device time.................................................................................. 15
5.3.13. automatic storage of real time data.................................................................... 15
5.4. Review analyse mode............................................................................................. 15
5.4.1. Brief introduction for window............................................................................ 15
5.4.2. Exclude data.....................................................................................................17
5.4.2.1. Excluding operation.................................................................................... 17
5.4.2.2. Undo excluding operation............................................................................ 18
5.4.3. Query user file.................................................................................................. 19
5.4.4. Analysis parameters.......................................................................................... 19
5.4.4.1. Parameter setting........................................................................................ 19
5.4.4.2. Parameter explanation................................................................................. 20
SpO2 Assistant User Manual
5.4.7. Report display.................................................................................................. 21
5.4.7.1. Strip chart report......................................................................................... 21
5.4.7.2. Full study report......................................................................................... 21
5.4.7.3. Oximetry report.......................................................................................... 21
5.4.7.4. Summary report.......................................................................................... 22
5.4.7.5. Report title setting.......................................................................................23
5.4.8. Print report....................................................................................................... 23
5.4.9. Interpretation.................................................................................................... 24
5.4.10. Set SpO2 distribution....................................................................................... 24
5.5. Mode switch........................................................................................................... 24
5.6. Custom Colors........................................................................................................ 24
6. Appendix..................................................................................................................... 25
6.1. Configuration color scheme...................................................................................... 26
6.1.1. File contained the color scheme.......................................................................... 26
6.1.2. Color configuration files.................................................................................... 26
6.1.3. Configuration steps........................................................................................... 27
SpO2 Assistant User Manual
1. Foreword
SpO2 Assistant Software (called "Software" hereinafter) can real time monitor,review and analyse Sp
pulse rate and perfusion index(need support of device).In real time mode, the software collect the data upload
from pulse oximeter to monitor such parameters as SpO2 , pulse rate and perfusion index(called "PI" for short)
review analysis mode,it can review and analyse the stored data ,display analysis results and the trend charts.T
manual will introduce all the features of the software and the detailed operation guidance.
Features:
� Automatic scanning device, the user can connect the pulse oximeter device according to their o
actual conditions.
� Real time displaying the data uploaded from pulse oximeter,including waveform,trend,bar chart a
parameter value.
� With alarm prompt for the parameter value from pulse oximeter.
� Freezing waveform, and reviewing the frozen waveforms by paging up or paging down.
� Controlling pulse oximeter to send, delete the stored data in the device, and set the ID and synchrono
device time .
� With saving and altering user information function
� Supporting the setup of user information and units, multi-language saving and changing.
� Supporting data storage, review and analysis for up to 72 hours , showing four kinds of analysis repo
and the editing of diagnostic information.
� Supporting the report printout.
� Supporting searches for user historical documents and "Save as..."operation for files.
� Supporting multi-country languages.
2. Main technique specification
2.1. Performance specification
Display :Lowest resolution 800* 600, true colour,right LCD
Language:Chinese , English
Trend :Review and analyse trend for all data
Alarm
:Limit alarm for SpO2 and pulse,alarm of finger out,search alarm
SpO2 display range :0% - 100%
Pulse rate display range :0bpm - 300bpm
Perfusion Index display range :0.0%~25.0%
2.2. Suited device
Pulse oximeter
3. System environment Requirements
processor
OS
Memory
: Pentium IV 1.8G or above
: Microsoft Windows XP / Vista / 7
: 256MB or above
SpO2 Assistant User Manual
Display
: 800*600, RGB24 or above
Video adapter : 64MB Memory or above
Font
: Normal fonts
Keyboard
: standard keyboards
Mouse
: standard keyboard
Port
: USB port wireless connection
4. Installation
4.1. Software installation
Double click the installation file “SpO2 Setup_Assistant.exe” and follow installation guide (the filename may
different because of edition difference ). When installing,you may find the indication as figure 4.1.1,please cl
"Continue Anyway" to finish.(If you connect the device for the first time,you may also find the indication
figure 4.1.1,please click "Continue Anyway") You have to confirm whether to reboot the computer af
installation.It's recommended that you restart your computer for the first installation.
figure 4.1.1
4.2. Hardware device connection
The software hold serial interface connection and wireless connection.Please refer to correlative pu
oximeter user manual for detailed connection method
Note:
Note:When wireless connection,please use the Microsoft accompanying bluetooth driver,don't install third pa
driver.If the PC doesn't hold bluetooth,please choose the bluetooth adapter which doesn't need driver
The progresses of checking bluetooth driver:
1. Open the equipment manager .Choose "my computer",then choose "manage" by right key,and the figure 4.
will pop-up,then choose "Equipment manager".
SpO2 Assistant User Manual
figure 4.2.1
2
Choose the "Bluetooth Radios" with sign
,and choose "Microsoft Bluetooth Enumerator", then choo
"attribute" by right key,and the window as figure 4.2.2 will pop-up.Click the "Driver" in the window to exam
the supplier of the driver.
figure 4.2.2
3 please make sure that the the supplier of the bluetooth driver is Microsoft.If not,please uninstall the third pa
bluetooth driver,and use the driver of Microsoft.
5. Instructions for use
SpO2 Assistant User Manual
“SpO2 Assistant” software,you can also start the software from start menu.
If you use the software for the first time ,there will be a dialog box as figure 5.1.1.If not,the program will enter
main interface as figure 5.1.2directly.
figure 5.1.1
The user could choose the language according to need.After choosing language,the program will enter the m
interface.The main interface is divided into five parts :main window frame,menu bar,tool bar, client section a
status bar as figure 5.1.2.
figure 5.1.2main interface
Main interface introduction:
� Tool bar
icon
function
SpO2 Assistant User Manual
Turn on the device,and switch to the real time espial mode
Open the file,switch to review analyse mode
Review analyse mode:print
Review analyse mode:exclude data
Display parameter setting
Choose Language
Real time espial mode:Thaw wave
Real time espial mode:Freeze wave
Real time espial mode:move along 5 seconds wave in freezing wave state
Review analyse mode:page forwards(general analyse report)
Real time espial mode:move backward 5 seconds wave in freezing wave state
Review analyse mode:page backward(general analyse report)
� State bar
In real time espial mode,current device informations are displayed in state bar,including:device connect
type,device type,company name,device ID.
� Two buttons in client section:
:turn on the device to enter real time espial mode
:open the file to enter review analyse mode
5.2. Choose language
The user could change interface display language at any moment as follow:
� Click "Options_Select Language"
�
Click button
in tool bar
Selecting language dialog box will appear if the user carry through above operation as figure 2.The u
could select language according to need.Click "OK",and the interface will display corresponding language;cl
"cancel" to cancel operation.
5.3. Real time espial mode
5.3.1.
Brief introduction
The steps to real time espial mode are as follow:
� Click "File-Connect Device"
SpO2 Assistant User Manual
� Click the button
in the main window interface
The dialog box of the device connection which can display the device's correlation information will app
after doing the above operation as figure 5.3.1.1.
figure 5.3.1.1The dialog box of the device connection
When there are some devices which have the same ID,the user could choose one device to set ID
avoiding confusion.select one device in the list,and click "connect" to connect the device,then it will enter the r
time espial interface which comprizes four areas as Figure 5.3.1.2.
� Trend chart area: trend chart display
� Waveform area: waveform display
� Parameter area: display the SpO2 and pulse rate value,the upper and lower limit of the alarm and
alarm small bell.
� Function area: display perfusion index,bar chart,heart shape,user name,the data storage type and state.
The data storage type: single user and single segment
,multi-user and single segment
,multi-user and multi-segment
The data storage state: having the storage data
;no storage data:
,single user and multi-segm
.
.
SpO2 Assistant User Manual
Figure 5.3.1.2main window of the real time espial
5.3.2.
Start the demo
In main interface,click "File-DEMO" to enter demo interface as Figure 5.3.2.1,the device connection type
state bar displays "Demo". The user can not set the ID and send the storage data in demo mode.
SpO2 Assistant User Manual
Figure 5.3.2.1Demo interface
5.3.3.
Collect data
The device could collect the data after the device was connected as Figure 5.3.3.1.
The display information includes:
�
�
�
Display the SpO2 and pulse rate trend chart for two hours at best.
Display the SpO2 ,pulse rate and perfusion index real time data information.
Real time alarm information display for SpO2 and pulse rate
�
�
�
Waveform display
Frozen waveform and frozen time display.About freezing waveform operation,refer to 5.3.6 for details
Bar chart and heart shape display
SpO2 Assistant User Manual
Figure 5.3.3.1Gather data interface
5.3.4.
Set display parameter
Click "Options-Display Parameters" or tool bar button
5.3.4.1:
to enter display parameter dialog box as figu
SpO2 Assistant User Manual
figure 5.3.4.1Display parameter dialog box
Time interval,the parameter upper and lower limit,trend chart and whether to smooth the trend chart can
set.The trend chart will be displayed according to setting after you click "OK";Click "cancel" to cancel setting.T
prompt information that prompts user to in put over again will appear when the value goes beyond the range.
� Time Interval:change time length.of the current page
� All data:display all data when it was selected,or display the trend chart according to the time interval.
� Max SpO 2(%):set the upper limit of the SpO2 trend chart coordinates.( input range is (0,100] ).
� Min SpO2 (%):set the lower limit of the SpO2 trend chart coordinates.( input range is [0,100) ).
� Max Pulse Rate(bpm):set the upper limit of the pulse rate trend chart coordinates ( input range
(0,300] ).
� Min Pulse Rate(bpm):set the lower limit of the pulse rate trend chart coordinates( input range
[0,300) ).
� Max PI(%):set the upper limit of the PI trend chart coordinates(input range is (0,20] ).
� Min PI(%):set the lower limit of the PI trend chart coordinates(input range is [0,20) ).
� SpO2 Graph Enabled:display(hide) the SpO 2 trend chart.
� Pulse Graph Enabled:display(hide) the pulse rate trend chart.
� PI Graph Enabled:display(hide) the PI trend chart.
� Smooth Trend:set whether to smooth the trend chart.
Note
Note:
The gray style means that it can't be used.
1、The
(0,100],the inp
in
2 、 Input range is expressed with area,such as the input range of Sp O2 upper limit
limit(0,100],the
value is from 0 to 100,not including 0, including 100.
5.3.5.
Alarm
5.3.5.1 Alarm setting
Click"Options-Alarm setting" to set the upper and lower limit of SpO2 and pulse rate in alarm setting dialog
box as figure 5.3.5.1.1.
Figure 5.3.5.1.1Alarm setting dialog box
SpO2 Assistant User Manual
Alarm prompt
5.3.5.2.
5.3.5.2.Alarm
The alarm information can prompt the user by two modes of seeing and hearing. As the alarm information is
important and requires timely response,this software provides the following modes to prompt the user that the
alarm has happenedas figure 5.3.5.2.1.
� Alarm information
The alarm information which provides the disobeyed alarm limit is displayed in trend chart area.Such
"Alarm:SpO2 > 90”,it means that the alarm happens for the reason of SpO2 value exceeding the upper limit 90.
� Alarm sound
The software can prompt user by sound when alarm happens.
Note
Note:Click "Edit-Pause alarm sound(10s)" to suspend the current alarm sound 10seconds. Set alarm sou
pause time by alarm setting.
� flicker
When some physiological parameter alarm happens,the small bell icon and value in parameter display a
will flicker to prompt the parameter is alarming.
Figure 5.3.5.2.1Alarm display interface
5.3.6.
Freeze and unfreeze waveform
5.3.6.1. F reeze waveform
Method as follows :
� Click "Edit-Freeze Wave"
�
Click the button
in tool bar
SpO2 Assistant User Manual
Figure 5.3.6.1.1Frozen waveform interface
Click the button
to move along the waveform five seconds,and Click the button
to mo
backward the waveform five seconds.
5.3.6.2. Unfreeze waveform
Method as follows :
� Click "Edit-Unfreeze Wave"
�
Click the button
in tool bar
After the waveform was unfrozen,waveform real time espial state will be resumed.
5.3.7.
Information setting
5.3.7.1. User information
Click "Options-User Information" to enter user information dialog box,then the user can examine,edit
change the current user's name,height,age,weight,sex,nationality and comment as figure 5.3.7.1.1.
SpO2 Assistant User Manual
Figure 5.3.7.1.1User information
5.3.7.2. Unit setting
Click "Options-Unit Setting" to set the unit of user's height and weight as figure 5.3.7.2.1.
Figure 5.3.7.2.1Unit setting
5.3.8.
Device stored data
In real time espial mode,click "File-Device Stored Data”,and the device stored data dialog box w
appear,including user index number,user name,data index,data length,start time as figure 5.3.8.1(the data stora
type for figure 5.3.8.1is "multi-user and single segment ")
SpO2 Assistant User Manual
Figure 5.3.8.1Device stored data dialog box
� Store device data
Choose the stored data which is wanted to send (choose check box of user index number and you can choo
many segments stored data),then click "receive data",and the schedule of receiving stored data will appear.T
software could store the data automatically.The naming method of file is as follow: user name+user ind
number+data segment number+current store time.Click “cancel” button of schedule to cancel sending.
� Delete stored data(need device support)
Choose the data which is wanted to delete,then click "delete data " to delete the data segments which
chosen.Click "clear user data" to delete all stared data of appointed user.
5.3.9.
Set device information
In real time espial mode,click "Options —Set Device Info” to set device information as figure 5.3.9.1.
Figure 5.3.9.1Setting device information dialog box
There is current device ID in dialog box.The user could edit device ID (input 7 characters at most).Click
"OK" to set current device ID,and the device ID in state bar of main window will change.
5.3.10. Pulse sound setting
SpO2 Assistant User Manual
5.3.11. Real time data store
When closing the real time espial mode,the software will prompt whether to store real time data as figu
5.3.11.1.The user could edit user information and file name,then click "save" to save information.
Figure 5.3.11.1Store data dialog box
Note:The software could save 72 hours data at most.
5.3.12. Synchronize device time
In real time espial mode,click "Options-Synchronizing Device Time” to set synchronizing device time a
system time.
5.3.13. automatic storage of real time data
In order to avoid losing data because of software stopping,the software have automatic storage function
real time data.The software could save the received data every other minute.When finish gathering,if the user sa
data,the saved data will be covered,if not,the saved data will be deleted.
5.4. Review analyse mode
There are two kinds of review analyse data:the data with PI and the data without PI.If the data includes PI,
interface will display the trend charts of SpO2 ,pulse rate and PI when the data file is opened in review analy
mode.If the data doesn't include PI,the interface will display the trend charts of SpO2 and pulse rate,and the sett
operation about PI isn't used.This section use the review data without PI as example.
5.4.1.
Brief introduction for window
There are four kinds of methods to enter the review analyse mode.
�
Click menu "File-Open File"
SpO2 Assistant User Manual
�
Click button "
" in main window interface
Opening file dialog box will appear if above operation is carried out.Open the file to enter the revi
analyse mode .
� Click menu "File-Query User File",and the query user file dialog box will appear as figure 5.4.1.1.
Figure 5.4.1.1Query user file dialog box
Choose one file in file list ,then click "Open File" or double click the file to enter the review analyse mode
The review analyse interface is divided into three areas mostly:caption area,user information disp
area,trend chart display area as figure 5.4.1.2.
Figure 5.4.1.2The review analyse mode interface(zonal chart report)
SpO2 Assistant User Manual
5.4.2.
Exclude data
In default circumstance,the software could analyse all data,cancel some useless data analysis by excludi
data to make analysis result more real.Excluding data operation could only be carried out in zonal ch
report.Other report only display the analysis result after excluding operation.
ing operation
5.4.2.1. Exclud
Excluding
Pressing left key of the mouse and drag mouse will draw piece of excluding area in trend chart area as figu
5.4.2.1.1.
Figure 5.4.2.1.1Exclude data
Click menu "Edit-Exclude Data" or click button "
" to exclude the chosen data,and pop-up all tim
segment information of all excluding data as figure5.4.2.2.1.Or click right key of the mouse to pop-up menu,th
click "exclude" to exclude the selected data directly as figure5.4.2.1.1,The background of excluding area is fil
in,and the data of excluding area isn't analysed as figure 5.4.2.1.2.
SpO2 Assistant User Manual
Figure 5.4.2.1.2The review analyse interface after excluding data
5.4.2.2. Undo excluding operation
In the state of having not chosen excluding data,click menu "Edit-Exclude Data" or click tool bar butt
"
" ,Or click right key of the mouse to pop-up menu,then click "exclude" to exclude the selected data directly
figure5.4.2.1.1. and the excluding data dialog box will appear as figure 5.4.2.2.1.There are all time segments
having excluding data in the dialog box.Choose one time segment (could choose more),and click "Undo" to un
excluding operation for this segment and clean out the display of this time segment in the list.Click "Undo All"
undo all excluding time segment and clean out excluding data list in excluding data dialog box.After completi
the operation of undoing excluding,the software will analyse data and display over again as figure 5.4.1.2.
Or click right key of mouse in excluded data area of client area to pop-up menu.Click "Undo current" to un
excluding of current excluded data,and click "Undo all" to undo undo excluding of all excluded data.
SpO2 Assistant User Manual
5.4.3.
Query user file
Click menu "File-Query User File",and the query user file dialog box will appear.In this dialog box there
all data filename under data file as figure 5.4.1.1.
The user could input the correlative character string in filename which is wanted to queried,then all filenam
including these character string will be displayed in list as figure 5.4.3.1.
Note:When quering,the inputed character string don't match case.If there is blank in charac
qu
string,the software could deal with both sides character of blank according to the "and" relation and que
corresponding file.
Figure 5.4.3.1Query user file dialog box
About "Open File" operation,please refer to 5.4.1 for details.
5.4.4.
Analysis parameters
Analysis parameters include: SpO2 parameter and pulse rate parameter.The software could analyse revi
data according to the analysis parameter value
5.4.4.1. Parameter setting
Click menu "Options-Analysis Parameters",and analysis parameters dialog box will appear as figu
5.4.1.1.1.
SpO2 Assistant User Manual
Figure 5.4.1.1 Analysis parameters dialog box
The user could set analysis parameters by this dialog box and click "OK" to make setting success.T
software could analyse review data over again according to the setting value and display analysis result.Cli
"cancel" to cancel setting,and the software doesn't do any disposal.
5.4.4.2. Parameter explanation
SpO2 parameters:
� Percent Drop For Event(%):the input value uses "%" as unit to label SpO2 Event.
� Minimum Event Duration(sec):the input value uses "second" as unit,it is the time limit of "Perc
Drop For Event" for SpO2 .
� Desaturation Criteria Level (%): the input value uses "%" as unit.When the SpO2 level is under
values which have been set,the software could count solely,and use red dashed to express in display area of Sp
data.
Pulse Rate parameters:
� Rate Change For Event(bpm):the input value uses "bpm" as unit to set pulse rate event.
� Minimum Event Duration(sec):the input value uses "second" as unit,it is the least time limit of "R
Change For Event" for pulse rate.
5.4.5.
Set display parameters
Please refer to 5.3.4 for details.The display parameter dialog box in this mode has memory function,a
could record former setting.After restarting the program,the display parameter dialog box will display
former setting still.
The display parameters of review analysis mode and the display parameters of real time esp
Note
Note:The
mode don't affect each other.Because the parameters are different under the two kinds of display modes,
corresponding interfaces of display parameter dialog box are a little different as figure 5.4.5.1.
Figure 5.4.5.1Display parameter dialog box
SpO2 Assistant User Manual
After setting,click "OK",and the result will be displayed in the interface and saved to the current d
file.Click "Cancel" to cancel setting,and the information will keep former setting.
5.4.7.
Report display
5.4.7.1. Strip chart report
Click menu "Report-Strip Chart Report",and the interface will display strip chart report as figure 5.4.1.2
the strip chart report,the user could carry out a series of operations such as excluding data,displaying parame
value,moving trend wave and time axis and so on.
About excluding data operation,please refer to 5.4.2.
The methods of moving time axis and trend wave are as follows.
� Drag scroll bar to move by the left key of the mouse.
� Move by the around keys of keyboard.
Click the left key of the mouse in the effective data area of the trend chart to display the data collect
time,SpO2 value,pulse rate value for the position.
If the position of left key is noneffective data,the software will not display any numerical value
Note
Note:If
5.4.7.2. Full study report
Click menu "Reports-Full Study Report",and the interface will display full study report as figure 5.4.7.2.1.
Figure 5.4.7.2..1Full study report
When the total number of pages is more than one,the user could carry paging operation according to
methods as follow.
�
Click
or
to left page or right page.
� Press “Page Down” or “Page Up” on the keyboard to page.
5.4.7.3. Oximetry report
SpO2 Assistant User Manual
Figure 5.4.7.3.1Oximetry report
Substantival explanation in report
� Total Event:find total of event in value.
� Time in event(min):time that all affairs are completed
� Avg. Event Dur.(sec):the event average time equals that "Time in event" is divided by "Total Event
� Index(1/hr):the event number per hour.
� Artifact(%):contrived reason makes some areas data inefficacy.Noneffective data includes that ze
value area and excluding data area.
� Adjusted index ( 1/hr ): the event number per hour.It may unequal to "Index",because it often u
"effective" time length to divide "Total Event" (except "Artifact").In general,its value equals to "Index"(
"Artifact" is 0) or is less then "index"(the "Artifact" isn't 0).
� Basal SpO2 (%):the average of the SpO2 readings that are not included in any event.
� Time (min)<88%:the time length of "SpO 2 <88".Note:88 is a desaturation criteria level (set in analy
parameter dialog box).
� Events<88%:the event total of "SpO 2<88".
�
�
events.
Minimum SpO2(%):the minimum of all SpO2 value.
Avg. Low SpO2 (%):this value relates to event,is the average value of "Minimum SpO2" for all Sp
� Avg. Low SpO2 <88%:the same as above,only count the average value of "Minimum SpO2 <88".88 i
desaturation criteria level (set in analysis parameter dialog box).
� Avg. Pulse Rate(bpm):the average value of all pulse rate data.
� Low Pulse Rate(bpm):the least value of all pulse rate data.
5.4.7.4. Summary report
Click menu "Report-Summary Report",and the interface will display summary report.The user couldn't
time length for this report.The report display all data acquiescently as figure 5.4.7.4.1.
SpO2 Assistant User Manual
Figure 5.4.7.4.1Summary report
Substantival explanation in report:
Please refer to 5.4.7.3 for details.
5.4.7.5. Report title setting
Click menu "Report-Report Title Setting",and the report title setting dialog box will appear as figu
5.4.7.5.1.
Figure 5.4.7.5.1Report title setting dialog box
The user could set report title by this dialog box.After setting,click "OK",and the title will be displayed.Cl
"cancel" to cancel setting,and the report title will not changed.
5.4.8.
Print report
The software support printout of the reports.The print format is the same as the displayed report format.T
print methods are as follows.
� Click menu "File-Print".
�
Click button
The user could cancel print operation in the process of print .
SpO2 Assistant User Manual
5.4.9.
Interpretation
Click menu "Report-Interpretation",and the interpretation dialog box will appear.The user could e
interpretation information,and the information display in the summary report as 5.4.9.1.
Figure 5.4.9.1Interpretation dialog box
5.4.10. Set SpO 2 distribution
Click menu "Report-Set SpO2 distribution" to enter Set SpO2 distribution dialog box as figure5.4.10.1.T
user could set SpO2 Event distribution and SpO2 distribution.After setting,the corresponding chart will change.
Figure 5.4.10.1Set SpO2 distribution dialog box
5.5. Mode switch
If the user wants to switch mode,the user need to close current mode according to the methods as follows.
� Click menu "File-Close"
�
Click button
After closing the current mode,the software returns to the main window interface as figure 5.1.2.The u
could enter the review analysis mode and real time espial mode according to introductive methods in front.
5.6. Custom Colors
SpO2 Assistant User Manual
color scheme" in the main interface (as Figure 5.1.2)to enter color scheme dialog box , select the custom co
scheme. Click the "OK" button.
Figure 5.6.1 The dialog box of the color schemes
SpO2 Assistant User Manual
6. Appendix
6.1. Configuration color scheme
6.1.1.
ed the color scheme
File contain
contained
Config.ini
Decimal_point.bmp
PImap.bmp
pulse_alarm.bmp
Pulsemap.bmp
spo2_alarm.bmp
spo2map.bmp
6.1.2.
//Color scheme
//The picture of decimal point in PI value
//The display picture of PI value
//The display picture of pulse rate alarm bell
//The display picture of the normal pulse rate value
//The display picture of SpO2 alarm bell
//The display picture of the normal SpO2 value
Color configuration files
The content of the config.ini file
[paramcolor]
prbmpR=255
prbmpG=255
prbmpB=0
spo2R=0
spo2G=255
spo2B=255
PIR=0
PIG=255
PIB=255
waveR=255
waveG=255
waveB=0
textColorSpo2R=0
textColorSpo2G=255
textColorSpo2B=255
textColorPulseR=255
textColorPulseG=255
textColorPulseB=0
explanation:
prbmpR、prbmpG、prbmpB This three values decide the text color in the pulse rate parameters area.
spo2R、 spo2G、 spo2B This three values decide the text color in the SpO2 area.
PIR、PIG、PIB This three values decide the text color in the PI area.
waveR、waveG、waveB This three values decide the waveform color in the waveform area.
textColorSpo2R、textColorSpo2G、textColorSpo2B This three values decide the text color in SpO2 tre
area.
textColorPulseR、textColorPulseG、textColorPulseB This three values decide the text color in pulse r
trend area.
SpO2 Assistant User Manual
6.1.3.
Configuration steps
Open the the " colorscheme " folder under the installation directory ,copy and rename the "Default_Sche
"folder. According to their needs to modify the color configuration of the" config.ini "in the renamed folder. If y
want to modify the value display picture, please use own picture to replace the original picture.
Note: Do not change the name, width, height of the picture, and each value in the picture have the sa
width .