1
WT1800
Precision Power Analyzer
Features Guide
IM WT1801-01EN
2nd Edition
Thank you for purchasing the WT1800 Precision Power Analyzer. This manual contains useful
information about the features of the WT1800. To ensure correct use, please read this manual
thoroughly before beginning operation.
After reading the manual, keep it in a convenient location for quick reference whenever a question
arises during operation. The following manuals, including this one, are provided as manuals for the
WT1800. Please read all the manuals.
Manual Title
WT1800 Precision Power Analyzer
Features Guide
WT1800 Precision Power Analyzer
User’s Manual
WT1800 Precision Power Analyzer
Getting Started Guide
WT1800 Precision Power Analyzer
Communication Interface
User’s Manual
Manual No.
Description
IM WT1801-01EN This manual. The supplied CD contains the PDF
file of this manual. This manual explains all the
WT1800 features other than the communication
interface features.
IM WT1801-02EN The supplied CD contains the PDF file of this
manual. The manual explains how to operate the
WT1800.
IM WT1801-03EN The manual explains the handling precautions and
basic operations of the WT1800 and provides an
overview of its features.
IM WT1801-17EN The supplied CD contains the PDF file of this
manual. The manual explains the WT1800 series
communication interface features and instructions
on how to use them.
Notes
• The contents of this manual are subject to change without prior notice as a result of continuing
improvements to the instrument’s performance and functionality. The figures given in this manual
may differ from those that actually appear on your screen.
• Every effort has been made in the preparation of this manual to ensure the accuracy of its
contents. However, should you have any questions or find any errors, please contact your
nearest YOKOGAWA dealer.
• Copying or reproducing all or any part of the contents of this manual without the permission of
YOKOGAWA is strictly prohibited.
• The TCP/IP software of this product and the documents concerning it have been developed/
created by YOKOGAWA based on the BSD Networking Software, Release 1 that has been
licensed from the Regents of the University of California.
Trademarks
• Microsoft, Internet Explorer, MS-DOS, Windows, Windows NT, and Windows XP are either
registered trademarks or trademarks of Microsoft Corporation in the United States and/or other
countries.
• Adobe and Acrobat are either registered trademarks or trademarks of Adobe Systems
Incorporated.
• In this manual, the ® and TM symbols do not accompany their respective registered trademark
or trademark names.
• Other company and product names are trademarks or registered trademarks of their respective
holders.
Revisions
• 1st Edition: February 2011
• 2nd Edition: August 2011
2nd Edition: August 2011(YMI)
All Rights Reserved, Copyright © 2011 Yokogawa Meters & Instruments Corporation
IM WT1801-01EN
Contents
ii
1
Items That This Instrument Can Measure
2
Fundamental Measurement Conditions
3
Harmonic Measurement Conditions (Option)
Measurement Functions Used in Normal Measurement............................................................... 1-1
Harmonic Measurement Functions (Option).................................................................................. 1-3
Delta Computation Functions (Option).......................................................................................... 1-5
Motor Evaluation Functions (Option)............................................................................................. 1-5
Auxiliary Input Measurement Functions (Option)........................................................................... 1-5
High Speed Data Capturing (Option)............................................................................................. 1-5
What Is a Measurement Function?................................................................................................ 1-6
Measurement Period..................................................................................................................... 1-6
Wiring System Settings (WIRING)................................................................................................. 2-1
Wiring System (Wiring).................................................................................................................. 2-1
Efficiency Equation (η Formula)..................................................................................................... 2-4
Independent Input Element Configuration (Element Independent)................................................ 2-5
Delta Computation (Δ Measure; option)......................................................................................... 2-6
Selecting an Element Whose Measurement Range You Want to Specify (ELEMENT)................. 2-8
Selecting All Input Elements (ALL)................................................................................................ 2-9
Voltage Range (RANGE UP/DOWN (V))....................................................................................... 2-9
Auto Voltage Range (AUTO (V)).................................................................................................. 2-10
Current Range (RANGE UP/DOWN (A))......................................................................................2-11
Auto Current Range (AUTO (A))...................................................................................................2-11
Power Range............................................................................................................................... 2-12
External Current Sensor Range (EXT SENSOR; option)............................................................ 2-12
External Current Sensor Conversion Ratio (SENSOR RATIO; option)........................................ 2-13
External Current Sensor Range Display Format (DIRECT/MEASURE; option).......................... 2-14
Scaling (SCALING)...................................................................................................................... 2-14
Valid Measurement Range (CONFIG(V)/CONFIG(A))................................................................. 2-16
Crest Factor (Crest Factor).......................................................................................................... 2-17
Measurement Period (SYNC SOURCE)...................................................................................... 2-18
Line Filter (LINE FILTER)............................................................................................................. 2-19
Frequency Filter (FREQ FILTER)................................................................................................ 2-19
Data Update Interval (UPDATE RATE)........................................................................................ 2-20
Averaging (AVG).......................................................................................................................... 2-20
Displaying the Setup Parameter List (INPUT INFO).................................................................... 2-22
Harmonic Measurement Conditions (HRM SET)........................................................................... 3-1
PLL Source (PLL Source).............................................................................................................. 3-1
Measured Harmonic Orders (Min Order/Max Order)..................................................................... 3-2
Distortion Factor Equation (Thd Formula)..................................................................................... 3-3
Input Element Group (Element Settings)....................................................................................... 3-3
Anti-Aliasing Filter.......................................................................................................................... 3-4
IM WT1801-01EN
Contents
4
Motor Evaluation Conditions (Option)
5
Auxiliary Input Conditions (Option)
6
Holding Measured Values and Performing Single Measurements
7
Numeric Data Display
IM WT1801-01EN
Motor Evaluation Conditions and Auxiliary Input Conditions (MOTOR/AUX SET)........................ 4-1
Scaling Factor (Scaling)................................................................................................................. 4-1
Unit (Unit)....................................................................................................................................... 4-2
Input Signal Type (Sense Type)..................................................................................................... 4-2
Analog Input Range....................................................................................................................... 4-3
Linear Scaling of Analog Input....................................................................................................... 4-3
Line Filter (Line Filter).................................................................................................................... 4-4
Synchronization Source (Sync Source)......................................................................................... 4-5
Pulse Input Range......................................................................................................................... 4-5
Torque Signal Pulse Rating........................................................................................................... 4-5
Revolution signal pulses per revolution (Pulse N)......................................................................... 4-7
Synchronous Speed (Sync Speed)................................................................................................ 4-7
Electrical Angle Measurement (Electrical Angle Measurement).................................................... 4-8
Motor Efficiency and Total Efficiency Computation........................................................................ 4-9
Auxiliary Input Conditions (MOTOR/AUX SET)............................................................................. 5-1
Input Signal Name (Aux Name)..................................................................................................... 5-1
Scaling Factor (Scaling)................................................................................................................. 5-1
Unit (Unit)....................................................................................................................................... 5-1
Analog Input Range....................................................................................................................... 5-1
Linear Scaling of Analog Input....................................................................................................... 5-2
Line Filter (Line Filter).................................................................................................................... 5-3
Holding Measured Values (HOLD)................................................................................................. 6-1
Single Measurement (SINGLE)..................................................................................................... 6-1
Numeric Data Display (NUMERIC)................................................................................................ 7-1
Display Format (FORM)................................................................................................................. 7-1
Numeric Data Display Format........................................................................................................ 7-1
Switching the Displayed Page (PAGE UP/PAGE DOWN)............................................................. 7-3
Jumping to the First or Last Page (PAGE TOP/PAGE END)......................................................... 7-3
Number of Displayed Digits (Display Resolution).......................................................................... 7-4
Display Item (ITEM)....................................................................................................................... 7-4
4-, 8-, and 16-Value Displays (4 Items/8 Items/16Items)............................................................... 7-5
Matrix display (Matrix).................................................................................................................... 7-7
All Items Display (All Items)........................................................................................................... 7-8
Single Harmonics and Dual Harmonics Lists (Hrm List Single/Dual; option)................................. 7-9
Custom Display (Custom)............................................................................................................ 7-10
iii
Contents
iv
8
Computation
9
Integrated Power (Watt hours)
10 Waveform Display
11 Trend Display
12 Bar Graph Display (Option)
Computation (MEASURE)............................................................................................................. 8-1
User-Defined Functions (User Defined Function).......................................................................... 8-1
Measuring the Average Active Power............................................................................................ 8-5
MAX Hold (Max Hold).................................................................................................................... 8-5
User-Defined Events (User Defined Event)................................................................................... 8-6
Apparent Power, Reactive Power, and Corrected Power Equations (Formula)............................. 8-8
Sampling Frequency (Sampling Frequency)................................................................................. 8-9
Phase Difference Display Format (Phase)................................................................................... 8-10
Master/Slave Synchronization Measurement (Sync Measure).................................................... 8-10
Voltages or Currents Whose Frequencies Will Be Measured (FREQ MEASURE).......................8-11
Integration-Related Display Indications......................................................................................... 9-1
Number of Displayed Digits (Display Resolution).......................................................................... 9-2
Enabling or Disabling Independent Integration (Independent Control).......................................... 9-4
Independently Integrated Elements (Element Object)................................................................... 9-4
Starting, Stopping, and Resetting Integration (Start/Stop/Reset).................................................. 9-5
Integration Conditions (Integ Set).................................................................................................. 9-7
Integration Mode (Mode)............................................................................................................... 9-7
Integration Timer (Integ Timer).................................................................................................... 9-10
Scheduled Times for Real-Time Integration (Real-time Control)................................................. 9-10
Integration Auto Calibration On/Off (Auto Cal)..............................................................................9-11
Watt Hour Integration Method for Each Polarity (WP ± Type).......................................................9-11
Current Mode for Current Integration (q Mode)............................................................................9-11
Rated Time of Integrated D/A Output (D/A Output Rated Time; Option)...................................... 9-12
Waveform Display (WAVE).......................................................................................................... 10-1
Display Format (FORM)............................................................................................................... 10-2
Number of Windows (Format)...................................................................................................... 10-2
Time Axis (Time/div)..................................................................................................................... 10-2
Vertical Axis (Amplitude).............................................................................................................. 10-4
Trigger (Trigger Settings)............................................................................................................. 10-5
Advanced Waveform Display Settings (Display Settings)............................................................ 10-7
Waveform Mapping (Wave Mapping)........................................................................................... 10-8
Display Item (ITEM)..................................................................................................................... 10-8
Other Displays (OTHERS)............................................................................................................11-1
Trend Display (Trend)...................................................................................................................11-1
Display Format (FORM)................................................................................................................11-2
Display Item (ITEM)......................................................................................................................11-3
Bar Graph Display (OTHERS (Bar))............................................................................................ 12-1
Display Format (FORM)............................................................................................................... 12-1
Display Item (ITEM)..................................................................................................................... 12-2
IM WT1801-01EN
Contents
13 Vector Display (Option)
14 Split Display
15 Cursor Measurement
16 High Speed Data Capturing
17 Data Storage
IM WT1801-01EN
Vector Display (OTHERS (Vector)).............................................................................................. 13-1
Display Format (FORM)............................................................................................................... 13-2
Display Item (ITEM)..................................................................................................................... 13-2
Split Display (OTHERS)............................................................................................................... 14-1
Split Displays with the Numeric Display (Numeric+***)................................................................ 14-1
Split Displays with the Waveform Display (Wave+***)................................................................. 14-1
Split Displays with the Trend Display (Trend+***)........................................................................ 14-1
Split Display Settings................................................................................................................... 14-1
Cursor Measurement (CURSOR)................................................................................................ 15-1
Turning Cursor Measurement On and Off (Cursor)..................................................................... 15-1
Waveform Measured by Cursor 1 (+; C1+ Trace)........................................................................ 15-1
Waveform Measured by Cursor 2 (x; C2x Trace)........................................................................ 15-1
Cursor Path (Cursor Path)........................................................................................................... 15-2
Position of Cursor 1 (+; C1+ Position)......................................................................................... 15-2
Position of Cursor 2 (x; C2x Position).......................................................................................... 15-2
Linking Cursor Movement (Linkage)............................................................................................ 15-2
Measured Items........................................................................................................................... 15-2
Cursor Movement........................................................................................................................ 15-4
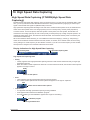
High Speed Data Capturing (OTHERS(High Speed Data Capturing))........................................ 16-1
High Speed Data Capturing (HS) Settings (FORM).................................................................... 16-4
Number of Data Captures (Capture Count)................................................................................. 16-4
Viewing and Optimizing the Maximum Capturing Count (Optimize Count)................................. 16-4
Capture Control Settings (Control Settings)................................................................................ 16-5
Recording to a File (Record to File)............................................................................................. 16-7
Save Conditions (File Settings)................................................................................................... 16-8
Starting and Stopping High Speed Data Capturing (Start/Stop).................................................. 16-9
Display Items (ITEM)..................................................................................................................16-11
Storage-Related Display Indications............................................................................................ 17-1
Storage Conditions (STORE SET)............................................................................................... 17-1
Storage Control (Control Settings)............................................................................................... 17-2
Stored Items (Item Settings)........................................................................................................ 17-4
Save Conditions (File Settings)................................................................................................... 17-5
Starting, Stopping, and Resetting Storage (STORE START, STORE STOP, and STORE RESET)....
17-6
Storage Operations in Each Storage Mode................................................................................. 17-8
Contents
18 Saving and Loading Data
19 Saving Screen Images
20 Printing Screen Images and Numeric Data (Option)
21 Ethernet Communication (Network)
22 Utility
23 Other Features
Storage Media............................................................................................................................. 18-1
Saving Setup Data (Save Setup)................................................................................................. 18-2
Saving Waveform Display Data (Save Wave).............................................................................. 18-2
Saving Numeric Data (Save Numeric)......................................................................................... 18-2
File Save Conditions.................................................................................................................... 18-3
Loading Setup Data (Load Setup)............................................................................................... 18-5
File Operations (Utility)................................................................................................................ 18-6
Conditions for Saving Screen Image Data (IMAGE SAVE MENU).............................................. 19-1
Saving a Screen Image (IMAGE SAVE)...................................................................................... 19-1
Printing Conditions (PRINT MENU)............................................................................................. 20-1
Output Format (Format)............................................................................................................... 20-1
Automatic Printing Execution (Auto Print ON)............................................................................. 20-2
Automatic Printing (Auto Print Settings)...................................................................................... 20-2
Comment (Comment).................................................................................................................. 20-3
Paper Feed (Paper Feed)............................................................................................................ 20-3
Print Timing for Different Print Modes.......................................................................................... 20-4
Printing (PRINT).......................................................................................................................... 20-6
TCP/IP (TCP/IP).......................................................................................................................... 21-2
FTP Server (FTP Server)............................................................................................................. 21-3
Network Drive (Net Drive)............................................................................................................ 21-4
SNTP (SNTP).............................................................................................................................. 21-5
Utility (UTILITY)........................................................................................................................... 22-1
Overview (System Overview)...................................................................................................... 22-2
Initializing the Settings (Initialize Settings)................................................................................... 22-2
Remote Control (Remote Control)............................................................................................... 22-3
System Configuration (System Config)........................................................................................ 22-5
D/A Output (D/A Output Items; option)......................................................................................... 22-8
Self-Test (Selftest)......................................................................................................................22-11
Zero-Level Compensation (CAL)................................................................................................. 23-1
NULL Feature (NULL SET).......................................................................................................... 23-1
Enabling and Disabling the NULL Feature (NULL)...................................................................... 23-3
Clearing Remote Mode (LOCAL)................................................................................................. 23-3
Key Lock (KEY LOCK)................................................................................................................. 23-3
Index
vi
IM WT1801-01EN
1 Items That This Instrument Can Measure
The items that you can measure with this instrument are listed below. For details about how the values of the
measurement functions are determined, see appendix 1 in the getting started guide, IM WT1801-03EN. For
explanations of the terms measurement function, input element, and wiring unit, see “What Is a Measurement
Function?”
Click here.
The input elements and wiring units referred to in each measurement function table are listed below. However,
the input elements and wiring units that you can measure vary depending on how many input elements are
installed in the WT1800.
• Input elements: Element1, Element2, Element3, Element4, Element5, Element6
• Wiring units:
ΣA, ΣB, ΣC
Measurement Functions Used in Normal Measurement
Voltage
Function
Urms
Umn
Udc
Urmn
Uac
U+pk
U−pk
CfU
Description
True rms voltage
Rectified mean voltage calibrated to
the rms value
Simple voltage average
Rectified mean voltage
AC voltage component
Maximum voltage
Minimum voltage
Voltage crest factor
Input Element
Yes
Yes
Wiring Unit
Yes
Yes
Yes
Yes
Yes
Yes
Yes
Yes
Yes
Yes
Yes
No
No
No
Input Element
Yes
Yes
Wiring Unit
Yes
Yes
Yes
Yes
Yes
Yes
Yes
Yes
Yes
Yes
Yes
No
No
No
Description
Active power
Apparent power
Reactive power
Power factor
Phase difference
Corrected Power
Maximum power
Minimum power
Input Element
Yes
Yes
Yes
Yes
Yes
Yes
Yes
Yes
Wiring Unit
Yes
Yes
Yes
Yes
Yes
Yes
No
No
Description
Voltage frequency
Current frequency
Frequency of PLL11
Frequency of PLL22
Input Element
Yes
Yes
No
No
Wiring Unit
No
No
No
No
Current
Function Description
Irms
True rms current
Imn
Rectified mean current calibrated to the
rms value
Idc
Simple current average
Irmn
Rectified mean current
Iac
AC current component
I+pk
Maximum current
I−pk
Minimum current
CfI
Current crest factor
Power
Function
P
S
Q
λ
Φ
Pc
P+pk
P−pk
Frequency
Function
fU
fI
fPLL1
fPLL2
1On models with the harmonic measurement option or the simultaneous dual harmonic measurement
option.
2 Only on models with the simultaneous dual harmonic measurement option.
IM WT1801-01EN
1-1
1 Items That This Instrument Can Measure
Integrated Power (Watt hours)
Function Description
Time
Integration time
WP
Sum of positive and negative watt
hours
WP+
Sum of positive P values
WP−
Sum of negative P values
q
Sum of positive and negative ampere
hours
q+
Sum of positive I values
q−
Sum of negative I values
WS
Volt-ampere hours
WQ
Var hours
Input Element
Yes
Yes
Wiring Unit
No
Yes
Yes
Yes
Yes
Yes
Yes
Yes
Yes
Yes
Yes
Yes
Yes
Yes
Yes
Yes
Efficiency
Function
η1 to η4
Description
Efficiency
User-Defined Functions
Function Description
F1 to F20 User-defined functions
User-defined events
Function Description
Ev1 to Ev8 User-defined events
1-2
IM WT1801-01EN
1 Items That This Instrument Can Measure
Harmonic Measurement Functions (Option)
Function
U(k)
I(k)
P(k)
S(k)
Q(k)
λ(k)
Φ(k)
ΦU(k)
ΦI(k)
Z(k)
Rs(k)
Xs(k)
Rp(k)
Xp(k)
Uhdf(k)
Ihdf(k)
Phdf(k)
Uthd
Ithd
Pthd
Uthf
Ithf
Utif
Itif
hvf
hcf
K−factor
ΦUi−Uj1
ΦUi−Uk1
ΦUi−Ii1
ΦUj−Ij1
ΦUk−Ik1
Description
Rms voltage of harmonic order k
Rms current of harmonic order k
Active power of harmonic order k
Apparent power of harmonic order k
Reactive power of harmonic order k
Power factor of harmonic order k
Phase difference between the voltage
and current of harmonic order k.
Phase difference between the
fundamental signal, U(1), and
harmonic voltage U(k)
Phase difference between the
fundamental signal, I(1), and harmonic
current I(k)
Impedance of the load circuit
Series resistance of the load circuit
Series reactance of the load circuit
Parallel resistance of the load circuit
Parallel reactance of the load circuit
Harmonic voltage distortion factor
Harmonic current distortion factor
Harmonic active power distortion factor
Total harmonic voltage distortion
Total harmonic current distortion
Total harmonic active power distortion
Telephone harmonic factor of the
voltage
Telephone harmonic factor of the
current
Telephone influence factor of the
voltage
Telephone influence factor of the
current
Harmonic voltage factor
Harmonic current factor
K factor
Phase difference between the
fundamental voltage of element i,
Ui(1), and the fundamental voltage of
element j, Uj(1).
Phase difference between Ui(1) and
the fundamental voltage of element k,
Uk(1)
Phase difference between Ui(1) and
the fundamental current of element i,
Ii(1)
Phase difference between Uj(1) and
the fundamental current of element j,
Ij(1)
Phase difference between Uk(1) and
the fundamental current of element k,
Ik(1)
Input Element
Yes
Yes
Yes
Yes
Yes
Yes
Yes
Wiring Unit
Yes
Yes
Yes
Yes
Yes
Yes
No
Yes
No
Yes
No
Yes
Yes
Yes
Yes
Yes
Yes
Yes
Yes
Yes
Yes
Yes
Yes
No
No
No
No
No
No
No
No
No
No
No
No
Yes
No
Yes
No
Yes
No
Yes
Yes
Yes
No
No
No
No
Yes
No
Yes
Yes2
Yes
No
Yes
No
Yes
1 i, j, and k are input element numbers. For example, when the number of input elements in wiring unit ΣA is
six and the wiring system of elements 1, 2, and 3 is three phase, four wire, i is 1, j is 2, and k is 3. ΦUi – Uj
represents ΦU1 – U2, the difference between the fundamental voltage signal of element 1, U1(1), and the
fundamental voltage signal of element 2, U2(1). In the same way ΦUi – Uk, ΦUi – Ii, ΦUj – Ij, and ΦUk−Ik
represent to ΦU1 – U3, ΦU1 – I1, ΦU2 – I2, and ΦU3 – I3, respectively.
2 Setting i to an input element, is the same as setting k to 1 in Φ(k).
IM WT1801-01EN
1-3
1 Items That This Instrument Can Measure
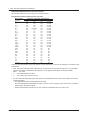
Harmonic Measurement Function Orders
The harmonic orders that you can specify are indicated below.
Input Element Harmonic Measurement Functions
Measurement
Function
U( )
I( )
P( )
S( )
Q( )
λ( )
Φ( )
ΦU( )
ΦI( )
Z( )
Rs( )
Xs( )
Rp( )
Xp( )
Uhdf( )
Ihdf( )
Phdf( )
Uthd
Ithd
Pthd
Uthf
Ithf
Utif
Itif
hvf
hcf
K-factor
Characters or Numbers in Parentheses
Total
0 (DC)
1
k
Yes
Yes
Yes
2 to 500
Yes
Yes
Yes
2 to 500
Yes
Yes
Yes
2 to 500
Yes
Yes
Yes
2 to 500
Yes
Fixed at 0
Yes
2 to 500
Yes
Yes
Yes
2 to 500
Yes
No
Yes
2 to 500
No
No
No
2 to 500
No
No
No
2 to 500
No
Yes
Yes
2 to 100
No
Yes
Yes
2 to 100
No
Yes
Yes
2 to 100
No
Yes
Yes
2 to 100
No
Yes
Yes
2 to 100
No
Yes
Yes
2 to 500
No
Yes
Yes
2 to 500
No
Yes
Yes
2 to 500
Yes
No
No
No
Yes
No
No
No
Yes
No
No
No
Yes
No
No
No
Yes
No
No
No
Yes
No
No
No
Yes
No
No
No
Yes
No
No
No
Yes
No
No
No
Yes
No
No
No
Functions with parentheses will produce different values depending on which of the following is contained in their
parentheses.
• Total: Total value (The total value of all harmonic components from the minimum order to N.* For information
about how the value is determined, see appendix 1 in the getting started guide, IM WT1801-03EN.)
• 0(DC): DC value
• 1:
Fundamental harmonic value
• k:
The value of any order from 2 to N.*
* N is the maximum measurable order. The maximum measurable harmonic order is the smallest of the three
orders listed below.
• The specified maximum measurable harmonic order
• The value determined automatically according to the PLL source frequency (see section 6.4 in the getting
started guide, IM WT1801-03EN)
• When the data update interval is 50 ms, the maximum measurable harmonic order is 100.
1-4
IM WT1801-01EN
1 Items That This Instrument Can Measure
Wiring Unit Harmonic Measurement Functions (Σ functions)
Measurement Characters or Numbers
Function
in Parentheses
Total
1
UΣ( )
Yes
Yes
IΣ( )
Yes
Yes
PΣ( )
Yes
Yes
SΣ( )
Yes
Yes
QΣ( )
Yes
Yes
λΣ( )
Yes
Yes
Functions with parentheses will produce different values depending on which of the following is contained in their
parentheses.
• Total:
Total value
• 1:
Fundamental harmonic value
Delta Computation Functions (Option)
Function
ΔU1
ΔU2
ΔU3
ΔUΣ
ΔI
ΔP1
ΔP2
ΔP3
ΔPΣ
Description
The values returned by the delta computation
functions vary depending on the specified delta
computation type.
For details about delta computation functions, see “Delta Computation (Δ Measure; optional).”
Click here.
Motor Evaluation Functions (Option)
Function
Speed
Torque
SyncSp
Slip
Pm
EaU1 to 6*
EaI1 to 6*
Description
Motor rotating speed
Motor torque
Synchronous speed
Slip (%)
Mechanical output of the motor (mechanical power)
Electrical angle: Phase angles of U1 to I6 with the
falling edge of the signal received through the Z
terminal of the motor evaluation function as the
reference.
*On models with the harmonic measurement option or the simultaneous dual harmonic measurement
option.
Auxiliary Input Measurement Functions (Option)
Function
Aux1
Aux2
Description
Auxiliary input 1
Auxiliary input 2
High Speed Data Capturing Measurement Functios (Option)
•
•
•
•
•
For the U and I of each input element and wiring unit: Select rms, mean, dc, or r-mean.
The P of each input element and wiring unit
Motor evaluation function (option) speed, torque, and Pm
Auxiliary inputs (option) Aux1 and Aux2
The maximum and minimum values of the above measurement functions
IM WT1801-01EN
1-5
1 Items That This Instrument Can Measure
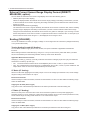
What Is a Measurement Function?
Measurement Function
The physical values (such as rms voltage, average current, power, and phase difference) that the WT1800
measures and displays are called measurement functions. Each measurement function is displayed using
symbols that correspond to its physical value. For example, “Urms” corresponds to the true rms voltage.
Element
Element refers to a set of input terminals that can receive a single phase of voltage and current to be measured.
The WT1800 can contain up to six elements, numbered from 1 to 6. An element number is appended to the
measurement function symbol for the measured data that the WT1800 displays, so that you can tell which data
belongs to which element. For example, “Urms1” corresponds to the true rms voltage of element 1.
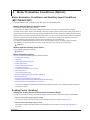
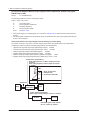
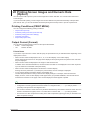
Wiring System
You can specify five wiring systems on the WT1800 to measure the power of various single-phase and threephase power transmission systems: single-phase, two-wire; single-phase, three-wire; three-phase, three-wire;
three-phase, four-wire; and three-phase, three-wire with three-voltage, three-current method.
Wiring Unit
The wiring unit is a set of two or three input elements of the same wiring system that are grouped to measure
three-phase power. There can be up to three wiring units: ΣA, ΣB, and ΣC.
Click here.
Σ Functions
The measurement function of a wiring unit is called a Σ function.
For example, “UrmsΣA” corresponds to the average of the voltages of the input elements that are assigned to
the wiring unit ΣA. The average value represents the true rms value.
Click here.
Element
1
Element
2
Element Element
3
4
Element
5
Element
6
Voltage input
Current input
Wiring system
Wiring unit
Three-phase,
three-wire
ΣA
Three-phase,
three-wire
ΣB
Three-phase,
three-wire
ΣC
Measurement Period
For information about the measurement period for computing measurement functions, see “Measurement Period
(SYNC SOURCE).”
Click here.
1-6
IM WT1801-01EN
2 Fundamental Measurement Conditions
Wiring System Settings (WIRING)
The wiring system settings are listed below.
• Wiring system (Wiring)
• Efficiency equation (η Formula)
• Independent input element configuration (Element Independent)
• Delta computation (Δ Measure; option)
Wiring System (Wiring)
There are five wiring systems available on the WT1800. The selectable wiring systems vary depending on the
number of installed input elements.
• 1P2W: Single-phase, two-wire system
• 1P3W: Single-phase, three-wire system
• 3P3W: Three-phase, three-wire system
• 3P4W: Three-phase, four-wire system
• 3P3W(3V3A):
Three-voltage, three-current method
Wiring Unit
Wiring units are sets of two or three input elements of the same wiring system that are grouped together. You
can define up to three wiring units: ΣA, ΣB, and ΣC.
• When there is one wiring unit, that unit is ΣA. You cannot make ΣB or ΣC the first wiring unit.
• When there are two wiring units, those units are ΣA and ΣB. You cannot make ΣC one of the first two wiring
units.
• When there are three wiring units, those units are ΣA, ΣB, and ΣC.
• When there are multiple wiring units, element numbers are assigned to them in ascending order. The element
numbers are assigned to ΣA, ΣB, and then ΣC.
• Wiring units are composed of input elements that are next to each other. Wiring units cannot consist of input
elements that are not next to each other.
• A wiring unit must either be composed of only 50 A input elements or only 5 A input elements. Wiring units
cannot consist of different types of input elements.
Σ Functions
The measurement function of a wiring unit is called a Σ function.
For example, “UrmsΣA” corresponds to the average of the voltages of the input elements that are assigned to
the wiring unit ΣA. The average value represents the true rms value.
Wiring System Combinations
The following tables provide examples of the wiring system combinations that you can use and the input
elements that you can assign to wiring system ΣA, ΣB, or ΣC depending on the number of installed input
elements. In addition to the combinations indicated in the tables below, you can also configure any pattern that
meets the conditions for wiring units described above.
For details about the relationship between wiring systems and how the values of the measurement functions are
determined, see appendix 1 in the getting started guide, IM WT1801-03EN.
IM WT1801-01EN
2-1
2 Fundamental Measurement Conditions
Input Element
Wiring system
combination
1
1P2W
Input Element
Wiring system
combination
1
2
1P2W
1P2W
1P3W or 3P3W:ΣA
Input Element
Wiring system
combination
1
2
3
1P2W
1P2W
1P2W
1P3W or 3P3W:ΣA
1P2W
1P2W
1P3W or 3P3W:ΣA
3P4W or 3P3W:ΣA
Input Element
Wiring system
combination
1
2
3
4
1P2W
1P2W
1P2W
1P2W
1P3W or 3P3W:ΣA
1P3W or 3P3W:ΣB
3P4W or 3P3W:ΣA
1P2W
1P2W
3P4W or 3P3W:ΣA
Input Element
Wiring system
combination
1
2
3
4
5
1P2W
1P2W
1P2W
1P2W
1P2W
1P3W or 3P3W:ΣA
1P3W or 3P3W:ΣB
1P2W
1P3W or 3P3W:ΣA
3P4W or 3P3W(3V3A):ΣB
3P4W or 3P3W:ΣA
1P3W or 3P3W:ΣB
Input Element
Wiring system
combination
1
2
3
4
5
6
1P2W
1P2W
1P2W
1P2W
1P2W
1P2W
1P3W or 3P3W:ΣA
1P3W or 3P3W:ΣB
1P3W or 3P3W:ΣC
1P3W or 3P3W:ΣA
3P4W or 3P3W(3V3A):ΣB
1P2W
3P4W or 3P3W:ΣA
1P3W or 3P3W:ΣB
1P2W
3P4W or 3P3W:ΣA
3P4W or 3P3W(3V3A):ΣB
Select the wiring system to match the actual wiring of the circuit under measurement. The method in which
the Σ functions (wiring unit measurement functions) are determined varies depending on the wiring system. If
the selected wiring system does not match the wiring of the actual circuit, measurements and computation will
not be correct.
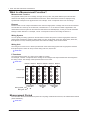
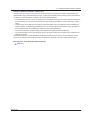
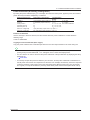
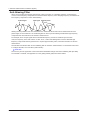
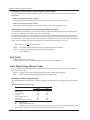
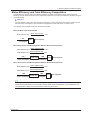
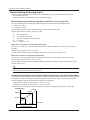
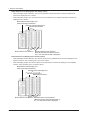
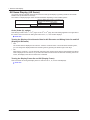
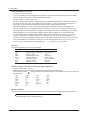
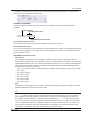
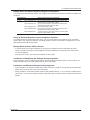
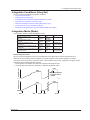
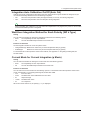
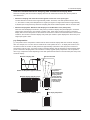
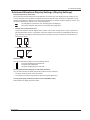
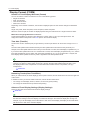
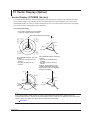
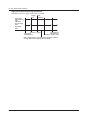
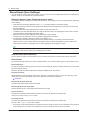
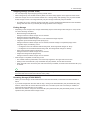
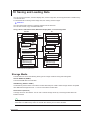
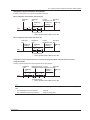
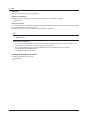
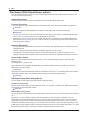
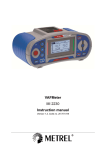
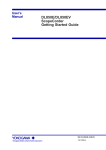
Wiring System Display
The wiring system configuration is displayed on the right side of the screen. Because it is displayed behind the
menu, to view it, you need to press the ESC key to hide the menu. The figure below shows wiring system display
examples for a model with six input elements installed.
When the wiring systems
of elements 1 to 6 are set
to single-phase, two-wire
When the wiring system of elements 1, 2,
and 3 is set to three-phase, four-wire and the
wiring system of elements 4 and 5 is set to
three-phase, three-wire
Wiring unit and system
The elements that compose
the wiring unit are shown
in the frame.
Wiring unit and system
The elements that compose
the wiring unit are shown
in the frame.
2-2
IM WT1801-01EN
2 Fundamental Measurement Conditions
Settings of Elements Grouped in a Wiring Unit
If independent input element configuration is off and a wiring system other than 1P2W is selected when the
measurement range, valid measurement range, or valid synchronization source settings of each input element
are different, these settings are changed in the manner described below:
• The measurement range is set to the greatest of the measurement ranges of the input elements assigned to
the same wiring unit. The external current sensor input range has precedence over the direct input current
range.
• The auto range on/off settings are changed to match the setting of the input element whose measurement
range is highest. If multiple input elements are set to a common highest measurement range, the setting of
the input element with the smallest input element number takes precedence.
• In the valid measurement range settings, all measurement ranges are enabled (selected).
• The synchronization source for a wiring unit is set to the input element whose number is the smallest of the
elements in the unit.
At the same time that you press ELEMENT to select the element that you want to set the voltage or current
range of, the indicators for the input elements that have been assigned to the same wiring unit illuminate.
Wiring System during High Speed Data Capturing
Click here.
IM WT1801-01EN
2-3
2 Fundamental Measurement Conditions
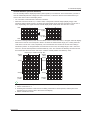
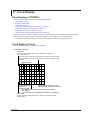
Efficiency Equation (η Formula)
You can create an efficiency equation by combining measurement function symbols. The WT1800 can determine
the energy conversion efficiency of the device using the numeric values of the measurement functions.
η1 to η4
You can create four efficiency equations (η1 to η4), using the following measurement functions as operands.
• The active powers of each element (P1 to P6)
• The active powers of the Σ functions (PΣA to PΣC)
• The motor output (Pm; on models with the motor evaluation option)
• Udef1 and Udef2
Udef1 and Udef2
To add active powers and motor output and use them in η1 to η4, use Udef1 and Udef2. You can add up to four
operands consisting of the measurement functions listed above.
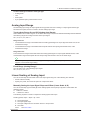
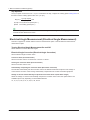
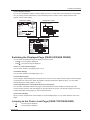
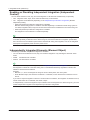
Equation Examples
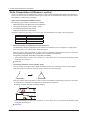
• Efficiency of a Single-Phase, Two-Wire Input/Single-Phase, Two-Wire Output Device
Input: Power of element 1 (P1)
Output: Power of element 2 (P2)
Efficiency equation: P2/P1 × 100 (%)
Input power: P1
Converter
(inverter, etc.)
Output power: P2
• Efficiency of a Single-Phase, Two-Wire Input/Three-Phase, Three-Wire Output Device
Input: Power of element 1 (P1)
Output: Σ power of elements 2 and 3 (PΣA)
Efficiency equation: PΣA/P1 × 100 (%)
• Efficiency of a Three-Phase, Three-Wire Input/Three-Phase, Three-Wire Output Device
Input: Σ power of elements 1 and 2 (PΣA)
Output: Σ power of elements 3 and 4 (PΣB)
Efficiency equation: PΣB/PΣA × 100 (%)
• Efficiency of a Motor with a Single-Phase, Two-Wire Input
Input: Power of element 1 (P1)
Output: Motor output (Pm)
Efficiency equation: Pm/P1 × 100 (%)
• Efficiency of a Motor with a Three-Phase, Three-Wire Input
Input: Σ power of elements 1 and 2 (PΣA)
Output: Motor output (Pm)
Efficiency equation: Pm/PΣA × 100 (%)
To correctly compute the efficiency, set the power coefficients of all elements so that all power units used in
the computation are the same. For example, the efficiency cannot be computed correctly if elements or wiring
units used in the computation have different power units, such as W (watt) and J (joule).
2-4
IM WT1801-01EN
2 Fundamental Measurement Conditions
Independent Input Element Configuration (Element Independent)
In the wiring system settings, you can select whether to set the measurement range or sync source of input
elements in the same wiring unit collectively or independently.
Turning Independent Input Element Configuration On or Off
For example, assume that the wiring system on a model with three input elements is set as follows:
Input elements 1 to 3: Three-phase, four-wire system (3P4W). Input elements 1 to 3 are assigned to a single
wiring unit ΣA.
• ON
The measurement range and sync source can be set independently for each input element included in a
wiring unit.
• OFF
The measurement range and sync source of input elements 1 to 3 are set to the same setting. This is
convenient because when you are measuring a three-phase device, you can set the range and sync source
settings of all input elements included in a wiring unit simultaneously.
Settings That Are Shared between Input Elements When Independent Input Element Configuration Is
Turned Off
•
•
•
•
•
Measurement range (including auto range on or off)
Direct current input or external current sensor input
Valid measurement range
Synchronization source
Input element group for harmonic measurement (applies to models with the simultaneous dual harmonic
measurement option).
Settings That Can Be Configured Independently Even When Independent Input Element Configuration Is
Turned Off
• External current sensor conversion ratio (option)
• Scaling values (VT ratio, CT ratio, and power coefficient)
• Input filters (line filter and frequency filter)
These settings can be configured independently for each input element regardless of whether independent input
element configuration is turned on or off.
How Settings Are Aligned When You Turn Independent Input Element Configuration from On to Off
When independent input element configuration is switched from on to off, the measurement range, valid
measurement range, and sync source settings of each input element in a wiring unit (ΣA, ΣB, or ΣC) are
changed as follows:
• The measurement range is set to the greatest of the measurement ranges of the input elements assigned to
the same wiring unit. The external current sensor input range has precedence over the direct input current
range.
• The auto range on/off settings are changed to match the setting of the input element whose measurement
range is highest. If multiple input elements are set to a common highest measurement range, the setting of
the input element with the smallest input element number takes precedence.
• In the valid measurement range settings, all measurement ranges are enabled (selected).
• The synchronization source for a wiring unit is set to the input element whose number is the smallest of the
elements in the unit.
IM WT1801-01EN
2-5
2 Fundamental Measurement Conditions
Delta Computation (Δ Measure; option)
The sum or difference of the instantaneous voltage or current values (sampled data) between the elements in
a wiring unit can be used to determine various types of data such as the differential voltage and phase voltage.
This operation is called delta computation.
Types of Delta Computation (ΔMeasure Type)
The following types of delta computation are available:
• Differential voltage and differential current (Difference)
• Line voltage and phase current (3P3W > 3V3A)
• Star-delta transformation (Star>Delta)
• Delta-star transformation (Delta>Star)
The delta computation types that you can select vary as indicated below according to the wiring system.
Wiring System
1P3W
3P3W
3P4W
3P3W(3V3A)
Delta Computation Type
Difference, 3P3W>3V3A
Difference, 3P3W>3V3A
Star>Delta
Delta>Star
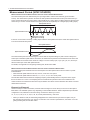
• Differential Voltage and Differential Current (Difference)
The differential voltage and differential current between two elements can be computed on a single-phase,
three-wire system or on a three-phase, three-wire system.
When you perform delta computation on wiring unit ΣA, the available measurement functions are as follows.
ΔU1rms[UdiffA], ΔU1mn[UdiffA], ΔU1dc[UdiffA], ΔU1rmn[UdiffA], ΔU1ac[UdiffA]
ΔIrms[IdiffA], ΔImn[IdiffA], ΔIdc[IdiffA], ΔIrmn[IdiffA], ΔIac[IdiffA]
* In the measurement functions, rms, mn(mean), dc, rmn(r-mean), and ac are the delta computation modes.
A indicates the wiring unit.
Click here.
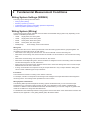
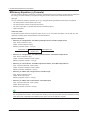
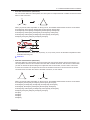
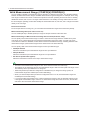
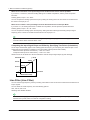
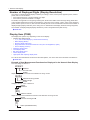
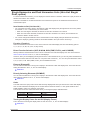
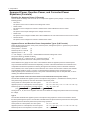
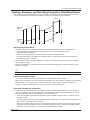
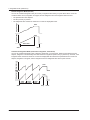
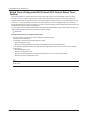
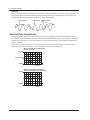
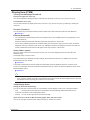
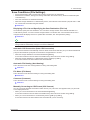
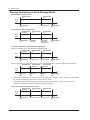
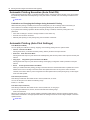
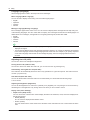
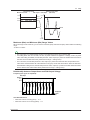
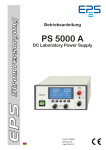
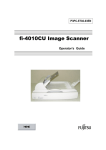
• Line Voltage and Phase Current (3P3W > 3V3A)
You can compute unmeasured line voltages and phase currents by converting the data of a three-phase,
three-wire system to the data of the three-voltage, three-current method (3V3A).
R
T
R
S
T
S
When you perform delta computation on wiring unit ΣA, the available measurement functions are as follows.
ΔU1rms[UrsA], ΔU1mn[UrsA], ΔU1dc[UrsA], ΔU1rmn[UrsA], ΔU1ac[UrsA]
ΔIrms[ItA], ΔImn[ItA], ΔIdc[ItA], ΔIrmn[ItA], ΔIac[ItA]
I
R
I1
±
U
U1
Urs
T
N
±
S
I
It
I2
±
U
U2
±
* In the measurement functions, rms, mn(mean), dc, rmn(r-mean), and ac are the delta computation modes.
A indicates the wiring unit.
Click here.
2-6
IM WT1801-01EN
2 Fundamental Measurement Conditions
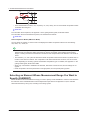
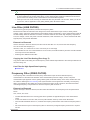
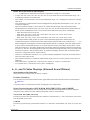
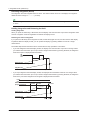
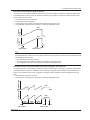
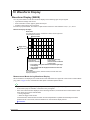
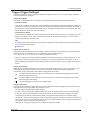
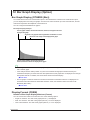
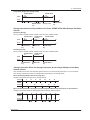
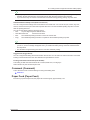
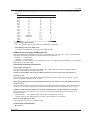
• Star-delta transformation (Star>Delta)
You can use the data from a three-phase, four-wire system to compute the data of a delta connection from the
data of a star connection.
R
R
T
T
S
S
When you perform delta computation on wiring unit ΣA, the available measurement functions are as follows.
ΔU1rms[UrsA], ΔU1mn[UrsA], ΔU1dc[UrsA], ΔU1rmn[UrsA], ΔU1ac[UrsA]
ΔU2rms[UstA], ΔU2mn[UstA], ΔU2dc[UstA], ΔU2rmn[UstA], ΔU2ac[UstA]
ΔU3rms[UtrA], ΔU3mn[UtrA], ΔU3dc[UtrA], ΔU3rmn[UtrA], ΔU3ac[UtrA]
ΔUΣrms[UΣA], ΔUΣmn[UΣA], ΔUΣdc[UΣA], ΔUΣrmn[UΣA], ΔUΣac[UΣA]
ΔIrms[InA], ΔImn[InA], ΔIdc[InA], ΔIrmn[InA], ΔIac[InA]
I
R
Urs
Utr
N
T
Ust
I1
±
U
U1
±
In
U3
S
I
I
I2
I3
±
±
U
U2
±
U
±
* In the measurement functions, rms, mn(mean), dc, rmn(r-mean), and ac are the delta computation modes.
A indicates the wiring unit.
Click here.
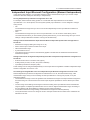
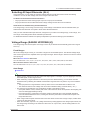
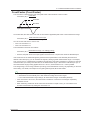
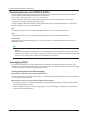
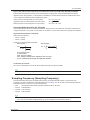
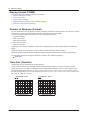
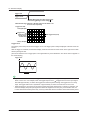
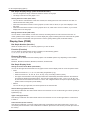
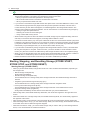
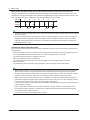
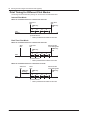
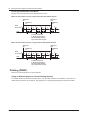
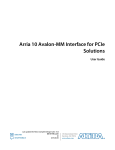
• Delta-star transformation (Delta>Star)
Using the data from a three-phase, three-wire system that uses a three-voltage, three-current method, you
can compute the data of a star connection from the data of a delta connection. This function is useful when
you wish to observe the phase voltage of an object that has no neutral line, such as a motor. The center
N of the star connection is computed as the center of the delta connection. If the actual center of the star
connection does not match the center of the delta connection, an error results.
R
T
R
S
T
S
When you perform delta computation on wiring unit ΣA, the available measurement functions are as follows.
ΔU1rms[UrA], ΔU1mn[UrA], ΔU1dc[UrA], ΔU1rmn[UrA], ΔU1ac[UrA]
ΔU2rms[UsA], ΔU2mn[UsA], ΔU2dc[UsA], ΔU2rmn[UsA], ΔU2ac[UsA]
ΔU3rms[UtA], ΔU3mn[UtA], ΔU3dc[UtA], ΔU3rmn[UtA], ΔU3ac[UtA]
ΔUΣrms[UΣA], ΔUΣmn[UΣA], ΔUΣdc[UΣA], ΔUΣrmn[UΣA], ΔUΣac[UΣA]
ΔIrms[InA], ΔImn[InA], ΔIdc[InA], ΔIrmn[InA], ΔIac[InA]
ΔP1[PrA]
ΔP2[PsA]
ΔP3[PtA]
ΔPΣ[PΣA]
IM WT1801-01EN
2-7
2 Fundamental Measurement Conditions
I
R
I1
±
U
U
U3 U1
Ur
Ut
T
N
Us
±
In
S
I
I
I2
±
I3 ±
±
U
U2
±
* In the measurement functions, rms, mn(mean), dc, rmn(r-mean), and ac are the delta computation modes.
A indicates the wiring unit.
Click here.
For information about equations, see appendix 1 in the getting started guide, IM WT1801-03EN.
For information about the measurement period, see “Measurement Period.”
Click here.
Delta Computation Modes (ΔMeasure Mode)
You can select the voltage or current mode to be displayed as delta computation values from the following:
rms, mean, dc, r−mean, ac
• We recommend that you set the measurement range and scaling (VT/CT ratio and coefficients) of the
elements that are undergoing delta computation as closely as possible. Using different measurement
ranges or scaling causes the measurement resolutions of the sampled data to be different. This results in
errors.
• The numbers (1, 2, and 3) that are attached to delta computation measurement function symbols have no
relation to the element numbers. The computation of all delta measurement functions, from ΔU1 to ΔPΣ,
varies depending on the wiring system and the delta computation type. For details, see appendix 1 in the
getting started guide, IM WT1801-03EN.
• When only one element is installed in the WT1800, this feature cannot be used, and its settings do not
appear.
• Delta computation cannot be performed on a single-phase, two-wire (1P2W) wiring system.
Selecting an Element Whose Measurement Range You Want to
Specify (ELEMENT)
Select an element whose measurement range you want to specify. Press ELEMENT to switch in order between
the indicators of the installed elements. When independent input element configuration is off, the selected
elements will switch by wiring unit, according to the wiring system.
2-8
IM WT1801-01EN
2 Fundamental Measurement Conditions
Selecting All Input Elements (ALL)
At the same time, you can select the currently selected element and all elements that meet the following
conditions. You can set their voltage and current ranges at the same time.
Conditions for Simultaneous Element Selection
• Only input elements of the same type (50 A input or 5 A input) can be selected.
• Only input elements whose valid measurement range settings are the same can be selected.
Initial Values for Simultaneously Selected Elements
The voltage range, current range, and auto range on/off settings of the element that was selected before you
selected the other elements are copied to all the other selected elements.
After you have selected all the input elements, changes that you make to the voltage range, current range, and
auto range on/off settings affect all the selected input elements.
To disable simultaneous selection and specify independent input element settings, press ELEMENT.
Voltage Range (RANGE UP/DOWN (V))
The voltage range can be fixed (when auto range is set to off) or determined automatically (when auto range is
set to on).
Fixed Ranges
When the voltage range is fixed, you can select a range from the available options. The selected voltage range
does not change even if the amplitude of the input signal changes. Set the range in reference to the rms value of
the input signal.
When the Crest Factor Is Set to CF3
You can select from 1.5 V, 3 V, 6 V, 10 V, 15 V, 30 V, 60 V, 100 V, 150 V, 300 V, 600 V, and 1000 V.
When the Crest Factor Is Set to CF6
You can select from 0.75 V, 1.5 V, 3 V, 5 V, 7.5 V, 15 V, 30 V, 50 V, 75 V, 150 V, 300 V, and 500 V.
Auto Range
Click here.
• Set the range in reference to the rms value of the input signal. For example, if you are applying a 100-Vrms
sinusoidal signal, set the range to 100 V.
• When measuring a signal other than a sine wave (such as a distorted wave), you can obtain accurate
measurements by selecting the smallest measurement range that does not produce any of the conditions
below.
• The input peak over-range indicator at the top center of the screen illuminates or blinks in red.
• The measured values of the voltage and current are indicated as being overload values (“-OL-”).
• The peak over-range indicator may not illuminate or blink in the following cases.
• If the pulse width is narrow, and the peak value of the waveform cannot be acquired at the sampling rate
of the WT1800 (approximately 2 Ms/S).
• If the high frequency components of the pulse waveform attenuate due to the bandwidth limitations
of the WT1800 measurement circuit, causing the waveform peak value to be less than the peak overrange detection level.
• When a signal with the peak which becomes more than about 10 times of the range is input, it takes about
1 second to change the range.
• When the secondary output of a VT (voltage transformer) is being applied to the voltage input terminal, set
the voltage range according to the maximum value of the VT output. Then, use the scaling feature to set
the VT ratio.
IM WT1801-01EN
2-9
2 Fundamental Measurement Conditions
• To display a list of the range settings of all input elements, see “Displaying the Setup Parameter List.” You
can change measurement ranges from the list.
Click here.
Auto Voltage Range (AUTO (V))
When you press AUTO, the AUTO key illuminates, and the range is set automatically. The measurement range is
switched automatically depending on the amplitude of the input signal as described below. The different ranges
used in the auto range are the same as those available for the fixed range.
Range Increase
The measurement range is increased when any of the following conditions is met.
• The data of measurement function Urms or Irms exceeds 110% of the measurement range.
• The crest factor is set to CF3 and the data of Upk* or Ipk* exceeds 330% of the current measurement range.
• The crest factor is set to CF6 and the data of Upk* or Ipk* exceeds 660% of the current measurement range.
• If all the installed input elements are selected (all the element indicators are illuminated), the measurement
range is increased on all input elements when any of the elements meets the range-increase conditions
described above.
• When a wiring unit is configured, the measurement range is increased on all input elements in the wiring unit
when any of the elements in the unit meets the range-increase conditions described above.
Range Decrease
The measurement range is decreased when all the following conditions are met.
• The data of Urms or Irms is less than or equal to 30% of the measurement range.
• The data of Urms or Irms is less than or equal to 105% of the next lower range.
• The crest factor is set to CF3 and the data of Upk* or Ipk* is less than or equal to 300% of the next lower
range.
• The crest factor is set to CF6 and the data of Upk* or Ipk* is less than or equal to 600% of the next lower
range.
* Even if the NULL feature is on, the values are determined as if it were off.
• If all the installed input elements are selected (all the element indicators are illuminated) and meet the rangedecrease conditions described above, all their measurement ranges are decreased.
• When a wiring unit is configured and all the elements in the unit meet the range-increase conditions described
above, all their measurement ranges are increased.
• If you disable a measurement range in the valid measurement range settings, that measurement range is
skipped, and the auto range feature operates using only the valid measurement ranges.
• When non-periodic pulse waveforms are applied, the range may not remain constant. If this happens, use
the fixed range setting.
2-10
IM WT1801-01EN
2 Fundamental Measurement Conditions
Current Range (RANGE UP/DOWN (A))
The current range can be fixed (when auto range is set to off) or determined automatically (when auto range is
set to on).
Fixed Ranges
When the current range is fixed, you can select a range from the available options. The selected current range
does not change even if the amplitude of the input signal changes. Set the range in reference to the rms value of
the input signal.
For 5 A Input Elements
• When the Crest Factor Is Set to CF3
You can select from 10 mA, 20 mA, 50 mA, 100 mA, 200 mA, 500 mA, 1 A, 2 A, and 5 A.
• When the Crest Factor Is Set to CF6
You can select from 5 mA, 10 mA, 25 mA, 50 mA, 100 mA, 250 mA, 500 mA, 1 A, and 2.5 A.
For 50 A Input Elements
• When the Crest Factor Is Set to CF3
You can select from 1 A, 2 A, 5 A, 10 A, 20 A, and 50 A.
• When the Crest Factor Is Set to CF6
You can select from 500 mA, 1 A, 2.5 A, 5 A, 10 A, and 25 A.
Auto Range
This is the same as the auto range feature for voltage.
Click here.
• When the secondary output of a CT (current transformer) or a clamp-type current sensor that outputs
current is being applied to the current input terminal, set the current range according to the maximum value
of the CT or current sensor output. Then, use the scaling feature to set the CT ratio or the conversion ratio
of the clamp-type current sensor that outputs current.
Auto Current Range (AUTO (A))
This is the same as the auto range feature for voltage.
Click here.
IM WT1801-01EN
2-11
2 Fundamental Measurement Conditions
Power Range
The measurement ranges (power ranges) of active power (P), apparent power (S), and reactive power (Q) are
as follows:
Wiring System
1P2W (single-phase, two-wire system)
1P3W (single-phase, three-wire system)
3P3W (three-phase, three-wire system)
3P3W (3V3A; three-voltage, threecurrent method)
3P4W (three-phase, four-wire system)
Power Range
Current range × voltage range
Voltage range × current range × 2
(when the voltage and current ranges on the
elements in the wiring unit are set to the same range)
Voltage range × current range × 3
(when the voltage and current ranges on the
elements in the wiring unit are set to the same range)
• When the result of the equation voltage range × current range exceeds 1000 W (VA or var), the displayed unit
changes to kW (kVA or kvar).
• Number of displayed digits (display resolution)
Click here.
For a detailed list of the available voltage and current range combinations and power ranges when all the
elements have the same voltage or current range, see appendix 4 in the getting started guide, IM WT180103EN.
In auto range mode, because the voltage and current ranges switch independently according to range
increase and decrease conditions, different power ranges may be set for the same power value.
External Current Sensor Range (EXT SENSOR; option)
The output of current sensors that produce voltage, such as shunts and clamps, can be applied to an element’s
external current sensor input connector (EXT) and measured. Press EXT SENSOR so that it illuminates, and
then set the external current sensor range.
The external current sensor range can be fixed (when auto range is set to off) or determined automatically (when
auto range is set to on).
Fixed Ranges
When the current range is fixed, you can select a range from the available options. The selected current range
does not change even if the amplitude of the input signal changes. Set the range in reference to the rms value of
the input signal.
• When the Crest Factor Is Set to CF3
You can select from 50 mV, 100 mV, 200 mV, 500 mV, 1 V, 2 V, 5 V, and 10 V.
• When the Crest Factor Is Set to CF6
You can select from 25 mV, 50 mV, 100 mV, 250 mV, 500 mV, 1 V, 2.5 V, and 5 V.
Auto Range
This is the same as the auto range feature for voltage.
Click here.
2-12
IM WT1801-01EN
2 Fundamental Measurement Conditions
External Current Sensor Conversion Ratio (SENSOR RATIO;
option)
Set the conversion ratio used to measure the signal received by the external current sensor input connector (EXT)
from a current sensor that produces voltage. Set how many millivolts the current sensor transmits when 1 A of
current is applied (conversion ratio). Then, the input signal can be made to correspond to the numeric data or
waveform display data that is obtained when the current is directly applied to the input terminals. When using a
current sensor that produces current, set the conversion ratio as the CT ratio.
Click here.
Measurement Function
Current I
Active power P
Apparent power S
Reactive power Q
Max./min. current Ipk
Conversion
Ratio
E
E
E
E
E
Data before
Transformation
IS (current sensor output)
PS
SS
QS
IpkS (current sensor output)
Transformation
Result
IS/E
PS/E
SS/E
QS/E
IpkS/E
Element1 to Element6
Use the soft keys to select an element, and then set the element’s external current sensor conversion ratio to a
value within the following range.
0.0001 to 99999.9999
Copying the External Current Sensor Conversion Ratio (Exec Copy Σ)
Copy the external current sensor conversion ratio of the selected input element to the other input elements in the
same wiring unit.
External Current Sensor Range and Conversion Ratio Configuration Example
When you measure a current with a maximum value of 100 A using a current sensor that produces 10 mV
when 1 A of current is flowing, the maximum voltage that the current sensor produces is 10 mV/A × 100 A = 1 V.
Therefore, configure the settings as indicated below.
• External current sensor range: 1 V
• External current sensor conversion ratio: 10 mV/A
• When you want to divide the external current sensor output by the conversion ratio and read the current of
the circuit under measurement directly, turn the external VT/CT scaling feature off. If the feature is turned
on, the value will be further multiplied by the CT ratio.
• When you are measuring a signal other than a sine wave (such as a distorted wave), you can obtain
accurate measurements by selecting the smallest measurement range that does not produce any of the
conditions below.
• The input peak over-range indicator at the top center of the screen illuminates or blinks in red.
• The measured values of the voltage and current are indicated as being overload values (“-OL-”).
IM WT1801-01EN
2-13
2 Fundamental Measurement Conditions
External Current Sensor Range Display Format (DIRECT/
MEASURE; option)
You can select the external current sensor range display format from the following options.
• DIRECT (direct input value display)
Values are displayed within the external current sensor range (voltage). This setting is useful when you want
to set the external current sensor range using the voltage received by the WT1800 from the external current
sensor as a guide.
• MEASURE (measurement range display)
The external current sensor range is divided by the external current sensor conversion ratio, and the resulting
(current) range is displayed. This setting is useful when you want to set the external current sensor range
using the current measured by the external current sensor as a guide. For example, if you are using a current
sensor that produces 10 mV when it receives 1 A (external current sensor conversion ratio: 10 mV/A) and you
set the external current sensor range to 1 V, the displayed current range is 100 A.
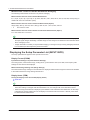
Scaling (SCALING)
You can set coefficients for when you apply a voltage or current signal from an external VT (voltage transformer)
or CT (current transformer).
Turning Scaling On and Off (Scaling)
You can select whether to apply the VT ratio, CT ratio, and power coefficient to applicable measurement
functions.
When reading measured values directly by using a VT or CT (or current sensor), select ON. When you select
ON, the SCALING key and the Scaling indicator at the top of the screen illuminate.
Applicable Measurement Functions
Voltage (U), current (I), power (P, S, and Q), maximum and minimum voltages (U+pk and U-pk), and maximum
and minimum currents (I+pk and I-pk)
• ON: The measurement functions above are multiplied by the VT ratio, CT ratio, or power coefficient.
• OFF: The measurement functions above are not multiplied by the VT ratio, CT ratio, or power coefficient. The
output values of the VT and CT are displayed directly as numeric data.
VT Ratio (VT Scaling)
Set the VT ratio when applying the secondary output of a VT to the voltage input terminal. Then, set the voltage
range according to the maximum VT output.
Element1 to Element6
Use the soft keys to select an element, and then set the element’s VT ratio to a value within the following range.
0.0001 to 99999.9999
Copying the VT Ratio (Exec Copy Σ)
Copy the VT ratio of the selected input element to the other input elements in the same wiring unit.
CT Ratio (CT Scaling)
Set the CT ratio (or the conversion ratio of the current sensor that produces current) when applying the
secondary output of a CT or clamp-type current sensor that produces current to the current input terminal. Then,
set the current range according to the maximum CT or current sensor output.
Element1 to Element6
Use the soft keys to select an element, and then set the element’s CT ratio to a value within the following range.
0.0001 to 99999.9999
Copying the CT Ratio (Exec Copy Σ)
Copy the CT ratio of the selected input element to the other input elements in the same wiring unit.
2-14
IM WT1801-01EN
2 Fundamental Measurement Conditions
Power Coefficient (SF Scaling; scaling factor)
By setting the power coefficient (SF), you can display the measured active power, apparent power, and reactive
power after they have been multiplied by a coefficient.
Measurement Function
Voltage U
Current I
Active power P
Apparent power S
Reactive power Q
Max./min. voltage Upk
Max./min. current Ipk
Data before Transformation
Transformation
Result
U2 (secondary output of the VT)
U2 × V
V: VT ratio
I2 (secondary output of the CT)
I2 × C
C: CT ratio
P2
P2 × V × C × SF SF: Power coefficient
S2
S2 × V × C × SF
Q2
Q2 × V × C × SF
Upk2 (secondary output of the VT) Upk2 × V
Ipk2 (secondary output of the CT) Ipk2 × C
Element1 to Element6
Use the soft keys to select an element, and then set the element’s power coefficient to a value within the
following range.
0.0001 to 99999.9999
Copying the Power Coefficient (Exec Copy Σ)
Copy the power coefficient of the selected input element to the other input elements in the same wiring unit.
• If the value of the result of multiplying the measured value by the VT ratio, CT ratio, or power coefficient
(scaling factor) exceeds 9999.99 M, “-OF-” will appear in the numeric data display frame.
• You can view the VT and CT ratios and the power coefficients of all input elements by displaying the setup
parameter list.
Click here.
• To correctly compute the power and efficiency of Σ functions, set the power coefficients of all elements so
that all power units used in the computation are the same. For example, the efficiency cannot be computed
correctly if elements or wiring units used in the computation have different power units, such as W (watt)
and J (joule). To compute the efficiency correctly, make all the power units the same (either all W or all J).
IM WT1801-01EN
2-15
2 Fundamental Measurement Conditions
Valid Measurement Range (CONFIG(V)/CONFIG(A))
You can enable or disable a measurement range by selecting or clearing its check box. The WT1800 switches
between enabled measurement ranges. Disabled measurement ranges are skipped. For example, when using
auto range to measure the current of a device that produces 2 A when operating and 100 mA when in standby,
disable the 200 mA, 500 mA, and 1 A ranges. When the device is in standby, the range will be 200 mA. When
the device begins operating, the WT1800 will skip the intermediate 200 mA, 500 mA, and 1 A ranges and switch
directly to the 2 A range.
Element1 to Element6
For each input element or wiring unit, you can enable all measurement ranges at the same time (All ON).
Measurement Range Box (Left column of the list)
You can enable (All ON) or disable (All OFF) a range for all input elements at the same time.
Measurement Range in Which a Peak Over-Range Has Occurred (Peak Over Jump)
You can specify which measurement range to switch to when the auto range feature is enabled and a peak
over-range occurs. The background of the selected measurement range turns yellow. If a peak over-range
occurs when this feature is disabled, the WT1800 increases the measurement range, switching between valid
measurement ranges (measurement ranges whose check boxes have been selected).
You can specify valid current measurement ranges for each input element type.
• 50A Input Element
Select the valid direct input measurement ranges of 50 A input elements.
• 5A Input Element
Select the valid direct input measurement ranges of 5 A input elements.
• Ext Sensor Input Element (Option)
Select the valid external current sensor input measurement range.
• You cannot set all measurement ranges to OFF. There must be at least one valid range.
• The settings for the valid range and for the measurement range to switch to when peak over-range occurs
are shared by all the input elements in a wiring unit.
• When independent input element configuration is disabled and you change the wiring system, all
measurement ranges are enabled (set to their initial setting).
• When you switch independent input element configuration from on to off, all measurement ranges are
enabled (set to their initial setting).
• If you set the valid range setting for the current measurement range to OFF, the WT1800 switches to the
next highest measurement range. If there is no measurement range above the current one, the WT1800
switches to the next lowest measurement range.
2-16
IM WT1801-01EN
2 Fundamental Measurement Conditions
Crest Factor (Crest Factor)
The crest factor is defined as the ratio of the peak value of the waveform to the rms value.
Peak value
Crest factor (CF) =
Rms value
Peak value
Rms value
Input signal waveform
On the WT1800, the crest factor is the ratio of the maximum applicable peak value to the measurement range.
Crest factor (CF) =
Peak value that can be input
Measurement range
You can set the crest factor to CF3 or CF6.
• CF3: The crest factor is 3.
• CF6: The crest factor is 6.
The measurable crest factor is as follows:
Crest factor (CF) =
{measurement range × CF setting (3 or 6)}
Measured value (rms value)
* However, the peak value of the input signal must be less than or equal to the maximum allowable input.
If the crest factor of the measured signal is greater than the specifications of the WT1800 (the crest factor
defined at the rated input), you can measure the signal by setting a greater measurement range. For example,
even if CF is set to 3, measurement is possible for signals with a crest factor greater than or equal to 5 when the
measured value (rms value) is less than 60% of the measurement range. If the minimum effective input (1% of
the measurement range) is being applied when CF is set to 3, measurement for CF = 300 is possible.
The voltage range, current range, effective input range, and measurement accuracy vary depending on the crest
factor setting. For details, see chapter 6 in the getting started guide, IM WT1801-03EN.
• When you change the crest factor, the following settings change for all elements.
• All elements are automatically set to their maximum voltage and current ranges.
• In the valid measurement range settings, all measurement ranges are enabled (selected).
• If the crest factor is set to CF6, the measurement conditions of crest factor 5 and higher required by
IEC62018 are met.
• When measuring waveforms whose crest factor is less than or equal to CF3, you can achieve more
accurate measurements by setting the crest factor to 3.
IM WT1801-01EN
2-17
2 Fundamental Measurement Conditions
Measurement Period (SYNC SOURCE)
Measurement Period for Measurement Functions Used in Normal Measurement
The measurement period is determined by the input signal that is used as the reference (synchronization
source). The measurement period is set within the data update interval between the first point where the sync
source crosses the level-zero point (center of the amplitude) on a rising slope (or falling slope) and the last point
where the sync source crosses the level-zero point (center of the amplitude) on a rising slope (or falling slope).
Data update interval
Measurement period
Synchronization source
Rising zero crossing
Falling zero crossing
If there is not more than one rising or falling slope within the data update interval, the entire data update interval
is set as the measurement period.
Data update interval
Measurement period
Synchronization source
The measurement period for determining the numeric data of the peak voltage or peak current is always the
entire span of the data update interval. Therefore, the measurement period for the measurement functions that
are determined on the basis of the maximum voltage or current value (U+pk, U-pk, I+pk, I-pk, CfU, and CfI) is
also the entire span of the data update interval.
For details, see appendix 5 in the getting started guide, IM WT1801-03EN.
Measurement Period for Measurement Functions Used in Harmonic Measurement
The measurement period extends from the first sample in the data update interval for the number of points
indicated below:
• When the data update interval is 50 ms, 100 ms, or 200 ms: 1024 points
• When the data update interval is 500 ms, 1 s, 2 s, 5 s, 10 s, or 20 s: 8192 points
The WT1800 determines the harmonic sampling frequency automatically based on the period of the signal
that is set as the PLL source. The sampling data and measurement period that are used to determine the
values of harmonic measurement functions may be different from those used to determine the values of normal
measurement functions.
Element1 to Element6
Use the soft keys to select an element, and then select the signal to use as the sync source from the options
listed below. The available options vary depending on the installed elements. When independent input element
configuration is off, elements in the same wiring unit have the same sync source.
U1, I1, U2, I2, U3, I3, U4, I4, U5, I5, U6, I6, Ext Clk (external clock),* and None
* When you select Ext Clk, the external signal applied to the external clock input connector (EXT CLK) on
the rear panel is used as the sync source. For the EXT CLK connector specifications, see section 4.3 in the
getting started guide, IM WT1801-03EN.
2-18
IM WT1801-01EN
2 Fundamental Measurement Conditions
• If you specify no sync source by selecting “None,” all of the sampled data within the data update interval
is used to determine the numeric data. When you are measuring DC signals, this method can be used to
prevent noise from causing errors in the detection of the measurement period.
• If the sync source is not set correctly, the measured value may fluctuate or be incorrect. When you set the
sync source, refer to appendix 5 in the getting started guide, IM WT1801-03EN.
Line Filter (LINE FILTER)
There are two types of input filters, line filters and frequency filters.
Because the line filter is inserted into the voltage and current measurement input circuits, it directly affects
voltage, current, and power measurements (see the block diagram in appendix 11 in the getting started guide, IM
WT1801-03EN). When the line filter is turned on, measured values do not contain high frequency components.
Thus, the voltage, current, and power of inverter waveforms, strain waveforms, etc., can be measured with their
high frequency components eliminated.
Element1 to Element6
Use the soft keys to select an element, and then turn the line filter on or off, and set the cutoff frequency.
You can set the cutoff frequency to
300 kHz, 1 MHz, or a value from 0.1 kHz to 100.0 kHz (in 0.1 kHz steps)
• If the line filter of even one of the elements is not set to OFF, the LINE FILTER key and the Line Filter indicator
at the top of the screen illuminate.
• Selecting OFF disables the line filter.
Copying the Line Filter Setting (Exec Copy Σ)
Copy the line filter on/off setting and cutoff frequency of the selected input element to the other input elements in
the same wiring unit.
Line Filter for High Speed Data Capturing
Click here.
Frequency Filter (FREQ FILTER)
The frequency filter is inserted into the frequency measurement input circuit and affects frequency
measurements. It also affects the detection of the measurement period for voltage, current, and power
measurements (see appendix 5 in the getting started guide, IM WT1801-03EN). In this case, the filter also acts
as a filter for detecting the zero-crossing of the synchronization source signal more accurately. The frequency
filter is not inserted into the voltage and current measurement input circuits. Therefore, the measured values
include high frequency components even when the frequency filter is turned on.
Element1 to Element6
Use the soft keys to select an element, and then select the element’s cutoff frequency from the options listed
below.
OFF, 100 Hz, and 1 kHz
• The WT1800 detects the zero-crossing point with a hysteresis of approximately 5% of the measurement
range.
• If even one element is not set to OFF, the Freq Filter indicator at the top of the screen illuminates.
• If the line filter described above is on, it affects the frequency measurement even when the frequency filter is
off.
• We recommend that you turn the frequency filter on when the input signal frequency is less than or equal to
440 Hz.
IM WT1801-01EN
2-19
2 Fundamental Measurement Conditions
Data Update Interval (UPDATE RATE)
The data update interval is the interval at which the data that is used in measurement functions is sampled.
You can select the data update interval from the options below.
50 ms, 100 ms, 200 ms, 500 ms, 1 s, 2 s, 5 s, 10 s, and 20 s
At each data update interval, the numeric data is updated, stored, transmitted through a communication
interface, and converted and output as analog signals.
To capture relatively fast load fluctuations in the power system, select a fast data update rate. To capture low
frequency signals, select a slow data update rate.
Fast
The WT1800 switches to the next fastest data update interval (out of the intervals listed above).
Slow
The WT1800 switches to the next slowest data update interval (out of the intervals listed above).
Current Rate
Displays the current data update interval. You can press a soft key to select a data update interval from the
options listed above.
• The display update intervals of numeric data and waveform data may be longer than the data update
interval.
• The lowest measurable AC signal frequency varies depending on the data update interval. The measured
value may not be stable if an AC signal of a frequency lower than the low frequency measurement limit (see
section 6.5 in the getting started guide, IM WT1801-03EN) is measured.
Averaging (AVG)
You can take exponential or moving averages of the numeric data. The averaging function is effective when
reading of the numeric display is difficult due to fluctuations. This occurs when the fluctuation of the power supply
or the load is large or when the input signal frequency is low.
Turning Averaging On and Off (Averaging)
Measurement Functions Used in Normal Measurement
You can select whether to average values. When you enable averaging (ON), the AVG key and the AVG indicator
at the top of the screen illuminate.
Measurement Functions Used in Harmonic Measurement (Option)
• If averaging is turned on, and the averaging type is Exp (exponential averaging), averaging is performed on
harmonic measurement functions.
• Even if averaging is turned on, if the averaging type is Lin (moving average), averaging is not performed on
harmonic measurement functions.
2-20
IM WT1801-01EN
2 Fundamental Measurement Conditions
Averaging Types (Type)
You can use exponential or moving averages.
Exponential Averaging (Exp)
With the specified attenuation constant, the numeric data is exponentially averaged according to the equation
below.
Dn = Dn–1 +
(Mn – Dn–1)
K
Dn: Displayed value that has been exponentially averaged n times. (The first displayed value, D1, is equal to M1.)
Dn–1: Displayed value that has been exponentially averaged n – 1 times.
Mn:Measured data at the nth time.
K: Attenuation constant (select from 2 to 64)
Moving Average (Lin)
The specified average count is used to compute moving averages according to the equation below.
Dn =
Mn−(m−1)+ • • • Mn−2+Mn−1+Mn
m
Dn: n–(m–1)th to the nth time
Mn–(m–1): Measured data at the n–(m–1)th time
………………………………………………
………………………………………………
Mn–2:
Measured data at the n – 2th time.
Mn–1:
Measured data at the n – 1st time.
Mn:
Measured data at the nth time.
m:
Average count (select a number from 8 to 64)
Attenuation Constant or Average Count (Count)
• If the averaging type is Exp (exponential averaging), set the attenuation constant to a value within the
following range.
2 to 64
• If the averaging type is Lin (moving average), set the average count to a value within the following range.
8 to 64
Measurement Functions That Are Averaged
The measurement functions that are directly averaged are indicated below. Other functions that use these
functions in their computation are also affected by averaging. For details about how the values of the
measurement functions are determined, see appendix 1 in the getting started guide, IM WT1801-03EN.
Measurement Functions Used in Normal Measurement
•
•
•
•
•
•
Urms, Umn, Udc, Urmn, Uac, Irms, Imn, Idc, Irmn, Iac, P, S, and Q
ΔU1 to ΔPΣ (on models with the delta computation option)
Torque, speed, and Pm (on models with the motor evaluation option)
Aux1 and Aux2 (on models with the auxiliary input option)
λ, Φ, CfU, CfI, Pc, q, q+, q–, and η1 to η4 are computed using the averaged values of Urms, Irms, P, S, and Q.
Slip is computed using the averaged value of Speed (on models with the motor evaluation option).
Measurement Functions Used in Harmonic Measurement (Option)
• U(k), I(k), P(k), S(k), and Q(k)
• λ(k), and Φ(k) are computed using the averaged values of P(k) and Q(k).
• Z, Rs, Xs, Rp, Xp, Uhdf, Ihdf, Phdf, Uthd, Ithd, Pthd, Uthf, Ithf, Utif, Itif, hvf, hcf, and K–factor are computed
using the averaged values of U(k), I(k), and P(k).
k:
The harmonic order
IM WT1801-01EN
2-21
2 Fundamental Measurement Conditions
Measurement Functions That Do Not Perform Averaging
The following measurement functions do not perform averaging.
Measurement Functions Used in Normal Measurement
fU, fI, U+pk, U–pk, I+pk, I–pk, P+pk, P−pk, Time, WP, WP+, WP–, WPΣ, WP+Σ, WP–Σ, WS, WQ, and SyncSp (on
models with the motor evaluation option)
Measurement Functions Used in Harmonic Measurement (Option)
ΦU(k), ΦI(k), ΦUi–Uj, ΦUi–Uk, ΦUi–Ii, ΦUj–Ij, ΦUk–Ik, fPLL1, fPLL2, EaU, and EaI
The harmonic order
* k:
Measurement Functions Used in Normal and Harmonic Measurement (Option)
F1 to F20 and Event 1 to Event 8
• When averaging is turned on, the average value of multiple measurements is determined and displayed. If
the input signal changes drastically, it will take longer for the change to be reflected in the measured values
when averaging is used.
• A larger attenuation constant (for exponential averaging) or average count (for moving averages) will result
in more stable (and less responsive) measured values.
Displaying the Setup Parameter List (INPUT INFO)
The setup parameter list appears in the top half of the screen.
Display Format (FORM)
Input Element Settings List (Power Element Settings)
The wiring system, measurement range, scaling factor, synchronization source, line filter, and frequency filter
settings for each element are displayed.
Measurement Range Settings List (Range Settings)
The measurement range settings for each element are displayed. Measurement ranges that have been disabled
in the valid measurement range settings are dimmed.
Display Items (ITEM)
Turning the Display Frame On and Off (Display Frame)
Click here.
• The setup parameter list shows the settings when measurement took place. If the measurement range or
some other setting is changed while the hold feature is on, the changes will not be reflected in the list.
• When the setup parameter list is displayed, press FORM to switch between the FORM menu for the setup
parameter list and the FORM menu for the display in the bottom half of the screen. Likewise, press ITEM
to switch between ITEM menus.
2-22
IM WT1801-01EN
3 Harmonic Measurement Conditions (Option)
Harmonic Measurement Conditions (HRM SET)
Using harmonic measurement, you can measure functions that are based on the voltage, current, and power
harmonics and their distortion factors; on the phase angle of each harmonic relative to the fundamental; etc. You
can also compute the harmonic distortion factors for voltage and current.
For a list of the measurement functions that can be measured with harmonic measurement and their
descriptions, see “Harmonic Measurement Functions” under “Items That This Instrument Can Measure.”
Click here.
Models with the Harmonic Measurement Option
The following menu items appear.
• PLL source (PLL Source)
• Measured harmonic orders (Min Order/Max Order)
• Distortion Factor Equation (Thd Formula)
Models with the Simultaneous Dual Harmonic Measurement Option
The following menu items appear.
• Input element group (Element Settings)
• PLL source of group Hrm1 (Hrm1 PLL Source)
• Measured harmonic orders of group Hrm1 (Min Order/Max Order)
• Distortion factor equation of group Hrm1 (Thd Formula)
• PLL source of group Hrm2 (Hrm2 PLL Source)
• Measured harmonic orders of group Hrm2 (Min Order/Max Order)
• Distortion factor equation of group Hrm2 (Thd Formula)
PLL Source (PLL Source)
For harmonics to be measured, the fundamental period (the period of the fundamental signal) that will be used to
analyze the harmonics must be determined. The signal for determining the fundamental period is the PLL (phase
locked loop) source.
Select the PLL source from the choices below. The available options vary depending on the installed elements.
U1, I1, U2, I2, U3, I3, U4, I4, U5, I5, U6, I6, and Ext Clk*
* If you select Ext Clk, the frequency of the signal applied to the rear panel’s external clock input connector
(EXT CLK) is used as the fundamental frequency for harmonic measurement. For the EXT CLK connector
specifications, see section 4.3 in the getting started guide, IM WT1801-03EN.
IM WT1801-01EN
3-1
3 Harmonic Measurement Conditions (Option)
• Select a signal that has the same period as the signal that you want to measure the harmonics of. For
stable harmonic measurement, choose an input signal for the PLL source that has as little distortion and
fluctuation as possible. If the fundamental frequency of the PLL source fluctuates or if the fundamental
frequency cannot be measured due to waveform distortion, correct measurements will not be obtained.
When the measured item is a switching power supply and in other cases where the distortion of the voltage
signal is smaller than that of the current signal, we recommend that the PLL source be set to the voltage.
• If all of the input signals are distorted or the amplitude is small compared to the measurement range, the
specifications may not be met. To achieve stable, accurate measurements on high harmonics, set the
PLL source to an external clock signal and apply a signal with the same period as the input signal to the
external clock input connector.
• If the fundamental frequency is less than or equal to 440 Hz and the signal contains high frequency
components, we recommend that you turn the frequency filter on. This filter is only effective on the
frequency measurement circuit.
• If the amplitude level of the signal applied to the element that is specified as the PLL source is small
compared to the range, PLL synchronization may not be achieved. If the crest factor is set to CF3, set the
measurement range so that the amplitude level of the PLL source is at least 50%. If the crest factor is set
to CF6, set the measurement range so that the amplitude level of the PLL source is at least 100%.
• If the frequency of the PLL source changes, correct measured values are displayed four data updates
after the change. Correct measured values may not be obtained immediately after the PLL source or its
frequency changes, because the PLL circuit inside the WT1800 redetects the frequency.
Measured Harmonic Orders (Min Order/Max Order)
The harmonic measurement range can be specified. The harmonic orders specified here are used to determine
the numeric data of the distortion factor.
Click here.
Minimum Harmonic Order to Be Measured (Min Order)
Select from the following.
• 0: The 0th order (DC) component is included when numeric harmonic waveform data is determined.
• 1: The 0th order (DC) component is not included when numeric harmonic waveform data is determined. The
harmonic measurement data (the harmonic waveform data) is determined from the 1st order (the fundamental
wave).
Maximum Harmonic Order to Be Measured (Max Order)
You can select a value between 1 and 500.
However, the maximum measurable harmonic order is the smallest of the three orders listed below.
• The specified maximum harmonic order to be measured
• The value determined automatically according to the PLL source frequency (see section 6.6 in the getting
started guide, IM WT1801-03EN)
• When the data update interval is 50 ms, the maximum measurable harmonic order is 100.
The numeric data corresponding to harmonic orders above the maximum measurable harmonic order is
displayed as “-------” (no data).
• If the minimum harmonic order to be measured is set to 1, the data of the DC component is not included
when the distortion factor is determined.
• There is no overload value indication (“-OL-”) or zero indication (suppression to zero) for the numeric data
of harmonic orders 0 (DC) to 500. For information about the overload value indication (“-OL-”) and zero
indication (suppression to zero) in normal measurement, see section 6.4 in the getting started guide, IM
WT1801-03EN.
3-2
IM WT1801-01EN
3 Harmonic Measurement Conditions (Option)
Distortion Factor Equation (Thd Formula)
When determining the harmonic measurement functions Uhdf, Ihdf, Phdf, Uthd, Ithd, and Pthd, you can select
to use one of the denominators described below as the denominator for the equation. For information about
equations, see appendix 1 in the getting started guide, IM WT1801-03EN.
1/Total
The denominator is the measured data of all orders from the minimum measured order (0 or 1st) to the maximum
measured order (within the upper limit of harmonic analysis).
1/Fundamental
The denominator is the data of the fundamental signal component (1st order).
Input Element Group (Element Settings)
This setting appears on models with the simultaneous dual harmonic measurement option. You can divide all the
input elements into two groups: Hrm1 and Hrm2, and measure harmonics using two PLL sources with different
frequencies. You can measure the input and output harmonics of an AC–AC converter whose input and output
frequencies are different.
This setting does not appear on models with the harmonic measurement option.
Element1 to Element6
Use the soft keys to select an element, and then assign the element to group Hrm1 or group Hrm2. Input
elements that are assigned to the same wiring unit are assigned to the same group.
PLL Source of Group Hrm1 (Hrm1 PLL Source)
PLL Source of Group Hrm2 (Hrm2 PLL Source)
These settings are the same as the PLL source (PLL Source) setting.
Click here.
Measured Harmonic Orders of Group Hrm1 (Min Order/Max Order)
Measured Harmonic Orders of Group Hrm2 (Min Order/Max Order)
These settings are the same as the measured harmonic orders (Min Order/Max Order) setting.
Click here.
Distortion Factor Equation of Group Hrm1 (Thd Formula)
Distortion Factor Equation of Group Hrm2 (Thd Formula)
These settings are the same as the distortion factor equation (Thd Formula) setting.
Click here.
IM WT1801-01EN
3-3
3 Harmonic Measurement Conditions (Option)
Anti-Aliasing Filter
When an FFT is taken through the performance of A/D conversion on a repetitive waveform, a phenomenon
occurs in which frequency components that exceed half the frequency of the sampling frequency are detected as
low frequency components. This is called aliasing.
Aliased signal
Input signal
Sampled points
Aliasing causes problems such as increased errors in measured values and incorrect measurements of the
phase angles on each harmonic. An anti-aliasing filter is used to prevent aliasing and eliminate high frequency
components that are irrelevant to the harmonic measurement.
For example, when an input signal with a fundamental frequency of 50 Hz is measured up to the 50th
order, the frequency of the 50th order is 2.5 kHz. Thus, a 5-kHz anti-aliasing filter is used to eliminate high
frequency components that are greater than or equal to approximately 5 kHz, which are irrelevant to harmonic
measurement.
The WT1800 uses the line filter as an anti-aliasing filter for harmonic measurements. For information about how
to configure the filter, see “Line Filter (LINE FILTER).”
Click here.
The accuracy and the upper limit of the measurement bandwidth change when the anti-aliasing filter (line filter)
is turned ON. For details, see appendix 6.6 in the getting started guide, IM WT1801-03EN.
3-4
IM WT1801-01EN
4 Motor Evaluation Conditions (Option)
Motor Evaluation Conditions and Auxiliary Input Conditions
(MOTOR/AUX SET)
Press MOTOR/AUX SET to display a setup dialog box for the installed option.
Models with the Motor Evaluation Option
The MOTOR Settings dialog box appears.
The WT1800 can determine the motor rotating speed, torque, and output. It determines them using the
revolution sensor signal, which is proportional to the motor rotating speed, and the torque meter signal, which is
proportional to the motor torque. You can configure the WT1800 to receive analog (DC voltage) signals or pulse
signals from the revolution sensor and torque meter. Also, you can set the number of motor poles and determine
the motor’s synchronous speed and slip. Furthermore, you can use the active power, frequency, and motor
output measured by the WT1800 to compute the motor efficiency and total efficiency.
For a list of the measurement functions that can be measured with the motor evaluation feature and their
descriptions, see “Motor Evaluation Functions” under “Items That This Instrument Can Measure.”
Click here.
Models with the Auxiliary Input Option
The Aux Settings dialog box appears.
Click here.
Motor Evaluation Settings
You can configure the following motor evaluation settings.
• Scaling factor (Scaling)
• Unit (Unit)
• Input signal type (Sense Type)
• Analog input range
• Linear scaling of analog input
• Line Filter (Line Filter)
• Synchronization Source (Sync Source)
• Pulse input range
• Torque signal pulse rating
• Revolution signal pulses per revolution (Pulse N)
• Motor poles (Pole)
• Frequency measurement source (Source)
• Electrical angle measurement (Electrical Angle Measurement)*
• Motor efficiency and total efficiency computation
* This item is available on models with the harmonic measurement option or the simultaneous dual harmonic
measurement option.
Scaling Factor (Scaling)
Setting the Scaling Factor for Scaling the Revolution Signal
You can set the factor for scaling the revolution signal. Set the factor to a value from 0.0001 to 99999.9999.
• When the Revolution Signal Type is Analog
This setting is used as the scaling factor in the equation for the linear scaling of analog input.
• When the Revolution Signal Type is Pulse
This setting is used as the scaling factor in the equation for the number of revolution signal pulses per
revolution.
IM WT1801-01EN
4-1
4 Motor Evaluation Conditions (Option)
Setting the Scaling Factor for Scaling the Torque Signal
You can set the factor for scaling the torque signal to motor torque. Set the factor to a value from 0.0001 to
99999.9999.
• When the Torque Signal Type is Analog
This setting is used as the scaling factor in the equation for the linear scaling of analog input.
• When the Torque Signal Type is Pulse
This setting is used as the scaling factor in the equation for the torque signal pulse rating.
Setting the Scaling Factor for Computing the Motor Output
You can specify the scaling factor for computing the motor output (mechanical power) from the rotating speed
and torque. Set the factor to a value from 0.0001 to 99999.9999.
The equation is indicated below. The scaling factors of the rotating speed and torque are set so that the unit of
the rotating speed is min–1 (or rpm) and the unit of torque is N•m. When the scaling factor of the motor output
specified here is 1, the unit of the motor output Pm is W. Because the efficiency computation uses W as the unit
of Pm, we recommend that you set the scaling factor of each item so that the unit of Pm is W.
Motor output Pm =
2π
×Speed×Torque×S
60
Speed: The rotating speed, determined from the number of pulses per revolution
Torque: The torque, determined from the torque signal pulse rating
S:
The scaling factor
Unit (Unit)
• Number of characters: Up to eight
• Usable characters:Spaces and all characters that are displayed on the keyboard
Input Signal Type (Sense Type)
You can select which of the following two types of signals you want the WT1800 to receive from the revolution
sensor and torque meter.
• Analog: Select this option when the WT1800 will receive DC voltage (analog) signals.
• Pulse: Select this option when the WT1800 will receive pulse signals.
Settings for Different Signal Types
As indicated below, the settings that you need to configure vary depending on the revolution and torque signal
type.
Settings Related to the Signal Type
Setting
Analog auto range
Analog range
Linear scale A, B
Line filter
Synchronization source
Pulse range
Number of pulses per revolution
Signal Type
Analog
Pulse
Yes
No
Yes
No
Yes
No
Yes
No
—
—
No
No
Yes
Yes
Yes: Must be set.
No: Does not need to be set.
—:
Measurement can be performed when the sync source is set to None (the default setting), but you
can increase synchronicity with power measurement by specifying a sync source.
4-2
IM WT1801-01EN
4 Motor Evaluation Conditions (Option)
Common Settings Unrelated to the Signal Type
•
•
•
•
Scaling factor
Unit
Motor poles
Sync speed frequency measurement source
Analog Input Range
Set the analog input range for input signals whose type has been set to analog. For input signals whose type
has been set to pulse, there is no need to set the analog input range.
Turning Auto Range On and Off (Analog Auto Range)
Select whether to turn auto range on or off. When auto range is on, the WT1800 automatically switches between
the following ranges according to the size of the input signal.
20 V, 10 V, 5 V, 2 V, and 1 V
Range Increase
• The measurement range is increased when the rotating speed signal or torque signal exceeds 110% of the
measurement range.
• The measurement range is increased when the peak value of the input signal exceeds 150% of the
measurement range.
Range Decrease
The measurement range is decreased when the rotating speed signal or torque signal falls below 30% of the
measurement range and the peak value of the input signal is less than 125% of the lower range.
When non-periodic pulse waveforms are applied during auto range, the range may not remain constant. If this
happens, use the fixed range setting.
Fixed Range (Analog Range)
You can select one of the following input ranges.
20 V, 10 V, 5 V, 2 V, or 1 V
Linear Scaling of Analog Input
You can set the slope and the offset value of the input signal using one of the following two methods.
• Set the values manually.
• Specify two points, and use those points to compute the values
Manually Setting the Input Signal Slope and Offset (Linear Scale A, B)
You can set the slope (A) and offset (B) of the rotating speed and torque input signals to values within the
following ranges.
A: 1.000 m to 1.000 M
B: –1.000 M to 1.000 M
The following equation is used to compute the rotating speed and torque.
Rotating speed, torque = S(AX + B) – NULL
S: The scaling factor
A: The input signal slope
X: The input voltage from the revolution sensor or torque meter.
B: The offset
NULL: The NULL value
IM WT1801-01EN
4-3
4 Motor Evaluation Conditions (Option)
When There Is No Offset in the Input Voltages from the Revolution Sensor and Torque Meter
If you set A to 1 and B to 0, the linear scaling settings do not affect computation, and the previous equation
becomes:
Rotating speed, torque = SX – NULL
You can compute the rotating speed and torque by setting the scaling factors to the number of revolutions and
the amount of torque per 1 V.
When There Is Offset in the Input Voltages from the Revolution Sensor and Torque Meter
If you set S to 1, the scaling factor does not affect the computation, and the previous equation becomes
Rotating speed, torque = AX + B – NULL
You can compute the rotating speed and torque by setting the offset values (B) and setting the input signal
slopes (A) to the number of revolutions and the amount of torque per 1 V.
If you enable the NULL function and then change the input signal slope (A) or offset value (B), NULL
correction will be offset. Reset the NULL value.
Computing the Input Signal Slope and Offset by Specifying Two Points (Calculation)
On the input characteristic graphs of the rotating speed and torque, you can specify two measured rpm or N•m
values (Point1Y and Point2Y) in relation to two input voltage values (Point1X and Point2X).
Measured values (Point1X and Point2X): –1.000 T to 1.000 T
Computed values (Point1Y and Point2Y): –1.000 T to 1.000 T
Select Execute to use these four values to determine and set the input signal slope (A) and offset (B).
Measured value
Point2
Point2Y
Point1Y
y=Ax+B
Point1
Point1X
Point2X
Input value
Measurement range
Line Filter (Line Filter)
You can remove high-frequency noise by inserting a line filter into the circuit used to measure the revolution and
torque signals.
You can select the cutoff frequency from the following options.
OFF, 100 Hz, and 1 kHz
Selecting OFF disables the filter.
The line filter setting applies to input signals whose type has been set to analog. For input signals whose type
has been set to pulse, there is no need to configure this setting.
4-4
IM WT1801-01EN
4 Motor Evaluation Conditions (Option)
Synchronization Source (Sync Source)
• When you are measuring analog revolution and torque signals, you can select the element to use as the sync
source from the following options. The available options vary depending on the installed elements.
U1, I1, U2, I2, U3, I3, U4, I4, U5, I5, U6, I6, Ext Clk (external clock),* and None
*For the EXT CLK connector specifications, see section 4.3 in the getting started guide, IM WT1801-03EN.
• The measurement period is determined according to the zero-crossing point of the selected synchronization
source. The WT1800 uses the measurement period to measure the analog revolution and torque signals.
If you specify no synchronization source by selecting “None,” all the sampled data within the data update
interval is used to determine the rotating speed and torque.
• When the revolution or torque signal is a pulse signal, its value is the pulse signal period averaged over the
measurement period. The measurement period is determined according to the sync source. If the pulse signal
period does not fit within the measurement period, the previous period is used to determine the measured
value.
• To achieve stable motor efficiency measurements, we recommend that you set the sync source for motor
efficiency measurement to the same sync source that is set in the fundamental measurement conditions. This
ensures that the measurement period is in sync with the measurement functions, such as those for voltage,
current, and active power.
Pulse Input Range
Set an appropriate range for the maximum and minimum input signal values. For example, when you are
measuring signals for rotating speeds of 120 rpm to 180 rpm and torques of –18 N•m to +18 N•m, set the
rotating speed pulse input range to 100 rpm to 200 rpm, and set the torque pulse input range to –20 N•m to +20
N•m.
Upper and Lower Limits ((Pulse Range Upper, Pulse Range Lower)
You can set the pulse range for each input signal within the following limits.
• Revolution signal: 0.0000 to 99999.9999 (rpm)
• Torque signal:
–10000.0000 to 10000.0000 (N•m)
When the input signal type is pulse, the waveform display lower and upper limits are the values that you set
here.
On models with the D/A output option, the rated D/A output values are as follows.
Revolution and Torque Input Signals
Setting for Pulse Range Upper
Setting for Pulse Range Upper × (–1)
D/A output
+5 V
–5 V
Torque Signal Pulse Rating
When the torque signal type is pulse, refer to the torque meter’s specifications to set its rated positive and
negative values.
Positive and Negative Rated Torque Signal Values (Rated Upper, Rated Lower)
Range:
IM WT1801-01EN
–10000.0000 to 10000.0000 (N•m)
4-5
4 Motor Evaluation Conditions (Option)
Positive and Negative Rated Torque Signal Pulse Frequencies (Rated Freq Upper,
Rated Freq Lower)
Range:
1 to 100000000 (Hz)
The following equation is used to compute the torque.
Torque = S(AX + B) – NULL
S:
A:
X: B:
NULL:
The scaling factor1
The torque pulse coefficient2
The pulse frequency
The torque pulse offset2
The NULL value
1 If the torque signal is a changed signal, you can set the scaling factor to determine the torque before the
change.
2 The torque pulse coefficient and torque pulse offset are determined from the torque signal pulse rating as
shown in the next figure.
Relationship between the Torque Signal Pulse Input Range and Pulse Rating
To measure a torque of –20 N•m to +20 N•m using a torque meter with specifications in the figure below,
configure the pulse input range and pulse rating settings as indicated below.
• Upper limit of the pulse input range (Pulse Range Upper): 20.0000
• Lower limit of the pulse input range (Pulse Range Lower): –20.0000
• Positive rated torque signal value (Rated Upper): 50.0000
• Negative rated torque signal value (Rated Lower): –50.0000
• Positive rated torque signal pulse frequency (Rated Freq Upper): 15000
• Negative rated torque signal pulse frequency (Rated Freq Lower): 5000
Torque sensor specifications
Number of
output pulses
Pulse rating (positive): 15 kHz is output at a torque
of 50 N•m
Pulse rating (negative): 5 kHz is output at a torque
of –50 N•m
15 kHz
Slope: Torque pulse
coefficient (A)
Torque pulse offset (B)
5 kHz
Output axis
Motor
–50 N•m
Pulse output
torque sensor
50 N•m
Torque input
Load
Torque signal to the WT1800
Pulse signal corresponding to –20 N•m to +20 N•m
WT1800
Recorder
D/A output signal to the recorder
±5 V for –20 N•m to +20 N•m
4-6
IM WT1801-01EN
4 Motor Evaluation Conditions (Option)
The pulse input range setting applies to input signals whose type has been set to pulse. For input signals
whose type has been set to analog, there is no need to configure this setting.
Revolution signal pulses per revolution (Pulse N)
Set the number of pulses per revolution to a value from 1 to 9999.
The following equation is used to compute the rotating speed.
Rotating speed = S
X
−NULL
N
S:
The scaling factor*
X:
The number of input pulses from the revolution sensor per minute
N:
The number of pulses per revolution
NULL: The NULL value
* When the scaling factor is 1, the rotating speed is the number of revolutions per minute (min–1 or rpm). If
the revolution signal is a changed signal, you can set the scaling factor to determine the rotating speed
before the change.
The setting specifying the number of revolution signal pulses per revolution applies to input signals whose
type has been set to pulse. For input signals whose type has been set to analog, there is no need to configure
this setting.
Synchronous Speed (Sync Speed)
Motor Poles (Pole)
Set the number of motor poles to a value from 1 to 99. This number is used to compute the sync speed.
Frequency Measurement Source (Source)
• Select the frequency measurement source to use to compute the sync speed from the options below. The
frequency measurement source is used to compute the sync speed. The available options vary depending on
the installed elements.
U1, I1, U2, I2, U3, I3, U4, I4, U5, I5, U6, and I6
• On models that do not have the add-on frequency measurement option installed, select a voltage or current
whose frequency is being measured (voltage/current to measure the frequency of). If you select a voltage or
current whose frequency is not being measured, an error will occur.
• Normally, you should select the voltage or current that is being applied to the motor and whose frequency is
being measured. If you select the frequency of a voltage or current that is not being applied to the motor, the
sync speed may not be determined properly.
Sync Speed Equation
The sync speed unit is fixed at min–1 or rpm.
Sync speed (min−1) =
Fs:
Pole:
IM WT1801-01EN
120 × Fs
Pole
The frequency of the frequency measurement source (Hz)
The number of motor poles
4-7
4 Motor Evaluation Conditions (Option)
Slip Equation
The sync speed unit is fixed at min–1 or rpm. To determine the slip, configure the rotating speed scaling factor so
that the unit of the rotating speed is also min–1 (or rpm).
Slip (%) =
SyncSp−Speed
SyncSp
×100
SyncSp:The synchronous speed (min–1)
Speed: The rotating speed (min–1)
Set the frequency measurement source to a stable voltage or current signal that is being applied to the motor
and that has low distortion and noise.
Electrical Angle Measurement (Electrical Angle Measurement)
This item is appears on models with the harmonic measurement option or the simultaneous dual harmonic
measurement option.
Turning Electrical Angle Measurement On and Off
Select whether to measure electrical angles.
Electrical Angle Correction (Electrical Angle Correction)
Set the electrical angle correction value.
Correction Value (Correction Value)
Set the correction value to a number from –180.00° to 180.00°.
Clearing the Correction Value (Clear Correction)
Set the correction value to 0.00.
Automatically Computing the Correction Value (Auto Enter Correction)
The WT1800 automatically sets the correction value to the difference between the phase of the voltage or
current whose correction value is being automatically computed and the current electrical angle phase.
Voltage or Current to Automatically Compute the Correction Value of (Auto Enter Target)
Select the voltage or current to automatically compute the correction value of from the options below. The
available options vary depending on the installed elements.
U1, I1, U2, I2, U3, I3, U4, I4, U5, I5, U6, and I6
4-8
IM WT1801-01EN
4 Motor Evaluation Conditions (Option)
Motor Efficiency and Total Efficiency Computation
The WT1800 can compute the motor efficiency (the ratio of power consumption to motor output) and total
efficiency from the active power and motor output that it measures.* You can set the efficiency equation using the
η Formula setting.
Click here.
* The total efficiency is the ratio of total power consumption—not just the power consumption of the motor but
also the power consumption of the converter that supplies the motor with power—to motor output.
The following is an example of how the values are computed.
When the Motor Input Is Wired to ΣA
Motor output Pm (W)
×100
PΣA(W)
Motor efficiency (%) =
P ΣA
Motor power
consumption
Motor
Motor output Pm
When the Converter and Motor Inputs Are Wired to ΣA and ΣB, Respectively
Motor efficiency (%) =
Total efficiency (%) =
Motor output Pm (W)
×100
PΣB(W)
Motor output Pm (W)
×100
PΣA(W)
PΣA
PΣB
Converter
Motor
Motor and converter (inverter, etc.) Motor power
power consumption
consumption
Motor output Pm
When the Converter and Motor Inputs Are Wired to ΣB and ΣA, Respectively
Motor efficiency (%) =
Total efficiency (%) =
Motor output Pm (W)
×100
PΣA(W)
Motor output Pm (W)
×100
PΣB(W)
P ΣB
PΣA
Converter
Motor
Motor and converter (inverter, etc.) Motor power
power consumption
consumption
Motor output Pm
If ΣA or ΣB is a three-phase, three-wire (3P3W) system, you can use delta computation to perform
3P3W>3V3A transformation on ΣA and ΣB. From the 3P3W>3V3A transformation, you can determine one
unmeasured line voltage and one unmeasured common mode current.
IM WT1801-01EN
4-9
5 Auxiliary Input Conditions (Option)
Auxiliary Input Conditions (MOTOR/AUX SET)
You can apply the signals of sensors, such as luminance, wind-power, or temperature sensors, to the AUX1 and
AUX2 connectors, and display the physical values measured by the sensors. You can configure the following
auxiliary input settings.
• Input signal name (Aux Name)
• Scaling factor (Scaling)
• Unit (Unit)
• Analog input range
• Linear scaling of analog input
• Line filter (Line Filter)
Input Signal Name (Aux Name)
• Number of characters: Up to eight
• Usable characters:
Spaces and all characters that are displayed on the keyboard
Scaling Factor (Scaling)
You can set the factor for scaling the auxiliary input. Set the factor to a value from 0.0001 to 99999.9999.
This setting is used as the scaling factor in the equation for the linear scaling of analog input.
Unit (Unit)
This setting is the same as the input signal name (Aux Name) setting.
Click here.
Analog Input Range
Set the auxiliary input (analog input) range.
Turning Auto Range On and Off (Analog Auto Range)
Select whether to turn auto range on or off. When auto range is on, the WT1800 automatically switches between
the following ranges according to the size of the auxiliary input.
20 V, 10 V, 5 V, 2 V, 1 V, 500 mV, 200 mV, 100 mV, and 50 mV
Range Increase
• The measurement range is increased when the auxiliary input exceeds 110% of the measurement range.
• The measurement range is increased when the peak value of the auxiliary input exceeds 150% of the
measurement range.
Range Decrease
The measurement range is decreased when auxiliary input falls below 30% of the measurement range and the
peak value of the auxiliary input is less than 125% of the lower range.
When non-periodic pulse waveforms are applied during auto range, the range may not remain constant. If this
happens, use the fixed range setting.
Fixed Range (Analog Range)
You can select one of the following input ranges.
20 V, 10 V, 5 V, 2 V, 1 V, 500 mV, 200 mV, 100 mV, and 50 mV
IM WT1801-01EN
5-1
5 Auxiliary Input Conditions (Option)
Linear Scaling of Analog Input
You can set the slope and the offset value of the auxiliary input using one of the following two methods.
• Set the values manually.
• Specify two points, and use those points to compute the values
Manually Setting the Auxiliary Input Slope and Offset (Linear Scale A, B)
You can set the slope (A) and offset (B) of the auxiliary input to values within the following ranges.
A: 1.000 m to 1.000 M
B: –1.000 M to 1.000 M
The following equation is used to compute measured values of the auxiliary input.
Auxiliary input measured value = S(AX + B) – NULL
S:
The scaling factor
A:
The auxiliary input slope
X:
The input voltage of the auxiliary input
B: The offset
NULL: The NULL value
When There Is No Offset in the Auxiliary Input Voltage
If you set A to 1 and B to 0, the linear scaling settings do not affect computation, and the previous equation
becomes:
Auxiliary input measured value = SX – NULL
You can scale the auxiliary input by setting the scaling factor to the number of units per 1 V.
When There Is Offset in the Auxiliary Input Voltage
If you set S to 1, the scaling factor does not affect the computation, and the previous equation becomes:
Auxiliary input measured value = AX + B – NULL
You can scale the auxiliary input by setting the offset value (B) and setting the auxiliary input slope (A) to the
number of units per 1 V.
If you enable the NULL function and then change the auxiliary input slope (A) or offset value (B), NULL
correction will be offset. Reset the NULL value.
Computing the Auxiliary Input Slope and Offset by Specifying Two Points (Calculation)
On the input characteristic graph of the external input signal, you can specify two measured unit values (Point1Y
and Point2Y) in relation to two input voltage values (Point1X and Point2X). Select Execute to use these four
values to determine and set the auxiliary input slope (A) and offset (B).
Measured values (Point1X and Point2X): –1.000 T to 1.000 T
Computed values (Point1Y and Point2Y): –1.000 T to 1.000 T
Select Execute to use these four values to determine and set the auxiliary input slope (A) and offset (B).
Measured value
Point2
Point2Y
Point1Y
y=Ax+B
Point1
Point1X
Point2X
Input value
Measurement range
5-2
IM WT1801-01EN
5 Auxiliary Input Conditions (Option)
Line Filter (Line Filter)
You can remove high-frequency noise by inserting a line filter into the circuit used to measure the Aux1 and Aux2
auxiliary inputs.
You can select the cutoff frequency from the following options.
OFF, 100 Hz, and 1 kHz
Selecting OFF disables the filter.
IM WT1801-01EN
5-3
6 Holding Measured Values and Performing Single
Measurements
Holding Measured Values (HOLD)
The hold operation stops data measurement and display operations for each data update interval and holds the
display of all measurement function data. The D/A output values, the values in the data lists printed by the builtin printer, and the communication values all reflect the held values.
For information about how holding works during integration, see the sections on holding and releasing
integration.
Click here.
Single Measurement (SINGLE)
While the display is held, the signal is measured once at the data update interval, and then the display is re-held.
If you press SINGLE when the display is not held, measurement restarts from that point.
Using an External Signal to Hold Measured Values and Perform Single Measurements
(Option)
On models with the 20-channel D/A output option, you can use the remote control feature to hold measured
values and perform single measurements. For details about the remote control feature, see appendix 4.6 in the
getting started guide, IM WT1801-03EN.
IM WT1801-01EN
6-1
7 Numeric Data Display
Numeric Data Display (NUMERIC)
You can press NUMERIC to make the numeric data display appear.
Each time you press NUMERIC the display format switches in order between 4 Items, 8 Items, 16 Items, Matrix,
All Items, Hrm List Single, Hrm List Dual, and Custom.
Display Format (FORM)
The display format options vary depending on the current display.
• Numeric data display format
• Waveform display format
• Trend display format
• Bar graph display format
• Vector display format
• Setup parameter list display format
• High speed data capturing settings
Numeric Data Display Format
You can select the number of numeric data items that are displayed simultaneously from the choices below or
choose to display a list of items.
4-Value Display (4 Items)
Four numeric data values are displayed in one column.
8-Value Display (8 Items)
• When the display mode is Numeric, eight numeric data values are displayed in one column.
• When the display is split, eight numeric data values are displayed in two columns.
16-Value Display (16 Items)
Sixteen numeric data values are displayed in two columns.
Matrix (Matrix) and All (All Items) Displays
A table of numeric data is displayed with measurement functions listed vertically and symbols indicating
elements and wiring units listed horizontally. The number of displayed items varies depending on the number of
elements that are installed in the WT1800.
IM WT1801-01EN
7-1
7 Numeric Data Display
Single Harmonics List Display (Hrm List Single; option)
• When the display mode is Numeric, up to 42 of the harmonic order data items of a single measurement
function are displayed in two columns.
• When the display is split, up to 22 of the harmonic order data items of a single measurement function are
displayed in two columns.
Measurement function display area
(Data concerning all harmonics)
Harmonic order data display area
Measurement functions
Numeric data for each harmonic
Distortion factors of each harmonic
(When the selected measurement function
is U, I, or P, Uhdf, Ihdf, or Phdf is displayed.)
Dual Harmonics List Display (Hrm List Dual; option)
• When the display mode is Numeric, the numeric values of two measurement functions are displayed in two
separate columns, each containing up to 22 numeric values.
• When the display is split, the numeric values of two measurement function are displayed in two separate
columns, each containing up to 12 numeric values.
Measurement function display area
(Data concerning all harmonics)
Harmonic order data display area
Measurement function 1
Measurement function 2
Numeric data for each harmonic Distortion factors of each harmonic
(When the selected measurement function is
U, I, or P, Uhdf, Ihdf, or Phdf is displayed.)
7-2
IM WT1801-01EN
7 Numeric Data Display
Custom Display (Custom)
You can use an illustration (.BMP) or picture (.BMP) from a PC or other device as the background of the display.
You can arrange numeric data boxes on top of this background to create a custom display. Numeric data
appears in this custom display.
Background (.BMP)
Power
supply
Inverter
Numeric data box
Motor
Voltage
V
Current
A
Power
Display items (.TXT)
Mechanical
power
W
Conversion
efficiency
Total conversion
efficiency
230.12
228.76
4.2615
3.2729
0.75342k
0.59864k
79.451
%
75.559
60.033
%
Power
supply
Inverter
Motor
Voltage 230.12
228.76
V
Current 4.2615
3.2729
A
Power
0.4523k
0.59864k
0.75342k
Conversion
efficiency
79.451
Total conversion
efficiency
Mechanical
power
0.4523k W
75.559 %
60.033 %
Display
Switching the Displayed Page (PAGE UP/PAGE DOWN)
You can switch the displayed page and display a new set of items.
• PAGE : The next page is displayed.
• PAGE : The previous page is displayed.
In the 4-, 8-, and 16-Value Displays
You can switch between and display pages 1 to 12.
In the Matrix Display
You can switch between and display pages 1 to 9.
In the All Items Display
The first page is always displayed in the top half of the screen. You can switch between pages 2 and later pages
in the bottom half of the screen. When the display is split and the All Items display is shown, you can switch
between all pages, including page 1, in order.
In the Single Harmonics List and Dual Harmonics List Displays
You can switch separately between the pages of the measurement function display (on the left side of the
screen) and the harmonic order data display (on the right side of the screen). Use the left and right cursor keys
to select the display whose pages you want to switch between.
In the Custom Display
When you have configured the custom display to contain multiple pages, you can switch between each of the
pages.
Jumping to the First or Last Page (PAGE TOP/PAGE END)
•
•
:
:
IM WT1801-01EN
The last page is displayed.
The first page is displayed.
7-3
7 Numeric Data Display
Number of Displayed Digits (Display Resolution)
The number of displayed digits (display resolution) for voltage, current, active power, apparent power, reactive
power, and so on is as follows:
• If the value is less than or equal to 60000: Five digits.
• If the value is greater than 60000: Four digits.
For details, see appendix 4 in the getting started guide, IM WT1801-03EN. When the range rating (rated value
of the specified measurement range) is specified, the Σ functions of the voltage, current, active power, apparent
power, reactive power, and so on, are set to the decimal place and unit of the element with the lowest number of
displayed digits (display resolution) in the wiring unit. For details about the display resolution during integration,
see “Number of Displayed Digits (Display Resolution)” under “Integrated Power (Watt hours).”
Click here.
Display Item (ITEM)
The display item options vary depending on the current display.
• Numeric data display format
• 4-, 8-, and 16-value displays (4 Items/8 Items/16Items)
• Matrix display (Matrix)
• All Items display (All Items)
• Single Harmonics and Dual Harmonics Lists (Hrm List Single/Dual; option)
• Custom display (Custom)
• Waveform display items
• Trend display items
• Bar graph display items
• Vector display items
• High speed data capturing display items
For a list of the measurement functions and their descriptions, see “Items That This Instrument Can Measure.”
Click here.
Example of How Measurement Functions Are Displayed in the Numeric Data Display
True rms voltage of element 1
Urms1
Element 1
True rms value
Voltage
Simple average of the currents of the elements in wiring unit ΣA
IdcΣA
Σ function of wiring unit ΣA
Simple average
Current
Voltage of the 20th order of element 2
U2
(20)
Voltage
Element 2
Harmonic order 20
Simple average of the fundamental currents of the elements in wiring unit ΣB
IΣB
(1)
Current
Σ function of wiring unit ΣB
Order 1 (fundamental wave)
7-4
IM WT1801-01EN
7 Numeric Data Display
Notes about the Numeric Data Display
• “-------” is displayed if a measurement function is not selected or if there is no numeric data.
• If Urms, Umn, Udc, Urmn, Uac, Irms, Imn, Idc, Irmn, or Iac exceeds 140% of the measurement range, “-OL-”
is displayed to indicate an overload value.
• If the voltage or current exceeds 140% of the measurement range, “-OL-” is displayed to indicate an overload
value for P.
• If the measured or computed result cannot be displayed using the specified decimal place or unit, “-OF-” (for
overflow) is displayed.
• When the measured voltage or current value is at or below the percentage of the measurement range
indicated below, the values of Urms, Umn, Urmn, Irms, Imn, Irmn, and other measurement functions that are
based on them are displayed as zero. The λ and Φ functions will return errors (“Error” is displayed).
• When the Crest Factor Is Set to CF3
When Urms, Uac, Irms, or Iac is 0.5% or less When Umn, Urmn, Imn, or Irmn is 2% or less
• When the Crest Factor Is Set to CF6
When Urms, Uac, Irms, or Iac is 1.0% or less When Umn, Urmn, Imn, or Irmn is 4% or less
• If the analysis window width (number of cycles of the fundamental signal) that is determined by the
fundamental frequency is shorter than the data update interval, harmonic data is not measured, and “-------” (no
data) is displayed. If this happens, increase the data update interval. For example, if the data update interval
is 50 ms and the fundamental frequency is 10 Hz (the period is 100 ms), the analysis window will be 1 wave
wide (see section 6.6 in the getting started guide, IM WT1801-03EN), and the data measurement interval will
be 100 ms. In this case, the time required for harmonic measurement is approximately 150 ms or greater (data
measurement interval + data processing time). To measure and display harmonic data, set the data update
interval to a value greater than or equal to 200 ms.
• There is no overload value indication (“-OL-”) or zero indication (suppression to zero) for the numeric data of
harmonic orders 0 (DC) to 500.
• If the measured frequency is outside the measurement range, the fU or fI function returns an error (“Error” is
displayed).
• If the power factor λ is greater than 1 and less than or equal to 2, λ returns 1. Φ returns zero.
• If λ is greater than 2, λ and Φ return errors (“Error” is displayed).
4-, 8-, and 16-Value Displays (4 Items/8 Items/16Items)
Item Number to Set (Item No.)
Select the number of the item that you want to configure.
Function (Function)
You can select any of the measurement function types listed under “Items That This Instrument Can Measure.”
Click here.
If you select None, no measurement function is displayed for the selected item.
Direct Function Selection (U/I/P, S/Q/λ/Φ, WP/q/TIME, FU/FI/η, and U/I MODE)
When the menu is not displayed, you can change which of the selected measurement functions is displayed
using the function select keys (U/I/P, S/Q/λ/Φ, WP/q/TIME, FU/FI/η, and U/I MODE).
U/I/P, S/Q/λ/Φ, WP/q/TIME, and FU/FI/η
Each time you press U/I/P, the selected function switches in order between U, I, and P. The same is true for S/Q/
λ/Φ, WP/q/TIME, and FU/FI/η.
U/I MODE
Each time you press the key, measurement function U or I switches in order between rms, mean, dc, rmean, and
ac.
IM WT1801-01EN
7-5
7 Numeric Data Display
Element (Element/Σ)
• You can select the element/wiring unit from the options below. The available options vary depending on the
installed elements.
Element1, Element2, Element3, Element4, Element5, Element6, ΣA, ΣB, and ΣC
• If the selected wiring unit does not have any elements assigned to it, because there is no data, “-------” (no
data) is displayed. For example, if elements are assigned to ΣA but not to ΣB, the measurement function for
ΣB is displayed as “-------” (no data).
Directly Selecting Elements (ELEMENT)
When the menu is not displayed, you can change the element number of the selected measurement function by
pressing ELEMENT.
Changing Elements Simultaneously (ALL)
You can change the elements and wiring units of all displayed items at once. The ALL indicator illuminates.
Order (Order; option)
When you select a function that has harmonic data, you can set the displayed harmonic order within the
following range.
Total (Total value) or 0 (dc) to 500
The orders that can be specified vary depending on the measurement function. For details, see “Harmonic
Measurement Function Orders.”
Click here.
The numeric data corresponding to harmonic orders above the maximum measurable harmonic order is
displayed as “-------” (no data). For information about the maximum measurable harmonic order, see “Maximum
Harmonic Order to Be Measured (Max Order).”
Click here.
Resetting the Display Items (Reset Items)
Reset Patterns (Reset Pattern)
You can select the reset method from the following options.
• Element Origin: The numeric data for each element is displayed on each page. The pattern that the data is
arranged in varies depending on the number of installed elements.
• Function Origin: The numeric data for each function is displayed on each page. The pattern that the data is
arranged in varies depending on the number of installed elements.
• Clear Current Page: All the display items on the current page are set to None.
• Clear All Pages: All the display items on every page are set to None.
Resetting the Items (Reset Items Exec)
Reset the items.
Turning the Display Frame On and Off (Display Frame)
Set whether to show the display frame.
7-6
IM WT1801-01EN
7 Numeric Data Display
Matrix display (Matrix)
Item Number to Set (Item No.)
This is the same as setting the item number in the 4-, 8-, and 16-value displays.
Click here.
Function (Function)
This is the same as setting the function in the 4-, 8-, and 16-value displays.
Click here.
In the matrix display, if you choose a measurement function that does not require an element or wiring unit (such
as η1 to η4, F1 to F20, Ev1 to Ev8, etc.), data is displayed in the first column.
Direct Function Selection (U/I/P, S/Q/λ/Φ, WP/q/TIME, FU/FI/η, and U/I MODE)
This is the same as direct function selection in the 4-, 8-, and 16-value displays.
Click here.
Order (Order; option)
This is the same as setting the order in the 4-, 8-, and 16-value displays.
Click here.
Resetting the Display Items (Reset Items)
This is the same as resetting the display items in the 4-, 8-, and 16-value displays.
Click here.
Columns (Column Settings)
Number of Columns (Column Num)
You can set the number of columns to 4 or 6.
Column Number (Column No.)
Select the number of the column that you want to configure.
Element (Element/Σ)
• You can select the element/wiring unit from the options below. The available options vary depending on the
installed elements.
None, Element1, Element2, Element3, Element4, Element5, Element6, ΣA, ΣB, and ΣC
• If you select None, no measurement data is displayed in the selected column.
• If the selected wiring unit does not have any elements assigned to it, because there is no data, “-------” (no
data) is displayed. For example, if elements are assigned to ΣA but not to ΣB, the measurement function for
ΣB is displayed as “-------” (no data).
Directly Selecting Elements (ELEMENT)
This is the same as direct element selection in the 4-, 8-, and 16-value displays.
Click here.
Resetting the Settings (Reset Items Exec)
Reset the column settings.
Turning the Display Frame On and Off (Display Frame)
This is the same as turning the display frame on and off in the 4-, 8-, and 16-value displays.
Click here.
IM WT1801-01EN
7-7
7 Numeric Data Display
All Items Display (All Items)
You cannot change individual measurement functions. Change the display by pressing PAGE UP and PAGE
DOWN or the up and down cursor keys.
The number of displayed pages varies as indicated below depending on the installed options.
Harmonic Measurement Option or Simultaneous
Dual Harmonic Measurement Option
Installed
Not installed
Delta computation option Installed
12 pages
8 pages
Not installed 12 pages
7 pages
Order (Order (k); option)
This setting is valid on the 9th or 10th page. On the 9th or 10th page, the order setting appears in the upper left of
the screen. This is the same as setting the order in the 4-, 8-, and 16-value displays.
Click here.
Turning the Display of the Numeric Data for All Elements and Wiring Units On and Off
(Display All Elements)
• OFF
The numeric data is displayed in six columns. If there is a total of seven or more elements and wiring units,
you can change the displayed elements and wiring units by pressing the left and right cursor keys.
• ON
When there is a total of 7 or more elements and wiring units, all the numeric data for the elements and wiring
units is displayed in nine columns. If you select ON when the total number of elements and wiring units is six
or less, the display is the same as when OFF is selected.
Turning the Display Frame On and Off (Display Frame)
This is the same as turning the display frame on and off in the 4-, 8-, and 16-value displays.
Click here.
7-8
IM WT1801-01EN
7 Numeric Data Display
Single Harmonics and Dual Harmonics Lists (Hrm List Single/
Dual; option)
For each measurement function, you can display the numeric data for a harmonic order from 0 (DC) to 500 or for
all harmonic orders in two columns.
This item is available on models with the harmonic measurement option or the simultaneous dual harmonic
measurement option.
Item Number to Set (List Item No.)
• You can specify two lists to show in the harmonic order data display area (the right side of the screen). Select
the number—1 or 2—of the list that you want to select.
• When Hrm List Single is selected, the data of List Item No1 is listed in two columns.
• When Hrm List Dual is selected, the data of List Item No1 is listed in one column, and the data of List
ItemNo2 is listed in another column.
• You cannot change individual items in the measurement function display area (the left side of the screen).
Change the display by pressing PAGE UP and PAGE DOWN or the up and down cursor keys.
Function (Function)
Select the measurement function to show in the harmonic order data display area from the following options.
U, I, P, S, Q, λ, Φ, ΦU, ΦI, Z, Rs, Xs, Rp, and Xp
Direct Function Selection (U/I/P, S/Q/λ/Φ, WP/q/TIME, FU/FI/η, and U/I MODE)
Directly select the measurement function to show in the harmonic order data display area. This is the same as
direct function selection in the 4-, 8-, and 16-value displays.
However, when you are displaying the single harmonics or dual harmonics list, you can only select measurement
functions that have harmonic order data. You can press U/I/P to select U, I, or P. You can press S/Q/λ/Φ to select
S, Q, λ, Φ, ΦU, or ΦI. WP/q/TIME, FU/FI/η, and U/I MODE are invalid.
Element (Element/Σ)
You can select the element or wiring unit to display in the harmonic order data display area. This is the same as
setting the element in the 4-, 8-, and 16-value displays.
Click here.
Directly Selecting Elements (ELEMENT)
You can select the element or wiring unit to display in the harmonic order data display area. This is the same as
direct element selection in the 4-, 8-, and 16-value displays.
Click here.
Order
The Total value and 0 (DC) order numeric data is always displayed at the top of the harmonic order data display
area. To switch between the displays of the numeric data for harmonic orders 1 to 500, press PAGE UP and
PAGE DOWN or use the up and down cursor keys.
The number of harmonic orders that switch when you change the page is indicated below.
Hrm List Single
Hrm List Dual
Normal display (1 screen) Split display
40 orders
20 orders
20 orders
10 orders
Turning the Display Frame On and Off (Display Frame)
This is the same as turning the display frame on and off in the 4-, 8-, and 16-value displays.
Click here.
IM WT1801-01EN
7-9
7 Numeric Data Display
Custom Display (Custom)
Loading a Display Configuration File (Load Items)
On the file list, specify a file to load display configuration data from. The extension is .TXT.
For information about how to configure the file list display and how to operate files and folders, see “File
Operations (Utility).”
Click here.
Loading a Background File (Load Bmp)
On the file list, specify a background file to load. The extension is .BMP.
If you use a commercial graphics program to create an image that meets the following specifications, you can
load the image to the WT1800.
• File format: BMP
• Resolution: 800 × 672 pixels
• Color scale: 16-bit high color (R: 5 bits, G: 6 bits, B: 5 bits) or 24-bit true color (R: 8 bits, G: 8 bits, B: 8 bits)
• Size: Approx. 1 MB (16 bit) or approx. 1.6 MB (24 bit)
Click here.
• If you attempt to load an image that does not meet the above specifications, the image will not be displayed
properly, or an error message will appear and you will not be able to load the image.
• After you properly load a display configuration file and a background file, if you restart the WT1800 and the
same background file is not in the same location, the background will return to its default.
Simultaneously Loading a Display Configuration File and a Background File (Load
Items & Bmp)
When you select a display configuration file (.TXT) from the file list and load it, if there is a background file with a
.BMP extension and the same name as the display configuration file, that file is also loaded.
Click here.
If there is no background file with the same name as the display configuration file in the same directory as the
display configuration file, an error occurs.
Display Configuration (Edit Items)
Total Number of Items (Total Items)
You can set the total number of numeric data boxes to display to a number from 1 to 192.*
Number of Items per Page (Items Per Page)
You can set the total number of numeric data boxes to display per page to a number from 1 to 192.*
The total number of pages is Total Items/Items Per Page.
* The ranges of Total Items and Items Per Page are related as indicated below.
• Total Items:
Items Per Page to Items Per Page × 12
• Items Per Page: Total Items/12 to Total Items
7-10
IM WT1801-01EN
7 Numeric Data Display
Customizing the Displayed Items (Custom Items)
• Item Number to Set (Item No.)
Select the number of the item that you want to configure.
• Function (Function)
This is the same as setting the function in the 4-, 8-, and 16-value displays.
Click here.
If you select None, you can display a character string in the numeric data box. Select the String menu item to
enter the string.
• Element (Element/Σ)
This setting is valid when Function is not set to None. This is the same as setting the element in the 4-, 8-,
and 16-value displays.
Click here.
• Order (Order; option)
This is the same as setting the order in the 4-, 8-, and 16-value displays.
Click here.
If you set Function to None, instead of the Order menu item, a menu item for entering a string (String)
appears.
• String (String)
This menu item appears when you set Function to None. Enter the character string to display in the numeric
data box. You can enter a string of up to 15 characters in length.
If you do not set Function to None, instead of the String menu item, the Order menu item appears.
• X Display Position (X Pos)
Set the position where the left edge of the numeric data box will appear on the screen to a value from 0 (the
left edge of the screen) to 800 (the right edge of the screen).
• Y Display Position (Y Pos)
Set the position where the top edge of the numeric data box will appear on the screen to a value from 0 (the
top of the screen) to 671 (the bottom of the screen).
• Font Size (Font Size)
Select the font size from the options below.
14, 16, 20, 24, 32, 48, 64, 96, and 128
• Font Color (Font Color)
Select the font color from the options below.
Yellow, Green, Magenta, Cyan, Red, Orange, Light Blue, Purple, Blue, Pink, Light Green, Dark Blue, Blue
Green, Salmon Pink, Mid Green, Gray, White, Dark Gray, Blue Gray, and Black
IM WT1801-01EN
7-11
7 Numeric Data Display
Saving the Display Configuration (Save Custom Items)
You can save the display configuration that you have created to the specified storage medium. The extension is
.TXT.
• Displaying a File List and Specifying the Save Destination (File List)
On the file list, specify the save destination. For information about how to configure the file list display and
how to operate files and folders, see “File Operations (Utility).”
Click here.
• Automatic File Naming (Auto Naming)
This is the same as the auto naming feature for saving and loading data.
Click here.
• File Name (File Name)
This is the same as file name setting for saving and loading data.
Click here.
• Saving (Save Exec)
Saves the display configuration.
• Note that if there is a file with the same name in the save destination, it will be overwritten without warning.
• File names are not case sensitive.
Turning the Display Frame On and Off (Display Frame)
This is the same as turning the display frame on and off in the 4-, 8-, and 16-value displays.
Click here.
7-12
IM WT1801-01EN
8 Computation
Computation (MEASURE)
You can set the following items.
• User-defined functions (User Defined Function)
• Measuring the Average Active Power
• MAX hold (Max Hold)
• User-defined events (User Defined Event)
• Apparent power, reactive power, and corrected power equations (Formula)
• Sampling frequency (Sampling Frequency)
• Phase difference display format (Phase)
• Master/slave synchronization measurement (Sync Measure)
• Voltages or currents whose frequencies will be measured (FREQ MEASURE)
User-Defined Functions (User Defined Function)
You can combine function symbols to create equations and use the numeric data of the combined functions to
determine the value of the equation. It is convenient to use a USB keyboard when entering multiple equations or
particularly long equations.
User-defined functions allow you to determine physical values other than those of the measurement functions
by combining operands. The measurement functions that you can specify for the efficiency equation are fixed
at power and motor output. However, by using user-defined functions, you can create equations consisting of
measurement functions other than power and motor output measurement functions to determine ratios other
than efficiency.
Selecting Which User-Defined Function to Configure
Select the number of the user-defined function that you want to configure from the options below.
• User Defined F01 to F05: User-defined functions F1 to F5
• User Defined F06 to F10: User-defined functions F6 to F10
• User Defined F11 to F15: User-defined functions F11 to F15
• User Defined F16 to F20: User-defined functions F16 to F20
Turning the Computation of a User-Defined Function On or Off
Selecting Whether to Compute a User-Defined Function
User-Defined Function Name (Name)
• Number of characters: Up to eight
• Usable characters:
Spaces and all characters that are displayed on the keyboard
Unit (Unit)
• Number of characters: Up to eight
• Usable characters:
Spaces and all characters that are displayed on the keyboard
IM WT1801-01EN
8-1
8 Computation
Expression (Expression)
Operation Type
You can use combinations of measurement functions and element numbers (e.g., Urms1) as operands to
configure up to 20 equations (F1 to F20). There can be up to 16 operands in 1 equation.
The different types of operands are listed below (measurement function: operand).
• Normal Measurement
Voltage, current, and power
Urms: URMS( )
Umn: UMN( )
Udc: UDC( )
Urmn: URMN( )
Uac: UAC( )
U+pk: UPPK( )
U–pk: UMPK( )
CfU: CFU( )
fU: FU( )
Irms: IRMS( )
Imn: IMN( )
Idc: IDC( )
Irmn: IRMN( )
Iac: IAC( )
I+pk: IPPK( )
I–pk: IMPK( )
CfI: CFI( )
fI: FI( )
P: P( )
S: S( )
Q: Q( )
λ: LAMBDA( )
Φ: PHI( )
Pc: PC( )
P+pk: PPPK( )
P–pk: PMPK( )
–––
q: AH( )
q+: AHP( )
q–: AHM( )
Time: TI( )
WS: SH( )
WQ: QH( )
Integrated power
Wp: WH( )
Wp+: WHP( )
Wp–: WHM( )
Efficiency
η1: ETA1( ) to η4: ETA4( )
User-defined functions
F1: F1( ) to F20: F20( )
User-defined events
Ev1: EV1( ) to Ev8: EV8( )
• Harmonic Measurement (Option)
8-2
U(k): UK( , )
S(k): SK( , )
I(k): IK( , )
Q(k): QK( , )
ΦU(k): UPHI( , )
Z(k): ZK( , )
–––
Uhdf(k): UHDF( , )
Uthd: UTHD( )
Uthf: UTHF( )
Utif: UTIF( )
hvf: HVF( )
fPLL1: PLLFRQ1( )
ΦU1–U2: PHIU1U2( )
ΦU2–I2: PHIU2I2( )
ΦI(k): IPHI( , )
Rs(k): RSK( , )
Rp(k): RPK( , )
Ihdf(k): IHDF( , )
Ithd: ITHD( )
Ithf: ITHF( )
Itif: ITIF( )
hcf: HCF( )
fPLL2: PLLFRQ2( )
ΦU1–U3: PHIU1U3( )
ΦU3–I3: PHIU3I3( )
P(k): PK( , )
λ(k): LAMBDAK( , )
Φ(k): PHIK( , )
Xs(k): XSK( , )
Xp(k): XPK( , )
Phdf(k): PHDF( , )
Pthd: PTHD( )
–––
–––
–––
Kfactor: KFACT( )
ΦU1–I1: PHIU1I1( )
–––
IM WT1801-01EN
8 Computation
• Delta Computation (Option)
ΔU1( ): DELTAU1( )
ΔU2( ): DELTAU2( )
ΔU3( ): DELTAU3( )
ΔUΣ( ): DELTAUSIG( )
ΔU1rms( ): DELTAU1RMS( )
ΔU2rms( ): DELTAU2RMS( )
ΔU3rms( ): DELTAU3RMS( )
ΔUΣrms( ): DELTAUSIGRMS( )
ΔU1dc( ): DELTAU1DC( )
ΔU2dc( ): DELTAU2DC( )
ΔU3dc( ): DELTAU3DC( )
ΔUΣdc( ): DELTAUSIGDC( )
–––
ΔI( ): DELTAI( )
–––
–––
–––
ΔU1mean( ): DELTAU1MN( )
ΔU2mean( ): DELTAU2MN( )
ΔU3mean( ): DELTAU3MN( )
ΔUΣmean( ): DELTAUSIGMN( )
ΔU1ac( ): DELTAU1AC( )
ΔU2ac( ): DELTAU2AC( )
ΔU3ac( ): DELTAU3AC( )
ΔUΣac( ): DELTAUSIGAC( )
–––
ΔP1( ): DELTAP1( )
ΔP2( ): DELTAP2( )
ΔP3( ): DELTAP3( )
ΔPΣ( ): DELTAPSIG( )
ΔU1rmean( ): DELTAU1RMN( )
ΔU2rmean( ): DELTAU2RMN( )
ΔU3rmean( ): DELTAU3RMN( )
ΔUΣrmean( ): DELTAUSIGRMN( )
ΔIrms( ): DELTALRMS( )
ΔImean( ): DELTAIMN( )
ΔIrmean( ): DELTAIRMN( )
ΔIdc( ): DELTAIDC( )
ΔIac( ): DELTAIAC( )
• Motor Evaluation (Option)
Speed: SPEED( )
Slip: SLIP( )
EaI: EAI( )
Torque: TORQUE( )
SyncSp: SYNC( )
–––
Pm: PM( )
EaU: EAU( )
–––
• Auxiliary Input (Option)
Aux1: AUX1( )
Aux2: AUX2( )
Setting Operand Parameters
The parameters that you need to enter depend on whether the function is followed by “( , )” or “( )”.
• Setting Parameters for Functions Followed by “( , )”
Specify the element to the left of the comma, and specify the harmonic order to the right of the comma. For
example: (E1,OR2).
• Symbols used to represent elements
E1 to E6:
Elements 1 to 6
E7 to E9:
Wiring units ΣA to ΣC
• Symbols that indicate the harmonic order (Order)*
ORT: Total value
OR0: dc
OR1: Fundamental wave
OR2 to OR500: Harmonic orders 2 to 500
* On models with the harmonic measurement option or the simultaneous dual harmonic measurement
option.
• Setting Parameters for Functions Followed by “( )”
Specify the element. You do not need to specify a harmonic order. For example: (E1).
For information about the parameters that you can use with each operand, see appendix 6 in the getting started
guide, IM WT1801-03EN.
IM WT1801-01EN
8-3
8 Computation
Values Substituted in Operands
• The unit of TI values is seconds.
• η1 to η4 are displayed as percentages (see in appendix 1 in the getting started guide, IM WT1801-03EN).
However, in this section ETA1 to ETA4 are described as ratios.
Example When η1 is 80%, ETA1 is 0.8
• The U1 in PHIU1U2 represents the voltage signal of the element whose element number is the smallest in
the wiring unit (ΣA, ΣB, or ΣC). For example, if input elements 2, 3, and 4 are assigned to wiring unit ΣA,
PHIU1U2 is the phase difference between the voltage signals of input elements 2 and 3.
• User-defined equations can use other user-defined equations with smaller numbers as operands. For
example, the equation for user-defined function F3 can be set to F1( ) + F2( ). This allows equations that
would otherwise exceed 50 characters in length to be computed. This can be accomplished by for example
setting equations in F1 and F2, and then adding or dividing those equations in F3. This feature is also
convenient when defining multiple equations that include common operands. For example, you can set
common operands in F1, and then set F4 as F3( ) divided by F1( ) and set F5 as F4( ) divided by F1( ).
However, if you enter a user-defined equation with a number that is greater than or equal to its own number,
correct results will not be obtained. For example, if you set user-defined function F3 to F1( )+F3( ) or to
F1( )+F4( ), the computed result will be displayed as “-------” (no data) or “-OF-” (overflow).
Operators
The following operators can be used in equations.
Operator
+, –, *, /
ABS
SQR
SQRT
LOG
LOG10
EXP
NEG
Example
U(E1,OR1)–U(E2,OR1)
ABS(P(E1,ORT) + P(E2,ORT))
SQR(I(E1,OR0))
SQRT(ABS(I(E1,OR3)))
LOG(U(E1,OR25))
LOG10(U(E1,OR25))
EXP(U(E1,OR12))
NEG(U(E1,OR12))
Description
Basic arithmetic
Absolute value
Square
Square root
Natural logarithm
Common logarithm
Exponent
Negation
Number and Type of Characters That Can Be Used in Equations
• Number of characters: Up to 50
• Usable characters:Spaces and all characters that are displayed on the keyboard
On the keyboard, press
to enter operand and equation characters. The characters that you can select are
indicated below.
ABS(
SQR(
SQRT(
LOG(
LOG10(
EXP(
NEG(
PPK(
MPK(
CF
TI(
THD(
THF(
TIF(
HVF(
HCF(
KFACT(
EAU(
EAI(
PLLFRQ(
–––
RMS(
MN(
RMN(
DC(
AC(
PC(
–––
Equation Examples
An equation to determine the rms value of the harmonic components of the voltage signal of input element 2.
(Total rms voltage value)2 - (Rms value of the fundamental voltage signal)2
SQRT(SQR(U(E2,ORT))–SQR(U(E2,OR1)))
8-4
IM WT1801-01EN
8 Computation
If an operand in an equation is undetermined, the computed result is displayed as “-------” (no data). This
occurs when a delta computation measurement function is in the equation, but delta computation is turned
OFF, or when a measurement function of an element that is not installed is in the equation.
Measuring the Average Active Power
The average active power can be computed for devices, such as intermittent control devices, whose power
fluctuates. Use a user-defined function to specify the equation for computing the average active power.
Average active power =
Integrated power
Elapsed integration time
Use the equation above. For example, to determine the average active power of element 1, set the equation of a
user-defined function as follows:
WH(E1)/(TI(E1)/3600)
The unit of TI values is seconds.
MAX Hold (Max Hold)
Selecting Whether to Hold the Maximum Numeric Value (MAX value) You can determine the measurement
functions whose maximum values will be held using a user-defined function. The different types of operands are
listed below (measurement function: operand).
Urms: URMSMAX( )
Umn: UMEANMAX( )
Udc: UDCMAX( )
Urmn: URMEANMAX( )
Uac: UACMAX( )
U+pk: UPPEAKMAX( )
U–pk: UMPEAKMAX( )
Irms: IRMSMAX( )
Imn: IMEANMAX( )
Idc: IDCMAX( )
Irmn: IRMEANMAX( )
Iac: IACMAX( )
I+pk: IPPEAKMAX( )
I–pk: IMPEAKMAX( )
P: PMAX( )
S: SMAX( )
Q: QMAX( )
–––
–––
P+pk: PPPEAKMAX( )
P–pk: PMPEAKMAX( )
To hold the maximum value of the Urms for element 1, enter URMSMAX(E1) in the equation for a user-defined
function, and enable MAX hold.
• For information about the parameters that you can use with each operand, see appendix 6 in the getting
started guide, IM WT1801-03EN.
• The maximum values of the data above are held while the MAX hold function is enabled.
• The D/A output values, the values in the data lists printed by the built-in printer, and the communication values
all reflect the held maximum values.
• When MAX hold is applied to measurement functions that have positive and negative values, the WT1800
compares the absolute values to determine the maximum value.
• To reset held maximum values, turn MAX hold off, and then turn it on again.
IM WT1801-01EN
8-5
8 Computation
User-Defined Events (User Defined Event)
User-defined events can be used to trigger data storage and automatic printing (option). You can define up to
eight user-defined events.
User-Defined Event Number (Event No.)
Select a user-defined event number from 1 to 8.
Turning User-Defined Events On and Off
Select whether to enable user-defined events.
User-Defined Event Name (Event Name)
• Number of characters: Up to eight
• Usable characters:Spaces and all characters that are displayed on the keyboard
Indication of User-Defined Event Occurrence (TRUE/FALSE)
Set the character strings to show when a user-defined event occurs and when it does not occur.
• Number of characters: Up to six
• Usable characters:
Spaces and all characters that are displayed on the keyboard
Judgment Condition Specification Method (Expression)
Select the method for specifying judgment conditions from the following options.
• Range (Range): Specify judgment conditions using ranges of measurement function values or differences
from a reference value.
• Condition (Condition): Specify judgment conditions using user-defined events.
Range (Range)
Specify the judgment condition here when you have set the judgment condition specification method to Range.
• Function (Function)
You can select any of the measurement function types listed under “Items That This Instrument Can
Measure.”
Click here.
• Element (Element/Σ)
You can select the element/wiring unit from the options below. The available options vary depending on the
installed elements.
Element1, Element2, Element3, Element4, Element5, Element6, ΣA, ΣB, and ΣC
• Order (Order; option)
This is the same as setting the harmonic order in the 4-, 8-, and 16-value displays.
Click here.
• Judgment Condition
Select the method for comparing the measured value and the reference value from the following options.
OFF, <, <=, =, >, >=, != (not equal)
• Reference Value
Select a number from –9.9999 T to 9.9999 T.
8-6
IM WT1801-01EN
8 Computation
For example, a condition that is true when 150 < the measured power value of element 1 < 160 W and false
otherwise would be configured as shown below.
Condition (Condition)
Specify the judgment condition here when you have set the judgment condition specification method to
Condition.
Inverts the condition
Event specification boxes
AND/OR/END specification boxes
Inverting the Condition (Inverse)
You can invert the judgment of the condition indicated to the right of the check box.
Event Specification Boxes
You can select the number of a user-defined event that is smaller than the number of the user-defined event that
you are currently configuring. For example, when you are configuring the conditions of user-defined event Ev3,
you can select Ev1 or Ev2.
AND/OR/END Specification Boxes
• AND and OR
To use multiple user-defined events to configure a condition, set the method of combining the events to
logical AND or logical OR. When you select AND or OR, an event specification box appears to the right of the
AND/OR/END specification box. The number of user-defined events that you can combine is indicated below.
When you reach the maximum number of combinable user-defined events, no AND/OR/END specification
box appears to the right of the last event.
• Ev1: 0. You cannot use other user-defined events as conditions. Set the judgment condition using a range.
• Ev2: 1 (Ev1)
• Ev3: 2 (Ev1 and Ev2)
• Ev4: 3 (Ev1 to Ev3)
• Ev5: 4 (Ev1 to Ev4)
• Ev6: 5 (Ev1 to Ev5)
• Ev7: 6 (Ev1 to Ev6)
• Ev8: 7 (Ev1 to Ev7)
• END
Select END to end the definition of the condition. No event specification box appears to the right of an AND/
OR/END specification box that has been set to END.
If you set the event judgment condition to a range and the function of the judgment condition returns a value
of “-------” (no data), because judgment cannot be performed, the judgment result is FALSE. For example,
when integration is not being performed, if the function of event Ev1 is set to integrated power (WP) and
the judgment condition is WH(E1)>0, the measured data is displayed as “-------” (no data), so the judgment
for Ev1 is FALSE. Also, if you set the judgment condition specification method to Condition and events that
cannot be judged are included in the judgment conditions, the judgment result is FALSE. For example, if you
set the judgment condition of event Ev2 to NOT(EV1()), if the judgment for Ev1 is FALSE because of the
reason given in the example above, the result for Ev2 is not TRUE but FALSE.
IM WT1801-01EN
8-7
8 Computation
Apparent Power, Reactive Power, and Corrected Power
Equations (Formula)
Equation for Apparent Power (S Formula)
You can select the voltage and current to use to compute the apparent power (voltage × current) from the
following options.
• Urms*Irms
The product of the true rms values of the voltage and current
• Umean*Imean
The product of the voltage’s and current’s rectified mean values calibrated to the rms values
• Udc*Idc
The product of the simple averages of the voltage and current
• Umean*Irms
The product of the voltage’s rectified mean value calibrated to the rms value and the current’s true rms value
• Urmean*Irmean
The product of the voltage’s and current’s rectified mean values
Apparent Power and Reactive Power Computation Types (S,Q Formula)
There are three types of power: active power, reactive power, and apparent power. In general, they are defined
by the following equations.
Active power P = UIcosΦ
(1)
Reactive power Q = UIsinΦ (2)
Apparent power S = UI
(3)
U = rms voltage; I = rms current; Φ = Phase difference between voltage and current
The power values are related as follows:
(Apparent power S)2 = (Active power P)2 + (Reactive power S)2
(4)
The three-phase power is the sum of the power of each phase.
These definitions only apply for sine waves. The measured values for apparent power and reactive power
vary for distorted waveform measurement depending on which of the above definitions are combined for the
computation. Because the equations for deriving the apparent and reactive power for distorted waveforms
are not defined, none of the equations can be said to be more correct than the other. Therefore, the WT1800
provides three equations, Type 1 to Type 3, for determining the apparent power and reactive power.
Unlike apparent power and reactive power, active power is derived directly from the sampled data, so errors
resulting from different definitions do not occur.
Type 1 (The method used in the normal mode of conventional WT series power meters)
The WT1800 calculates the apparent power of each phase using equation 3, calculates the reactive power of
each phase using equation 2, and sums the results to derive the power.
Active power for a three-phase, four-wire system
PΣ = P1 + P2 + P3
Apparent power for a three-phase, four-wire system
SΣ = S1 + S2 + S3 ( = U1 × I1 + U2 × I2 + U3 × I3)
Reactive power for a three-phase, four-wire system
QΣ = Q1 + Q2 + Q3
(=s1× (U1×I1)2−P12+s2× (U2×I2)2−P22+s3× (U3×I3)2−P32 )
The signs for s1, s2, and s3 are negative when the current leads the voltage and positive when the current lags
the voltage.
Type 2
The WT1800 calculates the apparent power of each phase using equation 3 and sums the results to derive
the three-phase apparent power. The WT1800 calculates the three-phase reactive power from the three-phase
apparent power and the three-phase active power using equation 4.
Active power for a three-phase, four-wire system
PΣ = P1 + P2 + P3
Apparent power for a three-phase, four-wire system
SΣ = S1 + S2 + S3 ( = U1 × I1 + U2 × I2 + U3 × I3)
Reactive power for a three-phase, four-wire system
8-8
QΣ =
SΣ2−PΣ2
IM WT1801-01EN
8 Computation
Type 3 (The method used in the harmonic measurement modes of the WT1600, WT3000 and PZ4000)
The WT1800 calculates the reactive power of each phase using equation 2 and calculates the three-phase
apparent power using equation 4. This equation is available on models with the harmonic measurement option
or the simultaneous dual harmonic measurement option.
Active power for a three-phase, four-wire system
PΣ = P1 + P2 + P3
Apparent power for a three-phase, four-wire system
SΣ= PΣ2+QΣ2
Reactive power for a three-phase, four-wire system
QΣ = Q1 + Q2 + Q3
Corrected Power Equation (Pc Formula)
Some standards require that a voltage transformer’s active power be corrected when the load connected to the
voltage transformer is very small. You can select an equation to use for this correction and specify the coefficient.
Applicable Standard (Select standard)
Select from the following.
• IEC76–1 (1976)
• IEC76–1 (1993)
Equations for each applicable standard
IEC76-1(1976)
Pc=
P1+P2
IEC76-1(1993)
P
Urms
Umn
2
Pc= P 1+
Umn−Urms
Umn
Pc: Corrected power
P: Active power
Urms: True rms voltage
Umn: Voltage’s rectified mean calibrated to the rms value
P1, P2: Coefficients specified by the applicable standard
Coefficients (P1 and P2)
You can set coefficients P1 and P2 to values within the range of 0.0001 to 9.9999.
The IEEE C57.12.90-1993 equation is the same as IEC761(1976).
Sampling Frequency (Sampling Frequency)
The WT1800 offers three types of sampling frequencies, each approximately 2 MHz, to prevent the input
waveform from being measured as a DC signal because of aliasing. You can choose to automatically switch the
sampling frequency or choose to use a fixed frequency.
• Auto:
The WT1800 automatically switches between clocks A, B, and C.
• Clock A: 2.000000 MHz
• Clock B: 1.941176 MHz
• Clock C: 1.885714 MHz
• Set the sampling frequency to Auto to prevent the measured values from being distorted by aliasing.
• If you want to use a fixed sampling frequency, select a frequency from Clock A to Clock C.
IM WT1801-01EN
8-9
8 Computation
Phase Difference Display Format (Phase)
The phase difference Φ between the voltage and current indicates the current phase relative to the voltage of
each element. Set the display format to one of the options below.
• 180 degrees
If the current phase is in the counterclockwise direction with respect to voltage, the current is leading (D) the
voltage. If the current phase is in the clockwise direction with respect to the voltage, the current is lagging
(G) the voltage. The phase difference is expressed by an angle between 0 and 180° (see appendix 2 in the
getting started guide, IM WT1801-03EN).
• 360 degrees
The phase difference is expressed as an angle between 0 and 360° in the clockwise direction.
• If the measured voltage or current value is zero, “Error” is displayed.
• When both the voltage and current signals are sinusoidal waves and the ratios of the voltage and current
inputs with respect to the measurement range do not differ greatly, the phase difference Φ lead and lag are
still detected and displayed correctly.
• If the computation result of power factor λ exceeds 1, Φ is displayed as follows:
• If the power factor λ is greater than 1 and less than or equal to 2, Φ returns 0.
• If λ is greater than 2, Φ returns an error (“Error” is displayed).
• On models with the harmonic measurement option, the phase differences ΦU and ΦI of harmonic orders
1 to 500 of the voltage and current are always displayed using an angle between 0 and 180° (no sign for
lead and negative sign for lag).
Master/Slave Synchronization Measurement (Sync Measure)
Connect the external start signal input/output connectors (MEAS. START) of the master and slave instruments
using a BNC cable (sold separately). You can synchronize the measurement of two WT1800s making one
WT1800 the master and the other WT1800 the slave. The master outputs a measurement start signal, and the
slave receives the signal.
For the specifications of the external start signal input/output connectors, see section 4.4 in the getting started
guide, IM WT1801-03EN.
The measurement of the master and slave cannot be synchronized under the following conditions:
• When the data update interval differs between the master and slave.
• During real-time integration mode or real-time storage mode.
Follow the procedure below to hold the display during synchronized measurement.
• To hold the display: Hold the display of the master first.
• To unhold the display: Unhold the display of the slave first.
8-10
IM WT1801-01EN
8 Computation
Voltages or Currents Whose Frequencies Will Be Measured
(FREQ MEASURE)
Select the three voltages or currents to measure the frequencies of from the options below. The available options
vary depending on the installed elements.
U1, I1, U2, I2, U3, I3, U4, I4, U5, I5, U6, and I6
On models with the add-on frequency measurement option, the frequencies of the voltages and currents of all
elements can be measured, so there is no need to set which frequencies to measure. Thus, even if you press
SHIFT+MEASURE(FREQ MEASURE), the Freq Items menu will not appear.
• If frequency measurements are unstable because of noise, try using the frequency filter.
• The period cannot be detected if the AC amplitude is small. For information about detectable frequency
levels, see the conditions listed in “Frequency Measurement” and “Accuracy” in chapter 6 of the getting
started guide, IM WT1801-03EN.”
• The measured data for the frequencies of voltages and currents whose frequencies are not measured is
displayed as “-------” (no data).
IM WT1801-01EN
8-11
9 Integrated Power (Watt hours)
The WT1800 can integrate the active power (watt hour), the current (ampere hour), the apparent power (voltampere hour), and the reactive power (var hour) values.
For a list of the measurement functions related to integrated power (watt hours) and their descriptions, see “Items
That This Instrument Can Measure.”
Click here.
You can set the following items.
• Enabling or Disabling Independent Integration (Independent Control)
• Independently integrated elements (Element Object)
• Starting, Stopping, and Resetting Integration (Start/Stop/Reset)
• Integration Conditions (Integ Set)
Integration-Related Display Indications
Integration status
Reset
Displayed when the integrated value is reset and integration can be started.
Start
Displayed along with the elapsed integration time when integration has been started.
Stop
Displayed along with the elapsed integration time when integration has been stopped.
• When integration has been stopped forcibly through the pressing of the Stop soft key, “Stop” appears in
yellow. You can press Start to resume integration.
• In real-time normal integration mode and real-time continuous integration mode, once the scheduled
integration stop time is reached, “Stop” appears in orange. Even if you press Start, integration is not resumed.
To start integration, you must first reset it.
Ready
In real-time normal integration mode, when you press Start, before the scheduled integration start time is
reached, “Ready” and the scheduled integration start time appear.
Scheduled integration start time
TimeUp
After the specified integration timer time elapses, integration stops automatically, and “TimeUp” and the elapsed
integration time appear.
Error
In the following situations, integration stops automatically, and “Error” and the elapsed integration time appear.
• The integration time reaches the maximum integration time (10000 hours).
• The integrated value reaches its maximum or minimum displayable value.
• A power failure occurs when integration is in progress. Even when a power failure occurs, the WT1800 stores
and holds the integration result. When the power returns, integration is stopped, and the integration result
calculated up to the point when the power failure occurred is displayed.
Example of the Display When the Integration Time Is Set to a Non-Zero Value
Elapsed integration time
Integration timer
IM WT1801-01EN
9-1
9 Integrated Power (Watt hours)
Example of the Display When Independent Integration Is Enabled
The integration status of the input
element or wiring unit selected with
the ELEMENT key for setting
ranges.
When a wiring unit is selected, the
element number at the top is the
number of the smallest input
element in the wiring unit.
Integration status
of each element
Number of Displayed Digits (Display Resolution)
The number of displayed digits (display resolution) for an integrated value is six (the maximum value is 999999).
When an integrated value reaches 1000000 counts, the decimal point shifts automatically. For example, if 0.001
mWh is added to 999.999 mWh, the display shows 1.00000 Wh.
Maximum and Minimum Displayable Integrated Values
Active power (WP):
±999999 MWh
Current (q):
±999999 MAh
Apparent power (WS): ±999999 MVAh
Reactive power (WQ): ±999999 Mvarh
Display When Integration Overflow Occurs
If either of the conditions below is met, integration is stopped, and the integration time and integrated value are
held.
• The integration time reaches the maximum integration time (10000 hours).
• The integrated value of WP, q, WS, or WQ reaches the maximum or minimum displayable value given above.
Integration When the MAX Hold Feature Is Enabled
The WT1800 determines and displays the integrated value by summing the value that is measured at every data
update interval, irrespective of the MAX hold feature.
Integration When the Measured Value Exceeds the Measurement Limit
If a sampled instantaneous current or voltage exceeds the maximum or minimum measurement range limits of
the AD circuit, the value is measured as the maximum or minimum measurement range limit value.
Integration When Current Input Is Small
Integration is performed assuming a current of zero when the current input relative to the measurement range is
as indicated below.
• When the Crest Factor Is Set to CF3
When Irms or Iac is 0.5% or less When Imn or Irmn is 2% or less
• When the Crest Factor Is Set to CF6
When Irms or Iac is 1.0% or less When Imn or Irmn is 4% or less
9-2
IM WT1801-01EN
9 Integrated Power (Watt hours)
Sample Rate, and Valid Frequency Ranges for Integration
The sample rate is approximately 2 MHz. The voltage/current signal frequencies that are valid for integration are
as follows:
Integrated Item
Active power
Current
When integrating Irms
When integrating Imn
When integrating Idc
When integrating Irmn
When integrating Iac
Valid Frequency Range for Integration
DC to approximately 1 MHz
DC or the lower frequency limit determined by the data
update interval to approximately 1 MHz
DC or the lower frequency limit determined by the data
update interval to approximately 1 MHz
DC to approximately 1 MHz
DC or the lower frequency limit determined by the data
update interval to approximately 1 MHz
The lower frequency limit determined by the data update
interval to approximately 1 MHz
Using an External Signal to Control Integration (Option)
On models with the 20-channel D/A output option, you can use the remote control feature to use an external
signal to start, stop, and reset integration. For details about the remote control feature, see appendix 4.6 in the
getting started guide, IM WT1801-03EN.
Backup When a Power Failure Occurs
• If a power failure occurs when integration is in progress, the integration result is held. When the power
returns, integration is stopped, and the integration result calculated up to the point when the power failure
occurred is displayed.
• After the power returns, you must reset integration to start it again.
Limitations on Modifying the Settings during Integration
During integration, there are some settings that you cannot change and functions that you cannot execute. For
details, see appendix 9 in the getting started guide, IM WT1801-03EN.
Limitations on Waveform Display during Integration
• During integration, the waveform display trigger does not function. Therefore, the signal level of the waveform
display at the left end of the screen may not be stable.
• During integration, the shortest possible waveform data update interval is 1 s. If you select an update interval
shorter than 1 s, the numeric data and waveform data will contain measured values for different measurement
periods.
IM WT1801-01EN
9-3
9 Integrated Power (Watt hours)
Enabling or Disabling Independent Integration (Independent
Control)
You can select whether to start, stop, and reset integration on all elements simultaneously or separately.
• OFF: Integration starts, stops, and is reset simultaneously on all elements.
• ON: Integration works differently depending on the independent input element configuration (Element
Independent) setting.
• When independent input element configuration is disabled
Elements whose wiring system is 1P2W are controlled separately. For elements whose wiring system is
not 1P2W, integration starts, stops, and is reset at the same time for all elements in the same wiring unit.
• When independent input element configuration is enabled
The integration of each element is controlled separately.
When independent integration and independent input element configuration are enabled and integration is
controlled separately for elements in the same wiring unit, because the elements’ integration periods differ,
the Σ functions for those elements (the functions that deal with wiring unit integration, such as the integrated
active power and apparent power functions) return errors.
Independently Integrated Elements (Element Object)
This setting is valid when independent integration is enabled.
• You can select which elements to start, stop, and reset the integration of by selecting the elements’ check
boxes.
• All ON: All elements are controlled.
• All OFF: No elements are controlled.
Even if you enable independent integration, when independent input element configuration is disabled,
the integration of elements in the same wiring unit is controlled simultaneously regardless of whether the
elements’ check boxes are selected.
Example:
• Elements 1, 2, and 3 are assigned to wiring unit ΣA as a three-phase, four-wire system.
• Under Element Object, the check box of element 1 is selected, but the check boxes of elements 2 and 3
are not.
If you start or stop the integration of element 1 under the above conditions, the integration of elements 2 and 3,
whose check boxes are not selected, also starts or stops.
To independently control the integration of input elements that are assigned to the same wiring unit, you must
enable independent integration and independent input element configuration.
9-4
IM WT1801-01EN
9 Integrated Power (Watt hours)
Starting, Stopping, and Resetting Integration (Start/Stop/Reset)
You can start, stop, and reset integration using the soft keys on the front panel or communication commands.
The relationships between integration and starting, stopping, and resetting are indicated below.
Time up
Integrated
value
Timer value
Integration
time
Start
Stop
Start
Stop
Reset
Start
Reset
Starting Integration (Start)
• Integration starts under the different conditions indicated below depending on the integration mode.
• Manual integration mode, standard integration mode, and continuous integration mode
Integration starts immediately.
• Real-time normal integration mode and real-time continuous integration mode
The WT1800 enters into an integration-ready state when you press Start. Integration starts when the
scheduled start time is reached.
• When integration starts, the START indicator to the right of the INTEG key illuminates, and the integration
status indication is “Start.”
• When the WT1800 is in an integration-ready state, the START indicator blinks, and the integration status
indication is “Ready.”
When you start integration in auto range mode, the measurement range switches to a fixed range.
Stopping Integration (Stop)
• You can force integration to stop. The integration time and integrated value are held.
• When you force integration to stop, the STOP indicator blinks, and “Stop” appears in yellow as the integration
status indication. You can press Start to resume integration. However, after the automatic stopping of
integration, which is discussed later, you cannot press Start to resume integration.
Automatic Stopping of Integration
• Integration stops automatically under the different conditions indicated below depending on the integration
mode. The integration time and integrated value are held. After integration stops automatically, you cannot
resume it by pressing Start. To start integration, you must first reset it.
• When the integration mode is manual integration mode, standard integration mode, or real-time normal
integration mode
After the specified timer time elapses, integration stops automatically. The STOP indicator illuminates, and
the integration status indication is “TimeUp.”
• When the integration mode is real-time normal integration mode or real-time continuous integration mode
Integration stops automatically when the scheduled integration end time is reached. The STOP indicator
illuminates, and “Stop” appears in orange as the integration status indication.
IM WT1801-01EN
9-5
9 Integrated Power (Watt hours)
Resetting Integration (Reset)
The integration time and integrated value are reset. The STOP indicator turns off. The displays for integrationrelated functions change to “-----------” (no data).
When an integration error occurs, the START and STOP indicators blink, and the integration status indication
is “Error.”
Holding Integration and Releasing the Hold
Holding Integration
When you press the HOLD key, it illuminates, and the display and communication output of the integration result
are held. Integration continues regardless of whether the display is held.
Releasing the Hold on Integration
If you press the HOLD key when integration is held, the HOLD key light turns off, and the numeric data display
is updated. While the display is held, you can update the display by pressing SINGLE to execute a single
measurement.
The relationship between the hold function and the start and stop operations is as follows:
• If you start integration while the display is held, the display and communication output do not change. When
you release the hold function (turn it off) or make a single measurement by pressing SINGLE, the integration
result at that point is displayed and transmitted.
ON
HOLD
OFF
Displayed value
(The dotted line is the integrated value.)
Integration time
Stop
Start
Reset
• If you stop integration while the display is held, the displayed and transmitted values do not change. When
you release the hold function (turn it off) or make a single measurement by pressing SINGLE, the integration
result at the point when integration was stopped is displayed and transmitted.
ON
HOLD
OFF
SINGLE
(Single measurement)
Execution Execution
Execution
Displayed value
(The dotted line is the integrated value.)
Integration time
Start
9-6
Stop
Reset
IM WT1801-01EN
9 Integrated Power (Watt hours)
Integration Conditions (Integ Set)
You can configure the following integration conditions.
• Integration mode (Mode)
• Integration timer (Integ Timer)
• Scheduled times for real-time integration (Real-time Control)
• Integration auto calibration on/off (Auto Cal)
• Watt hour integration method for each polarity (WP ± Type)
• Current mode for current integration (q Mode)
• Rated time of integrated D/A output (D/A Output Rated Time; option)
Integration Mode (Mode)
The integration feature has the following five modes.
Integration mode
Manual integration mode
(Normal)
Normal integration mode
(Normal)
Continuous integration mode
(Continuous)
Real-time normal integration mode
(R–Normal)
Real-time continuous integration mode
(R–Continuous)
Start
Key
operation
Key
operation
Key
operation
Date and
time
Date and
time
Stop
Key
operation
Stopped by
the timer
Key
operation
Date and
time
Date and
time
Repetition
–––
–––
Repeats when
the timer expires
–––
Repeats when
the timer expires
Manual integration mode
Integrated value
When you set the integration mode to normal integration mode (Normal) and set the integration timer to
00000:00:00, the WT1800 performs integration in manual integration mode. After integration is started, it
continues until you press Stop. However, if either of the conditions below is met, integration is stopped, and the
integration time and integrated value are held.
• The integration time reaches the maximum integration time (10000 hours).
• The integrated value reaches its maximum or minimum displayable value.
When the maximum
integrated value is
reached
Integration time
Start
IM WT1801-01EN
Hold
Hold
Hold
Hold
Stop
Reset
Start
Reset
9-7
9 Integrated Power (Watt hours)
Normal Integration Mode (Normal)
Integrated value
You can set a relative integration time (set a timer). Integration starts when you press Start. When one of the
conditions below is met, integration is stopped, and the integration time and integrated value are held.
• The specified timer time elapses.
• The Stop soft key is pressed.
• The integrated value reaches its maximum or minimum displayable value.
Integration time
Hold
Hold
Timer value
Start
Reset
Continuous Integration Mode (Continuous integration; Continuous)
Integration time Integrated value
You can set a relative integration time. Integration starts when you press Start. When the specified timer time
elapses, integration is automatically reset and restarted. Integration repeats until you press Stop. However, if the
integrated value reaches its maximum or minimum displayable value before the specified amount of time has
elapsed, integration is stopped, and the integration time and integrated value at that point are held.
Hold
Hold
Timer
value
Start
9-8
Timer
value
Timer
value
Stop
Reset
IM WT1801-01EN
9 Integrated Power (Watt hours)
Real-Time Normal Integration Mode (R–Normal)
Set the date and time when integration starts and stops and the duration of integration. Integration starts at the
scheduled start time. When one of the conditions below is met, integration is stopped, and the integration time
and integrated value are held.
• The scheduled stop time is reached.
• The specified timer time elapses.
• The integration time reaches the maximum integration time (10000 hours).
• The integrated value reaches its maximum or minimum displayable value.
Integrated
value
Hold
Integration
time
Hold
Start
date and time
Stop
Reset
date and time
In real-time integration mode, when you set the integration time to 00000:00:00, integration starts at the
scheduled start time. When one of the conditions below is met, integration is stopped, and the integration time
and integrated value are held.
• The scheduled stop time is reached.
• The integration time reaches the maximum integration time (10000 hours).
• The integrated value reaches its maximum or minimum displayable value.
Real-Time Continuous Integration Mode (Continuous integration; R-Continuous)
Integrated value
Set the date and time when integration starts and stops and the duration of integration. Integration starts at the
scheduled start time. When the specified timer time elapses, integration is automatically reset and restarted. If
either of the conditions below is met, integration is stopped, and the integration time and integrated value are
held.
• The scheduled stop time is reached.
• The integrated value reaches its maximum or minimum displayable value.
Integration time
Hold
Hold
Timer
value
Start
date and time
IM WT1801-01EN
Timer
value
Timer
value
Stop
Reset
date and time
9-9
9 Integrated Power (Watt hours)
Integration Timer (Integ Timer)
You can set the hour, minute, and second within the following range.
00000:00:00 to 10000:00:00
When Independent Integration Is Disabled
The integration timer that you specified above applies to every element.
When Independent Integration Is Enabled
• Setting
You can select the method for setting the integration timer from the following options.
• Each: Set it separately for each input element.
• All:
Set it for all installed input elements at the same time.
• Element1 to Element6
You can set the integration timers for each element within the range given above.
Scheduled Times for Real-Time Integration (Real-time Control)
This setting is valid in real-time normal integration mode and real-time continuous integration mode.
You can set the year, month, day, hour, minute, and second of the integration start and stop times. Be sure to
set the integration stop time to a time after the integration start time. You can set the values within the following
ranges.
• Year:
Any four-digit Gregorian calendar value
• Hour:Minute:Second:
00:00:00 to 23:59:59
• Now:
The scheduled integration start time is set to the current time.
• Copy:
The scheduled integration start time is copied to the scheduled integration stop time.
When Independent Integration Is Disabled
The scheduled times that you specified above apply to every element.
When Independent Integration Is Enabled
• Setting
You can select the method for setting the scheduled times from the following options.
• Each: Set them separately for each input element.
• All:
Set them for all installed input elements at the same time.
• Element1 to Element6
You can set the scheduled times for each element within the range given above.
• You can set the day for the scheduled start or stop time in February to a value as high as the 31st day. If
you do so, an error message will appear when you start integration. Reset the scheduled stop time.
• The WT1800 recognizes leap years when it executes the integration operation.
• In real-time normal integration mode and real-time continuous integration mode, after you press Start and
the WT1800 enters into an integration-ready state, the numeric data may not be updated immediately.
This is because the numeric data is updated in sync with the WT1800 clock. This ensures that the numeric
data is updated at the same time as the scheduled integration start time and that the integration time is
accurate.
9-10
IM WT1801-01EN
9 Integrated Power (Watt hours)
Integration Auto Calibration On/Off (Auto Cal)
Ordinary zero-level compensation takes place when the measurement range or line filter is changed, but you
can also automatically calibrate the zero level during integration.
• ON:
Zero-level compensation takes place approximately once every hour during integration.
• OFF:
Zero-level compensation does not take place during integration.
When integration auto calibration is on and zero-level compensation is in progress, the power or current value
measured immediately before is integrated.
Watt Hour Integration Method for Each Polarity (WP ± Type)
Setting
You can select the method for setting the integration method from the following options.
• Each:
Set it separately for each input element.
• All:
Set it for all installed input elements at the same time.
Element1 to Element6
Set the integration method to one of the options below.
• Charge/Discharge:Measure DC watt hours (for each sampled data item) by polarity.
• Sold/Bought:
Measure AC watt hours (for each sampled data item) by polarity.
For information about the equations used in each method, see appendix 1 in the getting started guide, IM
WT1801-03EN.
Current Mode for Current Integration (q Mode)
Setting
You can select the method for setting the current mode from the following options.
• Each:
Set it separately for each input element.
• All:
Set it for all installed input elements at the same time.
Element1 to Element6
You can select the current mode from the following options. For information about the equations used in each
mode, see appendix 1 in the getting started guide, IM WT1801-03EN.
• rms:
True rms value
• mean: Rectified mean value calibrated to the rms value
• dc:
Simple average
• r-mean: Rectified mean value
• ac:
AC component
When the current mode is dc, the polarity (+ or -) is displayed.
IM WT1801-01EN
9-11
9 Integrated Power (Watt hours)
Rated Time of Integrated D/A Output (D/A Output Rated Time;
Option)
This setting appears on models with the 20-channel D/A output option. When integrated values are output
through D/A output, a rating value (the same value as the measurement range) is continuously applied, the
integrated value after the specified amount of time has elapsed is taken to be 100%, and the D/A output at that
point is 5 V. It is assumed that the change in the D/A output from 0% of the integrated value (0 V) to 100% of
the integrated value (5 V) will occur linearly over time, and the D/A output value is determined by the ratio of the
actual input level to this assumed straight line.
For information about the relationship between the measured integrated D/A output value and the voltage, see
“Relationship between Output Items and the D/A Output Voltage.”
Click here.
Setting the Rated Time for Integrated D/A Output
• You can set the hour, minute, and second within the following range.
00000:00:00 to 10000:00:00
• This setting is valid in the following integration modes.
• Manual integration mode
• Real-time normal integration mode when the integration timer is set to 00000:00:00
• In the following integration modes, the rated time for integrated D/A output is set to the same time that the
timer is set to.
• Normal integration mode
• Continuous integration mode
• Real-time normal integration mode when the integration timer is not set to 00000:00:00
• Real-time continuous integration mode
When the rated time for integrated D/A output is set to 00000:00:00, the D/A output for the integrated value is
fixed at 0 V.
9-12
IM WT1801-01EN
10 Waveform Display
Waveform Display (WAVE)
You can press WAVE to make the waveform displays of the following types of input signals.
• Input element voltage and current
• Motor evaluation function (option) speed and torque
• Auxiliary inputs (option) Aux1 and Aux2
Each time you press WAVE, the number of split screens switches in order between none, 2, 3, 4, and 6.
Waveform Display Example
Scale Value
The measurement function, the element number, and the upper limit
of the displayed waveform
Waveform label
U1
3.000kV
Trigger level
Ground level
U1
U1 −3.000kV
0.000s
<< 1602 (p−p) >>
50.000ms
Time at the left edge
of the screen
(fixed at 0 seconds)
Time at the right edge
of the screen
(amount of time contained
in the screen)
• The number of data points between the left and right edges
of the display.
• “P-P” indicates that the displayed waveform has been P-P
compressed.
Scale Value
The measurement function, element number, and lower limit of the
displayed waveform
Measurement Mode during Waveform Display
When waveforms are displayed, the measurement mode indicated in the upper left of the screen is Normal Mode
(Trg). After a trigger occurs, measurement takes place at the data update interval.
• If you do not set the trigger level properly, the waveform display start point (the signal level on the left edge
of the screen) may be unstable, or waveforms may not appear.
• Even when waveforms are displayed, in the following situations, the measurement mode indication at the
upper left of the screen is Normal Mode.
• During integration
• When the trigger mode is OFF
In Normal Mode, measurements are taken and the sampled data is updated automatically at the data
update interval. In this mode, there are limitations on the waveform display feature.
Click here.
IM WT1801-01EN
10-1
10 Waveform Display
Display Format (FORM)
You can configure the following display format settings.
• Number of windows (Format)
• Time axis (Time/div)
• Trigger (Trigger Settings)
• Advanced waveform display settings (Display Settings)
• Waveform mapping (Wave Mapping)
Number of Windows (Format)
You can divide the screen equally into windows, and assign waveforms to those windows. This function is useful
when there are many waveforms and it is difficult to view them all in a single display.
You can choose the number of windows from one of the following options:
• Single: No windows
• Dual: Two windows
• Triad: Three windows
• Quad: Four windows
• Hexa: Six windows
Depending on the number of windows, the number of displayed points in each window changes as described
below.
Single: 672 points, Dual: 336 points, Triad: 224 points, Quad: 168 points, Hexa: 112 points
When the screen is split, the number of displayed points along the vertical axis of a single window is halved.
For information about how to assign waveforms to windows, see “Waveform Mapping.”
Click here.
Time Axis (Time/div)
The time axis is set in Time/div (time per grid division).
The time axis can be set up to the point in which the time corresponding to one screen is equal to the data
update interval, in 1, 2, 5 steps. For example, when the data update interval is 500 ms, if you change the timeper-division in this order: 0.05 ms > 0.1 ms > 0.2 ms > 0.5 ms >1 ms > 2 ms > 5 ms > 10 ms > 20 ms > 50 ms,
the time corresponding to one screen changes in this order: 0.5 ms > 1 ms > 2 ms > 5 ms > 10 ms > 20 ms > 50
ms > 100 ms > 200 ms > 500 ms.
1 grid division = 10 ms
100 ms
(observation time)
10-2
1 grid division = 20 ms
200 ms
(observation time)
IM WT1801-01EN
10 Waveform Display
Difference between Waveform Sampling Data and Waveform Display Data
Waveform sampling data and waveform display data are both measured waveform data, but they differ as
described below.
• Waveform sampling data: Data derived through A/D conversion of the input signal
The WT1800 A/D conversion rate is approximately 2 MS/s. Therefore, if the data update interval is set to
1 s, the number of data points sampled from a single input signal in a single measurement is approximately
2,000,000 (see the figure below). Waveform sampling data is also called acquisition data or raw wave data.
• Waveform display data: Waveform data displayed on the WT1800 screen (1602 points)
When the WT1800 displays waveforms, data points (of waveform display data) are displayed in horizontal
rasters (along the time axis). The number of rasters is 801. Each raster contains two points of waveform
display data. The two data points are the maximum and minimum values of the waveform data in each raster.
Therefore, the number of waveform display data points (the number of points displayed on the screen) for a
single input signal is 1602.
p-p Compression
p-p compression is the compression method used to derive waveform display data from waveform sampling
data. For example, if a 2-Hz sine wave is measured at a data update rate of 1 s, to display this waveform, the
WT1800 converts the number of data points from approximately 2,000,000 to 1602 (801 pairs of maximum
and minimum values). Thus, two points (a pair) of waveform display data are derived from approximately 2500
points of waveform sampling data. This conversion is called p-p (peak-peak) compression. The compression
ratio of p-p compression varies depending on the data update interval and the horizontal scale (time axis) of the
waveform display.
Waveform sampling data
A/D-converted data
1s
Number of data points: Approx. 2,000,000
p-p compression
Compresses
approximately 2500
points of waveform
sampling data to
2 points (extracts
the maximum and
minimum values
and draws them
in each raster)
Vertical axis
Waveform display data (WT screen)
Time axis
801 rasters
0
800
Number of data points: 1,602 (801 pairs)
IM WT1801-01EN
With display interpolation
on
10-3
10 Waveform Display
Aliasing
When the sample rate is low compared to the frequency of the input signal, the high frequency components of
the signal are lost. In accordance with the Nyquist sampling theorem, the high frequency components in the
signal are misread as low frequency components. This is called aliasing.
Aliased signal
Input signal
Sampled points
Vertical Axis (Amplitude)
The height (display range) of the vertical axis is based on the specified crest factor and measurement range.
For example, if the crest factor is set to CF3 and the voltage measurement range is set to 100 Vrms, the display
range is set to ±300 Vpk (±3 × 100 Vrms) with the zero input line at the center. The waveform is clipped if this
range is exceeded.
In the same way, if the crest factor is set to CF6 and the voltage measurement range is set to 50 Vrms, the
display range is set to ±300 Vpk (±6 × 50 Vrms) with the zero input line at the center.
300 Vpk
When measured with a measurement
range of 100 Vrms
Input zero line
–300 Vpk
900 Vpk
–900 Vpk
10-4
1 grid division
= 100 V
When the same signal is measured
with a measurement range of 300 Vrms
1 grid division
= 300 V
IM WT1801-01EN
10 Waveform Display
Trigger (Trigger Settings)
The trigger determines when a waveform is displayed. A trigger is said to “occur” when the trigger condition is
met and a waveform is displayed.
Trigger Mode (Mode)
The trigger mode determines the conditions for updating the display. Select from the following options.
• Auto (Auto mode)
If the trigger conditions are met before an approximately 100 ms timeout, the WT1800 updates the displayed
waveforms on each trigger occurrence. If not, the WT1800 automatically updates the displayed waveforms. If
the period of the trigger signal is greater than 100 ms, the display is updated as the two conditions described
above alternate. If this occurs, use Normal mode.
• Normal (Normal mode)
The WT1800 only updates the waveform display when the trigger conditions are met. If no triggers occur, the
display is not updated. If you want to view waveforms that the WT1800 cannot trigger on, or if you want to
check the ground level, use Auto mode.
• OFF
The trigger feature does not function. The display is updated at the data update interval. There are limitations
on the waveform display feature.
Click here.
Trigger Source (Source)
The signal that the WT1800 checks for the trigger condition is referred to as the trigger source. Select from the
following options. The available options vary depending on the installed elements.
U1, I1, U2, I2, U3, I3, U4, I4, U5, I5, U6, I6, and Ext Clk (external clock)*
* When you select Ext Clk, the external signal applied to the external clock input connector (EXT CLK) on the
rear panel is used as the trigger source. For the EXT CLK connector specifications, see section 4.3 in the
getting started guide, IM WT1801-03EN. When Ext Clk is set as the trigger source, the trigger level setting is
invalid.
Trigger Slope (Slope)
Slope refers to the signal movement from a low level to a high level (rising slope) or from a high level to a low
level (falling slope). When the slope is used as one of the trigger conditions, it is called a trigger slope.
The following trigger slope settings are available for triggering the WT1800.
• :An edge is detected when the trigger source changes from a level below the trigger level to a level
above the trigger level (rising).
• :An edge is detected when the trigger source changes from a level above the trigger level to a level
below the trigger level (falling).
•
: The WT1800 triggers on both rising and falling edges.
Trigger Level (Level)
The trigger level is the level at which the trigger slope is determined. When the trigger source passes through
the trigger level on a rising or falling edge, a trigger occurs.
• You can select a value between 0.0 and ±100.0%.
• A value of 100% corresponds to half the height of the waveform display. If the zero level of the input signal
is set to the center of the vertical axis, 100% corresponds to the top of the waveform display, and –100%
corresponds to the bottom of the waveform display. The upper and lower limits of the waveform display
correspond to three times the voltage or current measurement range of each element when the crest factor is
set to CF3 and six times when the crest factor is set to CF6. When scaling is used, the upper and lower limits
correspond to three or six times the scaled ranges.
• When Ext Clk is set as the trigger source, the trigger level setting is invalid.
IM WT1801-01EN
10-5
10 Waveform Display
Trigger level
Trigger source
The WT1800 triggers here (the trigger point)
when the trigger edge is set to rising ( ).
• Measurement range: 100 Vrms or 50 Vrms when the crest factor is set
to CF3 or CF6, respectively.
• Trigger level: 25%
100% (300 Vpk)
Trigger level
T
25% trigger level (75 V)
Input zero line
(center of the
vertical axis)
–100% (–300 Vpk)
Trigger Point
The trigger point is the point at which a trigger occurs. The trigger point is always displayed at the left end of the
screen.
After the trigger is activated, the waveform display continues from the left of the screen to the right of the screen
with the passage of time.
(The arrow below the word “Trigger point” in the figure below is just for illustration. The arrow does not appear on
the actual display.)
Trigger point
Time
• To prevent noise-related errors, the trigger feature has a hysteresis of approximately 1% when the crest
factor is set to CF3. For example, when the trigger slope is set to , a trigger will occur if the input signal
level falls approximately 1% below the trigger level and then passes through the trigger level on a rising
edge. The trigger feature has a hysteresis of approximately 2% when the crest factor is set to CF6.
• When integration is in progress or has been stopped, the trigger feature does not function. Therefore, the
waveform display start point (the signal level at the left edge of the screen) may not be stable. Also, the
numeric data measurement period may not be synchronized with the waveform data measurement period.
10-6
IM WT1801-01EN
10 Waveform Display
Advanced Waveform Display Settings (Display Settings)
Display Interpolation (Interpolate)
When there are less than 800 points of sampled data on the time axis, the displayed points (rasters) do not
connect with each other. Numbers of sampled points below 800 are said to be within the interpolation range.
Display interpolation is a feature that connects the points linearly so that the waveform display is smooth. You
can set the interpolation method to one of the settings below.
•
:
No interpolation is performed. Only the data points are displayed.
•
:
The spaces between data points are connected with straight lines.
• Outside of the Interpolation Zone
The spaces between vertically aligned dots are filled. If the number of data points is 1602 or greater, the
WT1800 determines the P-P compression values (the maximum and minimum sampled-data values in a
given interval), and displays vertical lines (rasters) connecting each pair of maximum and minimum P-P
compression values.
• In the Interpolation Zone
Grid (Graticule)
You can set the window grid to one of the following options.
•
•
•
:
:
:
The grid is displayed with dotted lines.
The grid frame is displayed.
The grid is displayed with a cross hair.
Turning the Scale Value Display On and Off (Scale Value)
You can select whether to display the following values for each waveform.
• The upper and lower limits of the vertical axis.
• The values at the left and right edges of the horizontal axis (time axis).
Turning the Display of Waveform Labels On and Off (Wave Label)
Select whether to display waveform labels.
IM WT1801-01EN
10-7
10 Waveform Display
Waveform Mapping (Wave Mapping)
Assignment Method (Mode)
You can assign waveforms to windows on the screen. Choose one of the following methods for assigning the
waveforms to the windows.
• Auto
The waveforms whose displays are turned on are assigned in order according to their element numbers, with
an element’s voltage waveform (U) coming first, followed by its current (I), speed, torque, Aux1, and then
Aux2 waveform.1, 2
• Fixed
Regardless of whether their displays are on or off, waveforms are assigned in order according to their element
numbers, with an element’s voltage waveform (U) coming before its current waveform (I). The speed and
Aux1 waveforms appear in the top window.1, 2 The torque and Aux2 waveforms appear in the second window
from the top.1, 2
• User
You can pick which waveforms to assign to which windows, regardless of whether the waveform’s displays
are on or off. You can set the display position to a number from 0 to 5. Number 0 corresponds to the window
at the top of the screen, and the window number increases for each successively lower window.
1 Speed and torque waveforms are available on models with the motor evaluation option.
2 Aux1 and Aux2 waveforms are available on models with the auxiliary input option.
Display Item (ITEM)
Displaying All Waveforms (All ON)
The waveforms of all input signals are displayed.
Displaying No Waveforms (All OFF)
No waveforms are displayed.
Selecting Which Waveforms to Display (Display ON/OFF)
• You can select whether to display the waveform of each input signal of each element by selecting or clearing
the signal’s check box. Only the input signals of installed elements appear.
• On models with the motor evaluation option, you can turn the displays of the waveforms of the speed and
torque input signals on and off.
• On models with the auxiliary input option, you can turn the displays of the waveforms of the Aux1 and Aux2
input signal on and off.
Vertical Zoom (Vertical Zoom)
Each displayed waveform can be scaled. You can select one of the following zoom factors:
0.1, 0.2, 0.25, 0.4, 0.5, 0.75, 0.8, 1, 1.14, 1.25, 1.33, 1.41, 1.5, 1.6, 1.77, 2, 2.28, 2.66, 2.83, 3.2, 3.54, 4, 5, 8,
10, 12.5, 16, 20, 25, 40, 50, or 100
10-8
IM WT1801-01EN
10 Waveform Display
Vertical Position (Vertical Position)
You can vertically shift the displayed position (vertical position) of a waveform. This is useful when you want to
view the relationship between voltage and current waveforms, or when the section of the waveform that you
want to view does not fit into the display frame.
• You can select a value between 0.000 and ±130.000%.
• When the zoom factor is set to 1, a value of 100% corresponds to half the height (display range) of the
waveform display (which is three or six times the measurement range when the crest factor is set to CF3 or
CF6, respectively). The upper and lower vertical display limits of the screen are 100% and –100%.
100%
Position moved
by 50%
Position moved
by –50%
–100%
• As shown in the figure below, when the zoom factor is set to a value other than 1, the upper and lower display
limits of the screen do not correspond to three or six times the measurement range (or to ±100%) when the
crest factor is set to CF3 or CF6, respectively. You must take the zoom factor into account when setting a
waveform’s position. In the figure below, the crest factor is set to CF3, the voltage range is 100 V, the zoom
factor is 2, and the vertical position has been shifted by –25%. The waveform is shifted by the same amount
that it would be if the zoom factor were set to 1 and the vertical position was shifted by –50%.
Display range
300 Vpk
(100%)
Position moved by –25%
300 Vpk
(100%)
225 Vpk
150 Vpk
150 Vpk
–75 Vpk
–150 Vpk
–150 Vpk
–300 Vpk
(−100%)
n300 Vpk
(−100%)
When you want to zoom in on part of a waveform, we recommend that you take the steps below.
1. Set the zoom factor to 1.
2. Following the instructions in this section for shifting a waveform’s vertical position, shift the part of the
waveform that you want to view to the center of the display.
3. Set the vertical zoom factor.
IM WT1801-01EN
10-9
11 Trend Display
Other Displays (OTHERS)
You can press OTHERS to make the following displays appear.
• Trend display (Trend)
• Bar graph display (Bar)
• Vector display (Vector)
• Split display (with the numeric value display; Numeric+***)
• Split display (with the waveform display; Wave+***)
• Split display (with the trend display; Trend+***)
• High speed data capturing (High Speed Data Capturing)
Each time you press OTHER, the display switches in order between the trend display, the bar graph display
(option), the vector display (option), and the split display (the split display that you set previously).*
* In the default split display setting, the numeric value display and waveform display are shown.
Trend Display (Trend)
You can display the trends of measurement functions.
Trend Display Example
Scale Value
The trend number, measurement function, element, and upper limit
of the displayed trend
When the display is held, trend values behave the same as numeric values.
When the display is un-held, the trend data from when the display was held
appears.
Waveform label
T1 Urms1 99.60 V
T2 P1
74.11 W
T2
T1
T2 P1
74.07 W
T1 Urms1 99.20 V
00:00:00
<< 1602 (p−p) >>
00:05:00
Time at the left edge
Time at the right edge of the screen
of the screen
(amount of time contained in the screen)
(fixed at 0 seconds)
• The number of data points between the left and right edges
of the display.
• “P-P”s indicates that the displayed trend has been P-P compressed.
Scale Value
The trend number, measurement function, element, and lower limit of the
displayed trend
IM WT1801-01EN
11-1
11 Trend Display
Display Format (FORM)
Number of Trend Display Windows (Format)
You can choose the number of windows from one of the following options:
• Single: No windows
• Dual: Two windows
• Triad: Three windows
• Quad: Four windows
Depending on the number of windows, the number of displayed points in each window changes as described
below.
Single: 672 points, Dual: 336 points, Triad: 224 points, Quad: 168 points
When the screen is split, the number of displayed points along the vertical axis of a single window is halved.
Methods for Assigning Waveforms to Screens
Trends whose displays are turned on are assigned in numeric order (T1 to T16) to the split screens. The
assignment method corresponds to the Auto option in the waveform display.
Time Axis (Time/div)
The time axis is set in Time/div (time per grid division). The time per division can be set in the range of 3 s to 1
day.
The trend data update interval is determined by the data update interval and the time axis (Time/div). For
example, if the data update interval is 50 ms and you set Time/div to 3 s/div, the trend display is updated every 1 s.
If you set the data update interval to 10 s and Time/div to 3 s/div, the trend display is updated every 10 s, and the
trend data is displayed as a line graph, with each point separated by 10 s. If you set Time/div to 1 day/div, the
trend display will be updated once every 1080 s regardless of the data update interval.
One division (1 div) on the trend display is equivalent to 80 rasters. For example, if you set Time/div to
1 day/div, one raster is 1080 s (which is equal to 1 day/80), the trend data update interval is 1080 s, and
the displayed data is P-P compressed. For information about rasters and P-P compression, see “p-p
Compression.”
Click here.
Restarting Trends (Clear Trend Exec)
When you restart trends, the trend display up to that point is cleared, and the trends start over from the right end
of the screen.
In addition to when you execute Clear Trend Exec, trends will also restart when:
• You change a trend display function, element, or harmonic (option) setting.
• You change the trend time axis (horizontal axis) setting.
Advanced Trend Display Settings (Display Settings)
These are the same as the advanced waveform display settings.
Click here.
All advanced trend display settings are shared with the advanced waveform display settings. If you change
the advanced settings in the trend display, the advanced settings in the waveform display also change. For
example, if you set the display of the scale values to OFF in the trend display, the display of the scale values
will also be set to OFF in the waveform display.
11-2
IM WT1801-01EN
11 Trend Display
Display Item (ITEM)
Turning Trend Displays On and Off
Display (The upper left of the list)
You can set whether to display (All ON) or hide (All OFF) all trends, from trend 1 (T1) to trend 16 (T16).
Trend Numbers (T1 to T16)
You can select whether to display each trend, from trend 1 (T1) to trend 16 (T16), by selecting or clearing its
check box.
Function (Function)
You can select any of the measurement functions listed under “Items That This Instrument Can Measure.”
Click here.
Element (Element/Σ)
• You can select the element/wiring unit from the options below. The available options vary depending on the
installed elements.
Element1, Element2, Element3, Element4, Element5, Element6, ΣA, ΣB, and ΣC
• If there are no elements assigned to a selected wiring unit, because the wiring unit has no data, its trend is
displayed at the top or bottom of the screen. For example, if elements are assigned to ΣA but not to ΣB, the
trends of measurement functions for ΣB appear at the top or bottom of the screen.
Order (Order; option)
When you select a function that has harmonic data, you can set the displayed harmonic order within the
following range.
Total (Total value) or 0 (DC) to 500
The orders that can be specified vary depending on the measurement function. For details, see “Harmonic
Measurement Function Orders.”
Click here.
The trends of orders that exceed the maximum measurable order are displayed at the top or bottom of the
screen. For information about the maximum measurable harmonic order, see “Maximum Harmonic Order to Be
Measured (Max Order).”
Click here.
• Trends for which there is no corresponding numeric data are displayed at the top or bottom of the screen.
• If you choose to display the trend of a user-defined event (Ev1 to Ev8), the trend display shows 1 when the
user-defined event is occurring and 0 when it is not occurring.
Trend Display Scale
Setting the Vertical Scale (Scaling)
You can set the upper and lower limits of a trend window. Set the display mode to one of the options below.
• Auto:
The upper and lower limits of the trend window are automatically determined based on the
maximum and minimum trend display data values.
• Manual: You can set the upper and lower limits manually.
Upper and Lower Limits for Manual Scaling (Upper Scale and Lower Scale)
You can set the upper and lower limits within the range of –9.9999 T to 9.999 T.
IM WT1801-01EN
11-3
12 Bar Graph Display (Option)
Bar Graph Display (OTHERS (Bar))
On models with the harmonic measurement option or the simultaneous dual harmonic measurement option,
you can display harmonics using bar graphs. The harmonic orders are lined up on the horizontal axis, and the
vertical axis represents the amplitude of each harmonic.
You can configure three different bar graphs.
Bar Graph Display Example
The bar graph number, measurement function, element, and upper limit of the
displayed bar graph
“log Scale” only appears when logarithmic coordinates are used.
Harmonic order range of the displayed bar graph
The bar graph number, measurement function,
element, and lower limit of the displayed bar graph
• When logarithmic coordinates are used (Log Scale), if a value is negative, its absolute value is displayed
with a red bar graph.
• If the analysis window width (number of cycles of the fundamental signal) that is determined by the
fundamental frequency is shorter than the data update interval, bar graphs are not displayed. Set a longer
data update interval. For details, see “Notes about the Numeric Data Display.”
Click here.
• The bar graphs of harmonic orders that exceed the maximum measurable order are not displayed. For
information about the maximum measurable harmonic order, see “Maximum Harmonic Order to Be
Measured (Max Order).”
Click here.
Display Format (FORM)
Number of Bar Graph Display Windows (Format)
You can choose the number of windows from one of the following options:
• Single: No windows. The data of bar graph (Item No.) 1 is displayed.
• Dual: Two windows. The data of bar graphs (Item No.) 1 and 2 is displayed.
• Triad: Three windows. The data of bar graphs (Item No.) 1 to 3 is displayed.
IM WT1801-01EN
12-1
12 Bar Graph Display (Option)
Bar Graph Display Range (Start Order/End Order)
• You can configure the range of harmonic orders to show in a bar graph.
• The range is the same for bar graphs 1 to 3.
Starting Harmonic Order (Start Order)
• You can select a value between 0 and 490. However, the starting harmonic order cannot be more than 10
orders less than the ending order.
• When the measurement function of a bar graph is Φ, order 0 has no values, so you cannot display it in the
bar graph.
• When the measurement function of a bar graph is ΦU or ΦI, orders 0 and 1 have no values, so you cannot
display them in the bar graph.
Ending Harmonic Order (End Order)
You can select a value between 10 and 500. However, the ending harmonic order cannot be more than 10
orders greater than the starting order. You cannot display bar graphs containing harmonic orders that are greater
than the maximum measurable order (see section 6.6 in the getting started guide, IM WT1801-03EN).
Display Item (ITEM)
Bar Graph Number (Item No.)
Select the number, from 1 to 3, of the bar graph that you want to select.
Function (Function)
You can select the measurement function to display from the following options.
U, I, P, S, Q, λ, Φ, ΦU, ΦI, Z, Rs, Xs, Rp, and Xp
Element (Element)
You can select the element from the following options. The available options vary depending on the installed
elements.
Element1, Element2, Element3, Element4, Element5, and Element6
Bar Graph Display Scale
Setting the Vertical Scale Mode (Scale Mode)
You can set the upper and lower limits of a bar graph window. Set the display mode to one of the options below.
• Fixed
• When the function is U, I, P, S, or Q, the scaling is logarithmic (Log).
• When the function is λ, Φ, ΦU, ΦI, Z, Rs, Xs, Rp, or Xp, the scaling is linear (Linear).
• The upper and lower limits of the bar graph window are automatically determined based on the maximum
and minimum displayed trend data values. The lower and upper limits for λ are –1 and 1. For Φ, ΦU, and
ΦI, the minimum and maximum values are –180 to 180°. Negative values correspond to phase lagging and
positive values correspond to phase leading.
• Manual
You can set the type, upper limit, and X-axis position of the vertical scale.
Vertical Scale Type (Vertical Scale)
This setting is valid when the vertical scale mode is set to Manual. You can set the scale type to linear (Linear) or
logarithmic (Log).
Upper Limit (Upper Scale)
This setting is valid when the vertical scale mode is set to Manual. You can set the upper limit to a value from 0
to 9.999 T.
X-Axis Position (X Axis Position)
This setting is valid when you set the vertical scale mode to Manual and the vertical scale type to Linear. You
can set the point at which the Y-axis coordinate is 0 to Bottom (the bottom of the screen) or Center (the center of
the screen).
12-2
IM WT1801-01EN
13 Vector Display (Option)
Vector Display (OTHERS (Vector))
On models with the harmonic measurement option or the simultaneous dual harmonic measurement option,
you can select a wiring unit to display vectors of the phase differences and amplitudes (rms values) of the
fundamental signals, U(1) and I(1), in each element in the unit. The positive vertical axis is set to zero (angle
zero), and the vector of each input signal is displayed.
Vector Display Example
For a 3P3W system with a three-voltage, three-current method
• U1(1), U2(1), and U3(1) are line voltages.
• I1(1), I2(1), and I3(1) are line currents.
Size of the peripheral circle (range)
Wiring ΣA = 3P3W(3V3A)
PLL Src =
U1
fPLL1
= 743.00 Hz
ΦU1-U2 = 57.67
ΦU1-U3 = 302.78
ΦU1-I1 = 315.35
ΦU2-I2 = 22.91
ΦU3-I3 = 249.22
300.0 V
6.000 A
U1(1)
I1(1)
P1(1)
S1(1)
Q1(1)
λ1(1)
I3(1)
101.40 V
3.4990 A
-0.2128kW
0.5997kVA
-0.5067kvar
-0.3549
U2(1)
I2(1)
P2(1)
S2(1)
Q2(1)
λ2(1)
101.45 V
3.5090 A
0.5542kW
0.6016kVA
0.2342kvar
0.9211
For a 3P4W (three-phase, four-wire
system)
• U1(1), U2(1), and U3(1) are line
voltages.
• I1(1), I2(1), and I3(1) are line
currents.
I1(1)
ΦU3-U1
U1(1)
U3(1)
ΦU1-U2
U3(1)
I3(1)
P3(1)
S3(1)
Q3(1)
λ3(1)
I1(1)
102.60 V
3.5237 A
0.3562kW
0.3615kVA
-0.0618kvar
0.9853
O
U2(1)
ΦU2-U3
I2(1)
For a 3P3W (three-phase, three-wire
system)
• U1(1), U2(1), and U3(1) are line
voltages.
• I1(1), I2(1), and I3(1) are line c
urrents.
However, U3(1) and I3(1) are not
actually measured for the 3P3W
system. The vectors are displayed
through computation.
I1(1)
U1(1)
ΦU1-U2
Φ1(1),
ΦU1-I1
I3(1)
ΦU1-I3
Φ3(1)
U3(1)
U3(1)
ΦU1-U2
ΦU1-I2
U2(1)
Φ2(1)
ΦU1-U3
ΦU3-U1
U1(1)
I2(1)
I3(1)
O
U2(1)
ΦU2-U3
I2(1)
If the analysis window width (number of cycles of the fundamental signal) that is determined by the
fundamental frequency is shorter than the data update interval, vectors are not displayed. Set a longer data
update interval. For details, see “Notes about the Numeric Data Display.”
Click here.
IM WT1801-01EN
13-1
13 Vector Display (Option)
Display Format (FORM)
Number of Vector Display Windows (Format)
You can choose the number of windows from one of the following options:
• Single: No windows. The data of vector (Item No.) 1 is displayed.
• Dual: Two windows. The data of vectors (Item No.) 1 and 2 is displayed. However, in the split display, the data
of vector 1 is displayed.
Turning the Display of Numeric Data On and Off (Numeric)
You can select whether to show (ON) or hide (OFF) numeric data. You can display the size of each signal and
the phase differences between signals. For information about phase difference display formats, see “Phase
Difference Display Formats.”
Click here.
Display Item (ITEM)
Vector Number (Item No.)
Select the vector you want to set: 1 or 2.
Element or Wiring Unit (Object)
You can select the element or wiring unit to display from the options below. The available options vary depending
on the installed elements.
Element1, Element2, Element3, Element4, Element5, Element6, ΣA, ΣB, and ΣC
Setting Vector Zoom Factors (U Mag/I Mag)
You can change the sizes of the vectors. You can specify separate zoom factors for the fundamental waves U(1)
and I(1). When you zoom a vector, the value for the size of the peripheral circle of the vector changes according
to the zoom factor.
Setting the Zoom Factor of the Vector of Fundamental Waveform U (1) (U Mag)
You can set the zoom factor to a value between 0.100 and 100.000.
Setting the Zoom Factor of the Vector of Fundamental Waveform I (1) (I Mag)
You can set the zoom factor to a value between 0.100 and 100.000.
If the zoom factor is too large, the vector will exceed the display range and will not be displayed properly.
Reduce the zoom factor so that the vector is displayed within the display range.
13-2
IM WT1801-01EN
14 Split Display
Split Display (OTHERS)
You can split the screen into top and bottom halves, and select a display to show in each half. You can select the
following items.
• Split displays with the numeric display (Numeric+***)
• Split displays with the waveform display (Wave+***)
• Split displays with the trend display (Trend+***)
Split Displays with the Numeric Display (Numeric+***)
Numeric data is displayed in the top half of the screen. Select the display to show in the bottom half of the screen
from the following options.
• Wave: Waveform
• Trend: Trend
• Bar:
Bar graph*
• Vector: Vector*
* This item is available on models with the harmonic measurement option or the simultaneous dual harmonic
measurement option.
Split Displays with the Waveform Display (Wave+***)
Waveforms are displayed in the top half of the screen. Select the display to show in the bottom half of the screen
from the following options.
• Numeric: Numeric data
• Trend: Trend
• Bar:
Bar graph*
• Vector: Vector*
* This item is available on models with the harmonic measurement option or the simultaneous dual harmonic
measurement option.
Split Displays with the Trend Display (Trend+***)
Trends are displayed in the top half of the screen. Select the display to show in the bottom half of the screen
from the following options.
• Numeric: Numeric data
• Wave: Waveform
• Bar:
Bar graph*
• Vector: Vector*
* This item is available on models with the harmonic measurement option or the simultaneous dual harmonic
measurement option.
When the setup parameter list is displayed (the INPUT INFO key is lit), it appears in the top half of the screen,
and the display that you assigned in the Others menu to the top window in the split display is displayed in the
bottom half of the screen.
Split Display Settings
Press FORM to switch between the FORM menus of the display that you assigned to the top half of the screen
in the split display and the display that you assigned to the bottom half of the screen in the split display. Likewise,
press ITEM to switch between ITEM menus.
IM WT1801-01EN
14-1
15 Cursor Measurement
Cursor Measurement (CURSOR)
You can place cursors on displayed waveforms, trends, and bar graphs and display the values at the cursor
locations.
Example of cursors in the waveform display
Cursor 2
Y
+
Cursor 1
You can set the following items.
• Turning Cursor measurement on and off (Cursor)
• Waveform measured by cursor 1 (C1+ Trace)
• Waveform measured by cursor 2 (C2x Trace)
• Cursor path (Cursor Path)
• Position of cursor 1 (C1+ Position)
• Position of cursor 2 (C2x Position)
• Linking cursor movement (Linkage)
Turning Cursor Measurement On and Off (Cursor)
• ON:
• OFF:
Cursor measurement is performed.
Cursor measurement is not performed.
Waveform Measured by Cursor 1 (+; C1+ Trace)
This item only appears in the waveform and trend displays. It does not appear in the bar graph display.
In the Waveform Display
You can select the waveform to measure with cursor 1 (+) from the following options. The available options vary
depending on the installed elements.
U1, I1, U2, I2, U3, I3, U4, I4, U5, I5, U6, I6, Speed, Torque, Aux1, and Aux21, 2
1 Speed and torque waveforms are available on models with the motor evaluation option.
2 Aux1 and Aux2 waveforms are available on models with the auxiliary input option.
In the Trend Display
You can set the trend to measure with cursor 1 (+) to a trend from T1 to T16.
Waveform Measured by Cursor 2 (x; C2x Trace)
You can select the waveform to measure with cursor 2 (x). The options are the same as those for cursor 1
(+; C1+ Trace).
Click here.
IM WT1801-01EN
15-1
15 Cursor Measurement
Cursor Path (Cursor Path)
Because the WT1800 uses P-P compression on sampled data, two values (a maximum and a minimum value)
are displayed at each time-axis point. You can choose the path that the cursors move through and the data
points that are measured by the cursors from one of the options below.
• Max:
Cursors move along and measure the maximum values on the time axis.
• Min:
Cursors move along and measure the minimum values on the time axis.
• Mid:
Cursors move through the middles of the maximum and minimum values on the time axis, and they
measure the values in the middle of the maximum and minimum values.
This item only appears in the waveform display. It does not appear in the trend or bar graph display.
Position of Cursor 1 (+; C1+ Position)
Set the position of cursor 1 (+) to a value within one of the following ranges.
• Waveform display:0 (the left edge of the screen) to 800 (the right edge of the screen)
• Trend display:
0 (the left edge of the screen) to 1601 (the right edge of the screen)
• Bar graph display: 0 (DC) to 500 (the 500th order)
Position of Cursor 2 (x; C2x Position)
Set the position of cursor 2 (x). The ranges within which you can set the position are the same as those for
cursor 1 (+; C1+ Position).
Click here.
Linking Cursor Movement (Linkage)
Set Linkage to ON to move cursor 1 (+) and cursor 2 (x) without changing the distance between them. Set the
positions of the cursors by setting C1+Position.
Measured Items
In the Waveform Display
Y+
Yx
Y
X+
Xx
X
1/X
15-2
The vertical-axis (Y-axis) value of cursor 1 (+)
The vertical-axis (Y-axis) value of cursor 2 (x)
The difference between the vertical-axis (Y-axis) values of cursor 1 (+) and
cursor 2 (x)
The horizontal-axis (X-axis) value of cursor 1 (+)
The horizontal-axis (X-axis) value of cursor 2 (x)
The difference between the horizontal-axis (X-axis) values of cursor 1 (+)
and cursor 2 (x)
The reciprocal of the difference between the horizontal-axis (X-axis) values
of cursor 1 (+) and cursor 2 (x)
IM WT1801-01EN
15 Cursor Measurement
In the Trend Display
Y+
Yx
ΔY
X+
Xx
ΔX
D+
Dx
The vertical-axis (Y-axis) value of cursor 1 (+)
The vertical-axis (Y-axis) value of cursor 2 (x)
The difference between the vertical-axis (Y-axis) values of cursor 1 (+) and
cursor 2 (x)
The horizontal-axis (X-axis) value of cursor 1 (+)
With the left edge of the screen being 0 seconds, the time from the left
edge of the screen is indicated.
The horizontal-axis (X-axis) value of cursor 2 (x)
With the left edge of the screen being 0 seconds, the time from the left
edge of the screen is indicated.
The difference between the horizontal-axis (X-axis) values of cursor 1 (+)
and cursor 2 (x)
The date and time at the position of cursor 1 (+)
The date and time of measurement are displayed in this format: Year/
Month/Day Hour:Minute:Second.
The date and time at the position of cursor 2 (x)
The date and time of measurement are displayed in this format: Year/
Month/Day Hour:Minute:Second.
• If immeasurable data exists, “***” is displayed in the measured value display area.
• ΔY can be measured even when the units of the cursors are different. The measured result will not have a
unit.
In the Bar Graph Display
Y1+
Y1x
ΔY1
Y2+
Y2x
ΔY2
Y3+
Y3x
ΔY3
IM WT1801-01EN
The vertical-axis (Y-axis) value of cursor 1 (+) of bar graph 1
The vertical-axis (Y-axis) value of cursor 2 (x) of bar graph 1
The difference between the vertical-axis (Y-axis) values of cursor 1 (+) and
cursor 2 (x) of bar graph 1
The vertical-axis (Y-axis) value of cursor 1 (+) of bar graph 2
The vertical-axis (Y-axis) value of cursor 2 (x) of bar graph 2
The difference between the vertical-axis (Y-axis) values of cursor 1 (+) and
cursor 2 (x) of bar graph 2
The vertical-axis (Y-axis) value of cursor 1 (+) of bar graph 3
The vertical-axis (Y-axis) value of cursor 2 (x) of bar graph 3
The difference between the vertical-axis (Y-axis) values of cursor 1 (+) and
cursor 2 (x) of bar graph 3
15-3
15 Cursor Measurement
Cursor Movement
In the Waveform Display
• Cursors move along the selected waveform.
• The unit of cursor movement is the amount of time contained in one screen ÷ 800.
• If immeasurable data exists, “***” is displayed in the measured value display area.
• ΔY can be measured even when the units of the cursors are different. The measured result will not have a
unit.
• The range of the vertical axis that can be measured using cursors is within ±300% when the crest factor is
set to CF3 and within ±600% when the crest factor is set to CF6.
In the Trend Display
• Cursors move along the selected trend.
• You can set the cursor position relative to the left edge of the screen in points, with the left edge itself being 0
points and the right edge being 1601 points.
• You can move through the displayed data one point at a time.
In the Bar Graph Display
• Two cursors (+ and x) are displayed in each graph (Graph1 to Graph3).
• You can set the cursor positions as orders.
• The bar graph display indicates what harmonic order each cursor is located in. For example:
• The location of cursor 1 (+) is indicated in this format: “Order+:2.”
• The location of cursor 2 (x) is indicated in this format: “Orderx:55.”
• The orders indicating the locations of cursors 1 (+) and 2 (x) are the same for each bar graph, from 1 to 3.
If immeasurable data exists, “***” is displayed in the measured value display area.
15-4
IM WT1801-01EN
16 High Speed Data Capturing
High Speed Data Capturing (OTHERS(High Speed Data
Capturing))
Models with the high speed data capturing option can measure every 5 ms and save the measured data to a file.
Also, you can synchronize the WT1800 with another device during measurement by applying an external sync
signal to the external start signal I/O (MEAS START) connector.
High speed data capturing takes advantage of the fact that in a balanced three-phase circuit, the instantaneous
values of the three phases of the rms voltage (UrmsΣ), the rms current (IrmsΣ), and the power (PΣ) add up
to a direct current. For a three-phase, three-wire system or three-phase, four-wire system, the WT1800 can
measure the rms voltage (UrmsΣ), the rms current (IrmsΣ), and the power (PΣ) at a high response speed. In an
unbalanced three-phase circuit, the measured values fluctuate. This indicates that the power consumed by the
load varies instantaneously.
When the measured values fluctuate, you can stabilize the measured voltage (U), current (I), and power (P)
values for each element and the measured UmeanΣ, ImeanΣ, Ur-meanΣ, and Ir-meanΣ values for each wiring
unit by setting a low cutoff frequency for the HS filter. However, if you set a low cutoff frequency for the HS filter,
the response to changes in the measured values becomes slower.
Display Indications for High Speed Data Capturing
File Recording State
High Speed Data Capturing State
High Speed Data Capturing State
• Ready
• “Ready” appears when high speed data capturing has been reset and the WT1800 is ready to begin high
speed data capturing.
• When the number of data captures has been set to a value other than Infinite, the number of data captures
appears to the right of Count.
Ready
Number of data captures
• Start
• “Start” appears when high speed data capturing has been started.
• The number of data captures that have been performed appears to the right of “Captured.”
Start
Number of times data has been captured
• Init(Initialize)
• “Init” appears when high speed data capturing is being initialized.
• A bar appears that indicates the initialization progress.
• The time remaining for the initialization appears to the right of “Remaining.”
Init
Initialization progress
Remaining initialization time
IM WT1801-01EN
16-1
16 High Speed Data Capturing
File Recording State
This indication appears when you set Record to File to ON.
• Ready
• “Ready” appears when recording to a file is possible and the WT1800 is ready to begin high speed data
capturing.
• Ready appears when you stop high speed data capturing and all processing for recording to a file finishes.
Ready
• Rec(Record)
• “Rec” appears when the WT1800 has begun recording to a file and while the WT1800 is regularly recording
data.
• The name of the file that is being recorded to appears to the right of “Name.”
Rec
File name
• Stop
“Stop” appears when the WT1800 has finished recording to a file and when recording to a file is stopped.
• Error
• When a write error occurs while the WT1800 is recording to a file, the WT1800 stops recording to the file,
and “Error” appears.
• The measurement operations for high speed data capturing continue without stopping.
Initializing High Speed Data Capturing
• High speed data capturing is initialized when:
• You switch from normal measurement to high speed data capturing.
• You change one of the following settings.
• A voltage or current measurement mode
• Whether the HS filter is on or off
• The HS filter's cutoff frequency
• Trigger
• Fundamental measurement conditions such as the measurement range and wiring system.
• The time required for initialization is as indicated below. For example, when the cutoff frequency is 1 Hz, the
time required for initialization is approximately 2.7 s.
2.7
The HS filter's cutoff frequency
[s]
However, when the above formula results in a value of 250 ms or less, the time required for initialization is
250 ms.
Measurement Functions
For the symbols and meanings of the measurement functions that you can measure using high speed data
capturing, see "High Speed Data Capturing Measurement Functions" under "Items That This Instrument Can
Measure."
Click here.
16-2
IM WT1801-01EN
16 High Speed Data Capturing
Data Capturing Interval
The interval at which data is captured varies as shown below depending on how External Sync is set.
• When External Sync is set to OFF: 5 ms
• When External Sync is set to ON: The interval at which data is captured depends on the sync signal that is
applied to the external start signal I/O (MEAS START) connector. The WT1800 can sync with a signal whose
period is 1 ms to 100 ms.
Display Update Rate
The display update rate is approximately 1 s.
Numeric Data Display
The numeric data for each measurement function that was last measured within the display update interval is
displayed.
You cannot make individual changes to the displayed measurement functions. Use the PAGE UP and PAGE
DOWN keys to change the display.
The number of pages varies as indicated below depending on the installed options.
Motor Evaluation Function
Not installed
Installed
Not installed
External Signal Input
Not installed
Not installed
Installed
Number of Pages
2 pages
4 pages
4 pages
• If the measured value exceeds 300%, “-OL-” (for over range) is displayed for U or I. When you are
measuring with the highest measurement range, if the measured value exceeds 140%, “-OL-” (for over
range) is displayed for U or I.
• If the measured value for the voltage or current is over range, “-OL-” (for over range) is displayed for P.
• “-OL-” (for over range) is displayed for UΣ if even one of the measured voltage values for an input element
in a single wiring unit is over range. The same is true for IΣ and PΣ.
• UΣ and IΣ are displayed as zero when they are the following percentage of the maximum voltage range or
current range out of the input elements assigned to the same wiring unit.
• When the Crest Factor Is Set to CF3
0.3% or less for Urms and Irms. 2% or less for Umn, Urmn, Imn, and Irmn.
• When the Crest Factor Is Set to CF6
0.6% or less for Urms and Irms. 4% or less for Umn, Urmn, Imn, and Irmn.
Fundamental Measurement Conditions
All the settings for the fundamental measurement conditions for high speed data capturing are the same as
those for normal measurement.
However, the following limitations apply to the wiring system and line filter.
Wiring System during High Speed Data Capturing
• When the wiring system is set to one of the following settings, you can measure the voltage (U), current (I),
and power (P).
• 1P2W: Single-phase, two-wire system
• 3P4W: Three-phase, four-wire system
• 3P3W (3V3A): Three-voltage, three-current method
• When the wiring system is set to one of the following settings, the voltage (UΣ), current (IΣ), and power (PΣ)
for the wiring unit are not measured and are displayed as "-------" (no data). When the wiring system is being
set or high speed data capturing has been started, an error message appears.
• 1P3W: Single-phase, three-wire system
• 3P3W: Three-phase, three-wire system
IM WT1801-01EN
16-3
16 High Speed Data Capturing
Line Filter for High Speed Data Capturing
• You can also set a line filter for high speed data capturing. The setting is not shared with normal
measurement. Even if you change the line filter setting during high speed data capturing, the line filter setting
for normal measurement will remain unchanged.
• In high speed data capturing, the line filter is always on. You cannot select OFF. The LINE FILTER key and
the Line Filter indicator at the top of the screen illuminate.
• You can set the cutoff frequency within the following range. For normal measurement, you can select 1 MHz,
but you cannot select 1 MHz for high speed data capturing.
0.1 kHz to 100.0 kHz (in 0.1 kHz steps), 300 kHz
Limitations on Setting Changes during High Speed Data Capturing
During high speed data capturing, there are some settings that you cannot change and functions that you cannot
execute. For details, see appendix 10 in the getting started guide, IM WT1801-03EN.
High Speed Data Capturing (HS) Settings (FORM)
The high speed data capturing (HS) settings are listed below.
• Number of data captures (Capture Count)
• Viewing and optimizing the maximum capturing count (Optimize Count)
• Capture control settings (Control Settings)
• Recording to a file (Record to File)
• Starting and stopping high speed data capturing (Start/Stop)
Number of Data Captures (Capture Count)
The number of captures can be set to infinity or to a value from 1 to 10000000.
Viewing and Optimizing the Maximum Capturing Count (Optimize
Count)
• The WT1800 computes the maximum capturing count for the save destination of the captured data file
according to the number of numeric data items specified in Item Settings.
• You can set the capturing count to a value from 0 to the computed maximum capturing count.
• If you select Set, the maximum capturing count is set to the number of data captures. However, you cannot
do this if the current number of data captures is 0.
• This setting is not valid when Record to File is set to OFF.
• If you enable automatic CSV conversion (Auto CSV Conversion) and set the storage destination for the
high speed data capturing files to a USB memory device, the maximum capturing count is computed with
approximately 20% of the available USB memory designated as valid for the high speed data capturing
files (*.WTS and *.HDS files).
• When the maximum capturing count is displayed as 0, the save destination device for the high speed data
capturing file does not have enough free space. Make more space available, by deleting files for example.
• If you change the number of numeric data items specified in Item Settings after you set the number of data
captures, the maximum capturing count will change, and you will need to set the number of data captures
again.
16-4
IM WT1801-01EN
16 High Speed Data Capturing
Capture Control Settings (Control Settings)
Voltage and Current Measurement Modes (U/I Measuring Mode)
Select the modes for measuring voltage and current.
Setting
Select the method for setting the voltage and current measurement modes from the following options.
Set the mode separately for the voltage and current of each input element.
• Each:
• All:
Set the mode for the voltages and currents of all installed input elements at the same time.
U1 to I6
Select the voltage and current measurement modes from the following options.
rms, mean, dc, r-mean
For details about how the voltage and current values are determined in each measurement mode, see appendix
1 in the getting started guide, IM WT1801-03EN.
The voltage or current measurement mode
(rms, mean, dc, r-mean)
If the voltage and current measurement mode settings differ for elements assigned to the same wiring unit,
the voltage (UΣ) and current (IΣ) of the wiring unit are not measured and are displayed as "-------" (no data).
HS Filter (HS Filter)
Turning on the HS (high speed) filter stabilizes the measured values. The HS filter averages the measured
values. The HS filter is different from the line filter.
Set whether to enable the HS filter, and set the cutoff frequency. You can set the cutoff frequency within the
following range.
1 Hz to 1000 Hz (in 1 Hz steps)
Selecting OFF disables the HS filter.
You can stabilize the measured voltage (U), current (I), and power (P) values for each element and the
measured UmeanΣ, ImeanΣ, Ur-meanΣ, and Ir-meanΣ values for each wiring unit by specifying a low cutoff
frequency for the HS filter. However, the response to changes in the measurement data becomes slower.
IM WT1801-01EN
16-5
16 High Speed Data Capturing
Trigger (Trigger Settings)
The trigger is what starts high speed data capturing. The act of starting high speed data capturing when the
trigger conditions are met is referred to as “triggering.”
All the trigger settings for high speed data capturing are shared with those for displaying waveforms. If you
change these settings in the menu for high speed data capturing, the waveform display trigger settings will
also change. For example, if you set the trigger mode to off in the high speed data capturing menu, the trigger
mode for waveform display will also be set to OFF.
Trigger Mode (Mode)
This setting is the same as the waveform display trigger mode setting.
Click here.
Trigger Source (Source)
This setting is the same as the waveform display trigger source setting.
Click here.
Trigger Slope (Slope)
This setting is the same as the waveform display trigger slope setting.
Click here.
Trigger Level (Level)
This setting is the same as the waveform display trigger level setting.
Click here.
External Sync (External Sync)
You can synchronize the WT1800 with another device during measurement by applying an external sync signal
to the external start signal I/O (MEAS START) connector.
• OFF: The WT1800 does not synchronize with an external start signal but instead captures data every 5 ms.
• ON: The WT1800 captures data in sync with an external start signal.
For the specifications of the external start signal I/O connector , see section 4.4 in the getting started guide, IM
WT1801-03EN.
• When External Sync is set to ON, the trigger settings are invalid. The trigger feature operates as if the
trigger mode was set to OFF.
• To measure in sync with an external signal, set External Sync to ON and apply a number of pulses equal
to or greater than the specified number of data captures + 1 to the external start signal I/O (MEAS START)
connector.
• To synchronize multiple WT1800s and perform high speed data capturing, synchronize a WT1800 on
which External Sync has been set to ON to a WT1800 on which External Sync has been set to OFF. When
you synchronize the WT1800s, make sure that they are set to the same number of data captures.
16-6
IM WT1801-01EN
16 High Speed Data Capturing
Recording to a File (Record to File)
• If you set Record to File to ON, when high speed data capturing starts, the WT1800 saves the following two
files in binary format.
• High speed data capturing data file (.WTS):The measured data is saved to this file.
• High speed data capturing header file (.HDS): The measurement conditions, settings, and recording
information are saved to this file.
• File name extensions are added automatically.
• The file recording state (File State) appears in the upper left of the screen. The file recording state appears as
“Ready,” “Rec,” “Stop,” or “Error,” depending on the state of high speed data capturing.
• If you set the save destination to a USB memory device, a high speed data capturing data file (.WTS) can
contain up to 1 GB of data or 10,000,000 data captures.
• The WT1800 cannot load the measurement data that has been recorded on a file.
• Under the following circumstances, recording to a file stops, and the file recording state changes to Stop.
The measurement operations for high speed data capturing continue without stopping.
• When the file save destination runs out of free space.
• When the size of the high speed data capturing data file exceeds the maximum value (1 GB).
• When high speed data capturing is performed 10,000,000 times.
• Do not output captured data through communication and record it to a file at the same time. Doing so can
lead to a reduction in the communication output speed and a reduction in the recording speed, can cause
recording to a file to stop, and can make the file recording state change to Error.
• In the following circumstances, it is possible for the data update speed to surpass the speed at which the
file is being recorded to, for recording to the file to stop, and for the file recording state to change to Error.
• When you perform consecutive operations in the setup menu.
• When the WT1800 receives consecutive communication commands.
• When you operate the WT1800 over FTP.
• When you save to a USB memory device with a slow write speed.
• When the write speed to the USB memory device that has been specified as the save destination is slow,
the data update speed exceeds the speed at which the file is being recorded to, and recording to the file
stops, you may be able to remedy the situation by using the methods described below.
• Reduce the number of items that are being saved.
• Using a faster USB memory device.
• When it takes a long time for data to be written to the USB memory device, recording to the file may be
stopped forcefully, and some data may not be saved. When this happens, the file state indication is "Error."
• Conversion to ASCII format (.csv) uses a pair of files that consists of a high speed data capturing data file
(.wts) and a high speed data capturing header file (.hds) with the same name. Do not change the names
of high speed data capturing data files (.wts) and high speed data capturing header files (.hds) for different
sets of data to the same name. If you do so, the WT1800 may malfunction and the USB memory may be
damaged when you convert the data to ASCII format (.csv).
• If you disconnect a USB memory device while a file is being recorded to and the file recording state
changes to Error, the high speed data capturing file may be incomplete or damaged. If this is the case,
you will not be able to convert the data to ASCII format (.csv). Be sure to only disconnect the USB memory
device when the file recording state is Ready.
• When you turn off the WT1800 power, the contents of the internal RAM disk are lost. Save the contents of
the RAM disk to a USB memory device or network drive before you turn off the WT1800.
• Please be aware that the number of times that you can write to USB memory is limited.
IM WT1801-01EN
16-7
16 High Speed Data Capturing
Save Conditions (File Settings)
File List Display and Save Destination Settings (File List)
On the file list, specify the save destination for the measured data. You can set the storage medium to the
internal RAM disk or to a USB memory device. You cannot set the storage medium to a network drive. For
information about how to configure the file list display and how to operate files and folders, see “File Operations
(Utility).”
Click here.
If you set the storage medium to a USB memory device, when you remove the USB memory device, the
storage medium automatically changes to the internal RAM disk.
Automatic CSV Conversion (Auto CSV Conversion)
You can choose whether to automatically create an ASCII format high speed data capturing file (.csv) from the
high speed data capturing data file (.wts) and the high speed data capturing header file (.hds) that are saved
when high speed data capturing stops.
• When the storage destination is the internal RAM disk ([RAM-0])
A CSV file is created in the root folder of the USB memory device whose ID number is 0 ([USB-0]). An error
message appears when USB memory is not connected.
• When the storage destination is a USB memory device ([USB-0] or [USB-1])
A CSV file is saved in the same folder as the high speed data capturing data file.
The WT1800 will not create a CSV file whose size exceeds 2 GB but will instead create a CSV file for 2 GB
worth of captured data. To convert the data into a CSV file whose size exceeds 2 GB, use the file reader
software available from the following Yokogawa webpage.
http://www.yokogawa.com/jp-ymi/tm/F-SOFT/wtfs/wtfs1.htm
Saved Items (Item Settings)
Select whether to store a numeric data item by selecting or clearing its check box.
Items for which there is no measurement data are displayed as “-------” (no data), and no data is saved for
them.
Automatic File Naming (Auto Naming)
This is the same as the auto naming feature for saving and loading data.
Click here.
File Name (File Name)
This is the same as the file name setting for saving and loading data.
Click here.
Comment (Comment)
This is the same as the comment setting for saving and loading data.
Click here.
16-8
IM WT1801-01EN
16 High Speed Data Capturing
Manually Converting to CSV Format (CSV Convert)
You can convert the selected high speed data capturing data to ASCII format (.csv). This menu item appears
when you press File List to display the file list.
• When you convert high speed data capturing data on the internal RAM disk ([RAM-0])
A CSV file is created in the root folder of the USB memory device whose ID number is 0 ([USB-0]). An error
message appears when USB memory is not connected.
• When you convert high speed data capturing data on a USB memory device ([USB-0] or [USB-1])
A CSV file is saved in the same folder as the high speed data capturing data file that is being converted.
Starting and Stopping High Speed Data Capturing (Start/Stop)
Starting High Speed Data Capturing (Start)
• High speed data capturing starts.
• When high speed data capturing starts, the following operations are performed.
• If the trigger mode is set to OFF, data is captured.
• If the trigger mode is set to Auto or Normal, the WT1800 waits for a trigger to occur. When a trigger occurs,
the WT1800 begins capturing data.
• “HS State: Start” appears in the upper right of the screen.
• When recording to a file is enabled, the WT1800 creates a high speed data capturing data file (.WTS) and
a high speed data capturing header file (.HDS). “File State: Rec” and the file name appear in the upper left
of the screen.
While “File State: Rec” is displayed, the storage medium is constantly being accessed, even though the icon
that indicates this is not displayed, so do not remove the USB memory device or turn off the power. Doing so
may damage the storage medium and corrupt its data.
Stopping High Speed Data Capturing (Stop)
• High speed data capturing stops.
• When high speed data capturing stops, the following operations are performed.
• "HS State: Ready" appears in the upper right of the screen.
• When recording to a file is enabled, the WT1800 finishes writing to the high speed data capturing data file
(.WTS) and high speed data capturing header file (.HDS) and closes them. "File State: Ready" appears in
the upper left of the screen.
• When recording to a file and automatic CSV conversion are enabled, the WT1800 creates an ASCII format
high speed data capturing file (.CSV).
Automatically Stopping High Speed Data Capturing
• After the specified number of high speed data captures have been made, high speed data capturing
automatically stops.
• The same operations are performed as those listed above for when high speed data capturing stops.
• When External Sync is set to ON and the following conditions regarding the external start signal applied to
the WT1800 are met, high speed data capturing automatically stops.
• When the external start signal is not applied for 1 s or longer.
• When the period of the external start signal is less than 1 ms.
IM WT1801-01EN
16-9
16 High Speed Data Capturing
High Speed Data Capturing Operations
Examples for when the trigger mode is Auto or Normal.
Trigger
wait
High speed
data capturing
state
(HS State)
Ready
Start
File recording
state
(File State)
Ready
Rec
Data
capturing
Ready
Ready
Time
Start key
Completion
of initialization
Trigger
Completion of
file recording
Stop key or capture count
After a trigger occurs, measured data is regularly written to
the high speed data capturing data file (.WTS).
16-10
IM WT1801-01EN
16 High Speed Data Capturing
Display Items (ITEM)
Number of Columns (Column Num)
You can select four or six columns.
Column Number (Column No.)
Select the number of the column that you want to configure.
Element (Element/Σ)
This is the same as the element (Element/Σ) item in the Matrix display.
Click here.
Directly Selecting Elements (ELEMENT)
This is the same as direct element selection in the 4-, 8-, and 16-value displays.
Click here.
Resetting the Settings (Reset Items Exec)
Reset the column settings.
Turning the Display Frame On and Off (Display Frame)
This is the same as turning the display frame on and off in the 4-, 8-, and 16-value displays.
Click here.
Displaying Peak Over-Range Occurrence Information (Display Peak Over Status)
You can select whether to show (ON) or hide (OFF) peak over-range occurrence information.
Peak Over-Range Occurrence Information (Peak Over Status)
• If a peak over-range occurs in an input signal even once from the time when high speed data capturing starts
until it stops, the input signal is displayed in red.
Display example for when a peak over-range has occurred in U1 and I2.
• When display frames for measured values are displayed, display frames of measured values within which a
peak over-range has occurred are displayed in red.
• Even if you stop high speed data capturing, the peak over-range occurrence information does not disappear.
The peak over-range occurrence information will disappear (be reset) when after you stop high speed data
capturing, you restart high speed data capturing or change the settings.
The input peak over-range indicator in the center of the top section of the screen lights in red when a peak
over-range occurs.
IM WT1801-01EN
16-11
17 Data Storage
You can store numeric data in binary format to the internal RAM disk or a USB memory device. You can store
the data at the data update interval or at a specified time interval. You can convert stored binary data to ASCII (.csv)
format. You can analyze the converted data on a PC. You cannot use the WT1800 to recall stored data.
Storage-Related Display Indications
When the storage state is any state other than that of being reset, the storage state and store count appear in
the upper left of the screen.
Store state
Storage count
Start
Storage has been started.
Stop
Storage has been stopped.
Ready
The storage mode is real-time storage mode, integration-synchronized storage mode, or event-synchronized
storage mode, and the WT1800 is ready to begin storing.
Cmpl (Complete)
• The WT1800 has completed the specified number of storage operations.
• The WT1800 is in real-time storage mode and the scheduled storage stop time has passed.
When storage is reset, no storage state is displayed in the upper left of the screen.
Limitations on Changing the Settings during Storage
While data is being stored, there are some settings that you cannot change and functions that you cannot
execute. For details, see appendix 9 in the getting started guide, IM WT1801-03EN.
Storage Conditions (STORE SET)
The following storage configuration menus are available.
• Storage control (Control Settings)
• Stored items (Item Settings)
• Save conditions (File Settings)
IM WT1801-01EN
17-1
17 Data Storage
Storage Control (Control Settings)
Storage Mode (Store Mode)
You can choose from one of the following methods for starting and stopping storage.
• Manual (Manual storage mode)
When you press STORE START, numeric data is stored at the storage interval for the number of times
specified by the storage count.
• Real Time (Real-time storage mode)
Storage starts after you press STORE START and the scheduled storage start time is reached. You can store
numeric data at the storage interval until the storage stop time (or just the storage count) is reached.
• Integ Sync (Integration-synchronized storage mode)
• Storage starts after you press STORE START and integration starts. You can store numeric data at the
storage interval until integration stops (or just until the storage count is reached) is reached.
• Storage continues even when integration is reset by the integration timer. When the integration timer is
reset, the storage interval timer is also reset.
When independent integration is enabled, storage cannot be performed in integration-synchronized storage
mode.
• Event (Event-synchronized storage mode)
Storage starts after you press STORE START, the measured data is updated, and a user-defined event
occurs. You can store numeric data each time the measured data is updated until the storage count is
reached.
• Single Shot (Single-shot storage mode)
Numeric data is stored whenever you press STORE START. You can store numeric data until the storage
count is reached.
Storage Count (Store Count)
• The storage count can be set to infinity or to a value from 1 to 9999999.
• When the storage count is set to infinity, it is set to 9999999.
• Storage will stop before the specified storage count if the storage destination runs out of available memory or
the stored data size exceeds the maximum value (1 GB).
Viewing and Optimizing the Maximum Storage Count (Optimize Count)
• The WT1800 computes the maximum storage count for the storage destination according to the number of
data types specified in the Item Settings.
• You can set the storage count to a value from 0 to the computed maximum storage count.
• You can select Set to set the maximum storage count to the current storage count. However, you cannot do
this if the current storage count is 0.
17-2
IM WT1801-01EN
17 Data Storage
• If you enable automatic CSV conversion (Auto CSV Conversion) and set the storage destination to a
USB memory device, the maximum storage count is computed with 20% of the available USB memory
designated as valid for stored data (*.WTS and *.HDS files).
• If the maximum storage count is displayed as 0, there is not enough available memory in the storage
destination. Make more space available, by deleting files for example.
• If you change the number of stored items specified in Item Settings after you set the storage count, the
maximum storage count will change, and you will need to set the storage count again.
Storage Interval (Interval)
You can set the interval at which numeric data is stored.
• You can set the hour, minute, and second within the following range. If you set the interval to 00:00:00, the
numeric data will be stored at the numeric data update interval.
00:00:00 to 99:59:59
• When the storage mode is set to Integ Sync, storage continues even when integration is reset by the
integration timer. When the integration timer is reset, the storage interval timer is also reset.
• This setting is invalid when the storage mode is set to Event or Single Shot.
Scheduled Storage Times for Real-Time Storage Mode (Real Time Control)
These settings are only valid when the storage mode is set to Real Time. You can set the year, month, day, hour,
minute, and second of the storage start and stop times. Be sure to set the storage stop time to a time after the
storage start time. You can set the values within the following ranges.
• Year:
Any four-digit Gregorian calendar value
• Hour:Minute:Second:
00:00:00 to 23:59:59
• Now:
The scheduled storage start time is set to the current time.
• Copy:
The scheduled storage start time is copied into the scheduled storage stop time.
• You can set the day for the scheduled start or stop time in February to a value as high as the 31st day. If
you do so, an error message will appear when you start storage. Reset the scheduled start and stop times.
• The WT1800 recognizes leap years when it executes the storage operation.
Trigger Event for Event-Synchronized Storage Mode (Trigger Event)
This setting is only valid when the storage mode is set to Event. You can select the user-defined event whose
occurrence will cause storage to start. If you select a disabled user-defined event, storage cannot start.
For information about configuring user-defined events, see “User-Defined Events.”
Click here.
Storage of the Numeric Data at Store Start (Store At Start)
• Select whether to store the numeric data at store start.
• You can configure this setting when:
• The storage mode is set to Manual, and the storage interval is not 00:00:00.
• The storage mode is set to Real Time, and the storage interval is not 00:00:00.
• The storage mode is set to Integ Sync.
IM WT1801-01EN
17-3
17 Data Storage
Stored Items (Item Settings)
You can set which numeric data items to store. You can choose to store the displayed numeric items (Displayed
Numeric Items) or the selected items (Selected Items).
Displayed Numeric Items (Displayed Numeric Items)
The numeric data items displayed on the screen are stored. The stored items vary as indicated below depending
on the display.
• When Numeric Values Are Displayed in the 4-, 8-, or 16-Value Display or the Matrix Display
All the measurement functions on the page that is displayed when storage starts are stored in the order that
they are displayed.
• When Numeric Values Are Displayed in the Single or Dual Harmonics List
In addition to the data described above, the data of harmonics that are not displayed on the screen is stored
up to the maximum measurable order (Max Order).
• When Numeric Values Are Displayed in the All Items or Custom Display
Storage cannot be performed. An error message is displayed at store start.
• In Non-Numeric Displays (Waveform display, trend display, etc.)
The WT1800 stores data according to the numeric display settings. For example, when the waveform
display is shown, if the 16-value display would appear when you pressed NUMERIC, then the data for the
measurement functions on the page of the 16-value display that would appear is stored.
During storage, even if you change the numeric data display format or the displayed items, the data is stored
according to the numeric data that was displayed at store start.
Selected Items (Selected Items)
You can select the types of numeric data to store. To select which types of numeric data to store, click Items.
Items (Items)
If you set the numeric data items to store to Selected Items, you can select which types of numeric data to store.
Element (Element)
To select an element or wiring unit that you want to store the data of, select or clear its check box. You can select
from the following options.
Element1, Element2, Element3, Element4, Element5, Element6, ΣA, ΣB, and ΣC
Function (Function)
Select whether to store the data of a function by selecting or clearing its check box. You can select any of the
measurement function types listed under “Items That This Instrument Can Measure.”
Click here.
Selecting All Functions (All ON)
The data of all measurement functions is stored.
Deselecting All Functions (All OFF)
None of the data for any of the measurement functions is stored.
Preset 1 (Preset 1)
The data of the following measurement functions is stored for all elements and wiring units.*
Urms, Irms, FreqU, FreqI, P, S, Q, λ, and Φ
Preset 2 (Preset 2)
The data of the following measurement functions is stored for all elements and wiring units.*
WP, WP+, WP–, q, q+, q–, Time, WS, and WQ
* If the wiring system setting (Wiring) is configured so that a wiring unit does not exist, the data for the functions
of that wiring unit is not stored. For example, if ΣC does not exist, the data for ΣC is not stored.
17-4
IM WT1801-01EN
17 Data Storage
Save Conditions (File Settings)
• Stored measurement data is saved to files in binary format (with .wts extensions).
• Measurement conditions, settings, and storage information are saved in binary format to header files (with
.hds extensions).
• File name extensions are added automatically.
• When the storage destination is a USB memory device, the maximum stored data file (.wts) file size is 1 GB.
• You cannot load stored data using the WT1800.
Click here.
Displaying a File List and Specifying the Save Destination (File List)
On the file list, specify the save destination. You can set the storage medium to the internal RAM disk or to
a USB memory device. You cannot set the storage medium to a network drive. For information about how to
configure the file list display and how to operate files and folders, see “File Operations (Utility).”
Click here.
If you set the storage medium to a USB memory device, when you remove the USB memory device, the
storage medium automatically changes to the internal RAM disk.
Automatic CSV Conversion (Auto CSV Conversion)
You can choose whether to automatically create an ASCII format stored data file (.csv) from the stored data file
(.wts) and the header file (.hds) that are saved when storage finishes or is reset.
• When the storage destination is the internal RAM disk ([RAM-0])
A CSV file is created in the root folder of the USB memory device whose ID number is 0 ([USB-0]).
• When the storage destination is a USB memory device ([USB-0] or [USB-1])
A CSV file is saved in the same folder as the stored data file.
Automatic File Naming (Auto Naming)
This is the same as the auto naming feature for saving and loading data.
Click here.
File Name (File Name)
This is the same as the file name setting for saving and loading data.
Click here.
Comment (Comment)
This is the same as the comment setting for saving and loading data.
Click here.
Manually Converting to CSV Format (CSV Convert)
You can convert the selected stored data to ASCII format (.csv). This menu item appears when you press File
List to display the file list.
• When you convert stored data on the internal RAM disk ([RAM-0])
A CSV file is created in the root folder of the USB memory device whose ID number is 0 ([USB-0]).
• When you convert stored data on a USB memory device ([USB-0] or [USB-1])
A CSV file is saved in the same folder as the stored data file you are converting.
IM WT1801-01EN
17-5
17 Data Storage
• Data storage may fail under the following circumstances. When this happens, an asterisk appears in the
storage state indication. The storage count includes the missing stored data.
• When you perform consecutive operations in the setup menu.
• When the WT1800 receives consecutive communication commands.
• When you operate the WT1800 over FTP.
• If you choose to store data through USB and the write speed of the connected USB device is slow, a new
numeric data storage operation may begin before the previous operation is finished, and some of the
numeric data may be lost. When this happens, an asterisk appears in the storage state indication. The
storage count includes the missing stored data. You can avoid the loss of numeric data during storage by:
• Setting a longer data update interval.
• Reducing the number of stored data types.
• Using a faster USB memory device.
• When it takes a long time for data to be written to the USB, storage may be stopped forcefully, and some
data may not be saved. When this happens, the storage state indication is “Error.”
• Conversion to ASCII format (.csv) uses a pair of files that consists of a stored numeric data file (.wts) and a
header file (.hds) with the same name. Do not change the names of stored numeric data (.wts) and header
(.hds) files for different sets of data to the same name. If you do so, the WT1800 may malfunction and the
USB memory may be damaged when you convert the data to ASCII format (.csv).
• If you remove the USB memory during storage and the storage state indication is “Error,” the stored data
file may be incomplete or corrupted. If this is the case, you will not be able to convert the data to ASCII
format (.csv). Be sure to remove the USB memory after storage has been reset or has completed (Cmpl).
• When you turn off the WT1800 power, the contents of the internal RAM disk are lost. Save the contents of
the RAM disk to a USB memory device or network drive before you turn off the WT1800.
• Please be aware that the number of times that you can write to USB memory is limited.
Starting, Stopping, and Resetting Storage (STORE START,
STORE STOP, and STORE RESET)
Starting Storage (STORE START)
• When you press STORE START, storage starts under one of the conditions described below, depending on
the storage mode.
• Manual storage mode (Manual)
Storage starts immediately.
• Real-time storage mode (Real Time)
The WT1800 enters into a storage-ready state. Storage starts when the scheduled storage start time is
reached.
• Integration-synchronized storage mode (Integ Sync)
The WT1800 enters into a storage-ready state. Storage starts when integration starts.
• Event-synchronized storage mode (Event)
The WT1800 enters into a storage-ready state. Storage starts when a user-defined event occurs.
• Single-shot storage mode (Single Shot)
Storage starts immediately. Numeric data is stored whenever you press STORE START.
• When storage starts, the STORE START key illuminates, and “Store:Start” appears in the upper left of the
screen.
• When the WT1800 is in a storage-ready state, the STORE START key blinks, and “Store:Ready” appears in
the upper left of the screen.
• After storage is reset, a stored data file (.wts) and header file (.hds) are created when storage starts again.
• When the storage state is “Stop,” you can restart storage. When you restart storage, the stored data continues
to be written to the file from before storage was stopped.
• When the store state is “Cmpl,” you cannot restart storage until you reset it. After you reset storage and then
start it, a new stored data file is created and written to.
17-6
IM WT1801-01EN
17 Data Storage
Stopping Storage (STORE STOP)
• You can temporarily stop storage by pressing STORE STOP.
• When storage stops, the STORE STOP key blinks, and “Store:Stop” appears in the upper left of the screen.
• When the storage count is zero and the WT1800 is in a storage-ready state (Ready)* and you press STORE
STOP, storage is reset. The storage data file (.wts) and storage header file (.hds) are deleted.
* This state can occur in real-time storage mode when you have pressed STORE START but the scheduled
storage start time has not yet arrived (the storage operation has not begun).
Ending Storage
• Depending on the storage mode, storage automatically stops and the storage state changes to “Cmpl” under
one of the following conditions.
• Manual storage mode (Manual)
Storage continues until the storage count is reached.
• Real-time storage mode (Real Time)
Storage continues until the storage count or the scheduled storage stop time.
• Integration-synchronized storage mode (Integ Sync)
Storage continues until the storage count is reached, and then storage is completed (Cmpl). When
integration stops, the following occurs.
• If integration cannot be restarted without being reset, the storage state changes to “Stop.”
• If integration can be restarted without being reset, the storage state changes to “Ready.”
• Event-synchronized storage mode (Event)
Storage continues until the storage count is reached.
• Single-shot storage mode (Single Shot)
Storage continues until the storage count is reached.
• After storage is completed, the following occurs.
• The STORE STOP key illuminates, and “Store:Cmpl” appears in the upper left of the screen.
• Writing to the stored data file (.wts) and header file (.hds) finishes, and the files are closed.
• When automatic CSV conversion (Auto CSV Conversion) is enabled, an ASCII format stored data file (.csv)
is created.
Storage will stop before the specified storage count if the storage destination runs out of available memory or
the stored data size exceeds the maximum value (1 GB).
Resetting Storage (STORE RESET)
• When you reset storage, the WT1800 enters into the reset store state, in which the store state indicator is
blank.
• If you reset storage when the store state is “Stop,” writing to the stored data file (.wts) and header file (.hds)
finishes, and the files are closed. When automatic CSV conversion (Auto CSV Conversion) is enabled, an
ASCII format stored data file (.csv) is created.
• When the store state is “Cmpl,” the stored data file (.wts) and header file (.hds) are already closed, so no file
operations are performed when storage is reset.
IM WT1801-01EN
17-7
17 Data Storage
Storage Operations in Each Storage Mode
Manual (Manual storage mode)
State
STORE START
on
STORE STOP
on
Start
Cmpl
Time
Storage count
STORE START
key
STORE RESET
key
Real Time (Real-time storage mode)
State
STORE START
blinking
STORE START
on
STORE STOP
on
Ready
Start
Cmpl
Time
STORE START
key
Scheduled
start time
Scheduled
stop time or
storage count
STORE RESET
key
Integ Sync (Integration-synchronized storage mode)
When the storage count is reached before integration stops
State
STORE START
blinking
STORE START
on
STORE STOP
on
Ready
Start
Cmpl
Time
STORE START
key
Integration start
Storage count
STORE RESET
key
When integration stops before the storage count is reached (illustration of operations after integration starts)
State
STORE START
on
STORE START
blinking
STORE STOP
blinking
Start
Ready
Stop
Time
Integration
start
Integration
stop
Integration
reset
STORE RESET
key
• If you reset integration after it has been stopped, the store state changes to “Cmpl.” Writing to the stored data
file (.wts) and header file (.hds) finishes, and the files are closed.
• If you restart integration after it has been stopped, the store state changes to “Start.” The stored data
continues to be written to the file from before storage was stopped.
Event (Event-synchronized storage mode)
State
STORE START
blinking
STORE START
on
STORE STOP
on
Ready
Start
Cmpl
Time
STORE START
key
17-8
Event occurrence Storage count
STORE RESET
key
IM WT1801-01EN
17 Data Storage
Single Shot (Single-shot storage mode)
State
STORE START
on
STORE STOP
on
Start
Cmpl
Time
Storage count
STORE START
key
STORE RESET
key
Storage Operations Performed When You Press STORE STOP After Storage Has Been
Started
Restarting Storage
When you press STORE START, STORE STOP, and then STORE START
State
STORE START
on
STORE STOP
blinking
STORE START
on
Start
Stop
Start
Time
STORE STOP
key
STORE START
key
STORE START
key
Resetting Storage
When you press STORE START, STORE STOP, and then STORE RESET
State
STORE START
on
STORE STOP
blinking
Start
Stop
Time
STORE STOP
key
STORE START
key
STORE RESET
key
Storage Operation When the Storage Interval Is Not an Integer Multiple of the Data
Update Interval
Here we will use the case when the data update interval is 5 s and the storage interval is 7 s as an example.
How storage is performed varies as indicated below depending on the storage mode.
When the Storage Mode Is Not Set to Integ Sync
Storage is performed according to the storage interval.
Time (s) 0
Data
update
5
Time (s) 0
Storage
10
7
15
14
20
25
21
30
28
35
35
When the Storage Mode Is Integ Sync and the Integration Mode Is Not Continuous or R-Continuous
Storage is performed at the first data update after the storage interval passes.
Time (s) 0
Data
update
Time (s) 0
Storage
IM WT1801-01EN
5
10
7
15
14
20
21
25
30
28
35
35
17-9
17 Data Storage
When the Storage Mode Is Integ Sync and the Integration Mode Is Continuous or R-Continuous
Storage is performed at the first data update after the storage interval passes. Storage continues even when
integration is reset by the integration timer. When the integration timer is reset, the storage interval timer is also
reset. The figure below is an example for when the integration timer is set to 20 s.
Time (s) 0
Data
update
Time (s) 0
Storage
5
10
7
15
14
20
20
5
10
7
15
14
• When the storage of numeric data at store start (Store At Start) is enabled, storage starts when the time is
at 0 s (store start).
• Storage is performed when the integration mode is continuous integration mode or real-time continuous
integration mode, the integration timer time elapses, and the integrated values are reset. In the above
example, the integration timer is set to 20 s, so the data is stored after 20 s have passed, and then the
integrated values are reset.
Operations when Values Are Held
If you press HOLD after storage has been started, the displayed values are held, and storage is performed as
indicated below.
• When the storage mode is set to Manual and the storage interval is 00:00:00, when the storage mode is set
to Real Time and the storage interval is 00:00:00, or when Storage Mode is set to Event
The storage operation stops, but integration does not.
• When the storage mode is set to Single Shot
The held display values are stored. Even during integration, the held display values are stored.
• In All Other Cases
The held display values are stored. During integration, the values being measured are stored.
• Media access indication icon only illuminates when the WT1800 creates files at the start of storage and
closes them at the end of storage, but the WT1800 is actually always accessing the storage medium.
During the period between when the files are created and when they are closed, do not remove the USB
memory or turn off the power. Doing so may damage the storage medium and corrupt its data.
• When a point has no numeric data, NAN, OL, OF, ERROR, or a blank space will be stored instead. The
places that contain blank spaces are in measurement functions such as the ones for the 0th (DC) and 1st
harmonic orders of ΦU and ΦI, where the screen display is also blank.
• Functions ΔU1 to ΔPΣ are stored according to the delta computation (option) type that you selected in the
delta computation settings.
• When the WT1800 automatically changes the range during storage, because measured data cannot
be acquired, the store operation is paused and no measured data is stored. After the WT1800 finishes
changing the range, storage resumes.
• You cannot use the auto print feature during storage.
17-10
IM WT1801-01EN
18 Saving and Loading Data
You can save numeric data, waveform display data, screen image data, and setup parameters to USB memory
or a network drive.
For information about saving screen image data, see “Saving Screen Images”
Click here.
You can load the setup data from a storage medium into the WT1800.
You can also rename, copy, and delete data files.
Using a PC to Load Numeric Data, Waveform Display Data, or Screen Image Data
WT1800
PC
Screen image data
Saving
Waveform display data
Online1
Numeric data
Storage
Storage
Internal RAM disk
Online1
Waveform display data
Binary format (.wts/.hds)
File Reader
USB memory
Microsoft Excel
Binary format (.wts/.hds)
Offline2
ASCII format (.csv)
ASCII format (.csv)
Numeric data
Numeric data
Waveform display data
Offline2
BMP format (.bmp)
PNG format (.png)
JPEG format (.jpg)
Screen image data
1
2
Numeric data
Binary format (.wtw)
CSV
conversion
Numeric data
WTViewer
Waveform display data
Waveform display data
BMP format (.bmp)
PNG format (.png)
JPEG format (.jpg)
Screen image data
Data acquisition using USB, Ethernet, or GP-IB
Data acquisition using USB memory
Storage Media
The WT1800 can access the following three types of storage media for saving and loading data.
Internal RAM Disk (RAM-0)
The internal RAM disk of the WT1800.
USB Memory (USB-0 or USB-1)
A USB memory device that is connected to the WT1800 USB port. USB2.0 mass storage devices compatible
with USB Mass Storage Class Ver. 1.1 can be connected to the WT1800.
Network Drive (Network)
A storage device on the network. You can use a network storage device by connecting the WT1800 to an
Ethernet network.
When you turn off the WT1800 power, the contents of the internal RAM disk are lost. Save the contents of the
RAM disk to a USB memory device or network drive before you turn off the WT1800.
IM WT1801-01EN
18-1
18 Saving and Loading Data
Notes about Using USB Devices
• Connect the USB memory device to the USB port for peripherals (type A) directly, not through a USB hub.
• Use portable USB storage media that are compatible with USB Mass Storage Class version 1.1.
• You cannot use protected USB storage devices (such as those that contain encrypted content).
• Only connect compatible USB keyboards, mouse devices, or memory devices to the USB ports for
peripherals.
• Do not connect and disconnect multiple USB devices repetitively. Provide a 10-second interval between
removal and connection.
• Do not connect or remove USB devices from the time when the WT1800 is turned on until key operation
becomes available (approximately 20 to 30 seconds).
• The WT1800 can handle up to two USB memory devices.
Saving Setup Data (Save Setup)
You can save the WT1800 setup data to the specified storage medium. The date, time, and communication
setup parameters are not saved.
The extension is .SET.
For information about the file save conditions, see “File Save Conditions.”
Click here.
Saving Waveform Display Data (Save Wave)
You can save the waveform data that the WT1800 has measured to a file in ASCII format (.csv). The waveform
displayed on the screen is saved.
For information about the file save conditions, see “File Save Conditions.”
Click here.
The waveform display data that the WT1800 saves is not the sampled waveform data that is acquired at the
WT1800 sample rate (of approximately 2 MS/s). The WT1800 performs P-P compression on the sampled
waveform data, to produce 1602 points of waveform display data that are used to display the waveform on
the screen.
Saving Numeric Data (Save Numeric)
You can save the numeric data that the WT1800 has measured to a file in ASCII format (.csv).
For information about the file save conditions, see “File Save Conditions.”
Click here.
When you save numeric data and a point has no numeric data, NAN, OL, OF, ERROR, or a blank space will
be saved instead. The places that contain blank spaces are in measurement functions such as the ones for
the 0th (DC) and 1st harmonic orders of ΦU and ΦI, where the screen display is also blank.
18-2
IM WT1801-01EN
18 Saving and Loading Data
File Save Conditions
Displaying a File List and Specifying the Save Destination (File List)
On the file list, specify the save destination. For information about how to configure the file list display and how
to operate files and folders, see “File Operations (Utility).”
Click here.
Saved Items (Item Settings)
This menu item only appears when you select Save Numeric.
Displayed Numeric Items (Displayed Numeric Items)
The saved items vary as indicated below depending on the display.
• When Numeric Values Are Displayed in the 4-, 8-, or 16-Value Display or the Matrix Display
All the measurement functions on the page that is displayed when saving starts are saved in the order that
they are displayed.
• When Numeric Values Are Displayed in the Single or Dual Harmonics List
In addition to the data described above, the data of harmonics that are not displayed on the screen is saved
up to the maximum measurable order (Max Order).
• When Numeric Values Are Displayed in the All Items or Custom Display
The data cannot be saved. If you attempt to save the data, an error message is displayed.
• In Non-Numeric Displays (Waveform display, trend display, etc.)
The WT1800 saved data according to the numeric display settings. For example, when the waveform
display is shown, if the 16-value display would appear when you pressed NUMERIC, then the data for the
measurement functions on the page of the 16-value display that would appear is saved.
Selected Items (Selected Items)
You can select the types of numeric data to save.
Items (Items)
If you selected Selected Items, select which numeric data to save.
• Element (Element)
To select an element or wiring unit that you want to store the data of, select or clear its check box. You can
select from the following options.
Element1, Element2, Element3, Element4, Element5, Element6, ΣA, ΣB, and ΣC
• Function (Function)
Select whether to store the data of a function by selecting or clearing its check box. You can select any of the
measurement function types listed under “Items That This Instrument Can Measure.”
Click here.
• Selecting All Functions (All ON)
The data of all measurement functions is saved.
• Deselecting All Functions (All OFF)
None of the data for any of the measurement functions is saved.
• Preset 1 (Preset 1)
The data of the following measurement functions is saved for all elements and wiring units.*
Urms, Irms, FreqU, FreqI, P, S, Q, λ, and Φ
• Preset 2 (Preset 2)
The data of the following measurement functions is saved for all elements and wiring units.*
WP, WP+, WP–, q, q+, q–, Time, WS, and WQ
* If the wiring system setting (Wiring) is configured so that a wiring unit does not exist, the data for the
functions of that wiring unit is not saved. For example, if ΣC does not exist, the data for ΣC is not saved.
IM WT1801-01EN
18-3
18 Saving and Loading Data
Automatic File Naming (Auto Naming)
Numbering (Numbering)
The WT1800 automatically adds a four-digit number from 0000 to 0999 after the common name specified using
the File Name setting and saves files.
Date (Date)
The date and time when the file is saved are used as its name. The file name specified for the File Name setting
is ignored.
20100630_121530_0 (2010/06/30 12:15:30)
Sequence number (0 to 9 then A to Z) for when multiple files
Year
are saved at the same time (second)
Month
Day
Hour
Minute
Second
A sequence number is appended to the date and time when multiple files are saved at the same time (second).
The number starts at 0 and is incremented by one each time a file is added. The number 9 is followed by letters
of the alphabet.
OFF
Disables the auto naming feature. The name that you specify using the File Name setting is used. If there is a
file with the same name in the save destination folder, you cannot save the data.
Save Destination Folder for Storage Caused by User-Defined Events
In the drive specified in the Store Set menu, a folder is automatically created with the date (year, month, and
day) as its name, and data is saved to files in that folder whose names are specified by the auto naming feature.
If the number of files in the save destination folder exceeds 1000, a new folder is automatically created with the
date and an incremented sequence number (000 to 999) as its name, and the data continues to be saved in the
new folder.
File Name (File Name)
You can set the common file name that is used when the auto naming feature is turned off or when the auto
naming feature is set to Numbering. The maximum number of characters that you can use for file names and
folder names is 32 characters. The following restrictions apply.
• The following types of characters can be used: 0 to 9, A to Z, a to z, _, –, =, (, ), {, }, [, ], #, $, %, &, ~, !, `,and @.
@ cannot be entered consecutively.
• The following character strings cannot be used due to MS-DOS limitations.
AUX, CON, PRN, NUL, CLOCK, LPT1, LPT2, LPT3, LPT4, LPT5, LPT6, LPT7, LPT8, LPT9, COM1, COM2,
COM3, COM4, COM5, COM6, COM7, COM8, and COM9
• Make sure that the full file path (absolute path from the root directory) is less than or equal to 255 characters
in length. If it exceeds 255 characters, an error occurs when you perform a file operation (such as save, copy,
rename, or create folder). When an operation is being performed on a folder, the full path is up to the name of
the folder. When an operation is being performed on a file, the full path is up to the name of the file.
The following additional restrictions apply when you use the file name auto naming feature.
• If you set auto naming to Numbering, a file name will consist of the characters that you entered for the file
name and a four-character sequence number.
• If you set auto naming to Date (date and time), the characters that you entered for the file name will not be
used. File names will only consist of the date information.
18-4
IM WT1801-01EN
18 Saving and Loading Data
Comment (Comment)
You can add a comment that consists of up to 30 characters when saving files. You do not have to enter a
comment. In the comment, you can include spaces and all characters that are displayed on the keyboard. The
comment appears in the bottom of the screen.
Settings That Are Shared with Those of Other Menus
The following settings are shared by the menus for saving the custom display configuration, storing data, saving
and loading data, and saving screen images.
• File list display and save destination settings (File List)
• Automatic file naming settings (Auto Naming)
• File name (File Name)
The comment settings (Comment) are shared by the menus for storing data, saving and loading data, saving
screen images, and the menus for printing screen images and numeric data.
Saving (Save Exec)
Saves the data to the specified save destination with the specified file name.
• It can take anywhere from a few seconds to a few tens of seconds for the WT1800 to save the data,
depending on the number of waveforms being saved, the data update interval, and the transfer speed to the
save destination medium. It will take longer for the WT1800 to save the data when there many waveforms are
saved or the data update interval is long.
• Measurement stops while the WT1800 is saving data. After the WT1800 finishes saving or saving is
cancelled, measurement resumes.
• To save data when the data update interval is 20 s, enable the hold feature, perform a single-shot
measurement, and then save the data after the data update for the single-shot measurement has completed.
Because the header files saved by the WT1800 use a format that is common to YOKOGAWA measurement
devices, they contain some data that is not used by the WT1800.
Loading Setup Data (Load Setup)
On the file list, specify a file to load setup data from. The extension is .SET. For information about how to
configure the file list display and how to operate files and folders, see “File Operations (Utility).”
Click here.
Loading (Load Exec)
Loads the data of the specified file.
• If you change the extension of the saved data file, by using a PC or some other device, the WT1800 will no
longer be able to load it.
• When setup information is loaded from a file, the setup data for each key is changed to match the loaded
settings, and it cannot be changed back. We recommend that you save the current settings before loading
different setup information.
• The date, time, and communication setup parameters are not saved. So even if you load setup parameters
from a file, the date, time, and communication settings will not change.
• The WT1800 cannot load setup parameters that have been saved by a product with an incompatible
firmware version.
• The WT1800 cannot load setup parameters that were saved by an instrument with a different element
configuration, different options, etc.
IM WT1801-01EN
18-5
18 Saving and Loading Data
File Operations (Utility)
You can perform file operations such as creating folders on the storage medium, deleting and copying files, and
changing file names.
Us the up and down cursor keys to select from the file list the file or folder that you want to perform an operation
on.
Storage Media Displayed in the File List
Click here.
• Up to 512 files and folders can be displayed in the file list. If there are more than a total of 512 files and
folders in a given folder, the file list for that folder will only display 512 files and folders. There is no way to
set which files and folders are displayed.
• When you turn off the WT1800 power, the contents of the internal RAM disk are lost. Save the contents of
the RAM disk to a USB memory device or network drive before you turn off the WT1800.
Sorting the File List (Sort To)
You can sort the file list by file name, size, or date and time.
Display Format
Select whether to display a list of files or to display thumbnails.
Selecting the Type of File to List (File Filter)
You can limit the type of files that appear in the list by selecting an extension.
Changing the Storage Medium (Change Drive)
You can select the storage medium that you want to access. The WT1800 displays the storage media as follows:
• RAM-0: The internal RAM disk of the WT1800
• USB-0: The first USB memory device connected to a WT1800 USB port
• USB-1: The second USB memory device connected to a WT1800 USB port
• Network: A storage device on the network
Deleting Files and Folders (Delete)
You can delete the selected files and folders.
Renaming Files and Folders (Rename)
You can rename a selected file or folder.
Making Folders (Make Dir)
Make a folder. You can use the same characters in folder names that you can in file names.
Copying and Moving Files and Folders (Copy and Move)
You can copy or move the selected files and folders to other storage media or folders. You can copy or move
multiple files at the same time.
Operations (Operation)
You can select from the following operations.
• Delete: Delete files and folders.
• Rename: Rename a file or folder
• Make Dir:Make a folder
• Copy:
Copy files and folders
• Move:
Move files and folders
18-6
IM WT1801-01EN
18 Saving and Loading Data
File Selection (Set/Reset)
Select or deselect files and folders. Selecting multiple files is useful when you want to copy or delete multiple
files at the same time.
Simultaneous File Selection (All Set/All Reset)
• Selecting All Files (ALL Set)
When the cursor is on a drive or folder in the file list, select ALL Set to select all of the files and folders within
the drive or folder that the cursor is on.
• Deselecting All Files (ALL Reset)
All of the selected files and folders are deselected.
Jumping to a Specified File or Folder (Jump To)
You can make the cursor jump to a file or folder at a specified numeric position in the file list. The numeric
position at the top of the file list is 0.
Range:
0 to 999
Other Operations (More...)
You can select from the following operations.
• Sort To:
Sort the file list.
• Display Type:
Select the display format (list or thumbnail).
• Filter:
Select the type of file to list.
• Change Drive:
Change the storage medium.
Executing an Operation
Execute the operation that you specified for the Operation setting.
IM WT1801-01EN
18-7
19 Saving Screen Images
You can save screen image data to files in BMP, PNG, and JPEG formats.
Conditions for Saving Screen Image Data (IMAGE SAVE MENU)
File List Display and Save Destination Settings (File List)
On the file list, specify the save destination. For information about how to configure the file list display and how
to operate files and folders, see “File Operations (Utility).”
Click here.
When you turn off the WT1800 power, the contents of the internal RAM disk are lost. Save the contents of the
RAM disk to a USB memory device or network drive before you turn off the WT1800.
Format of Screen Image Data (Format)
You can select the format to save to from the options listed below.
• BMP: The extension is .BMP. The file size is approximately 100 KB for black and white mode and
approximately 1.5 MB for color mode.
• PNG: The extension is .PNG. The file size is approximately 25 KB for black and white mode and
approximately 100 KB for color mode.
• JPEG: The extension is .JPG. The file size is approximately 200 KB for color mode.
The file sizes listed here are for reference. Actual file sizes will vary depending on the image that is saved.
Screen Image Colors (Color)
You can select the color format to save to from the options below.
• OFF:
Data is saved in black and white.
• Color:
Data is saved in 65536 colors.
• Reverse: Data is saved in 65536 colors. The image background is set to white.
• Gray:
Data is saved in 16 grayscale levels.
Automatic File Naming (Auto Naming)
This is the same as the auto naming feature for saving and loading data.
Click here.
File Name (File Name)
This is the same as the file name setting for saving and loading data.
Click here.
Comment Displayed at the Bottom of the Screen (Comment)
This is the same as the comment setting for saving and loading data.
Click here.
Saving a Screen Image (IMAGE SAVE)
Save the screen image to a file.
IM WT1801-01EN
19-1
20 Printing Screen Images and Numeric Data
(Option)
You can use the built-in printer to print screen images and numeric data lists. You can also add comments to
screen images.
If you use automatic printing, screen images and numeric data lists are printed automatically at the specified
print interval. Also, you can set scheduled automatic printing start and stop times to print at a specific time.
Printing Conditions (PRINT MENU)
You can configure the following printing conditions.
• Output format (Format)
• Automatic printing execution (Auto Print ON)
• Automatic printing (Auto Print Settings)
• Comment (Comment)
• Paper feed (Paper Feed)
Output Format (Format)
You can select the data format to print from the options listed below.
• Screen: Screen image data
• List:
Numeric list data
Printed Items
If you set the output format to numeric data list (List), the printed items vary as indicated below depending on the
display that is shown.
• When numeric values are displayed in the 4-, 8-, or 16-value display or the matrix display
All the measurement functions on the page that is displayed when printing starts are printed in the order that
they are displayed.
• When numeric values are displayed in the single or dual harmonics list
In addition to the data described above, the data of harmonics that are not displayed on the screen is printed
up to the maximum measurable order (Max Order).
• When numeric values are displayed in the All Items or Custom display
Printing cannot be performed. If you attempt to print the data, an error message is displayed.
• In non-numeric displays (waveform display, trend display, etc.)
The WT1800 prints data according to the numeric display settings. For example, when the waveform
display is shown, if the 16-value display would appear when you pressed NUMERIC, then the data for the
measurement functions on the page of the 16-value display that would appear is printed.
• For items with no numeric data, “-------” (no data) is printed.
• If integration is not being performed and thus there is no integrated value, “-------” (no data) is printed. “-------”
(no data) is also printed for the integration time.
• The maximum harmonic order that can be printed is determined by the maximum harmonic order set in the
harmonic measurement (option) menu. For orders with no numeric data, “-------” (no data) is printed.
• Functions ΔU1 to ΔPΣ are printed according to the delta computation (option) type that you selected in the
delta computation settings.
IM WT1801-01EN
20-1
20 Printing Screen Images and Numeric Data (Option)
Automatic Printing Execution (Auto Print ON)
Enable automatic printing. When you enable automatic printing, the timing at which printing occurs and at which
the PRINT key illuminates varied depending on the print mode. For details, see “Print Timing for Different Print
Modes.”
Click here.
Limitations on Changing the Settings during Automatic Printing
While automatic printing is enabled, there are some setting that you cannot change and functions that you
cannot execute. For details, see appendix 9 in the getting started guide, IM WT1801-03EN.
If you perform the following operations while automatic printing is enabled, automatic printing will not be
performed.
• Save data or settings or access a storage medium in some other way
• Execute an FTP server command
• Manually start printing or start printing using communication commands
Automatic Printing (Auto Print Settings)
Print Mode (Print Mode)
You can specify the method for starting, stopping, and executing printing from the options below.
• Interval: Interval Print Mode
Printing starts when you enable automatic printing. Data is printed at each print interval.
• Real Time: Real-Time Print Mode
Printing starts and stops in synch with the scheduled printing start and stop times. Data is printed at each print
interval.
• Integ Sync: Integration Synchronization Print Mode
Printing starts and stops in synch with the starting and stopping of integration. Data is printed at each print
interval.
• Event:
Event Synchronization Print Mode
When you enable automatic printing, printing is executed when the measurement data is updated and a userdefined event occurs. Printing is executed at the data update interval for as long as the event continues.
However, if the time it takes to print is longer than the data update interval, after printing stops, it starts again
at the next data update.
Print Count (Print Count)
This setting is valid when Print Mode is set to Interval, Real Time, or Event.
You can set the print count within the following range.
Infinite, or 1 to 9999
Print Interval (Print Interval)
This setting is valid when Print Mode is set to Interval, Real Time, or Integ Sync.
You can set print interval hour, minute, and second within the following range.
00:00:10 to 99:59:59
When the print interval is not an integer multiple of the data update interval, the print operation behaves in the
same manner described in “Storage Operation When the Storage Interval Is Not an Integer Multiple of the Data
Update Interval.”
Click here.
20-2
IM WT1801-01EN
20 Printing Screen Images and Numeric Data (Option)
• If you specify a number of measurement functions as items to be printed, it may take a long time to print
the data. Set the print interval to a time that is longer than the time required to print the data.
• If you touch the keys or execute communication commands during printing, printing may slow down.
Scheduled Start and Stop Times (Real Time Control)
You can configure these settings when Print Mode is set to Real Time. You can set the year, month, day, hour,
minute, and second of the print start and stop times. Be sure to set the scheduled printing stop time to a time
after the printing start time.
You can set the values within the following ranges.
• Year:
Any four-digit Gregorian calendar value
• Hour:Minute:Second:
00:00:00 to 23:59:59
• Now:
The scheduled printing start time is set to the current time.
• Copy:
The scheduled printing start time is copied into the scheduled printing stop time.
• You can set the day for the scheduled start or stop time in February to a value as high as the 31st day. If
you do so, an error message will appear when you enable automatic printing. Reset the scheduled start
and stop times.
• The WT1800 recognizes leap years when it executes automatic printing.
Trigger Event (Trigger Event)
You can configure this setting when Print Mode is set to Event. You can select an event from Event1 to Event8.
Printing is executed whenever the user-defined event specified here occurs.
Printing of the Data at Print Start (Print At Start)
This setting is valid when Print Mode is set to Interval, Real Time, or Integ Sync.
Select whether to print the data at print start.
Comment (Comment)
This is the same as the comment setting for saving and loading data.
Click here.
Paper Feed (Paper Feed)
Each time you press Paper Feed, the paper roll is fed through by approximately 3 cm.
IM WT1801-01EN
20-3
20 Printing Screen Images and Numeric Data (Option)
Print Timing for Different Print Modes
The timings at which automatic printing can be executed are indicated below.
Interval Print Mode
When the scheduled start time is before Auto Print ON
Auto Print
OFF
Auto Print
ON
PRINT key
off
PRINT key
on
Tp
Time
Printing
Tp
Tp
Tp
*
Tp: Print interval
*
Data is printed if Print at Start is set to ON.
Real-Time Print Mode
When the scheduled start time is before Auto Print ON
Start
time
Auto Print OFF
or the ending time
Auto Print
ON
PRINT key
off
PRINT key
on
Tp
Time
Printing
Tp
Tp
Tp
*
Tp: Print interval
*
Data is printed if Print at Start is set to ON.
When the scheduled start time is after Auto Print ON
Auto Print
ON
PRINT key
blinking
Time
Printing
PRINT key
off
PRINT key
on
Tp
Tp
Tp
Tp
*
Tp: Print interval
*
20-4
Auto Print OFF
or the ending time
Start
time
Data is printed if Print at Start is set to ON.
IM WT1801-01EN
20 Printing Screen Images and Numeric Data (Option)
Integration Synchronization Print Mode
Printing is executed in sync with the integration start time.
When integration starts before Auto Print ON
Auto Print
Forced
integration stop OFF
Auto Print
ON
Integration
start
PRINT key
blinking
PRINT key
on
Tp
Time
Printing
Tp
Tp
PRINT key
off
Tp
*
Tp: Print interval
*
Data is printed if Print at Start is set to ON.
When integration starts after Auto Print ON
Auto Print
ON
Auto Print
Forced
integration stop OFF
Integration
start
PRINT key
blinking
Tp
Time
Printing
PRINT key
blinking
PRINT key
on
PRINT key
off
Tp
*
Tp: Print interval
*
Data is printed if Print at Start is set to ON.
Integration Timer and Print Interval in Continuous Integration Mode and Real-Time Continuous
Integration Mode
Printing is executed whenever the integration timer time elapses.
Auto Print
Integration time up Forced
(integration restart) integration stop OFF
Integration
start
PRINT key
blinking
PRINT key
on
Time
Printing
Tp
Tp
Tp
PRINT key
off
Tp
*
Tp: Print interval
*
Data is printed if Print at Start is set to ON.
If integration stops for one of the following reasons, printing is executed, and Auto Print is automatically set to
OFF.
• The integration timer time elapses:
TimeUp
• The scheduled stop time is reached:
Stop (in orange text)
IM WT1801-01EN
20-5
20 Printing Screen Images and Numeric Data (Option)
Event Synchronization Print Mode
Printing is executed whenever a user-defined event occurs.
When the time it takes to print is shorter than the data update interval
Auto Print
ON
PRINT key
on
Event
T
occurrence
Td
T
Td
F
Auto Print
OFF
PRINT key
off
Td
T
Tpe
Time
Printing
Td
T
Tpe
Td
F
Td
T
Tpe
Td
T
Td
Tpe
T: Event occurrence
F: No event occurrence
Td: Data update interval
Tpe: Time it takes to print
When the time it takes to print is longer than the data update interval
Auto Print
ON
PRINT key
on
Event
T
occurrence
Td
T
Time
Printing
Td
Tpe
F
Auto Print
OFF
PRINT key
off
Td
T
Td
T
Td
F
Tpe
Td
T
Td
T
Td
Tpe
T: Event occurrence
F: No event occurrence
Td: Data update interval
Tpe: Time it takes to print
Printing (PRINT)
Prints the screen image data or numeric data list.
Using an External Signal to Control Printing (Option)
On models with the 20-channel D/A output option, you can use the remote control feature to print data. For
details about the remote control feature, see appendix 4.6 in the getting started guide, IM WT1801-03EN.
20-6
IM WT1801-01EN
21 Ethernet Communication (Network)
You can configure TCP/IP parameters and use the optional Ethernet interface to perform the following tasks.
TCP/IP
TCP/IP settings for connecting to an Ethernet network.
Set the IP address, subnet mask, and default gateway.
Click here.
FTP Server (FTP Server)
You can connect the WT1800 as an FTP server to a network.
You can connect to the WT1800 from a PC on the same network and retrieve setup data, numeric data,
waveform display data, and screen image data.
Click here.
Network Drive (Net Drive)
You can save the WT1800’s setup data, numeric data, waveform display data, and screen image data to a
network drive. You can also load the setup data from a network drive into the WT1800.
Click here.
SNTP
The WT1800 clock can be set using SNTP. When the WT1800 is turned on, the date and time are set
automatically.
Click here.
To connect a PC to the WT1800, use a hub or router, and connect to a network. Do not connect a PC directly
to the WT1800.
IM WT1801-01EN
21-1
21 Ethernet Communication (Network)
TCP/IP (TCP/IP)
Configure the settings that the WT1800 needs to connect to a network.
DHCP
DHCP is a protocol that temporarily allocates settings that a PC needs to connect to the Internet.
To connect to a network that has a DHCP server, turn the DHCP setting on. When DHCP is turned on, the IP
address can be automatically obtained when the WT1800 is connected to a network. (You do not have to set it
manually.)
When DHCP is turned off, you must set the appropriate IP address, subnet mask, and default gateway for the
network.
DNS
DNS is a system used to associate Internet host names and domain names with IP addresses. Given AAA.
BBBBB.com, AAA is the host name and BBBBB.com is the domain name. You can use host names and domain
names to access the network instead of using IP addresses, which are just numbers. The WT1800 allows you to
specify the host by name, instead of by IP address. Set the domain name and the DNS server address (0.0.0.0
by default). For details, consult your network administrator.
DNS Servers (DNS Server1/DNS Server2)
You can specify up to two DNS server addresses: primary and secondary. If querying fails with the primary DNS
server, the secondary DNS server is automatically used to find the mapping of the host name and domain name
to the IP address.
Domain Suffixes (Domain Suffix1/Domain Suffix2)
The domain suffix is a piece of information that is automatically added when a query is made to a DNS server
using only a portion of the domain name. For example, if BBBBB.co.jp is registered as a domain suffix and a
query is made using “AAA,” the name “AAA.BBBBB.co.jp” is searched.
You can specify up to two domain suffixes: Domain Suffix1 and Domain Suffix 2.
You can use up to 127 characters. The characters that you can use are 0 to 9, A to Z, a to z, and hyphens.
TCP/IP settings are applied when you press Bind and then SET or when you turn on the WT1800 the next time.
21-2
IM WT1801-01EN
21 Ethernet Communication (Network)
FTP Server (FTP Server)
You can connect the WT1800 as an FTP server to a network.
Set the user name and password that will be used by devices on the network to access the WT1800. Also, set
the access timeout value.
User Name (User Name)
Set the user name that will be used to access the WT1800 from a PC. If you set the user name to “anonymous,”
you can connect to the WT1800 without entering a password.
• Number of characters:
Up to 32
• Usable characters:All ASCII characters that are displayed on the keyboard
Password (Password)
Set the password that will be used to access the WT1800 from a PC.
• Number of characters:
Up to 32
• Usable characters:All ASCII characters that are displayed on the keyboard
Timeout (Time Out)
If an FTP connection cannot be established between the WT1800 and the PC within the amount of time specified
here, the WT1800 aborts the connection process.
You can set the timeout time to a value between 1 and 3600.
To apply the settings that you specified, press Entry.
FTP Server Overview
When the WT1800 is connected to the network as an FTP server, the following features become available.
FTP Server Feature
From a PC, you can view a list of files that are stored in the WT1800 storage media (the internal RAM disk and
the storage media that are connected to the WT1800) and retrieve files.
IM WT1801-01EN
21-3
21 Ethernet Communication (Network)
Network Drive (Net Drive)
You can save the WT1800’s setup data, numeric data, waveform display data, and screen image data to a
network drive. You can also load the setup data from a network drive into the WT1800.
FTP Server (FTP Server)
Specify the IP address of an FTP server on the network. You can save numeric data, waveform display data, and
screen image data to the server and load setup data from it. In a network with a DNS server, you can specify the
host name and domain name instead of the IP address.
Login Name (Login Name)
Specify the login name.
• Number of characters:
Up to 32
• Usable characters:All ASCII characters that are displayed on the keyboard
Password (Password)
Specify the password that corresponds to the login name.
• Number of characters:
Up to 32
• Usable characters:All ASCII characters that are displayed on the keyboard
Passive Mode (Passive)
Turn passive FTP on or off.
In passive mode, the FTP client sets the port number for data transfer. Enable passive mode when you have set
an external FTP server as a network drive or when you are accessing an FTP server through a firewall.
Timeout (Time Out)
If the WT1800 cannot transfer files for a certain amount of time, it disconnects from the FTP server.
You can set the timeout time to a value between 1 and 3600.
Connecting to the Network Drive(Connect/Disconnect)
When you press Connect, the WT1800 connects to the specified network drive. When you press Disconnect, the
network drive is disconnected.
21-4
IM WT1801-01EN
21 Ethernet Communication (Network)
SNTP (SNTP)
The WT1800 clock can be set using Simple Network Time Protocol (SNTP). When the WT1800 is turned on, the
date and time are set automatically.
SNTP Server (SNTP Server)
Specify the IP address of the SNTP server that the WT1800 will use. In a network with a DNS server, you can
specify the host name and domain name instead of the IP address.
Timeout (Time Out)
If the WT1800 cannot connect to the SNTP server for a certain amount of time, it aborts the operation.
You can set the timeout time to a value between 1 and 60.
Executing Time Adjustment (Adjust)
The WT1800 clock is synchronized to the SNTP server clock.
Automatic Adjustment (Adjust at Power ON)
You can configure the WT1800 so that its clock is automatically synchronized to the SNTP server clock when the
WT1800 is turned on when it is connected to the network.
Setting the Time Difference from Greenwich Mean Time (Time Difference From GMT)
This is the same as the “Setting the Time Difference from Greenwich Mean Time (Time Difference From GMT)”
setting in the date and time settings.
Click here.
The Time Difference From GMT setting is shared with the same setting found in the SNTP settings in the date
and time settings (Date/Time). If you change this setting in the Ethernet communication (Network) settings,
the Time Difference From GMT in the date and time settings (Date/Time) also changes.
IM WT1801-01EN
21-5
22 Utility
Utility (UTILITY)
You can specify the following settings.
Overview (System Overview)
You can view the WT1800 system and setup information.
Click here.
Initializing the Settings (Initialize Settings)
You can reset the WT1800 settings to their factory default values.
Click here.
Remote Control (Remote Control)
You can select the method for connecting a PC to the WT1800 to control it.
Click here.
System Configuration (System Config)
You can set the date and time, time synchronization, the menu and message languages, the LCD intensity,
whether the backlight is on or off, the USB keyboard language, and USB communication, and you can format
storage media.
Click here.
Ethernet Communication (Network)
You can configure TCP/IP, FTP server, network drive, and SNTP settings.
Click here.
D/A Output (D/A Output Items; option)
Configure D/A output.
Click here.
Self-Test (Selftest)
You can test the keyboard and memory operations.
Click here.
IM WT1801-01EN
22-1
22 Utility
Overview (System Overview)
You can display the following information about the WT1800.
Item
Model
Suffix
No.
Version
Element Configuration
Options
Link Date
Product ID
Description
The model number
The suffix code
The instrument number
The firmware version
The input element type
The options
The firmware date
A unique device ID that is assigned to each unit
(This number is necessary for the purchase of
additional options.)
Firmware Version and New Features
This manual covers firmware versions 2.01 or later of the WT1800. The following table contains new features
that are available for each firmware version. If you are using an older version, you will not be able to use all the
features described in this manual. To view the firmware version, press UTILITY and then the System Overview
soft key and check Version on the System Overview screen that is displayed.
Version
2.01 or later
Suffix Code
/HS
New Features
High Speed Data Capturing features
Chinese and German have been added
to the menu language and message
language.
Initializing the Settings (Initialize Settings)
You can reset the WT1800 settings to their factory default values. This feature is useful when you want to cancel
all of the settings that you have entered or when you want to redo measurement from scratch.
Only initialize the WT1800 if you are sure that it is okay for all of the settings to return to their initial values.
You cannot undo an initialization. We recommend that you save the setup parameters before initializing the
WT1800.
Items That Cannot Be Reset
The following settings cannot be reset.
Date and time settings, communication settings, the menu language setting, the message language setting, and
environment settings
To Reset All Settings to Their Default Values
While holding down RESET, turn the power switch on. All settings except the date and time settings (display
on/off setting will be reset) will be reset to their factory default values.
22-2
IM WT1801-01EN
22 Utility
Remote Control (Remote Control)
Communication interface for controlling the WT1800 from a PC. GP-IB, USB, and Network are the available
communication interfaces.
For details, see the communication interface user’s manual, IM WT1801-17EN.
• Only use one communication interface: GP-IB, USB, or Network. If you send commands simultaneously
from more than one communication interface, the WT1800 will not execute the commands properly.
• When the WT1800 is in remote mode and is communicating with a PC, “REMOTE” appears in the center
of the WT1800 screen. All keys except LOCAL are disabled in Remote mode.
GP-IB
Connects the WT1800 to a PC using GP-IB.
Address (Address)
• You can select a value between 0 and 30.
• Each device that is connected by GP-IB has its own unique address in the GP-IB system. This address
is used to distinguish one device from other devices. Therefore, you must assign a unique address to the
WT1800 when connecting it to a PC or other device.
When the controller is communicating with the WT1800 or with other devices through GP-IB, do not change
the address.
Notes about Connections
• Several cables can be used to connect multiple devices. However, no more than 15 devices, including the
controller, can be connected on a single bus.
• When connecting multiple devices, you must assign a unique address to each device.
• Use cables that are 2 m or shorter in length to connect devices.
• Keep the total length of the cables under 20 m.
• When devices are communicating, have at least two-thirds of the devices on the bus turned on.
• To connect multiple devices, use a star or daisy-chain configuration. Loop and parallel configurations are
not allowed.
USB
Connects the WT1800 to a PC using USB.
To remotely control the WT1800 using communication commands through the USB port, select USBTMC, and
then carry out the following procedure.
• Install the YOKOGAWA USB TMC (Test and Measurement Class) driver on your PC. For information about
how to obtain the YOKOGAWA USB TMC driver, contact your nearest YOKOGAWA dealer. You can also
access the YOKOGAWA USB driver download webpage and download the driver (http://tmi.yokogawa.com/
service-support/downloads/).
• Do not use USB TMC drivers (or software) supplied by other companies.
IM WT1801-01EN
22-3
22 Utility
Network
Connects the WT1800 to a PC using Ethernet.
IP Address (IP Address)
Displays the TCP/IP setting that you specified in the Ethernet communication settings.
Click here.
Timeout (Time Out)
If a connection cannot be established between the WT1800 and the PC within the amount of time specified here,
the WT1800 aborts the connection process.
You can set the timeout time to infinity or a value between 1 and 3600.
You must set TCP/IP parameters to connect the WT1800 to an Ethernet network.
Click here.
Notes about Connections
• To connect the WT1800 to a PC, be sure to use straight cables through a hub. Correct operation is not
guaranteed for a one-to-one connection using a crossover cable.
• Use one of the following types of network cables that support the data rate of your network.
UTP (Unshielded Twisted-Pair) cable
STP (Shielded Twisted-Pair) cable
Clearing Remote Mode (LOCAL)
To clear remote mode, press LOCAL.
Click here.
22-4
IM WT1801-01EN
22 Utility
System Configuration (System Config)
You can specify the following settings.
• WT1800 date and time
• Language
• LCD adjustment
• USB keyboard language
• Environment settings (Preference)
• Crest factor
Date and Time Settings (Date/Time)
The WT1800 date and time.
Turning the Display On and Off (Display)
Set whether to show the date and time on the WT1800.
Method for Setting the Date and Time (Type)
You can set the method for setting the date and time to one of the following options.
• Manual: Set the date or time manually.
• SNTP: Use an SNTP server to set the time (valid when Ethernet communication is being used).
Date and Time (Date/Time)
This setting is valid when the method for setting the date and time is set to Manual.
Set the date and time.
• Setting the date
The format for setting the date is YYYY/MM/DD (year/month/day). Set the year using the last two digits of the
year according to the Gregorian calendar.
• Setting the time
The format for setting the time is HH:MM:SS (hour:minute:second). The hour can be set to a value from 0 to
23.
Setting the Time Difference from Greenwich Mean Time (Time Difference From GMT)
This setting appears when the method for setting the date and time is set to SNTP.
Set the time difference between the region where you are using the WT1800 and Greenwich Mean Time to a
value within the following range.
-12 hours 00 minutes to 13 hours 00 minutes
For example, Japan standard time is ahead of GMT by 9 hours. In this case, set Hour to 9 and Minute to 00.
Checking the Standard Time
Using one of the methods below, check the standard time of the region where you are using the instrument.
• Check the Date, Time, Language, Regional Options on your PC.
• Check the standard time at the URL on the right.http://www.worldtimeserver.com/
• The WT1800 does not support Daylight Savings Time. To set the Daylight Savings Time, reset the time
difference from Greenwich Mean Time.
• Date and time settings are backed up using the internal lithium battery. They are retained even if the power
is turned off.
• The WT1800 has leap-year information.
• The Time Difference From GMT setting is shared with the same setting found in the SNTP settings in the
Ethernet communication (Network) settings. If you change this setting in the date and time settings, the
Time Difference From GMT in the Ethernet communication (Network) settings also changes.
IM WT1801-01EN
22-5
22 Utility
Language (Language)
Set the language that is used in the setup menus and messages.
Menu Language (Menu Language)
You can choose to display menus using one of the following languages.
• English
• Japanese
• Chinese
• German
Message Language (Message Language)
Error messages appear when errors occur. You can choose to display these messages and the help using one
of the following languages. The error codes that accompany error messages are the same for all languages. For
details about error messages, see appendix 6 in the getting started guide, IM WT1801-03EN.
• English
• Japanese
• Chinese
• German
• Even if you set the menu or message language to a language other than English, some terms will be
displayed in English.
• You can specify different menu and message languages. However, you cannot set Japanese and Chinese
to the menu language and the message language at the same time. For example, if you specify Japanese
as the menu language and Chinese as the message language, the menu language will also be set to
Chinese.
Adjusting the LCD (LCD)
You can turn off the LCD and adjust its brightness.
Turning Off the LCD (LCD Turn OFF)
You can turn off the LCD. When the LCD is off, you can turn it back on by pressing a key.
Automatically Turning Off the LCD (Auto OFF)
The LCD turns off automatically when there are no key operations for a given time period. The LCD turns back
on when you press a key.
Auto Off Time (Auto OFF Time)
You can set the time after which the LCD turns off automatically to a value within the following range.
1 min to 60 min
Adjusting the Brightness (Brightness)
You can set the brightness to a value from 1 (darkest) to 10 (brightest). You can prolong the LCD service life by
decreasing the LCD brightness or by turning off the LCD when you do not need to view it.
Display Color (Color Settings)
• Graph Colors (Graph Color)
You can choose the colors that are used to display the data in the waveform, trend, and vector displays from
the following options.
• Default (Default)
CH1 to CH16 are displayed with different colors.
• Classic (Classic)
The color scheme is the same as that of the WT1600. Some channels from CH1 to CH16 share the same
color.
22-6
IM WT1801-01EN
22 Utility
The display data that corresponds to CH1 to CH16 in the waveform, trend, and vector displays is indicated
below.
CH1
CH2
CH3
CH4
CH5
CH6
CH7
CH8
CH9
CH10
CH11
CH12
CH13
CH14
CH15
CH16
Waveform Display
U1
I1
U2
I2
U3
I3
U4
I4
U5
I5
U6
I6
Speed/Aux1
Torque/Aux2
–––
–––
Trend Display
T1
T2
T3
T4
T5
T6
T7
T8
T9
T10
T11
T12
T13
T14
T15
T16
Vector Display
U1
I1
U2
I2
U3
I3
U4
I4
U5
I5
U6
I6
–––
–––
–––
–––
• Grid Intensity (Grid Intensity)
You can set the grid intensity to a value from 1 (darkest) to 8 (brightest).
• Menu Background Color (Base Color)
You can set the background color of the menu to Blue or Gray.
USB Keyboard Language (USB Keyboard)
Select the USB keyboard language to use when entering file names, comments, etc. You can use the following
keyboards conforming to USB Human Interface Devices (HID) Class Ver. 1.1.
• English:
104 keyboard
• Japanese: 109 Keyboard
For details on how the WT1800 keys are mapped to the keys on a USB keyboard, see appendix 7 in the getting
started guide, IM WT1801-03EN.
Environment Settings (Preference)
Display Digits (Resolution)
You can choose to display four digits or five digits of the numeric data. The number of displayed digits for
integration measurement functions is fixed at six.
Frequency Display When the Frequency Measurement Is Less Than Lower Limit (Freq Display at
Frequency Low)
When the frequency of the input signal is lower than the frequency that the WT1800 can measure, you can
choose to display the frequency as “0” or “Error.”
Motor Display When the Pulse Frequency Measurement Is Less Than the Lower Limit (Motor Display at
Pulse Freq Low)
When the pulse frequency of the torque or speed input signal is lower than the frequency that the WT1800 can
measure, you can choose to display the values of motor evaluation measurement functions as “0” or “Error.”
Separator and Decimal Point When Data Is Saved in ASCII Format (.csv; Decimal Point for CSV File)
When you save data in ASCII format (.csv), you can choose what type of decimal point to use and how to
separate the data.
• Period (Period): The decimal point is a period, and the separator is a comma.
• Comma (Comma):The decimal point is a comma, and the separator is a semicolon.
Menu Font Size (Menu Font Size)
You can set the menu font size to Small or Large.
Crest Factor (Crest Factor)
Click here.
IM WT1801-01EN
22-7
22 Utility
D/A Output (D/A Output Items; option)
You can generate numeric data as ±5 V FS DC voltage signals from the rear panel D/A output connector. You
can set up to 20 items (channels).
Output Items (Item)
The measurement functions that you select under Function and Element/Σ appear here.
Function (Function)
• You can select any of the measurement functions listed under “Items That This Instrument Can Measure.”
Click here.
• To output integrated values through D/A conversion, set the rated time of integrated D/A output.
Click here.
• You can also choose not to output a measurement function (None). The output for channels that have been
set to none is 0 V, because they have no corresponding numeric data.
• When the D/A output range mode is set to Fixed, the D/A output of channels whose measurement function
has been set to Z, Rs, Xs, Rp, Xp, or F1 to F20 is Fixed at 0 V. When the range mode is set to Manual, the
channels produce voltages.
Element (Element/Σ)
• You can select the element/wiring unit from the choices below. The available options vary depending on the
installed elements.
Element1, Element2, Element3, Element4, Element5, Element6, ΣA, ΣB, and ΣC
• If an element in the selected wiring unit does not exist, because there is no data, the output is 0 V. For
example, if elements are assigned to ΣA but not to ΣB, the output for the measurement function for ΣB is 0 V.
Order (Order; option)
When you select a function that has harmonic data, you can set the displayed harmonic order within the
following range.
Total (Total value) or 0 (DC) to 500
The orders that can be specified vary depending on the measurement function. For details, see “Harmonic
Measurement Function Orders.”
Click here.
The outputs of orders that exceed the maximum measurable order are 0 V. For information about the maximum
measurable harmonic order, see “Maximum Harmonic Order to Be Measured (Max Order).”
Click here.
D/A Output Range Mode (Range Mode)
You can select the D/A output range mode from the following options.
Fixed (Fixed range mode)
When a measurement function’s rated value is received, +5 V is output. For details, see “Relationship between
Output Items and the D/A Output Voltage.”
Click here.
Manual (Manual range mode)
You can set which measurement function values result in a D/A output of -5 V, and which result in a D/A output of
+5 V.
By doing so, you can enlarge or reduce (zoom) the D/A output of each channel. For example, if you are
measuring a current that fluctuates between 0.6 A and 0.8 A with a measurement range of 1 A, when the D/A
output range mode is Fixed, the D/A output voltage will fluctuate between 3.0 V and 4.0 V. When you want to
observe the fluctuations more closely, you can use the D/A zoom feature. If you set the D/A output range mode
to Manual and set the minimum value to 0.6 and the maximum value to 0.8, the WT1800 will produce –5 V when
the measured current value is 0.6 A and +5 V when the measured current value is 0.8 A.
22-8
IM WT1801-01EN
22 Utility
Fixed range mode
Measured current
D/A output
Manual range mode
(DA zoom)
D/A output
1.0 A
5.0 V
5.0 V
0.8 A
4.0 V
0.6 A
3.0 V
Time
Time
–5.0 V
Maximum (Max) and Minimum (Min) Range Values
When the range mode is Manual, you can set the maximum (Max) and minimum (Min) values within the following
range.
–9.999 T to 9.999 T
• The output is 0 V if a measurement function is not selected or if there is no numeric data.
• If a scaling factor such as a VT ratio, CT ratio, or power coefficient is applied to a voltage, current, or power
value and scaling is enabled, the WT1800 produces 100% output (5 V) when the scaled measured value is
the same as the scaled rated value (measurement range × scaling factor).
• For Σ functions, the WT1800 produces 100% output (5 V) when the measured value is equivalent to the
value that is measured when all of the elements in the group are at their rated values. When the elements
have different scaling factors, the WT1800 produces 100% output (5 V) when the scaled measured values
are the same as the scaled rated values (measurement range × scaling factor).
Relationship between Output Items and D/A Output Voltage
Frequency (the figure is simplified)
D/A output
Approx.
7.5 V
5.0 V
0.5 V
Displayed
value
100 kHz 10 MHz
1 GHz
1 kHz
0.1 Hz 10 Hz
100 Hz
10 kHz 1 MHz
100 MHz1.5 GHz
1 Hz
User-Defined Events
• When the event is occurring (True): +5 V
• When the event is not occurring (False): 0 V
IM WT1801-01EN
22-9
22 Utility
Integrated Values
D/A output
Approx. 7.0 V
5.0 V
At 140% of the rated input
At the rated input
0
t0
Integration time
t0: The rated time of integrated D/A output in manual integration mode.
The timer time in normal or continuous integration mode.
Other Items
Displayed
value
140%
100%
0%
–100%
–140%
Output
D/A output
Approx. 7.0 V
Approx. 7.5 V
5.0 V
Approx. 7.0 V
0V
5.0 V
–5.0 V
Approx. –7.0 V
−140 −100
0
100 140
Displayed
value (%)
–5.0 V
Approx. –7.0 V
Approx. –7.5 V
• The outputs for λ, Φ, EaU, and EaI do not exceed ±5 V. When the display format of Φ is set to 360 degrees,
the output for Φ ranges from 0 V to +5 V. When the display format of Φ is set to 180 degrees (lagging 180°
to leading 180°), the output for Φ ranges from –5 V to +5 V. However, when an error occurs, the output is
approximately 7.5 V. Only the outputs for U–pk and I–pk are approximately –7.5 V when an error occurs.
• The outputs for η1 to η4, Uhdf, Ihdf, Phdf, Uthd, Ithd, Pthd, Uthf, Ithf, hvf, hcf, and Slip* are +5 V at 100%.
• The outputs for Utif and Itif are + 5 V at 100.
• The output for an analog torque signal is +5 V when the torque reaches the value of the input range × the
torque scaling factor × the input signal slope (this is the rated value).1 For example, when the input range is 10 V,
if the scaling factor is set to 1 N•m of torque per 1 V of input voltage, the output is +5 V when the torque is 10
N•m.
• The output for an analog rotating speed signal is +5 V when the rotating speed reaches the value of the input
range × the revolution scaling factor × the input signal slope (this is the rated value).1 For example, when the
input range is 10 V, if the scaling factor is set to 100 rpm per 1 V of input voltage, the output is + 5 V when the
rotating speed is 1000 rpm.
• The output for a pulse rotating speed signal is –5 V when the rotating speed reaches the value specified for
Pulse Range Upper × –1 (this is the rated value), and the output is +5 V when the rotating speed reaches the
value specified for Pulse RangeUpper.1
• The output for a pulse torque signal is –5 V when the torque reaches the value specified for Pulse Range
Upper × –1 (this is the rated value), and the output is +5 V when the torque reaches the value specified for
Pulse RangeUpper.1
• The output for SyncSp is +5 V when SyncSp is at the rated value for Speed.1
• The output for Pm is +5 V when Pm reaches the motor output value obtained from the rated values for the
torque and rotating speed.1
• The output for Aux1 or Aux2 is +5 V when Aux1 or Aux2 reaches the value of the input range × the scaling
factor for Aux1 or Aux2 × the input signal slope (this is the rated value).2
1 Speed and torque waveforms are available on models with the motor evaluation option.
2 Aux1 and Aux2 waveforms are available on models with the auxiliary input option.
22-10
IM WT1801-01EN
22 Utility
Self-Test (Selftest)
You can test the keyboard and memory operations.
Test Items (Test Item)
You can perform the following tests.
Memory Test (Memory)
You can test the internal memory to determine whether it is functioning normally. If “Pass” is displayed, it is
functioning normally. If an error occurs, “Failed” appears. After the test is completed, “Test Completed” appears.
Key Test (Key Board)
• Tests whether or not the front-panel keys are operating properly. If the name of the key that you press is
displayed, the key is operating properly.
• If the indicators on the front panel turn on and off in order when you press the left and right cursor keys, they
are operating properly.
• To exit the key test, press ESC twice.
Keyboard Test (Soft Key)
This test appears when you set Test Item to Key Board. You can test whether the keyboard displayed on the
screen is functioning properly. If the characters that you type appear correctly in the keyboard’s input box, the
keyboard is functioning properly.
Executing a Test (Test Exec)
The selected self-test starts.
If an Error Occurs during a Self-Test
If an error occurs even after you perform self-tests numerous times, contact your nearest YOKOGAWA dealer.
IM WT1801-01EN
22-11
23 Other Features
You can set the following items.
• Zero-level compensation (CAL)
• NULL feature (NULL SET)
• Enabling and Disabling the NULL Feature (NULL)
• Clearing Remote Mode (LOCAL)
• Key lock (KEY LOCK)
Zero-Level Compensation (CAL)
Zero-level compensation is the process of creating a zero-input condition using the WT1800 internal circuit and
setting the level at that point to the zero level. It must be performed to meet the specifications of this instrument.
• Pressing CAL executes zero level compensation.
• The WT1800 automatically performs zero-level compensation after you change the measurement range or
input filter.
• To make accurate measurements, we recommend that you execute zero-level compensation after warming
up the instrument for at least 30 minutes. Also, the ambient temperature should be stable and within the
specified range (see chapter 6 in the getting started guide, IM WT1801-03EN).
• If the measurement range and input filter remain the same for a long period of time, the zero level may
change due to the changes in the environment surrounding the WT1800. If this happens, we recommend
that you execute zero-level compensation.
• There is a feature that automatically performs zero-level compensation during integration (integration auto
calibration).
Click here.
NULL Feature (NULL SET)
You can use the NULL feature to subtract the DC offset while a measurement cable or external sensor is
connected.
Items to Configure NULL Settings for (Target Element)
All
Each time you press NULL, you can enable or disable the NULL feature for all the following input signals.
• U and I signals of each element
• Speed and Torque signals (on models with the motor evaluation option)
• Aux1 and Aux2 (on models with the auxiliary input option)
Select
Press NULL to select the input signals that you want to enable, hold, or disable the NULL feature for.
Voltage (U)
• All: You can enable or disable the NULL feature for the voltage signals of all elements at the same time.
• U1 to 6: You can enable or disable the NULL feature for the voltage signals of each element separately.
Current (I)
• All: You can enable or disable the NULL feature for the current signals of all elements at the same time.
• I1 to 6: You can enable or disable the NULL feature for the current signals of each element separately.
Motor (Motor)
• All: You can enable or disable the NULL feature for the Speed and Torque signals at the same time.
• Speed, Torque: You can enable or disable the NULL feature for the Speed and Torque signals separately.
IM WT1801-01EN
23-1
23 Other Features
Auxiliary Input (Aux)
• All: You can enable or disable the NULL feature for the Aux1 and Aux2 signals at the same time.
• Aux1, Aux2: You can enable or disable the NULL feature for the Aux1 and Aux2 signals separately.
NULL Status (Status)
Enable or disable the NULL feature for each input signal
• ON:
When you press NULL, the WT1800 sets or updates the NULL value. Afterwards, the NULL value is
used to correct the measurement function values.
The function of this key varies depending on whether the NULL value has yet to be set or has
• Hold:
already been set.
• When the NULL value has yet to be set
When you press NULL and enable the NULL feature, the WT1800 sets the NULL value. Afterwards, the
NULL value is used to correct the measurement function values. If you press NULL again, the NULL
feature is disabled, but the WT1800 saves the specified NULL value.
• When the NULL value has already been set
Even if you press NULL and enable the NULL feature, the NULL value is not updated. The saved NULL
value discussed above is used to correct the measurement function values.
For example, if you turn on the power and then immediately enable the NULL feature, the NULL value has
not yet been set, so the value measured then is used as the NULL value. If you press NULL again afterwards,
the NULL feature is disabled. The WT1800 saves the NULL value. Even if you press NULL and enable the
NULL feature, the NULL value is not updated. The saved NULL value discussed above is used to correct the
measurement function values.
• OFF:
Even if you press NULL, the NULL feature is not enabled. Measurement function values are
produced with no NULL correction.
The held NULL value is cleared under the following circumstances.
• Operations that cause the NULL values of all inputs to be cleared
• Turning on the power (the NULL values are not backed up when you turn off the power)
• Initializing the settings
• Loading a setup data file
• Operations that cause the NULL value of the input whose settings were changed to be cleared
• Switching between direct current input and external current sensor input
• Changing the Sense Type setting for the Speed or Torque motor evaluation input signal
NULL Values
When you enable the NULL feature, the following measurement values are used as the NULL values.
• Udc and Idc (the voltage and current simple averages)
• Speed and Torque signals (on models with the motor evaluation option)
• Aux1 and Aux2 (on models with the auxiliary input option)
Measurement Functions Affected by the NULL Feature
All measurement functions are affected by the NULL values.
• If there are no previously measured values for Udc, Idc, Speed, Torque, Aux1, or Aux2, because for
example the NULL feature has been turned on before any measurements have been made, the NULL
values are set to zero.
• For measurement functions that are computed based on an element’s voltage and current values, the
NULL values are subtracted from the sampled voltage and current values.
• For motor evaluation measurement functions and auxiliary input measurement functions, the NULL values
are subtracted from the computed numeric data.
23-2
IM WT1801-01EN
23 Other Features
Enabling and Disabling the NULL Feature (NULL)
• Enable the NULL feature. The NULL key illuminates. The NULL indicator illuminates as described below
depending on how the Target Element setting has been set.
• All:
The NULL indicator illuminates in the upper right of the screen.
• Select:The NULL indicator illuminates to the left of the element, motor or AUX inputs, which are located on
the right side of the screen.
NULL
indicator
All
Select
NULL
indicator
• If you press NULL while the NULL feature is enabled, the NULL key light and NULL indicators turn off, and the
NULL feature is disabled.
• To make accurate measurements, we recommend that you execute zero-level compensation before
enabling the NULL feature.
• The NULL feature is disabled when:
• The power is turned on.
• The settings are initialized.
• A setup data file is loaded.
• You switch between direct current input and external current sensor input.
• You change the Sense Type setting for the Speed or Torque motor evaluation input signal.
• If the NULL feature is enabled or disabled while the display is held, the NULL indicator will illuminate or
turn off, but the held data will not be affected. Also, the NULL indicator will be highlighted.
• The DC values that the NULL value is based on when the NULL feature is ON are held, but the upper limit
of the NULL value is ±10% of the range when the crest factor is set to CF3. The upper limit of the NULL
value is ±20% of the range when the crest factor is set to CF6.
• When the range is changed, the NULL value upper limit will be determined by the new range. The NULL
value upper limit will also be adjusted when the range is decreased by the auto range feature.
Clearing Remote Mode (LOCAL)
Use this key to switch from remote mode (the REMOTE indicator will illuminate) to local mode (in which front
panel key operations are valid). This key is invalid when the WT1800 is in local lockout mode.
Key Lock (KEY LOCK)
When you enable the key lock, the WT1800 behaves as described below. You can use the key lock to prevent
unintentional operations.
• All key operations are disabled except for those of the power switch and SHIFT+LOCAL (KEY LOCK).
• The key lock indicator (“LOCK”) appears in the upper right of the screen.
The key lock remains on or off even after the power is turned off.
IM WT1801-01EN
23-3
Index
Symbols
Page
Δ Measure.............................................................................
ΔMeasure Mode....................................................................
ΔMeasure Type.....................................................................
η Formula..............................................................................
Σ functions.............................................................................
16 Items.................................................................................
16-value display....................................................................
3P3W>3V3A..........................................................................
4 Items...................................................................................
4-value display......................................................................
8 Items...................................................................................
8-value display......................................................................
A
2-6
2-8
2-6
2-4
1-6
7-1
7-1
2-6
7-1
7-1
7-1
7-1
Page
advanced waveform display settings................................... 10-7
aliasing................................................................................ 10-4
all items................................................................................. 7-1
All Items display.................................................................... 7-1
ampere hours........................................................................ 9-1
amplitude............................................................................. 10-4
analog auto range.......................................................... 4-3, 5-1
analog range.................................................................. 4-3, 5-1
anti-aliasing filter................................................................... 3-4
apparent power and reactive power, equation types............. 8-8
apparent power equation....................................................... 8-8
assignment method............................................................. 10-8
attenuation constant............................................................ 2-21
Auto Cal................................................................................ 9-11
auto CSV conversion.................................................. 16-8, 17-5
auto enter correction............................................................. 4-8
automatic CSV conversion......................................... 16-8, 17-5
automatic printing................................................................ 20-2
auto naming......................................................................... 18-4
auto off................................................................................. 22-6
auto print settings................................................................ 20-2
auto range, auxiliary input..................................................... 5-1
auto range, current............................................................... 2-11
auto range, motor evaluation................................................. 4-3
auto range, voltage................................................................ 2-9
auto range for the external current sensor range................ 2-12
auxiliary input........................................................................ 5-1
aux name............................................................................... 5-1
average active power............................................................ 8-5
average count...................................................................... 2-21
averaging............................................................................. 2-20
averaging type..................................................................... 2-21
AVG..................................................................................... 2-20
B
background color.................................................................
background file....................................................................
bar.......................................................................................
bar graph display.................................................................
bar graph display range.......................................................
bar graph display scale.......................................................
bar graph display windows, number of................................
bar graph number................................................................
C
Page
22-7
7-10
12-1
12-1
12-2
12-2
12-1
12-2
Page
C1+ Position........................................................................ 15-2
IM WT1801-01EN
C1+ Trace............................................................................ 15-1
C2x Position........................................................................ 15-2
C2x Trace............................................................................ 15-1
CAL...................................................................................... 23-1
calculation...................................................................... 4-4, 5-2
capture control settings....................................................... 16-5
capture count....................................................................... 16-4
Clear Trend Exec.................................................................. 11-2
color............................................................................ 19-1, 22-6
Column No................................................................. 7-7, 16-11
Column Num.............................................................. 7-7, 16-11
column number........................................................... 7-7, 16-11
columns................................................................................. 7-7
columns, number of.................................................... 7-7, 16-11
column settings..................................................................... 7-7
comment.............................................................................. 18-5
config................................................................................... 2-16
continuous integration mode................................................. 9-8
control settings........................................................... 16-5, 17-2
corrected power..................................................................... 8-9
correction value..................................................................... 4-8
count.................................................................................... 2-21
crest factor........................................................................... 2-17
CSV convert............................................................... 16-9, 17-5
CT scaling............................................................................ 2-14
CT ratio................................................................................ 2-14
current auto range................................................................ 2-11
current mode for current integration..................................... 9-11
current range........................................................................ 2-11
cursor.................................................................................. 15-1
cursor 1............................................................................... 15-1
cursor 2............................................................................... 15-1
cursor measurement........................................................... 15-1
cursor movement, linking.................................................... 15-2
cursor movement, path of.................................................... 15-2
cursor path.......................................................................... 15-2
custom................................................................................... 7-3
custom display....................................................................... 7-3
D
Page
D/A output items.................................................................. 22-8
D/A output rated time........................................................... 9-12
D/A output............................................................................ 22-8
data, saving......................................................................... 18-1
data update interval............................................................. 2-20
date/time.............................................................................. 22-5
date and time settings......................................................... 22-5
decimal point....................................................................... 22-7
decimal point for CSV File................................................... 22-7
delta-star transformation....................................................... 2-7
Delta>Star............................................................................. 2-7
delta computation.................................................................. 2-6
delta computation mode........................................................ 2-8
delta computation type.......................................................... 2-6
dey lock............................................................................... 23-3
DHCP.................................................................................. 21-2
difference............................................................................... 2-6
differential current.................................................................. 2-6
differential voltage................................................................. 2-6
DIRECT/MEASURE............................................................ 2-14
display configuration file...................................................... 7-10
display digits........................................................................ 22-7
displayed numeric items............................................. 17-4, 18-3
Index-1
Index
display format, bar graph..................................................... 12-1
display format, numeric data.......................................... 7-1, 7-4
display format, trend............................................................. 11-2
display format, vector.......................................................... 13-2
display format, waveform.................................................... 10-2
display frame......................................................................... 7-6
display interpolation............................................................. 10-7
display item.......................................................................... 11-3
display items, bar graph...................................................... 12-2
display Items, high speed data capturing........................... 16-11
display items, vector............................................................ 13-2
display items, waveform...................................................... 10-8
display resolution................................................................... 7-4
display settings.................................................................... 10-7
distortion factor...................................................................... 3-3
DNS..................................................................................... 21-2
DNS server.......................................................................... 21-2
domain suffix....................................................................... 21-2
dual harmonics list................................................................. 7-2
E
Page
efficiency................................................................................ 2-4
electrical angle...................................................................... 4-8
electrical angle correction...................................................... 4-8
ELEMENT, measurement range of........................................ 2-8
ELEMENT, numeric data display........................................... 7-6
element independent............................................................. 2-5
element object....................................................................... 9-4
elements................................................................................ 1-6
element settings.................................................................... 3-3
ending harmonic order........................................................ 12-2
end order............................................................................. 12-2
environment settings........................................................... 22-7
Ethernet communication...................................................... 21-1
event-synchronized storage mode...................................... 17-2
event name............................................................................ 8-6
Event No................................................................................ 8-6
event synchronization print mode........................................ 20-2
exponential average............................................................ 2-21
expression...................................................................... 8-2, 8-6
external current sensor conversion ratio............................. 2-13
external current sensor range............................................. 2-12
external current sensor range display format...................... 2-14
external sync....................................................................... 16-6
EXT SENSOR..................................................................... 2-12
F
Page
falling................................................................................... 10-5
file name.............................................................................. 18-4
file operations...................................................................... 18-6
file recording state............................................................... 16-2
file save condition....................................................... 17-5, 18-3
file settings................................................................. 16-8, 17-5
font color............................................................................... 7-11
font size................................................................................ 7-11
FORM, high speed data capturing...................................... 16-4
FORM, numeric data............................................................. 7-1
FORM, trend......................................................................... 11-2
FORM, bar graph................................................................ 12-1
FORM, waveform................................................................ 10-2
FORM, vector...................................................................... 13-2
format......................................................................... 10-2, 12-1
FREQ FILTER..................................................................... 2-19
FREQ MEASURE................................................................. 8-11
frequency filter..................................................................... 2-19
frequency measurement....................................................... 8-11
frequency measurement source............................................ 4-7
Index-2
FTP server........................................................................... 21-3
FU/FI/η................................................................................... 7-5
G
Page
GP-IB................................................................................... 22-3
graticule............................................................................... 10-7
Greenwich Mean Time............................................... 21-5, 22-5
grid...................................................................................... 10-7
grid intensity........................................................................ 22-7
H
Page
harmonic measurement......................................................... 3-1
high speed data capturing................................................... 16-1
high speed data capturing state.......................................... 16-1
hold........................................................................................ 6-1
Hrm1...................................................................................... 3-3
Hrm2...................................................................................... 3-3
Hrm List Dual......................................................................... 7-2
Hrm List Single...................................................................... 7-2
HS filter................................................................................ 16-5
I
Page
I Mag................................................................................... 13-2
Independent Control.............................................................. 9-4
independent input element configuration.............................. 2-5
independent integration......................................................... 9-4
initialization.......................................................................... 22-2
Initialize Settings................................................................. 22-2
input element groups............................................................. 3-3
input info.............................................................................. 2-22
input signal name.................................................................. 5-1
input signal type.................................................................... 4-2
integrated power.................................................................... 9-1
integration, resetting.............................................................. 9-6
integration, starting................................................................ 9-5
integration, stopping.............................................................. 9-5
integration-synchronized storage mode.............................. 17-2
integration auto calibration................................................... 9-11
integration mode.................................................................... 9-7
integration synchronization print mode................................ 20-2
integration timer................................................................... 9-10
Integ Set................................................................................ 9-7
Integ Timer.......................................................................... 9-10
internal RAM disk................................................................ 18-1
interpolate............................................................................ 10-7
interval................................................................................. 17-3
interval print mode............................................................... 20-2
ITEM, high speed data capturing....................................... 16-11
ITEM, numeric data............................................................... 7-4
ITEM, trend........................................................................... 11-3
ITEM, bar graph.................................................................. 12-2
ITEM, waveform.................................................................. 10-8
ITEM, vector........................................................................ 13-2
item settings............................................................... 16-8, 17-4
J
Page
judgment condition................................................................ 8-6
K
Page
key lock............................................................................... 23-3
L
Page
language..............................................................................
LCD.....................................................................................
LCD adjustment...................................................................
level.....................................................................................
22-6
22-6
22-6
10-5
IM WT1801-01EN
Index
linear scale..................................................................... 4-3, 5-2
linear scale, motor evaluation................................................ 4-3
linear scaling, auxiliary input................................................. 5-2
line filter................................................................. 2-19, 4-4, 5-3
line filter, auxiliary input......................................................... 5-3
line filter, motor evaluation..................................................... 4-4
linkage................................................................................. 15-2
Load Bmp............................................................................ 7-10
load items............................................................................ 7-10
load setup............................................................................ 18-5
local............................................................................ 22-4, 23-3
lower scale........................................................................... 11-3
M
Page
manual CSV conversion............................................. 16-9, 17-5
manual integration mode....................................................... 9-7
manual storage mode.......................................................... 17-2
master................................................................................. 8-10
matrix..................................................................................... 7-1
matrix display........................................................................ 7-1
max hold................................................................................ 8-5
maximum capturing count................................................... 16-4
maximum harmonic to be measured..................................... 3-2
maximum storage count...................................................... 17-2
max order.............................................................................. 3-2
measured harmonic order..................................................... 3-2
measurement function........................................................... 1-6
measurement period........................................................... 2-18
menu font size..................................................................... 22-7
menu language.................................................................... 22-6
message language.............................................................. 22-6
minimum harmonic to be measured...................................... 3-2
min order............................................................................... 3-2
mode..................................................................................... 9-7
motor..................................................................................... 4-1
motor efficiency..................................................................... 4-9
motor poles............................................................................ 4-7
moving average................................................................... 2-21
N
Page
name..................................................................................... 8-1
net drive............................................................................... 21-4
network....................................................................... 21-1, 22-4
network drive.............................................................. 18-1, 21-4
normal integration mode........................................................ 9-8
normal mode (Trg)............................................................... 10-1
NULL.......................................................................... 23-1, 23-3
NULL SET........................................................................... 23-1
NULL values........................................................................ 23-2
NULL status......................................................................... 23-2
numbering........................................................................... 18-4
number of displayed items......................................... 17-4, 18-3
numeric data display............................................................. 7-1
numeric data display, turning on and off.............................. 13-2
O
Page
offset value, auxiliary input.................................................... 5-2
offset value, motor evaluation................................................ 4-3
optimization................................................................ 16-4, 17-2
optimize count............................................................ 16-4, 17-2
order...................................................................................... 1-4
other displays....................................................................... 11-1
OTHERS............................................................................... 11-1
overview.............................................................................. 22-2
IM WT1801-01EN
P
Page
p-p compression.................................................................. 10-3
PAGE DOWN........................................................................ 7-3
PAGE END............................................................................ 7-3
PAGE TOP............................................................................. 7-3
PAGE UP............................................................................... 7-3
paper feeding...................................................................... 20-3
Pc formula............................................................................. 8-9
peak over-range jump......................................................... 2-16
peak over status................................................................. 16-11
phase................................................................................... 8-10
phase difference.................................................................. 8-10
PLL source............................................................................ 3-1
pole........................................................................................ 4-7
power coefficient.................................................................. 2-15
power range........................................................................ 2-12
preference........................................................................... 22-7
preset items........................................................................... 7-6
PRINT.................................................................................. 20-6
Print At Start........................................................................ 20-3
print conditions.................................................................... 20-1
print count............................................................................ 20-2
printing................................................................................. 20-1
printing, execution of........................................................... 20-6
print interval......................................................................... 20-2
PRINT MENU...................................................................... 20-1
print modes.......................................................................... 20-2
pulse input range................................................................... 4-5
pulse N.................................................................................. 4-7
pulse range lower.................................................................. 4-5
pulse range upper................................................................. 4-5
pulse rating............................................................................ 4-5
pulses.................................................................................... 4-7
Q
Page
q mode................................................................................. 9-11
R
Page
RAM-0................................................................................. 18-1
range, auxiliary input............................................................. 5-1
range, motor evaluation......................................................... 4-3
raster................................................................................... 10-3
Rated Freq Lower.................................................................. 4-6
Rated Freq Upper.................................................................. 4-6
Rated Lower.......................................................................... 4-5
rated time of integrated D/A output...................................... 9-12
Rated Upper.......................................................................... 4-5
real-time continuous integration mode.................................. 9-9
real-time Control.................................................................. 9-10
real-time normal integration mode......................................... 9-9
real-time print mode............................................................ 20-2
real-time storage mode....................................................... 17-2
real time control.......................................................... 17-3, 20-3
record to file......................................................................... 16-7
remote control..................................................................... 22-3
remote mode, clearing................................................ 22-4, 23-3
Reset Pattern........................................................................ 7-6
Resolution........................................................................... 22-7
rising.................................................................................... 10-5
S
Page
S,Q Formula.......................................................................... 8-8
S/Q/λ/Φ.................................................................................. 7-5
sampling frequency............................................................... 8-9
save conditions.................................................................... 16-8
Index-3
Index
saved items......................................................................... 16-8
save numeric....................................................................... 18-2
save setup........................................................................... 18-2
save wave........................................................................... 18-2
saving numeric data............................................................ 18-2
scale mode.......................................................................... 12-2
scale value.......................................................................... 10-7
Scaling................................................................... 4-1, 5-1, 11-3
scaling................................................................................. 2-14
scaling, auxiliary input........................................................... 5-1
scaling, motor evaluation....................................................... 4-1
scheduled storage time....................................................... 17-3
scheduled times......................................................... 9-10, 20-3
screen image colors............................................................ 19-1
screen image data formats.................................................. 19-1
screen images, saving......................................................... 19-1
selected items............................................................ 17-4, 18-3
self-test............................................................................... 22-11
sense type............................................................................. 4-2
sensor ratio.......................................................................... 2-13
separator............................................................................. 22-7
sequence number................................................................ 18-4
setup data, loading.............................................................. 18-5
setup data, saving............................................................... 18-2
setup parameter list............................................................. 2-22
S formula............................................................................... 8-8
SF scaling............................................................................ 2-15
SINGLE................................................................................. 6-1
single-shot storage mode.................................................... 17-2
single harmonics list.............................................................. 7-2
single measurement.............................................................. 6-1
slave.................................................................................... 8-10
slip......................................................................................... 4-8
slope.................................................................................... 10-5
slope, auxiliary input.............................................................. 5-2
slope, motor evaluation......................................................... 4-3
SNTP................................................................................... 21-5
source.................................................................................... 4-7
split display.......................................................................... 14-1
star-delta transformation....................................................... 2-7
Star>Delta............................................................................. 2-7
starting harmonic order....................................................... 12-2
starting high speed data capturing...................................... 16-9
start order............................................................................ 12-2
stopping high speed data capturing.................................... 16-9
storage................................................................................ 17-1
storage, resetting................................................................. 17-7
storage, starting................................................................... 17-6
storage, stopping................................................................. 17-7
storage conditions............................................................... 17-1
storage control..................................................................... 17-2
storage count....................................................................... 17-2
storage interval.................................................................... 17-3
storage mode...................................................................... 17-2
store at start........................................................................ 17-3
stored items......................................................................... 17-4
store reset........................................................................... 17-7
store set............................................................................... 17-1
store start............................................................................ 17-6
store stop............................................................................. 17-7
string..................................................................................... 7-11
synchronization source, motor evaluation............................. 4-5
synchronized measurement................................................ 8-10
synchronous speed............................................................... 4-7
sync measure...................................................................... 8-10
Sync Source.......................................................................... 4-5
sync source......................................................................... 2-18
Index-4
sync speed............................................................................ 4-7
system config...................................................................... 22-5
system overview.................................................................. 22-2
system settings.................................................................... 22-5
T
Page
TCP/IP................................................................................. 21-2
test items............................................................................ 22-11
Thd formula........................................................................... 3-3
time/div....................................................................... 10-2, 11-2
time axis..................................................................... 10-2, 11-2
time difference from GMT.................................................... 22-5
total efficiency........................................................................ 4-9
trademarks................................................................................. i
trend..................................................................................... 11-1
trend display......................................................................... 11-1
trend display scale................................................................ 11-3
trend display windows, number of........................................ 11-2
trend number........................................................................ 11-3
trends, restarting.................................................................. 11-2
trigger......................................................................... 10-5, 16-6
triggered mode.................................................................... 10-5
trigger event............................................................... 17-3, 20-3
trigger level.......................................................................... 10-5
trigger point......................................................................... 10-6
trigger settings............................................................ 10-5, 16-6
trigger slope......................................................................... 10-5
trigger source...................................................................... 10-5
Type 1.................................................................................... 8-8
Type 2.................................................................................... 8-8
Type 3.................................................................................... 8-9
U
Page
U/I/P....................................................................................... 7-5
U/I measuring mode............................................................ 16-5
U/I MODE.............................................................................. 7-5
U Mag.................................................................................. 13-2
unit........................................................................... 4-2, 5-1, 8-1
unit, auxiliary input................................................................. 5-1
unit, motor evaluation............................................................ 4-2
unit, user-defined function..................................................... 8-1
update rate.......................................................................... 2-20
upper limit............................................................................ 12-2
upper scale................................................................. 11-3, 12-2
USB..................................................................................... 22-3
USB-0.................................................................................. 18-1
USB-1.................................................................................. 18-1
USB keyboard..................................................................... 22-7
USB keyboard language..................................................... 22-7
USB memory....................................................................... 18-1
user-defined event name....................................................... 8-6
user-defined event number................................................... 8-6
user-defined events............................................................... 8-6
user-defined functions........................................................... 8-1
user defined event................................................................. 8-6
user defined function............................................................. 8-1
utility........................................................................... 18-6, 22-1
V
Page
valid measurement range.................................................... 2-16
var hours............................................................................... 9-1
vector................................................................................... 13-1
vector display...................................................................... 13-1
vector display windows, number of..................................... 13-2
vector number..................................................................... 13-2
IM WT1801-01EN
Index
vector zoom......................................................................... 13-2
vertical axis.......................................................................... 10-4
vertical position.................................................................... 10-9
vertical scale........................................................................ 12-2
vertical scale type................................................................ 12-2
vertical zoom....................................................................... 10-8
volt-ampere hours................................................................. 9-1
voltage and current measurement modes........................... 16-5
voltage auto range............................................................... 2-10
voltage range......................................................................... 2-9
VT ratio................................................................................ 2-14
VT scaling............................................................................ 2-14
W
Page
watt hour integration method for each polarity..................... 9-11
watt hours.............................................................................. 9-1
waveform display................................................................. 10-1
waveform display data, saving............................................ 18-2
waveform display windows, number of................................ 10-2
waveform labels.................................................................. 10-7
waveform mapping.............................................................. 10-8
waveforms, methods for assigning to screens..................... 11-2
waveform sampling data..................................................... 10-3
wave label........................................................................... 10-7
wave mapping..................................................................... 10-8
Wiring.................................................................................... 2-1
wiring..................................................................................... 2-1
wiring system.................................................................. 1-6, 2-1
wiring system combination.................................................... 2-1
wiring unit....................................................................... 1-6, 2-1
WP/q/TIME............................................................................ 7-5
WP± Type............................................................................. 9-11
X
Page
X-axis position..................................................................... 12-2
X Pos.................................................................................... 7-11
Y
Page
Y Pos.................................................................................... 7-11
Z
Page
zero-level compensation..................................................... 23-1
IM WT1801-01EN
Index-5