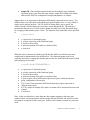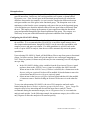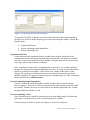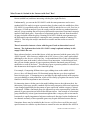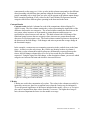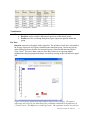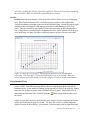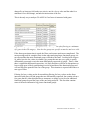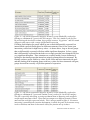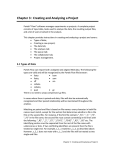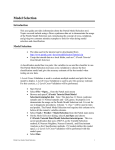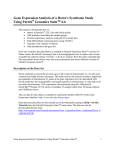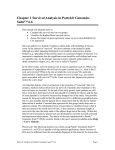
1
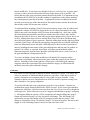
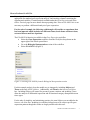
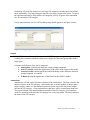
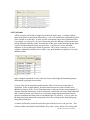
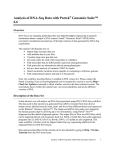
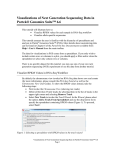
GO ANOVA What is GO ANOVA? With GO ANOVA, Partek Genomic Suite includes the ability to use rigorous statistical analysis to find differentially expressed functional groupings of genes. Leveraging the Gene Ontology database, Partek Genomics Suite can organize genes into functional groups. Not only can GO ANOVA detect up and down regulated functional groups, but also functional groups, which are disrupted in a few genes as a result of treatment. Moreover, the common diction of the GO effort enables this analysis to be compared across all types of gene expression data, including those from other species. Traditional tests, such as GO enrichment, require defining filtered lists of differentially expressed genes followed by an analysis of functional groups related to those genes. On the other hand, GO ANOVA is performed directly after data import and normalization. This minimizes the risk that a highly stringent filter will cause important functional groups to be overlooked. Other tests, such as GSEA enrichment, tolerate minimal or no pre-filtering. However, these tests are very limited in their ability to integrate complicated experimental designs. GSEA, for example, can only handle experiments with one variable comparing two groups. GO ANOVA, on the other hand, can leverage the wealth of sample information collected and use powerful multivariate ANOVA statistics to analyze very complex interactions and regulatory events. The analysis output includes detailed statistical results specifying the effect and importance of phenotypic information on differential expression and subsequent disruption of Gene Ontology functional categories. Furthermore, GSEA calculates enrichment scores using a running-sum statistic on a ranked gene list. GO ANOVA takes into account more information by utilizing each sample’s intensity values to calculate the enrichment score. Implementation Details The method used to detect changes in functional groups is ANOVA. For detailed information about ANOVA, see Chapter 11 of the Partek User Manual. There is one result per functional group based on the expression of all the genes contained in the group. Besides all the factors specified in the ANOVA model, the following extra terms will be added to the model by Partek automatically: • • Gene ID - Since not all genes in a functional group express at the same level, gene ID is added to the model to account for gene-to-gene differences Factor*Gene ID - Interaction of gene ID with the factor can be added to detect changes within the expression of a GO category with respect to different levels of the factor, referred to in this document as the disruption of the categories expression pattern or simply disruption Partek User Guide: GO ANOVA 1 • Sample ID - Since multiple measurements (on the multiple genes within the functional group) come from the same sample, sample ID is added to the model, otherwise the ANOVA assumption of sample independence is violated Suppose there is an experiment to find genes differentially expressed in two tissues: Two different tissues are taken from each patient and a paired sample t-test, or 2-way ANOVA can be used to analyze the data. The GO ANOVA dialog allows you to specify the ANOVA model, which includes the two factors: tissue and patient ID. The analysis is performed at the gene level, but the result is displayed at the level of the functional group by averaging of the member genes’ results. The equation of the model that can be specified is: y = µ +T + P +ε • • • • • y: expression of a functional group µ: average expression of the functional group T: tissue-to-tissue effect P: patient-to-patient effect (this is a random effect) ε: error term When the tissue is interacted with the gene ID then the ANOVA model becomes more complicated as demonstrated in the model below. The functional group result is not explicitly derived by averaging the member genes as the new model includes terms for both gene and group level results: y = µ + T + P + G + T * G + S (T * P) + ε • • • • • • • • • • • y: expression of a functional group µ: average expression of the functional group T: tissue-to-tissue effect P: patient-to-patient effect (this is a random effect) G: gene-to-gene effect (differential expression of genes within the function group independent of tissue type) T*G: Tissue-Gene interaction (differential patterning of gene expression in different tissue types) S (T*P): sample-to-sample effect (this is a random effect, and nested in tissue and patient) ε: error term Note: In the case that there is more than one data column mapping to the same gene symbol, Partek will assume that the markers target different isoforms and will not treat the two markers as replicated of the same gene. Instead, each column is treated as a gene unto itself. Partek User Guide: GO ANOVA 2 Disruption Score If there are only two samples in the spreadsheet then, Partek cannot calculate a type by gene ID interaction. In this case, the result spreadsheet will contain a column labeled Disruption score. First, for each gene in the functional group Partek will calculate the difference between the two samples. A z-test is used to compare the difference between each gene and the rest of the genes in the functional group. The disruption score is the minimum p-value from the z-tests comparing each gene to the rest in the functional group. A low disruption score therefore indicates that at least one gene behaves differently from the rest. This implies a change in the pattern of gene expression within the functional group and potential disruption of the normal operation of the group. The category as a whole may or may not exhibit differential expression in addition to the disruption. Configuring the GO ANOVA Dialog The setup dialog for GO ANOVA can be found in the Biological Interpretation section of the workflow. It is recommended that GO ANOVA is run on the signal intensity sheet after import and normalization, though GO ANOVA can be run on any spreadsheet with samples on rows and genes on columns. If a child spreadsheet is selected, such as the result of a prior ANOVA analysis, then the test will be automatically run on the parent spreadsheet. Upon selecting GO ANOVA, Partek will build library files to map from genes to functional groups. In future versions, Partek will give the option to use custom gene mappings as well. Please be patient, for denser arrays this may be time consuming, but will only happen once per chip. • • In the GO ANOVA dialog, select variables from the Experimental Factor(s) panel and move them to the ANOVA Factor(s) panel to configure the ANOVA model. When an item in the ANOVA Factor(s) list box is selected, the -> button next to the Interact with gene (optional) list box will be enabled. Select the button to move the selected item into the Interact with gene (optional) panel. Select an item in the Interact with gene (optional) panel and then click the enabled <- button to remove. Double clicking on an item will also move it to the other list box. To save time when running GO ANOVA, the size of GO categories analyzed can be limited using the Restrict analysis to function groups with fewer than __ genes. Large GO categories may be less interesting and also take the most time to analyze. Partek recommends setting the maximum category size to 150 genes or less, as it can make the analysis much quicker. In the following example, the maximum category size will be set to only 20 genes to allow the analysis to be run more quickly. Partek User Guide: GO ANOVA 3 Figure 1: Configuring the GO ANOVA Dialog To setup the GO ANOVA dialogue you must consider all factors that would normally be included in an ANOVA model analyzing gene expression among the samples. Briefly this should include: • • • Experimental factors Factors explaining sample dependence Factors explaining noise Experimental Factors Factors inherent to the experiment include variables that would be considered as the experimental variables during experiment design. Generally this will include all variables necessary to answer the questions of the researcher. Examples may include factors such as tissue type, disease state, treatment, or dosage. Note: Sometimes factors do not act independently of each other. For example, different dosages of a drug may affect patients differently over time, or a drug may not affect tissues equally as in many toxicity studies. If the effect of one variable on the other is either suspected of occurring, or of particular interest, an interaction between the two factors should be included. To do this, select the two factors simultaneously by CTRL-clicking the factors and then select Add Interaction. Factors Explaining Sample Dependence Factors to control for sample dependence include variables that account for relation between samples. If tissues are collected in pairs from the same patient, patient ID would be included. Similarly if tissues are collected from two distinct populations, this variable should probably be included as well. Factors Explaining “Noise” Noise variables may be caused by technical processes used during sample collection and processing. Scan data and dye color are often among these variables. For more details on ANOVA, please see Chapter 11 of the User’s Manual. Partek User Guide: GO ANOVA 4 What Terms do I include in the “Interact with Gene” Box? Factors included in the GO ANOVA fall into two separate categories: the normal ANOVA factors (middle box) and those interacting with the gene (right-side box). Fundamentally, you can run the GO ANOVA with the same parameters used to run a standard ANOVA analysis on gene expression data. (In other words, the middle box of the GO ANOVA is populated exactly as the normal ANOVA and the Interact with Gene box is left empty.) If such an analysis is run, the results would be similar to a standard statistical analysis, except resulting data will report on differential expression of functional categories instead of individual genes. Expression of a functional group is derived from the mean of all genes included within the group. Running GO ANOVA with the same parameters as the differential expression analysis is among the more common methods of running GO ANOVA. This keeps the analysis much more accessible and the results are easier to interpret. There is no need to interact a factor with the gene if such an interaction is not of interest. The right most box in the GO ANOVA setup is optional and may be left empty if this is the case. More advanced analysis can include factors, which are interacted with the genes in the GO ANOVA model. After factors are added to the ANOVA factor(s) box, some can be added additionally to the Interact with Gene box. At the mathematical level, this will include the Factor*Gene term in the model, called a Factor-Gene interaction. At the biological level, this will test whether patterns of gene expression within the functional group are being modified as a result of the factor. This altering of gene expression patterns is referred to in this document as the disruption of the functional group. For example, if comparing different tissue types, adding tissue to the middle ANOVA factor(s) box, will identify entire GO functional groups that are up or down regulated between tissue types. If comparing nerves and muscles, this might include such categories as myosin binding or actin production, which will be wholly up regulated in muscles as the function is much less important to nerve function. By interacting tissue with the gene in the model (adding tissue to the right most box), the interaction p-value may provide a method of discovering categories where total expression is not changed significantly but the pattern of gene expression with the category is altered or disrupted. Within a functional group, the interaction p-value represents how similar the patterns of gene expression are between the different tissues. One example of a functional group identified by a tissue*gene interaction might include a category such as ion transfer. Ion transfer is equally important to both nerve and muscle function, but the distribution of ion channels and many of the responsible genes may be quite different between the two. Sometimes factors may be included in the Interact with Gene box even if they are not of specific interest in a similar way that factors to control for noise are added to the ANOVA Partek User Guide: GO ANOVA 5 factors middle box. If any factors are included in Interact with Gene box, to get the most accurate p-values, the more advanced model must fit the data as well as possible. All factors that may alter gene expression patterns should be included. It is important to keep in mind that the GO ANOVA is not only looking for significance in the factors included, but is attempting to generally fit the data. As appropriate factors are added to the model, not only are more aspects of the data analyzed; the model becomes a better fit to the true data and the results will become more accurate. To understand how including a Gene*Factor interaction may improve the fit of the model, consider the complex GO ANOVA design in the case of a dose-time analysis of a drug. While it may seem clear that the ANOVA factors in the middle box - dose, time, and the dose*time interaction should be specified (to consider the effect of dose, time, and the change in the effect of dose over time) what to put in the rightmost Gene*Factor box is not as clear. Adding dose alone (which is actually Dose*Gene) will check if different drug doses affect the pattern of gene expression. Similarly adding time into the right box (which is actually Time*Gene) will identify gene ontology categories that are affected in different times but differentially across the genes. While this may be the true limit of questions of interest, including the interactions of the gene and both dose and time may be prudent. In general, if it is likely, or expected, that a factor will affect gene distribution within functional categories, then the factor should be included in the Interact with Gene box if the gene distribution is being analyzed at all. To review, including a factor in the middle box will identify GO categories whose expression is consistently affected across the genes within the category by the factor of interest. Including a factor in the right box (factor*gene) will identify gene ontology categories where the expression of the genes within the category are affected but not uniformly across the genes within the category. Contrasts GO ANOVA is not restricted to analysis of factors with only two levels. The ANOVA pvalues are measures of likelihood that all groups are equivalent. While this is useful in general, sometimes tests comparing only two sets of data are more desirable. Using contrasts to define pair wise comparisons in an ANOVA model is superior to using a test that is limited to a two group comparison. To specify individual pair wise comparisons, press the Contrast button. Contrasts are performed on groups already defined in the ANOVA model. If two tissue types should be compared to each other, select the tissue term from the Select Factor/Interaction dropdown in the upper left. Select either one or a set of categories and add them to group 1 and group 2. All samples falling into group 1 will be compared to all samples falling into group 2. Output will include not only a p-value, but also a fold change. This fold change will represent the average fold change of the GO category between the two groups. Fold change is calculated as Group 1 divided by Group 2. For data in log space, the data is antilogged as well; fold change output is always for data on a linear scale. Partek User Guide: GO ANOVA 6 How to Perform Go ANOVA Preparing a data set for analysis requires importing the data, normalizing the data as appropriate for standard gene expression analysis, and inserting columns containing the experimental variables. Consult tutorials available under the Gene Expression tab of the Online Tutorials page for more details about preparing data. Prior to GO ANOVA it is not necessary to perform a differential analysis of gene expression. For the sake of example, the following walkthrough will consider an experiment that has been imported which includes two different tissues, brain tissue and heart tissue, extracted from a small set of patients. The GO ANOVA function is available in the Gene Expression workflow. • Select the Gene Expression workflow from the Workflows drop-down on the upper right of the Partek spread sheet • Go to the Biological Interpretation section of the workflow • Select GO ANOVA (Figure 2) Figure 2: Selecting GO ANOVA from the Biological Interpretation section For this example analysis, keep the model easy to interpret by including Subject and Tissue as the only ANOVA factors. Additionally, add Tissue to the Interact with Gene box. Including Subject will control for person to person variation, and including Tissue allow the analysis of differential expression and of functional category disruption between tissue types. For the sake of simplicity and minimizing run time, the term Subject was not added to the Interact with Gene box. Including it would have helped correct for subject specific gene expression patterns though the results are largely unaffected in this case. Partek User Guide: GO ANOVA 7 Performing GO ANOVA analysis on very large GO categories can take quite a bit of time. More importantly, very large categories may have too large a scope to be useful. To speed the operation and analyze only smaller GO categories, specify 20 genes as the maximum size for an analyzed GO category. For the sample dataset, the Go ANOVA dialog setup should appear as in Figure 3 below. Figure 3: Configuring the GO ANOVA Set-up for Sample Data Output GO ANOVA output is very similar to standard ANOVA output except each row in the resulting sheet contains statistical results from a single GO functional group rather than a single gene. Columns can be broken down into 4 categories: • Annotations contain detail about the category being considered • ANOVA results contain the significance of the effect of the factors in the model • Contrast results contain significance and fold change of the difference between groups compared via contrast • F-Ratios display the significance of the factors in the ANOVA model Annotations Annotations will take up the first three columns of the results sheet. The first column is the number of genes in the GO category. Specifically, this is not the number of unique genes in the category; rather, it is the number of probes or probe sets on the chip whose targets fall into the GO category. Genes targeted more than once will be counted more than once. The second column is the unique numeric identifier of the GO category; it is sometimes useful for searching with when the GO category has a very long name. The third column is the name of the GO category. Partek User Guide: GO ANOVA 8 Figure 4: Viewing the Annotation of Results ANOVA Results ANOVA results will include a column for each factor in the setup. A column with the name of the factor or interaction followed by p-value will contain how significant the effect of the variable is on the data. A lower p-value corresponds with a more significant effect. For example, a p-value of 0.1 for tissue means that given the difference between the tissue and the inherent variability of the measurements of the genes in the functional group, there is a10% likelihood that the tissues are equivalent. A p-value of 0 occurs when the difference is too significant for Partek to represent. This can be caused by a very low estimate of inherent variability due to either a very small number of replicates or severely unbalanced data. Figure 5: Viewing the ANOVA Result In the example experiment, a low p-value for tissue would imply the functional group is differentially expressed across tissues. A low p-value for an interaction implies that the effect of one factor on the other is significant. In the example dataset, no interactions between two main variables were included as factors. (Note: Tissue*Gene interaction is discussed in the next paragraph.) To illustrate what the interaction p-value would mean, consider the case that a drug compound and a control injection were dosed over several time points and an interaction between injection compound and time point was included in the GO ANOVA. A low p-value for the drug-time point interaction corresponds to the effect of drug on the functional group being altered with time. A column will also be present for each factor placed in the Interact with gene box. This column will have the header Factor*Marker ID p-value. (Note: Marker ID is being used Partek User Guide: GO ANOVA 9 synonymously as the term gene.) A low p-value in this column corresponds to the different states presenting with different gene patterns within the functional group. For functional groups containing only a single gene, no value will be present as the pattern cannot change. In the example experiment, a low p-value for the Tissue*Marker ID represents function categories which have different genes operating in the heart and in the brain. Contrast Results Contrast results include 4 columns for each of the comparisons declared during GO ANOVA setup. The first column contains the p-value representing the significance of the difference between the two categories. The second column contains the ratio between the two groups where increases are represented as greater than one and decreases are represented as values between zero and one. The third column is the fold change of the functional group between the two categories where increases are greater than one and decreases are less than negative one. The fourth column contains a plain text description of the direction of the fold change. Fold changes and ratios represent the average change in the functional category. In the example, a contrast was run comparing expression in the cerebral tissue to the heart tissue. As these were the only tissues, the p-values are identical to those in column 4. While the p-value column shows which groups are differentially expressed between the tissues, the fold change columns allow us to see by how much they are differentially expressed. Using the sign of the fold change, or the description column, you can see which categories are increased in brain and which are increased in heart. Figure 6: Viewing the Contrast Results F-Ratios F-Ratios are used in the computation of p-values. The values in the columns can safely be ignored by most users; there are exceptional cases when the f-ratios may be informative. To see the general significance of the factors included in the model, a Sources of Variation plot can be computed from these values from the View menu. The higher the average Fratio, the more important the factor is to the model on average. Partek User Guide: GO ANOVA 10 Figure 7: Viewing the F-Ratios Visualizations There are two main visualizations for use with GO ANOVA outputs: • Dot Plots used to visualize differential expression of functional groups • Profiles used for visualizing disruption of gene expression patterns within the group Dot Plots Dot plots represent each sample with a single dot. The position of each dot is calculated as the average expression of all genes included in the functional group. Invoke this plot by right clicking on the row header of a functional group of interest and choosing Dotplot (Orig. Data). The color, shape, and size of the dots can be set to represent sample information in the plot properties dialogue, invoked by pressing on the red ball in the upper left. Figure 8: Dot plot of significantly differentially expressed GO category. The heart is expressing at a level over two times that of the cerebellum evidenced by the difference of 1.3 on the y-axis. This difference is in the log2 scale. The replicates are also very close to Partek User Guide: GO ANOVA 11 each other, making this category especially significant. This is not surprising considering the cerebellum is likely not involved in regulating heart contract. Profiles Profiles represent each category of one of the GO ANOVA factors as a few overlapping lines. Horizontal coordinates refer to individual genes or probes in the original data. Vertical coordinates represents expression of the individual gene. Invoke this plot by right clicking on the row header of a function group of interest and choosing Profile (Orig. Data). This plot is useful as the pattern of gene expression in the group is displayed as a line. If the pattern is conserved across treatments, the lines will lie parallel, but if the gene reacts differently, the lines will follow a different pattern, maybe even cross each other. Figure 9: Profile of a GO category with significant disruption but not differential expression. Note how AQP1 is up in heart and AQP4 is up in cerebellum. When the pattern of gene expression changes across the category it leads to significant disruption Recommended Filters When looking for simple differential expression, sorting by ascending on the factor pvalues is ideal. This will find groups that are the most significantly apart across all the contained genes. In the interest of finding groups that are less likely to be called by chance, it may be wise to filter to groups with a minimum of 4 or 5 genes. Simple filters can be done using the interactive filter available from the the screen. button on the toolbar at the top of If there is more than one factor in the model, more complex criteria combining the factors can be specified using the gene list creator. The gene list creator is available under the Analysis section of the workflow. For example, to find categories that are significant and Partek User Guide: GO ANOVA 12 changed by at least two fold, make two criteria, one for a low p-value and the other for a minimum of two fold change, and take the intersection of the two. This is the only way to analyze GO ANOVA if no factor is interacted with genes. Figure 10: Top ten functional groups sorted by Tissue p-value after filtering to a minimum of 5 genes in the GO category. Note how the groups are specific to muscles and nerve cells If the factor-gene interaction is tested, the filters can become much more complicated. The most pressing need for complex filters is that when analyzing larger functional groups it is not expected that the entire functional group will behave the same. Looking back at figure 10, notice how the low values in column 6 are present because not every gene is equally differentially expressed even in the most differentially expressed of groups. That is, when there is significant differential expression, it is likely that there will also be disruption as at least a single gene is likely participating in a role beyond that of the functional group and will not follow the pattern of the rest of the group. This situation is expected and leads to a new type of filter. Filtering for low p-values on the factor and then filtering for low p-values on the factor interacted with gene will find groups that are differentially expressed, but contain at least a few genes that are either disrupted due to treatment, or simply are involved in additional functional groups beyond the scope of the one being analyzed. This list often contains some of the more informative big picture functional groups. Partek User Guide: GO ANOVA 13 Figure 11: Top ten GO functional categories sorted by Tissue*MarkerID p-value after filtering to a minimum of 5 genes in the GO category. This list is similar to the first list. By prioritizing the interaction column, these groups are more “big picture” and all contain categories that express with a range of differential expression If looking for disruption for groups which are not so much differentially expressed, but instead which express different genes for different treatments, filter for low factor-gene interaction p-values but for high factor p-values. As shown above, large or diverse groups that are differentially expressed will often exhibit significant disruption. In fact, a group that is differentially expressed but includes even a single gene that is not changed will have very significant disruption. These situations are certainly notable, but are distracting if looking for functional groups that instead are uniquely patterned based on treatment. By filtering out those groups with low p-values for the factor and factor interacted with gene and then looking at the remaining groups with low p-values for factor interacted with gene, groups observed have usually very distinct patterns of expression. Figure 12: Top ten GO functional categories sorted by Tissue*MarkerID p-value after filtering to a minimum of 5 genes and a minim Tissue p-value of 0.3 in the GO category. This list is especially interesting, as using enrichment alone to detecting such categories would require much more labor. Water and ion transport use different proteins in heart and brain but are highly expressed in both. This is also presented in figure 9. Even more interesting is neuromuscular junction development, in which the genes in the neuron are up in the cerebellum, and those on the muscle side of the junction are up in heart Partek User Guide: GO ANOVA 14 Further Analysis GO ANOVA is a powerful tool for discovering complex and concerted activity across entire gene groups. Additional tools included in Partek such as the classic ANOVA and GO Enrichment can help to elucidate gene specific effects and find key genes for the use in diagnostics or downstream pathway analysis. End of User Guide This is the end of the GO ANOVA user guide. If you need additional assistance, please call our technical support staff at +1-314-878-2329 or email [email protected]. Copyright 2009 by Partek Incorporated. All Rights Reserved. Reproduction of this material without expressed written consent from Partek Incorporated is strictly prohibited. Partek User Guide: GO ANOVA 15