1
To our customers,
Old Company Name in Catalogs and Other Documents
On April 1st, 2010, NEC Electronics Corporation merged with Renesas Technology
Corporation, and Renesas Electronics Corporation took over all the business of both
companies. Therefore, although the old company name remains in this document, it is a valid
Renesas Electronics document. We appreciate your understanding.
Renesas Electronics website: http://www.renesas.com
April 1st, 2010
Renesas Electronics Corporation
Issued by: Renesas Electronics Corporation (http://www.renesas.com)
Send any inquiries to http://www.renesas.com/inquiry.
Notice
1.
2.
3.
4.
5.
6.
7.
All information included in this document is current as of the date this document is issued. Such information, however, is
subject to change without any prior notice. Before purchasing or using any Renesas Electronics products listed herein, please
confirm the latest product information with a Renesas Electronics sales office. Also, please pay regular and careful attention to
additional and different information to be disclosed by Renesas Electronics such as that disclosed through our website.
Renesas Electronics does not assume any liability for infringement of patents, copyrights, or other intellectual property rights
of third parties by or arising from the use of Renesas Electronics products or technical information described in this document.
No license, express, implied or otherwise, is granted hereby under any patents, copyrights or other intellectual property rights
of Renesas Electronics or others.
You should not alter, modify, copy, or otherwise misappropriate any Renesas Electronics product, whether in whole or in part.
Descriptions of circuits, software and other related information in this document are provided only to illustrate the operation of
semiconductor products and application examples. You are fully responsible for the incorporation of these circuits, software,
and information in the design of your equipment. Renesas Electronics assumes no responsibility for any losses incurred by
you or third parties arising from the use of these circuits, software, or information.
When exporting the products or technology described in this document, you should comply with the applicable export control
laws and regulations and follow the procedures required by such laws and regulations. You should not use Renesas
Electronics products or the technology described in this document for any purpose relating to military applications or use by
the military, including but not limited to the development of weapons of mass destruction. Renesas Electronics products and
technology may not be used for or incorporated into any products or systems whose manufacture, use, or sale is prohibited
under any applicable domestic or foreign laws or regulations.
Renesas Electronics has used reasonable care in preparing the information included in this document, but Renesas Electronics
does not warrant that such information is error free. Renesas Electronics assumes no liability whatsoever for any damages
incurred by you resulting from errors in or omissions from the information included herein.
Renesas Electronics products are classified according to the following three quality grades: “Standard”, “High Quality”, and
“Specific”. The recommended applications for each Renesas Electronics product depends on the product’s quality grade, as
indicated below. You must check the quality grade of each Renesas Electronics product before using it in a particular
application. You may not use any Renesas Electronics product for any application categorized as “Specific” without the prior
written consent of Renesas Electronics. Further, you may not use any Renesas Electronics product for any application for
which it is not intended without the prior written consent of Renesas Electronics. Renesas Electronics shall not be in any way
liable for any damages or losses incurred by you or third parties arising from the use of any Renesas Electronics product for an
application categorized as “Specific” or for which the product is not intended where you have failed to obtain the prior written
consent of Renesas Electronics. The quality grade of each Renesas Electronics product is “Standard” unless otherwise
expressly specified in a Renesas Electronics data sheets or data books, etc.
“Standard”:
8.
9.
10.
11.
12.
Computers; office equipment; communications equipment; test and measurement equipment; audio and visual
equipment; home electronic appliances; machine tools; personal electronic equipment; and industrial robots.
“High Quality”: Transportation equipment (automobiles, trains, ships, etc.); traffic control systems; anti-disaster systems; anticrime systems; safety equipment; and medical equipment not specifically designed for life support.
“Specific”:
Aircraft; aerospace equipment; submersible repeaters; nuclear reactor control systems; medical equipment or
systems for life support (e.g. artificial life support devices or systems), surgical implantations, or healthcare
intervention (e.g. excision, etc.), and any other applications or purposes that pose a direct threat to human life.
You should use the Renesas Electronics products described in this document within the range specified by Renesas Electronics,
especially with respect to the maximum rating, operating supply voltage range, movement power voltage range, heat radiation
characteristics, installation and other product characteristics. Renesas Electronics shall have no liability for malfunctions or
damages arising out of the use of Renesas Electronics products beyond such specified ranges.
Although Renesas Electronics endeavors to improve the quality and reliability of its products, semiconductor products have
specific characteristics such as the occurrence of failure at a certain rate and malfunctions under certain use conditions. Further,
Renesas Electronics products are not subject to radiation resistance design. Please be sure to implement safety measures to
guard them against the possibility of physical injury, and injury or damage caused by fire in the event of the failure of a
Renesas Electronics product, such as safety design for hardware and software including but not limited to redundancy, fire
control and malfunction prevention, appropriate treatment for aging degradation or any other appropriate measures. Because
the evaluation of microcomputer software alone is very difficult, please evaluate the safety of the final products or system
manufactured by you.
Please contact a Renesas Electronics sales office for details as to environmental matters such as the environmental
compatibility of each Renesas Electronics product. Please use Renesas Electronics products in compliance with all applicable
laws and regulations that regulate the inclusion or use of controlled substances, including without limitation, the EU RoHS
Directive. Renesas Electronics assumes no liability for damages or losses occurring as a result of your noncompliance with
applicable laws and regulations.
This document may not be reproduced or duplicated, in any form, in whole or in part, without prior written consent of Renesas
Electronics.
Please contact a Renesas Electronics sales office if you have any questions regarding the information contained in this
document or Renesas Electronics products, or if you have any other inquiries.
(Note 1) “Renesas Electronics” as used in this document means Renesas Electronics Corporation and also includes its majorityowned subsidiaries.
(Note 2) “Renesas Electronics product(s)” means any product developed or manufactured by or for Renesas Electronics.
User’s Manual
M3T-PD308SIM V.3.20
M3T-PD30SIM V.5.20
User’s Manual
Simulator Debugger
Rev.1.00 2003.12
• Microsoft, MS-DOS, Windows, and Windows NT are registered trademarks of Microsoft Corporation in the U.S. and other countries.
• IBM and AT are registered trademarks of International Business Machines Corporation.
• Intel and Pentium are registered trademarks of Intel Corporation.
• Adobe, Acrobat, and Acrobat Reader are trademarks of Adobe Systems Incorporated.
• All other brand and product names are trademarks, registered trademarks or service marks of their respective holders.
Keep safety first in your circuit designs!
z Renesas Technology Corporation and Renesas Solutions Corporation put the maximum effort into making semiconductor products
better and more reliable, but there is always the possibility that trouble may occur with them. Trouble with semiconductors may lead to
personal injury, fire or property damage. Remember to give due consideration to safety when making your circuit designs, with
appropriate measures such as (i) placement of substitutive, auxiliary circuits, (ii) use of nonflammable material or (iii) prevention
against any malfunction or mishap.
Notes regarding these materials
z These materials are intended as a reference to assist our customers in the selection of the Renesas Technology product best suited to
the customer's application; they do not convey any license under any intellectual property rights, or any other rights, belonging to
Renesas Technology Corporation, Renesas Solutions Corporation or a third party.
z Renesas Technology Corporation and Renesas Solutions Corporation assume no responsibility for any damage, or infringement of any
third-party's rights, originating in the use of any product data, diagrams, charts, programs, algorithms, or circuit application examples
contained in these materials.
z All information contained in these materials, including product data, diagrams, charts, programs and algorithms represents information
on products at the time of publication of these materials, and are subject to change by Renesas Technology Corporation and Renesas
Solutions Corporation without notice due to product improvements or other reasons. It is therefore recommended that customers
contact Renesas Technology Corporation, Renesas Solutions Corporation or an authorized Renesas Technology product distributor
for the latest product information before purchasing a product listed herein. The information described here may contain technical
inaccuracies or typographical errors. Renesas Technology Corporation and Renesas Solutions Corporation assume no responsibility
for any damage, liability, or other loss rising from these inaccuracies or errors. Please also pay attention to information published by
Renesas Technology Corporation and Renesas Solutions Corporation by various means, including the Renesas home page
(http://www.renesas.com).
z When using any or all of the information contained in these materials, including product data, diagrams, charts, programs, and
algorithms, please be sure to evaluate all information as a total system before making a final decision on the applicability of the
information and products. Renesas Technology Corporation and Renesas Solutions Corporation assume no responsibility for any
damage, liability or other loss resulting from the information contained herein.
z Renesas Technology semiconductors are not designed or manufactured for use in a device or system that is used under
circumstances in which human life is potentially at stake. Please contact Renesas Technology Corporation, Renesas Solutions
Corporation or an authorized Renesas Technology product distributor when considering the use of a product contained herein for any
specific purposes, such as apparatus or systems for transportation, vehicular, medical, aerospace, nuclear, or undersea repeater use.
z The prior written approval of Renesas Technology Corporation and Renesas Solutions Corporation is necessary to reprint or reproduce
in whole or in part these materials.
z If these products or technologies are subject to the Japanese export control restrictions, they must be exported under a license from
the Japanese government and cannot be imported into a country other than the approved destination. Any diversion or reexport
contrary to the export control laws and regulations of Japan and/or the country of destination is prohibited.
z Please contact Renesas Technology Corporation or Renesas Solutions Corporation for further details on these materials or the
products contained therein.
For inquiries about the contents of this document or product, fill in the text file the installer generates in the following directory and email
to your local distributor.
¥SUPPORT¥Product-name¥SUPPORT.TXT
Renesas Tools Homepage http://www.renesas.com/en/tools
In this User’s Manual, the simulator debuggers "M3T-PD308SIM", "M3T-PD30SIM", "M3T-PD79SIM",
"M3T-PD77SIM" and "M3T-PD38SIM" are represented as "PD308SIM", "PD30SIM", "PD79SIM",
"PD77SIM" and "PD38SIM" respectively.
Please replace them with the corresponding one, when you read them.
Preface
The PDxxSIM (PD308SIM / PD30SIM / PD79SIM / PD77SIM / PD38SIM / PD32RSIM ) i s a
simulator debugger for Windows, which simulates microcomputer and evaluates the target
program. This
user's manual describes the PDxxSIM's features, functions, setting up and operational
procedures.
Supported Debuggers and Its Versions
The User’s Manual is for the following products:
l
PD308SIM V.3.00
l
PD30SIM V.5.00
Product-specific information
l
The operation which does not describe the specific product name is considered to be common
between the products (PD308SIM ,PD30SIM).
Example) PDxxSIM ...
l
For the information dependent on the product, the corresponding product name is described.
Example) PD308SIM ...
Rights to the Program
The right to use the program is granted according to provisions under a software license agreement.
The program can only be used for the purpose of product development by the user, and cannot be
used for any other purpose.
Note also that the information in this manual does not convey any guarantee or license for the use
of software.
[MEMO]
Contents
Contents
SETUP
1
1. STARTING THE DEBUGGER
3
1.1 Features of PDxx ....................................................................................................... 3
1.2 Simulation Specifications.......................................................................................... 4
1.3 Starting the Debugger............................................................................................. 15
2. SETUP DEBUGGER
16
2.1 MCU Tab .................................................................................................................. 16
2.2 Debug Information Tab ........................................................................................... 17
2.3 Compiler Tab............................................................................................................ 18
2.4 Cross Tool Tab ......................................................................................................... 19
2.5 Resume Tab.............................................................................................................. 19
2.6 Trace Tab..................................................................................................................20
2.7 I/O Script Tab........................................................................................................... 20
2.8 Method of making MCU file.................................................................................... 21
3. SIMULATOR ENGINE SETUP
22
3.1 Simulator engine setup ........................................................................................... 22
4. ENVIRONMENTAL SETTING OF DEBUGGER
23
4.1 ShortcutKey Tab...................................................................................................... 24
4.2 Download Tab .......................................................................................................... 26
4.3 Font Tab ...................................................................................................................27
4.4 Path Tab ...................................................................................................................27
4.5 Tool Entry Tab ......................................................................................................... 29
4.6 Other Tab ................................................................................................................. 30
4.7 Customizing of Toolbar ........................................................................................... 33
5. ENDING THE DEBUGGER
34
REFERENCE
35
1. WINDOWS / DIALOGS
37
1.1 PDxxSIM Window ................................................................................................... 38
i
1.2 Program Window ..................................................................................................... 41
1.3 Source Window ........................................................................................................ 47
1.4 Register Window...................................................................................................... 47
1.5 Memory Window ...................................................................................................... 49
1.6 Dump Window ......................................................................................................... 51
1.7 RAM Monitor Window............................................................................................. 53
1.8 ASM Watch Window................................................................................................ 55
1.9 C Watch Window ..................................................................................................... 56
1.10 Local Window......................................................................................................... 58
1.11 File Local Window ................................................................................................. 59
1.12 Global Window....................................................................................................... 61
1.13 Call Stack Window ................................................................................................ 62
1.14 Script Window........................................................................................................ 63
1.15 Trace Point Setting Window ................................................................................. 64
1.16 Trace Window ........................................................................................................ 70
1.17 Coverage Window .................................................................................................. 78
1.18 MR Window............................................................................................................ 80
1.19 I/O Window ............................................................................................................ 81
1.20 GUI Input Window ................................................................................................ 95
1.21 GUI Output Window ............................................................................................. 96
1.22 Output Port Window ............................................................................................. 97
1.23 S/W Break Point Setting Dialog Box .................................................................... 98
1.24 H/W Break Point Setting Dialog Box ................................................................. 100
2. TABLE OF SCRIPT COMMANDS
101
2.1 Table of Script Commands .................................................................................... 101
2.2 Table of Script Commands (alphabetical order) .................................................. 105
3. ERROR MESSAGES
108
ii
Setup
1
2
1. Starting the Debugger
1.
Starting the Debugger
1.1 Features of PDxxSIM
The PD308SIM , PD30SIM have the following functions.
1.1.1 RAM Monitor Function
This function allows changes of memory contents to be inspected without impairing the real-time
capability of the target program execution. PDxxSIM contains a 1-Kbyte RAM monitor area (which
cannot be divided into smaller areas).
1.1.2 Break Functions
l
l
Software Break
This function causes the target program to stop immediately before executing the instruction
at a specified address. Up to 64 breakpoints can be set. If multiple breakpoints are set, the
program breaks at one of the breakpoints that is reached.
Hardware Break
This function stops the target program upon detecting data read/writes to memory or
instruction execution. Up to 64 breakpoints can be set. If multiple breakpoints are set, the
program execution breaks at one of the breakpoints reached.
1.1.3 Trace Function
This function records a target program execution history. An execution history of any specified size can
be recorded. The access information in each cycle, the executed instructions, and source program
execution passes can be inspected.
1.1.4 Coverage Function
This function records the addresses executed (accessed) by the target program (C0 coverage). This
function helps to keep track of unexecuted addresses after the program has stopped running. Use of
this coverage measurement function in the test process makes it possible to keep track of the test
items that have been omitted.
1.1.5 Real-Time OS Debugging Function
This function debugs the real-time OS-dependent parts of the target program that uses the real-time
OS. This function helps to show the status of the real-time OS and inspect a task execution history,
etc.
1.1.6 GUI Input/Output Function
This function simulates the user target system's key input panel (buttons) and output panel on a
window. Buttons can be used for the input panel, and labels (strings) and LEDs can be used for the
output panel.
3
1.1.7 Customize Function
This function adds the user-exclusive functions (custom commands or custom windows) to the
PDxxSIM . To create these custom commands and custom windows, use the CBxxSIM (Customer
Builder for PDxxSIM ) included with the PDxxSIM .
1.2 Simulation Specifications
The simulation specifications vary with the type of simulator use
1.2.1 PD30SIM Simulation Specifications
1.2.1.1 Operation of Instructions
1.2.1.1.1.Regarding the number of instruction cycles
Time management is exercised in units of cycles. The number of cycles is represented by the values
listed in the microcomputer's software manual.
However, this differs from the actual chip in the following points:
l
l
l
The bus width, queue, and wait states are not considered when measuring the number of cycles.
The executed cycle of an interrupt sequence is not considered when measuring the number of
cycles.(When an interrupt occurs, the executed cycle of an interrupt sequence is 0.)
PD30SIM starts counting cycles immediately after a reset. (Cycles immediately after a reset
are 0.) The number of cycles needed to execute one machine instruction are added on for each
instruction executed. (See shown below.)
[Note]
Because the number of cycles measured by the emulator does not take into account the bus width,
queue, wait cycles, etc., it includes some error when compared with the number of cycles in the actual
chip.
In the above example, no cycles are added while the ENTER or MOV instruction is being executed. The
cycles required for each instruction are added after instruction execution. Note that the virtual port
input/output and virtual interrupt functions are processed after instruction execution is completed.
1.2.1.1.2.Target program execution time measurement
The target program execution time measurement is calculated from the number of cycles described
above and the MCU clock and divide-by ratio specified on the MCU tab of the Init dialog box.
[Note]
Because the simulator's execution time measurement is calculated using the number of cycles
described above, it includes some error when compared with the actual chip's execution time.
4
1. Starting the Debugger
1.2.1.1.3.WAIT
Executed as an NOP instruction.
Other instructions operate the same as those of the actual MCU.
1.2.1.1.4.INT, INTO, UND, BRK
As with the actual MCU, these instructions generate interrupts. (The INTO instruction only generates
an interrupt when the O flag is 1.)
1.2.1.2 Resetting
l
l
The SFR area is nonexistent in PD30SIM, so the initialization as in the actual chip is not
performed.
THe cycle count is initialized to 0.
Resetting is performed in the same way as the actual MCU.
A reset is also performed when PD30SIM starts. The value 000F000016 is set in the reset vector
immediately after starting. The program counter is therefore set to F000016 immediately after
PD30SIM starts.
1.2.1.3 Memory
1.2.1.3.1.Memory Space
There is no processor mode. If mapped for memory, the whole 1MB of memory from 0000016 to
FFFFF16 can be read from and written to as RAM.
Note, however, that in the initial state, memory between 1000016 and EFFFF16 is not secured and an
error will result if an attempt is made to access this part of memory. If this occurs while a program is
running, the program will stop with an illegal memory access error. Use the map function, described
later, to map this part of memory.
1.2.1.3.2.Memory Structure and Initial Values Immediately after Starting
The memory is set up as follows immediately after starting PDB30SIM.
0000016
0040016
1000016
F000016
Reset Vector
003FF16
EFFFF16
EFFFF16
FFFFF16
Filled with 0016.
Filled with FF16.
No memory immediately after starting
Filled with FF16.
Set to 000F000016.
1.2.1.3.3.The Map Function: MAP Command
The PD30SIM simulator divides the memory between 0000016 and FFFFF16 into sixteen equal parts,
so that the memory space can be mapped in 64KB blocks. Note that the blocks with the lowest
address (0000016 to 0FFFF16) and with the highest address (F000016 to FFFFF16) are already mapped
when the simulator starts.
Use the MAP command to map the simulator memory. Memory mapped using this command is
initialized with the value FF16 immediately after being allocated.
When downloading a target program, the memory is mapped automatically.
[Note]
Memory space that has been mapped cannot be deleted.
1.2.1.3.4.Accessing an Area Without Memory
There is no actual memory in the 14 memory blocks between 1000016 and EFFFF16 unless memory is
5
secured. If an attempt is made to access this area, an illegal memory access error occurs and execution
of the command or program stops.
1.2.1.4 I/O
1.2.1.4.1.SFR
The actual chip’s peripheral I/Os other than the CPU core, such as the timers, DMAC, and serial I/O,
are not supported. The SFR area to which the peripheral I/Os are connected is also handled as RAM by
the simulator.
However, a method is available that allows you to materialize data input to memory such as the SFR
or interrupts such as timer interrupt in an artificial manner. For details about this method, see “I/O
Script” and “Interrupts” described later.
1.2.1.4.2.I/O Script
l
Virtual Port Input Function
This function defines changes of the data that is input from external devices to a specified
memory address. Using this function you can simulate data inputs to the ports defined in SFR.
The following shows timings at which data can be input to memory:
1. When program execution has reached a specified number of cycles
2. When a specified memory location is accessed for read by a program
3. When a specified virtual interrupt is generated
Virtual interrupts at the above timings can be defined from the I/O Window.
Use of the I/O script function (the function that allows users to define virtual port input or virtual
interrupt) makes it possible to specify more elaborate data input timing such as when the
program performs fetch or writes to memory or when it executed an instruction a specified number
of times.
l
Virtual Port Output Function
When a data write to some memory address by the program occurs, this function records the
written data value and the cycle at which the data was written.
The recorded data can be verified in graphic or numeric format from the I/O Window.
The number of data entries that can be recorded by this function equals the number of data
entries specified on the Init dialog box’s I/O script tab reckoning from the time at which the
program started running. When reexecuted, the previous data is cleared.
l
The output port simulate function
The output port simulate function provides an efficient means of simulation. When data are
written to some memory addresses by a program, it allows you to record the written data values.
The recorded data can be displayed on a window or output to a file.
Also, you can verify the data which are output to UARTs by the Printf function.
The number of data entries that can be recorded by this function equals the number of data
entries specified on the Init dialog box's I/O script tab reckoning from the time at which the
program started running. When reexecuted, the previous data is cleared.
1.2.1.4.3.Interrupts
In the actual MCU, peripheral I/O (including external interrupt signals) are generating factors for
interrupts. However, PD30SIM has nothing corresponding to peripheral I/O.
PD30SIM provides another method in place of this, which allows you to generate interrupts in a
simulated manner (virtual interrupt function). Virtual interrupts can be generated at any time, e.g., in
a specified cycle or at an executed address.
l
Virtual Interrupt Function
This function defines interrupt generation. Using this function you can generate timer interrupts
and key input interrupts in a simulated manner without having to actually generate them.
6
1. Starting the Debugger
The following shows timings at which virtual interrupts can be generated:
1. When program execution has reached a specified number of cycles.
2. When the program has executed a specified address.
3. Every specified time interval
Virtual interrupts at the above timings can be defined from the I/O Window.
Use of the I/O script function (the function that allows uses to define virtual port input or virtual
interrupt) makes it possible to write timer interrupt.
l
Differences between Virtual Interrupts and Interrupts in Actual Chip
Virtual interrupts differ from interrupts in the actual chip in the following points:
1. Special hardware interrupts cannot be generated as virtual interrupts.
Reset, NMI, DBC, watchdog timer, single-step, address match interrupts cannot be
generated as virtual interrupts.
2. If virtual interrupts of the same priority occur simultaneously
If in the actual chip, multiple interrupts of the same priority occur simultaneously,they
are resolved according to the priority levels set in hardware so that an interrupt of the
highest priority is accepted. For virtual interrupts, however, all interrupts belonging to
one interrupt type (e.g., peripheral I/O interrupt) are handled as having the same priority.
Therefore, if virtual interrupts of the same priority occur simultaneously, the order in
which they are accepted is indeterminate.
There are following two methods to set virtual interrupts.
1. By using the I/O Window
2. By using the I/O script function
With either method, the virtual interrupts are subject to the following limitations.
1. Virtual interrupts set by using the I/O Window
[ Regarding interrupt control for virtual interrupts generated ]
•
Each Interrupt Control Register’s interrupt request bit is not set to 1.
•
The priority levels set in each Interrupt Control Register’s interrupt priority level
select bit are not referenced.
The priority of virtual interrupts can be specified when setting virtual interrupts on
the I/O Window.
•
The Flag Register (FLG)’s interrupt enable flag (I flag) and processor interrupt
priority level (IPL) are referenced as in the actual chip.
2. Virtual interrupts set by using the I/O script function
[ Regarding interrupt control for virtual interrupts generated ]
•
A statement can be written so that when an interrupt occurs, each Interrupt Control
Register’s interrupt request bit is set to 1.
•
The priority levels set in each Interrupt Control Register’s interrupt priority level
select bit can be referenced. However, once a virtual interrupt is generated and
registered in the simulator, the priority of the virtual interrupt cannot be altered
even when the priority levels specified with the interrupt priority level select bit is
changed by the user program.
•
The Flag Register (FLG)’s interrupt enable flag (I flag) and processor interrupt
priority level (IPL) are referenced as in the actual chip.
l
I/O Script Function
This function allows you to write virtual port input and virtual interrupt settings to a file in script
form. Therefore, it provides a more flexible way to define virtual port inputs and virtual interrupts
than can be set from the I/O Window. Specifically, this includes, for example, reading the divideby-N ratios you've set in the timer register and generating a timer interrupt periodically.
7
1.2.1.4.4.Port input/output
l
GUI input function
The GUI input function refers to simulating the user target system’s simple key input panel on a
window. The key input panel is created from the GUI input window.
The input panel can have the following parts placed on it:
[ Buttons ]
Virtual port input or virtual interrupt can be performed by pressing the button. The following
actions can be set for the button:
•
Enter data to a specified memory address (virtual port input)
•
Generate a specified virtual interrupt
•
Generate a specified virtual interrupt and virtual port input at the same time
[ Text ]
Display a text string.
l
GUI output function
The GUI output function refers to simulating the user target system’s simple key output panel on
a window. The key output panel is created from the GUI output window.
The following parts can be arranged on this output panel:
[ Character string ]
User-specified character strings are displayed or erased when some value is written to a specified
memory address or according to logic 1 or 0 in bits.
[ LED ]
LEDs are lit when some value is written to a specified memory address or according to logic 1 or 0
in bits.
[ Text ]
Display a text string.
1.2.1.5 Cycle Count: The CYcle (CY) Command
Use of the CYcle command allows you to know an approximate number of cycles and the execution
time of the program you’ve executed.
The number of cycles are represented using the values listed in the microcomputer’s software manual.
The execution time refers to the target program’s execution time calculated from the cumulative
number of cycles of the CPU instructions executed and the MCU clock and divide-by ratio specified on
the Init dialog box’s MCU tab.
1.2.1.6 Stack Utilization Monitor: The StackMonitor (SM) Command
Use the StackMonitor command to check the maximum and minimum addresses of the stack, and to
determine how much the program has used of what part of the stack.
The stack monitoring continues from the time that a Go or GoFree command is invoked until it is
interrupted, the maximum and minimum values being recorded for the two stack pointers (USP and
ISP registers).
If, while the program is running, it causes a change in the value of a stack pointer,monitoring of stack
utilization of that stack stops at that point.
8
1. Starting the Debugger
1.2.2 PD308SIM Simulation Specifications
1.2.2.1 Operation of Instructions
1.2.2.1.1. Regarding the number of instruction cycles
Time management is exercised in units of cycles. The number of cycles is represented by the values
listed in the microcomputer's software manual.
However, this differs from the actual chip in the following points:
!
!
!
The bus width, queue, and wait states are not considered when measuring the number of
cycles.
The executed cycle of an interrupt sequence is not considered when measuring the number of
cycles.(When an interrupt occurs, the executed cycle of an interrupt sequence is 0.)
PD308SIM starts counting cycles immediately after a reset. (Cycles immediately after a reset
are 0.) The number of cycles needed to execute one machine instruction are added on for each
instruction executed. (See shown below.)
[Note]
Because the number of cycles measured by the emulator does not take into account the bus width,
queue, wait cycles, etc., it includes some error when compared with the number of cycles in the actual
chip.
In the above example, no cycles are added while the ENTER or MOV instruction is being executed. The
cycles required for each instruction are added after instruction execution. Note that the virtual port
input/output and virtual interrupt functions are processed after instruction execution is completed.
1.2.2.1.2. Target program execution time measurement
The target program execution time measurement is calculated from the number of cycles described
above and the MCU clock and divide-by ratio specified on the MCU tab of the Init dialog box.
[Note]
Note]
Because the simulator's execution time measurement is calculated using the number of cycles
described above, it includes some error when compared with the actual chip's execution time.
1.2.2.1.3. WAIT, BRK2
Executed as an NOP instruction.
Other instructions operate the same as those of the actual MCU.
1.2.2.1.4. INT, INTO, UND, BRK
As with the actual MCU, these instructions generate interrupts. (The INTO instruction only
generates an interrupt when the O flag is 1.)
9
1.2.2.2 Resetting
!
!
The SFR area is nonexistent in PD308SIM, so the initialization as in the actual chip is not
performed.
THe cycle count is initialized to 0.
Resetting is performed in the same way as the actual MCU.
A reset is also performed when PD308SIM starts. The value 000F000016 is set in the reset vector
(FFFFC16 to FFFFF16) immediately after starting. The program counter is therefore set to F000016
immediately after PD308SIM starts.
1.2.2.3 Memory
1.2.2.3.1. Memory Space
There is no processor mode. If mapped for memory, the whole 1MB of memory from 0000016 to
FFFFF16 can be read from and written to as RAM.
Note, however, that in the initial state, memory between 1000016 and EFFFF16 is not secured and an
error will result if an attempt is made to access this part of memory. If this occurs while a program is
running, the program will stop with an illegal memory access error. Use the map function, described
later, to map this part of memory.
1.2.2.3.2. Memory Structure and Initial Values Immediately after Starting
The memory is set up as follows immediately after starting PDB308SIM.
00000016
00040016
02000016
FF000016
FFFFFC16
-
0003FF16
01FFFF16
FEFFFF16
FFFFFB16
FFFFFF16
(SFR area)
(reset vector)
Filled with 0016.
Filled with FF16.
No memory immediately after starting
Filled with FF16.
Set to 0000FF0016.
1.2.2.3.3. The Map Function: MAP Command
The PD308SIM simulator divides the memory between 0000016 and FFFFF16 into sixteen equal parts,
so that the memory space can be mapped in 64KB blocks. Note that the blocks with the lowest address
(0000016 to 0FFFF16) and with the highest address (F000016 to FFFFF16) are already mapped when the
simulator starts.
Use the MAP command to map the simulator memory. Memory mapped using this command is
initialized with the value FF16 immediately after being allocated.
When downloading a target program, the memory is mapped automatically.
[Note]
Note]
Memory space that has been mapped cannot be deleted.
1.2.2.3.4. Accessing an Area Without Memory
There is no actual memory in the 253 memory blocks between 02000016 and FEFFFF16 unless memory
is secured. If an attempt is made to access this area, an illegal memory access error occurs and
execution of the command or program stops.
1.2.2.4 I/O
1.2.2.4.1. SFR
The actual chip’s peripheral I/Os other than the CPU core, such as the timers, DMAC, and serial I/O,
are not supported. The SFR area (00000016 to 0003FF16) to which the peripheral I/Os are connected is
also handled as RAM by the simulator.
10
1. Starting the Debugger
However, a method is available that allows you to materialize data input to memory such as the SFR
or interrupts such as timer interrupt in an artificial manner. For details about this method, see “I/O
Script” and “Interrupts” described later.
1.2.2.4.2. I/O Script
!
Virtual Port Input Function
This function defines changes of the data that is input from external devices to a specified memory
address. Using this function you can simulate data inputs to the ports defined in SFR.
The following shows timings at which data can be input to memory:
1. When program execution has reached a specified number of cycles
2. When a specified memory location is accessed for read by a program
3. When a specified virtual interrupt is generated
Virtual interrupts at the above timings can be defined from the I/O Window.
Use of the I/O script function (the function that allows users to define virtual port input or virtual
interrupt) makes it possible to specify more elaborate data input timing such as when the program
performs fetch or writes to memory or when it executed an instruction a specified number of times.
!
Virtual Port Output Function
When a data write to some memory address by the program occurs, this function records the
written data value and the cycle at which the data was written.
The recorded data can be verified in graphic or numeric format from the I/O Window.
The number of data entries that can be recorded by this function equals the number of data
entries specified on the Init dialog box’s I/O script tab reckoning from the time at which the
program started running. When reexecuted, the previous data is cleared.
!
The output port simulate function
The output port simulate function provides an efficient means of simulation. When data are
written to some memory addresses by a program, it allows you to record the written data values.
The recorded data can be displayed on a window or output to a file.
Also, you can verify the data which are output to UARTs by the Printf function.
The number of data entries that can be recorded by this function equals the number of data
entries specified on the Init dialog box's I/O script tab reckoning from the time at which the
program started running. When reexecuted, the previous data is cleared.
1.2.2.4.3. Interrupts
In the actual MCU, peripheral I/O (including external interrupt signals) are generating factors for
interrupts. However, PD308SIM has nothing corresponding to peripheral I/O.
PD308SIM provides another method in place of this, which allows you to generate interrupts in a
simulated manner (virtual interrupt function). Virtual interrupts can be generated at any time, e.g., in
a specified cycle or at an executed address.
!
Virtual Interrupt Function
This function defines interrupt generation. Using this function you can generate timer interrupts
and key input interrupts in a simulated manner without having to actually generate them.
The following shows timings at which virtual interrupts can be generated:
1. When program execution has reached a specified number of cycles.
2. When the program has executed a specified address.
3. Every specified time interval
Virtual interrupts at the above timings can be defined from the I/O Window.
Furthermore, this function can be used in combination with the I/O script function, a function that
allows you to define virtual port inputs and virtual interrupts.
!
Differences between Virtual Interrupts and Interrupts in Actual Chip
Virtual interrupts differ from interrupts in the actual chip in the following points:
11
1. Special hardware interrupts cannot be generated as virtual interrupts.
Reset, NMI, DBC, watchdog timer, single-step, address match interrupts cannot be generated
as virtual interrupts.
2. If virtual interrupts of the same priority occur simultaneously
If in the actual chip, multiple interrupts of the same priority occur simultaneously,they are
resolved according to the priority levels set in hardware so that an interrupt of the highest
priority is accepted. For virtual interrupts, however, all interrupts belonging to one interrupt
type (e.g., peripheral I/O interrupt) are handled as having the same priority. Therefore, if
virtual interrupts of the same priority occur simultaneously, the order in which they are
accepted is indeterminate.
There are following two methods to set virtual interrupts.
1. By using the I/O Window
2. By using the I/O script function
With either method, the virtual interrupts are subject to the following limitations.
1. Virtual interrupts set by using the I/O Window
[ Regarding interrupt control for virtual interrupts generated ]
•
Each Interrupt Control Register’s interrupt request bit is not set to 1.
•
The priority levels set in each Interrupt Control Register’s interrupt priority level select
bit are not referenced.
•
The priority of virtual interrupts can be specified when setting virtual interrupts on the
I/O Window.
•
The Flag Register (FLG)’s interrupt enable flag (I flag) and processor interrupt priority
level (IPL) are referenced as in the actual chip.
2. Virtual interrupts set by using the I/O script function
[ Regarding interrupt control for virtual interrupts generated ]
•
•
•
!
A statement can be written so that when an interrupt occurs, each Interrupt Control
Register’s interrupt request bit is set to 1.
The priority levels set in each Interrupt Control Register’s interrupt priority level select
bit can be referenced. However, once a virtual interrupt is generated and registered in
the simulator, the priority of the virtual interrupt cannot be altered even when the
priority levels specified with the interrupt priority level select bit is changed by the user
program.
The Flag Register (FLG)’s interrupt enable flag (I flag) and processor interrupt priority
level (IPL) are referenced as in the actual chip.
I/O Script Function
This function allows you to write virtual port input and virtual interrupt settings to a file in script
form. Therefore, it provides a more flexible way to define virtual port inputs and virtual interrupts
than can be set from the I/O Window. Specifically, this includes, for example, reading the divideby-N ratios you've set in the timer register and generating a timer interrupt periodically.
1.2.2.4.4. Port input/output
!
GUI input function
The GUI input function refers to simulating the user target system’s simple key input panel on a
window. The key input panel is created from the GUI input window.
The input panel can have the following parts placed on it:
[ Buttons ]
Virtual port input or virtual interrupt can be performed by pressing the button. The following
actions can be set for the button:
12
1. Starting the Debugger
•
•
•
Enter data to a specified memory address (virtual port input)
Generate a specified virtual interrupt
Generate a specified virtual interrupt and virtual port input at the same time
[ Text ]
Display a text string.
!
GUI output function
The GUI output function refers to simulating the user target system’s simple key output panel on
a window. The key output panel is created from the GUI output window.
The following parts can be arranged on this output panel:
[ Character string ]
User-specified character strings are displayed or erased when some value is written to a specified
memory address or according to logic 1 or 0 in bits.
[ LED ]
LEDs are lit when some value is written to a specified memory address or according to logic 1 or 0
in bits.
[ Text ]
Display a text string.
1.2.2.5 Cycle Count: The CYcle (CY) Command
Use of the CYcle command allows you to know an approximate number of cycles and the execution
time of the program you’ve executed.
The number of cycles are represented using the values listed in the microcomputer’s software manual.
The execution time refers to the target program’s execution time calculated from the cumulative
number of cycles of the CPU instructions executed and the MCU clock and divide-by ratio specified on
the Init dialog box’s MCU tab.
1.2.2.6 Stack Utilization Monitor: The StackMonitor (SM) Command
Use the StackMonitor command to check the maximum and minimum addresses of the stack, and to
determine how much the program has used of what part of the stack.
The stack monitoring continues from the time that a Go or GoFree command is invoked until it is
interrupted, the maximum and minimum values being recorded for the two stack pointers (USP and
ISP registers).
If, while the program is running, it causes a change in the value of a stack pointer,monitoring of stack
utilization of that stack stops at that point.
13
1.3 Starting the Debugger
Click the Windows start button, and then select menu:
Program (P) -> [RENESAS-TOOLS] -> [PDxxSIM V.x.xx Release x] -> [PDxxSIM ]
14
2. Setup Debugger
2.
Setup Debugger
The Init dialog box is provided for setting the items that need to be set when the debugger starts up.
The contents set from this dialog box are also effective the next time the debugger starts. The data set
in this dialog remains effective for the next start.
Tab Name
MCU
Debug Information
Compiler
Cross Tool
Resume
Trace
I/O Script
PD308SIM
exist
exist
exist
exist
exist
PD30SIM
exist
exist
exist
exist
exist
exist
Product Name
PD79SIM
PD77SIM
exist
exist
exist
exist
exist
exist
exist
exist
exist
exist
PD38SIM
exist
exist
exist
exist
exist
PD32RSIM
exist
exist
exist
exist
exist
exist
To keep the Init dialog closed next time the debugger is started, check "Next Hide" at the bottom of the
Init dialog.
You can open the Init dialog using either one of the following methods:
l
After the debugger gets started, select Menu - [Environment] -> [Init...].
l
Start PDxx while holding down the Ctrl key.
2.1 MCU Tab
The contents you've specified are also effective the next time you start the debugger.
15
2.1.1 Specifying the MCU file
Click the "Refer" button. This opens a file selection dialog box, so specify the desired MCU file in this
dialog box.
The MCU file is stored in a location below the directory where the PDxxSIM is installed (e.g.,
c:¥mtool¥pdxxsim¥mcufiles).
! The MCU file contains the information specific to the target MCU.
! The MCU file you specify is displayed in the MCU area of the MCU tab.
If the corresponding MCU file is not included in the debugger, you need to create a new MCU file.
For details on how to create, see the following:
! Method of making MCU file (PD308SIM) -> 2.8.1
! Method of making MCU file (PD30SIM) -> 2.8.2
2.1.2 Specifying Clock Frequency
In the Time Count Resource group's MCU Clock area, specify the operating clock of the target MCU (in
MHz). Then, in the Dividing ratio area, specify the divide-by ratio of the target MCU.
When using the MCU with 10 MHz divided by 4, specify "10" for the operating clock and "4" for the
divide-by ratio.
2.2 Debug Information Tab
Specifies storing of debugging information ahead.
The specified content becomes effective when the next being download.
16
2. Setup Debugger
2.2.1 Specify the Storing of Debug Information
To save the debugging information, two methods are available: On Memory, which saves the
information in memory, and On Demand which saves the information in the temporary file.
On Memory
Allows high-speed process because of use of memory.
On Demand
Minimizes use of memory.
Select the saving method (On Memory is set by default).
To select On Demand, specify the temporary file saving directory in the Temp Dir field.
If you do not specify the directory, the system creates a temporary file in the directory in which the
downloaded load module file is saved.
2.3 Compiler Tab
In this tab, only PD30(SIM) exists.
The specified content becomes effective when the next being start.
2.3.1 Specify the Compiler
The output format of the object module (IEEE-695 format) file partially varies depending on the
compiler that you are using.
Therefore, you must specify which compiler created the object module file.
Change the designation according to the compiler that you are using. (NC30 is set by default.)
17
2.4 Cross Tool Tab
In this tab, only PD32RSIM exists.
The specified content becomes effective when the next being start.
2.4.1 Specifying the cross tools used
The format in which object module files are output partly differs with each cross tool used.
Therefore, you need to specify the cross tool with which the object module file was created.
Change the specification here according to the cross tool used. (CC32R is set by default.)
2.5 Resume Tab
The operation when the debugger starts is specified.
The specified content becomes effective when the next being start.
2.5.1 Automatically Execute the Script Commands
To automatically execute the script command at start of Debugger, click the "Refer" button to specify
the script file to be executed.
By clicking the "Refer" button, the File Selection dialog is opened.
The specified script file is displayed in the "Init File:" field.
To disable auto-execution of the script command, erase a character string displayed in the "Init File:"
field.
2.5.2 Restore the Window Status
To restore the window status (window position, window size) after the previous debugger program is
18
2. Setup Debugger
terminated, check the "Resume" check box (Resume is ON by default).
2.5.3 Re-download a Load Module
To re-download a load module (target program), check the "AutoDownLoad" check box (Re-download is
OFF by default).
2.6 Trace Tab
Specify whether or not to enable trace measurement, and when you chose to enable, specify the trace
buffer size.
The contents you specified here are also effective the next time you start the debugger.
To perform trace measurement, check Use Trace Function.
In the Trace Buffer Size area, specify the size of the buffer in which to store the traced data (in K cycle).
2.7 I/O Script Tab
Specify the number of data to be recorded by the I/O Window or Output Port Window's port output
function.
The contents you specified here are also effective the next time you start the debugger.
In the Output Data Num area, specify the number of output data to be recorded.
2.8 Method of making MCU file
2.8.1 Method of making MCU file(PD308SIM)
In the MCU file, write the following contents in the order listed below.
For the file name, specify the MCU name. For the extension, specify ".mcu."
1.
MCU type ("0" or "1")
19
2.
3.
4.
5.
UART0 Transmit/Receive Control Register 1 address
UART1 Transmit/Receive Control Register 1 address
UART0 Transmit Buffer Register address
UART1 Transmit Buffer Register address
The MCU type only needs to be specified for the PD308SIM.
"0" ... Selects the M16C/8x, M16C/7x
"1" ... Selects the M32C/8x
Write each address in hexadecimal. Do not add the prefix that represents the radix.
2.8.1.1 Example
0
365
36D
362
36A
2.8.2 Method of making MCU file(PD30SIM)
In the MCU file, write the following contents in the order listed below.
For the file name, specify the MCU name. For the extension, specify ".mcu."
1.
2.
3.
4.
5.
6.
7.
8.
UART0 Transmit/Receive Control Register 1 address
UART1 Transmit/Receive Control Register 1 address
UART0 Transmit Buffer Register address
UART1 Transmit Buffer Register address
Reset Vector address
Undefined Instruction Interrupt Vector address
Overflow Interruput Vector address
BRK Instruction Interrupt Vector address
Write each address in hexadecimal. Do not add the prefix that represents the radix.
2.8.2.1 Example
3A5
3AD
3A2
3AA
FFFFC
FFFDC
FFFE0
FFFE4
20
3 Simulator engine setup
3.
Simulator engine setup
3.1 Simulator engine setup
When Simulator engine simxx starts up, it is registered in the system tray.
Right-clicking on the running simxx and selecting [Version...] from the menu bar will open up the
Version Information dialog box.
l
Auto Exit Switch Setting
By checking the Auto exit check box, simxx can be terminated at the same time the simulator
debugger front-end pdxxsim finishes.
l
Communications Connection Status
CONNECT is displayed when connected to pdxxsim. CUT is displayed when there is no
connection.
l
Simulator MCU Status (RUN/STOP)
RUN is displayed when the simulator MCU is running, STOP when stopped.
l
OK button
Closes the Version Information dialog box
l
Exit button
Exits simxx. Note that you cannot exit simxx while connected to pdxxsim.
21
4.
Environmental Setting of Debugger
Specify debugger environment setting in the Customize dialog.
You can open this dialog by selecting menu - [Environment] -> [Customize...].
The data set in this dialog remains effective for the next start.
Tab
ShortcutKey
Download
Font
Path
Tool Entry
Other
Description
Register the menus to the shortcut keys
Setting the automatically Down-load of the Load Module
Setting the number of load module download histories
Specify the font
Specify the default font for the characters displayed by PDxx.
Specify the Search Path of Source Files
Specify the Saving Directory of Information File
Setting the Make File
Specify the Editor
Setting the display of the Termination Confirmation Dialog
Setting the debugger Forced Ending when Error Occurs
Setting the target Continuance Execution when Debugger Ends
Setting the display of the Absolute Path of Source File
Control the Display Mode Switching of Program Window
Specify the number of execution history of script command
22
4. Environmental Setting of Debugger
You can also customize the buttons in the tool bar.
4.1 ShortcutKey Tab
The specified content becomes effective when the next being start.
4.1.1 Register the menus to the shortcut keys
You can register the menus to the shortcut keys.
You can also register execution of the script file and opening of the Custom window to the shortcut
keys.
l Assignable shortcut keys are any one key*, or combination of Shift/Ctrl/Alt keys + any one key*.
*Any one key covers the following:
Alphabet key
Numeric key
Function key
Symbol key (",", "@", ":" etc.)
l When the shortcut key information is changed, the following dialog appears when exiting from the
Customize dialog (when clicking the "OK" button) asking you whether you want to save the
changed data or not.
When you save the changed data, the data is automatically loaded at the next start of PDxx.
<<Specification of Shortcut Key Tab>>
Key Assign Group
23
Category combo box
Displays the menu category. The enabled menus in the selected category are displayed in
the Menu List list box.
The category name [Main Menu] indicates all the menus except the option menus of
each window.
When the category of the window name is selected, the menu options available in
that window become enabled.
When the category name [Custom Window] is selected, the registered Custom
windows become enabled.
When the category name [Script Command] is selected, the registered script
commands become enabled.
Menu List list box
Lists the menus enabled in the menu category selected in the Category combo box. The
listed menus are sorted in the alphabet order.
Key edit box
Specifies the shortcut key to be assigned to the menu selected in the Menu List list box.
Current Key Assign list box
Displays the shortcut key to be assigned to the menu selected in the Menu List list box.
ADD button
Enables the shortcut key specified in the Key Edit box.
DEL button
Disables the shortcut key selected from the Current Key Assign list box.
Current Shortcut Key List Group
Group
Lists the preset shortcut keys.
SAVE button
Saves the shortcut key information displayed in the Current Shortcut Key List group in a file.
LOAD button
Reads the shortcut key information from a file.
SCR button
Registers a script to be assigned to the shortcut key.
CB button
Registers the Custom window to be assigned to the shortcut key.
<<Registering
<<Registering the shortcut key>>
key>>
1.
Select the category of the menu to be registered in the Category combo box in the Key Assign
group.
The menus available for the category are displayed in the Menu List list box
2.
Select the menu to be registered from the Menu List list box and click the Key exit box.
PDxx is now waiting for the entry of shortcut key.
3.
Press the shortcut key to be assigned. The content of the shortcut key is displayed in the Key edit
box.
4.
Click the ADD button below the Current Key Assign list box.
<<Deleting
<<Deleting the shortcut key>>
key>>
1.
Select the shortcut key to be deleted using one of the following methods:
!
Select the shortcut key from the list in the Current Shortcut Key List group.
24
4. Environmental Setting of Debugger
2.
!
Select the Menu List list box in the Key Assign group.
Click the DEL button in the Current Shortcut Key List group.
<<Saving/reading
<<Saving/reading the shortcut key>>
key>>
To use (save/read) the assigned shortcut key information separately, you need to specify the file.
Click the SAVE button and specify the file name.
To read the shortcut key information, click the LOAD button and specify the file name.
All of the registered shortcut key information is deleted.
ATTENTION
!
!
!
You cannot assign the same shortcut key to multiple menus. If you register the assigned key, the
information on the previously assigned shortcut key is overwritten.
The shortcut key is enabled only for the active window. If two or more same windows are opened,
the shortcut key is not reflected to all of them.
The shortcut key is enabled only for the active window. If two or more same windows are opened,
the shortcut key is not reflected to all of them.
4.2 Download Tab
The specified content becomes effective when the next being start.
4.2.1 Automatically Down-load of the Load Module
When the downloaded load module is updated by re-compile assemble, the file can be autodownloaded.
The load module is updated at timing when it is operated by a command of execution group (Go, Step,
etc).
In the Auto Download group, select any one of the following ("Disable" is selected by default).
25
Enable (with confirmation)
Enable (without confirmation)
Disable
Asks for confirmation at auto-download.
Does not ask for confirmation at auto-download.
Does not auto-download the load module file.
4.2.2 Setting the number of load module download histories
You can set the number of load module download histories ("4" is set by default).
Specify the number of histories in the File History Number field in the File History group. You can
specify the number from 1 to 16.
4.3 Font Tab
The specified content becomes effective when the next being start.
4.3.1 Specify the font
Specify the default font for the characters displayed by PDxx.
Click the "Font..." button. The Font selection dialog opens. Enter the font and font size.
Note
You can set the font independently in each window. With the target window active, select [Option]>[Font...] from the menu in the PDxx Window to open the font selection dialog.
4.3.2 Specify the Displaying Tab Width
In a window, which displays the source files (Program Window, Coverage source window, etc.), you can
specify the display tab width.
Specify the default tab values for the Program Window, Source Window. You can specify TAB values
between 1 and 32.
Note
You can set the tab width by window.
Select the PDxx window Menu - [Option] -> [TAB] while the target window is active.
The TAB designation dialog is opened.
4.4 Path Tab
The specified content becomes effective when the next being start.
26
4. Environmental Setting of Debugger
4.4.1 Specify the Search Path of Source Files
You can specify the directory position (search path) of the source file to be displayed in a window such
as the Program Window.
This method is useful when the source file does not exist in the current directory or divided into
multiple directories.
To register the search path, click the Add... button in the File Search Path group.
The folder selection dialog is opened.
Specify the directory in which the source file exists.
To delete a certain search path, click the target search path and click the Delete button.
To delete all search paths, click the Delete All button.
4.4.2 Specify the Saving Directory of Information File
You can specify the directory in which the ASM/C watch point information file and other information
file are saved.
Other files cover the following:
!
Script command execution history file
!
Break information file
The default saving destination directory of the ASM/C watch point information file is a directory in
which the load module exists.
The default saving destination directory of other information file is a directory in which PDxxSIM has
been installed (example: c:¥mtool¥pdxxsim).
27
To change the directory in which the ASM/C watch point information file is saved, reset a check mark
from the "Use the same directory as the absolute module file" check box in the Directory Setting group.
Then, the "Watch Points:" field is enabled.
Click the Refer... button on the right of the "Watch Points:" field and specify the saving destination
directory from the Directory Selection dialog.
To change to directory, in which other information file is saved, click the Refer... button on the right of
the "Other Settings:" field and specify the saving destination directory from the Directory Selection
dialog.
4.5 Tool Entry Tab
The specified content becomes effective when the next being start.
4.5.1 Execute the Make File
Prepare a PIF file to start the Make file.
Click the Refer button in the Make group. The Directory Selection dialog is opened.
Specify the directory in which the Make file exists.
Name the PIF file to be registered in the PIF Filename field.
4.5.1.1 Creating a PIF file
1. Create a keyboard shortcut for command.com located in the Windows directory.
Command.com is in the Windows directory in Windows Me/98/95. It is in the system32 directory
(The example: ¥winnt¥system32) under the Windows directory in Windows 2000/NT4.0.
2. For the keyboard shortcut thus created, assign a file name xxxxx.pif (xxxxx denotes a name
specified by the user) and moves the file into the directory that contains makefile.
3. Open the property dialog box for this file and input the same command in the command line of this
dialog box that was input on the DOS window.
4. Open the property dialog box for this file and input the same command in the command line of this
dialog box that was input from the DOS window.
28
4. Environmental Setting of Debugger
4.5.2 Specify the Editor
You can start the Editor in a window, which displays the source file (Program window, Coverage
source window).
Click the Refer button in the Editor group. The File Selection dialog is opened.
Specify the item file of the editor to be used.
Specify the editor parameter in the Argument field.
File names are stored in "%F", and line numbers are stored in "%L".
To specify the editor options, see the Editor Manual/Help.
4.6 Other Tab
The specified content becomes effective when the next being start.
29
4.6.1 Display the Termination Confirmation Dialog
You can set a parameter so that the termination confirmation dialog will not be opened, which is
supposed to be opened when exiting from the debugger.
To keep the dialog closed, remove a check mark from the above check box in the Exit group.
4.6.2 Debugger Forced Ending when Error Occurs
You can set a parameter so that the debugger will not be forced to end when a communication error
occurs (The debugger is forced to end by default).
To do this, remove a check mark from the above check box in the Exit group.
4.6.3 Target Continuance Execution when Debugger Ends(not supported
for the PDxxSIM)
When exiting from the debugger during execution of the target program, you can select to continue
execution or stop execution of the emulator (The emulator is stopped by default).
To continue execution, remove a check mark from the above check box in the Exit group.
ATTENTION
The target program, which is executed continuously, cannot be re-controlled next time the debugger
gets started.
To start the debugger, press the system reset switch on the emulator to reset the target program.
4.6.4 Enabling multiple startup(not supported for the PDxxSIM)
Multiple PDxx startup can be enabled (By default, multiple startup is disabled.).
To enable multiple startup, check the above check box included in the Exit group.
30
4. Environmental Setting of Debugger
4.6.5 Display the Absolute Path of Source File
When the file name is displayed with the absolute path in the title bar in the Program (Source) window,
you can hide the absolute path from the screen.
To hide the file path, check the above check box in the Other Setting group.
4.6.6 Control the Display Mode Switching of Program Window
You can set switching of the display mode at stop of the target program to "Suppress" (keep the current
display mode) in the Program window (However, the display mode may be switched depending on
where the target program is stopped).
To control the display mode switching, check the above check box in the Other Setting group.
4.6.7 Execution History of Script Command
You can save the execution history of the script command (Ten sets of history data are saved by
default).
To change the history of script commands, specify the number of history in the Number of Commands
field. (0 to 100) To clear history of script commands, remove a check mark from the above check box in
the Other Setting group.
4.6.8 Source file update warning
If any source file exists that has been updated after creating the target program, an warning dialog box
can be displayed when issuing the commands associated with target execution. (Warned, by default)
If source file update warnings are unnecessary, uncheck the above check box. If the check box is
checked, the warning dialog box shown below appears
Choosing "No" in this warning dialog box cancels the target execution command that was going to be
issued. Build and download the target program.
Choosing "Yes" accepts the target execution command that was going to be issued, so that the
command is processed normally. From the next time on (until the next time downloading is processed),
no warnings will be displayed even when using target execution commands.
If the warning dialog box is closed by checking the Next Hide check box, no source file update warnings
are displayed from the next time on (This is the same as when the Warn to update the target program
check box is unchecked.).
31
4.7 Customizing of Toolbar
The toolbar buttons on each window can be customized. To customize any button, right-click on the
window's toolbar. The popup menu shown below appears.
Flat style
Text labels
Labels on right side
Customize…
Flattens the button when checked.
Shows text below the button when checked.
Shows text to the right of the button when checked.
Opens a toolbar customize dialog box.
4.7.1 Assigning Buttons to the Toolbar
To do this, select the menu “Customize…” or double-click an area in which no button is placed in the
tool bar in the window. The Customize Tool Bar dialog opened.
!
!
The buttons corresponding to the option menus in the window are provided.
You can only add the buttons, which are enabled in each window. You cannot add the buttons for
other windows.
4.7.1.1 Adding a button
Click the buttons to be added in the "Available Button" list box at right of the Customize Tool Bar
dialog. Then, click the "Add" button in the center of the dialog.
4.7.1.2 Deleting a button
Click the button to be deleted in "Tool Bar Button" list box at left of the Customize Tool Bar dialog.
Then, click the "Delete" button in the center of the dialog.
4.7.1.3 Changing the button display order
Use the "Up" button or "Down" button at right of the dialog to change the display order. Click the
button for which the display order is to be changed in the "Tool Bar Button" list box at left of the
Customize Tool Bar dialog. Then, click the "Up" or "Down" button to change the display position.
4.7.1.4 Resetting the display buttons
Click the "Help" button at right of the dialog. The display buttons are reset to the default settings.
32
5. Ending the Debugger
5.
Ending the Debugger
To ending the debugger, select Menu - [File] -> [Exit]. The Confirmation dialog opens.
When ending the PDxx, click the "OK" button.
"Other Tab of Customize Dialog"
To keep the dialog closed, refer to “4.6.1 Display the Termination Confirmation Dialog”.
33
[MEMO]
34
Reference
35
36
1. Windows / Dialogs
1.
Windows / Dialogs
l Windows
The window of this debugger is shown below.
Window Name
PDxxSIM Window
Program Window
Source Window
Register Window
Memory Window
Dump Window
RAM Monitor Window
ASM Watch Window
C Watch Window
Local Window
File Local Window
Global Window
Call Stack Window *1
Script Window
Trace Point Setting Window
Trace Window
Coverage Window
MR Window *1
I/O Window
GUI Input Window
GUI Output Window
Outport Window
*1 Not support PD38 (SIM).
37
! Dialogs
The dialog of this debugger is shown below.
Dialog
S/W Break Point Setting Dialog Box
H/W Break Point Setting Dialog Box
1.1 PDxxSIM Window
The PDxx Window is the main window for PDxx. This window displays the main commands on a
toolbar. You can click on the buttons on this toolbar to run the target program in normal or one-step
mode. The main display area accommodates windows such as the Target Program Window.
1.1.1 Configuration of PDxxSIM Window
!
!
!
The main commands, such as execution/stop of the target program and step execution, are located
to the tool bar.
The Option menu is dependent on the active window.
When the active window is changed, the Option menu is automatically changed.
The status bar at the bottom of the PDxx window shows the following information:
Explanation/display of menus and buttons
Execution time required from start to end of the target program execution
Execution state of the target program (during execution or execution stopped)
38
1. Windows / Dialogs
1.1.2 Tool Bar
A basic operation is allocated to the toolbar.
Button
Name
Contents
Go
Execute target Program.
Come
Execute the target program from the value in the program counter to the
position of the cursor.
Step
One-step execution of target program.
Over
Step over function/subroutine call.
Return
Run the program up to the higher routine.
Stop
Stop execution of the target program.
Break
Set S/W breakpoint.
Reset
Set H/W breakpoint.
SW
Set S/W breakpoint.
HW
Set H/W breakpoint.
1.1.3 Option
In the PDxx window, the following menus are prepared.
File Operation
Menu
Menu Options
File
Download
Load Module...
Edit
Download target program
Memory Image...
Download machine language data and debugging
information
Download only machine language data
Symbol...
Download only debugging information
Rom Data...
Editing
Menu
Function
Additional download machine language data
Reload...
Reload target program
Upload...
Upload target program
Save Disasm...
Save disassembly result
(Download File)
List the file name of target program downloaded
Exit
Terminate PDxx
Menu Options
Function
Copy
Copy character strings specified to clipboard.
Paste
Paste character strings of clipboard.
Cut
Cut character strings specified to clipboard.
Delete
Cut character strings specified.
Undo
Undo of edit.
39
Display
Menu
View
Setup
Menu
Find…
Find character strings
Menu Options
Function
Tool Bar
Switch display or non-display of toolbar
Status Bar
Switch display or non-display of status bar
Tool Bar(Child)
Switch display or non-display of toolbar (child window)
Menu Options
Function
Environment Init…
Startup function settings
Customize…
Open Customize dialog box
Debugging (Basic)
Menu
Menu Options
Debug
Environment setup(open the Init dialog box)
Start Up…
Go
Function
Start target program
Go
Run from current program counter
Go Option...
Run from specified address
GoFree
Free-run target program
Come
Run to cursor position
Step
Step execution
Step
Step Option...
Over
Execute one step
Execute specified No. of steps
Over-step execution
Over
Execute one over-step
Over Option…
Execute specified No. of over-steps
Return
Execute until return from current subroutine
Reset
Reset target program
Stop
Stop target program
Break Point
Set break point
S/W Break Point...
Open S/W Break Point Setting dialog box
H/W Break Point...
Open H/W Break Point Setting Window box.
Chip Break Point... *
Break
CB... *
Open Chip Break Point Setting dialog box
Set/cancel software break at cursor
Reference/Deleting dialog box
Trace Point...
Open Trace Point Setting Window
Scope...
Open Scope Setting dialog box
Make
Make target program
*Does not exist in PD308, PD30, PD77 PD38 and PDxxSIM.
Debugging (Option)
Menu
Menu Options
Option
Window Operations (Basic Window)
Menu
Menu Options
Basic
Windows
Function
The content of option menu depends on the active window.
The content of the menu changes automatically when an active window changes.
Please refer to the reference of each window for the content of the menu of each window.
Cascade
Function
Cascade windows
40
1. Windows / Dialogs
Title
Tile windows
Arrange Icon
Arrange icons
Program Window
Make Program Window active
Source Window
Open Source Window
Register Window
Open Register Window
Memory Window
Open Memory Window
Dump Window
Open Dump Window
RAM Monitor Window
Open RAM Monitor Window
ASM Watch Window
Open ASM Watch Window
C Watch Windows
Open C (language-level) Watch Window
C Watch Window
Open C Watch Window
Local Window
Open Local Window
File Local Window
Open File Local Window
Global Window
Open Global Window
Call Stack Window*
Open Call Stack Window
Script Window
Open Script Window
*Dose not support in PD38(SIM).
Window Operations (Optional Window)
Menu
Menu Options
Optional
Windows
IO Window
Open IO Window
GUI Windows
Open GUI Window
GUI Input Window
GUI Output Window
Help
Menu
Help
Function
Open GUI Input Window
Output Window
Open GUI Input Window
Open Output Window
MR Window
Open MR Window
Trace Window
Open Trace Window
Coverage Window
Open Coverage Window
Custom Windows
Custom Windows
Option
Entry Custom Window
(Custom Window)
Open the custom window
Menu Options
Function
Contents
Display Help
Active Window
Display Help of Active Window
About...
Display version information
1.2 Program Window
The Program window always displays the source file corresponding to the current program counter
position.
This window is opened automatically at start. The background of the program counter position is
displayed in yellow.
This window allows you to execute the source program up to the cursor position, set/reset the software
breakpoint, and perform line assemble.
The Program window provides the three display modes as below:
! Source display mode
Displays the source file of the target program.Can also be used to edit the source file.
! Disassemble Mode
41
!
Displays the disassemble result of the target program.
MIX display mode
Displays the source file of the target program and its disassemble result in a mixed style.
1.2.1 Configuration of Source Display Mode
The program window has the following two source display modes. These display modes can be changed
from menus on the program window.
! Debug mode
This mode is used to debug (e.g., run or stop) the target program.
! Edit mode
This mode is used to edit the source file.
The program window's source display mode (debug mode) is configured as shown below.
!
!
!
!
!
!
!
!
You can switch "Display/Hide" for the line number display area / address display area.
You can change the source file to be displayed by double-clicking the line number display area.
You can change the display start address/display start line by double-clicking the address
display area.
You can set/reset the breakpoint by clicking (or double-clicking) the breakpoint display area.
By staying the mouse cursor on a C language variable for a given period of time (about 0.5
second), the variable data is popped up.
You can drag the function name and then click the mouse right button to display the source file
corresponding to the function.
You can drag the C language variable and then click the mouse right button to register the
variable as the C watch point.
You can drag the assembler symbol and then click the mouse right button to register the symbol
as the ASM watch point.
42
1. Windows / Dialogs
You can open the displayed source file on the editor (You must have registered the editor name).
The source file being displayed can be edited on the window.
You can display the coverage measurement result by specifying the option (It is not displayed by
default).
! You can line-assemble the clicked position.
!
!
!
The program window's source display mode (edit mode) is configured as shown below.
!
!
!
The line number display, address display, and breakpoint display areas are not shown.
The right-click menu changes for exclusive use in edit mode.
The status bar on the PDxxSIM window shows the line and column numbers of the cursor
position.
1.2.2 Configuration of MIX Display Mode
The mix display mode of the window is the following configurations.
43
!
!
!
!
!
!
!
!
!
!
You can switch "Display / Hide" for the line number display area / address display area / object
code display area.
You can change the source file to be displayed by double-clicking the line number display area.
You can change the display start address / display start line by double-clicking the address
display area.
You can set / reset the breakpoint by clicking (or double clicking) the breakpoint display area.
You can change the display ratio between the object code display area and the label display area,
and between the label display area and the program display area, using the mouse.
You can open the displayed source file on the editor (You must have registered the editor name).
You can display the coverage measurement result by specifying the option (It is not displayed by
default).
The MIX display result can be saved as a text file.
You can line-assemble the clicked position.
You can scroll the display up/down in units of source line.
1.2.3 Configuration of Disassemble Display Mode
The disassemble display mode of the window is the following configurations.
44
1. Windows / Dialogs
You can switch "Display / Hide" for the address display area/object code display area.
You can change the display start address by double-clicking the address display area.
You can set / reset the breakpoint by clicking (or double clicking) the breakpoint display area.
You can change the display ratio between the object code display area and the label display area,
and between the label display area and the program display area, using the mouse.
! You can display the coverage measurement result by specifying the option (It is not displayed by
default).
! You can line-assemble the clicked position.
!
!
!
!
1.2.4 Extended Menus
The Program window provides the following menu when being active (This menu is called Program
window option).
Menu
Option
Menu Options
Function
Font...
Change font
TAB...
Set source file display tabs
Color...
Change display color
View
Change contents of display
Source...
Display from specified source file or function
Address...
Display from specified address or line No
Program Counter
Display from current program counter
Mode
Switch display mode
45
Source Mode
Mix Mode
Disasm Mode
Switch to source display mode
Switch to MIX display mode
Switch to disassemble display mode
Layout
Line Area
Address Area
Code Area
Set layout
Turn on / off line No. area
Turn on / off address area
Turn on / off object code area
Line Assemble...
Open Line Assemble dialog
Save Mix…
Saves MIX display result
Coverage
On/Off
Base...
Clear
Refresh
Set Coverage measurement
Turn on / off Measurement result
Change coverage RAM base address
Initialize coverage measurement result
Update display of coverage measurement result
Edit
On
Save
Save As…
Save All
Edit functions
Turns editing on or off
Saves the edited contents by overwriting
Saves the edited contents with another name
Saves all of the edited contents by overwriting
1.2.5 Shortcut Menu
The Program window provides the shortcut menu by clicking the mouse right button within the window
(This menu is called Program window right-click menu).
The menu content varies depending on the clicked position.
When right-clicking the line number display area or address display area:
The shortcut menu same as the option menu appears.
l When right-clicking the breakpoint display area:
The shortcut menu does not appear. Hardware break can be set.
l When right-clicking other area:
The following shortcut menu appears.
l
(Debug Mode)
Menu
Right-Click
(Edit Mode)
Menu
Right-Click
Menu Options
Function
Jump to function
Open Source Window
Display the selected function
Display the selected function(by Source Window)
Add C Watch...
Add C Watch Pointer…
Add ASM Watch…
BitAdd ASM Watch…
Register the C watch point on selected variable
Register the C watch point on selected pointer variable
Register the ASM watch point on selected symbol
Register the ASM watch point on selected bit symbol
Open with HEW
Open Editor
Line Assemble...
Open the source file with the HEW
Open the source file with the editor
Open the Line Assemble dialog
Save Mix…
Saves MIX display result
Edit
On
Edit functions
Turns editing on or off
Menu Options
Copy
Function
Copy character strings specified to clipboard.
46
1. Windows / Dialogs
Paste
Cut
Delete
Undo
Paste character strings of clipboard.
Cut character strings specified to clipboard.
Cut character strings specified.
Undo of edit.
Find
Find character strings.
Font
Tab
Change font.
Set source file display tabs.
Edit
On
Save
Save As …
Save All
Edit functions
Turns editing on or off
Saves the edited contents by overwriting
Saves the edited contents with another name
Saves all of the edited contents by overwriting
1.3 Source Window
The Source window continuously displays any position of the source file. (The Program window always
displays the source file corresponding to the current program counter position.)
When the program counter points the displayed source file position, its background is displayed in
yellow.
Like the Program window, the Source window allows you to execute the source program up to the
cursor position, set/reset the software breakpoint and perform line-assemble.
You can open up to 30 Source windows.
1.3.1 Configuration of Source Window
The Source Window configuration, toolbar and option menu is the same as that in the Program
Window.
1.4 Register Window
The Register window displays the register data and flag data. You can change a register/flag value
from the window.
1.4.1 Configuration of Register Window
The figure below shows a Register window of the debugger PD30 (SIM) for M16C/60, 20 series.
47
If a register/flag value is changed, the value is displayed in red.
Double-clicking the register display line opens a dialog, which allows you to change a register
value.
! You can change a flag value by clicking the button corresponding to the flag.
! The right-click menu allows you to change the display radix point and the register bank (Only
PD308 (SIM) and PD30 (SIM) support the register bank switching function).
! You can change the display ratio between the register name display area and the register value
display area, and between the register value display area and the radix point display area, using
the mouse.
!
!
1.4.2 Extended Menus
The Register window provides the following menu when being active (This menu is called Register
window option).
Menu
Menu Options
Function
Option
Bank0*1
Display registers of bank 0
Bank1*1
Display registers of bank 1
Hide DPR1-3*2
Turn on/off DPR 1, DPR 2, DPR 3 registers
Layout
Set layout
Hide Radix
Turn on/off radix
Hide FLAGs
Turn on/off flags display area
Font...
Change font
*1 Only PD308 (SIM) / PD30 (SIM)
*2 Only PD79 (SIM)
1.4.3 Shortcut Menu
Press the right button on the register display area in Register Window to display shortcut menu.
Menu
Menu Options
Function
Right Click
Hex
Display in hexadecimal
Dec
Display in decimal
Bin
Display in binary
Bank0*
Display registers of bank 0
48
1. Windows / Dialogs
Bank1*
Display registers of bank 1
Layout
Set layout
Hide Radix
Turn on/off radix
Hide FLAGs
Turn on/off flags display area
Font...
Change font
* Only PD308 (SIM) / PD30 (SIM)
1.5 Memory Window
The Memory Window displays the contents of contiguous memory in "address", "label", and "data
(contents of memory)" formats.
The display is updated after each command is executed. Data can be displayed in binary, decimal,
hexadecimal, and ASCII. You can open up to 30 Memory Windows.
You can use the Memory Windows to modify the contents of memory, and also to fill and move
specified blocks of memory.
1.5.1 Configuration of Memory Window
You can select the display data from 1 byte, 2 bytes, 4 bytes (PD38 (SIM) does not support a
display in 4 bytes), binary, decimal, hexadecimal, ASCII, SJIS and JIS (The display data is set to
the 1 byte hexadecimal format by default).
! You can select the window open menu while holding down the Ctrl key to specify the display
start address.
! Double-clicking the address display area opens a dialog, which allows you to change the display
start address.
! A dialog, which allows you to change the memory data at the clicked address by double-clicking
!
49
the label display area/memory data, display area.
A memory cache is provided to speed up display (By default, cache is set to "Disable").
You can change the display ratio between the label display area and the memory data display
area using the mouse.
! Can keep track of the stack pointer position. (Not tracked by default.)
!
!
1.5.2 Option Menu
The Memory window provides the following menu when being active (This menu is called Memory
window option).
Menu
Option
Menu Options
Change font
View
Change contents of display
Scroll Area...
Address...
(xxxxx) *1
Followed Stack Pointer…
Data Length
Byte
Word
Lword*2
Radix
Bin
Dec
Hex
ASCII
Specify scroll range
Specify display starting address
(Product dependence menu)
Keep tracking of the stack pointer position.
Specify data length
Display in 1-byte units
Display in 2-byte units
Display in 4-byte units
Specify data radix
Display in binary
Display in decimal
Display in hexadecimal
Display as ASCII characters
SJIS
JIS
Refresh
Display as SJIS characters
Display as JIS characters
Refresh display
Debug
*2 Does
Functions
Font
Set memory contents
Set...
Fill...
Set data at specified address
Fill specified memory block with data
Move...
Move specified memory block to specified Address
Cache On
Use the cache of memory
not exist in PD38 (SIM). In PD79 (SIM) / PD77 (SIM), it is displayed as “Dword”.
*1 Product Dependence Menu
Product
PD308(SIM),
PD30(SIM)
PD79(SIM)
PD77(SIM)
PD38(SIM)
Menu Options
FB
SB
USP
ISP
S
DPR0
DPR1
DPR2
DPR3
S
DPR
S
Function
Change display starting address to value of FB register
Change display starting address to value of SB register
Change display starting address to value of USP register
Change display starting address to value of ISP register
Change display starting address to value of Stack Pointer
Change display starting address to value of DPR0 register
Change display starting address to value of DPR1 register
Change display starting address to value of DPR2 register
Change display starting address to value of DPR3 register
Change display starting address to value of Stack Pointer.
Change display starting address to value of DPR register.
Change display starting address to value of Stack Pointer.
Change display starting address to value of Stack Pointer.
50
1. Windows / Dialogs
1.5.3 Shortcut Menu
The Memory window provides the shortcut menu by clicking the mouse right button in the window.
Menu
Right-Click
Set…
Menu Options
Functions
Set data at specified address.
Fill…
Fill specified memory block with data.
Move
Byte
Word
Lword
Radix
Bin
Dec
Hex
ASCII
SJIS
JIS
Register
(xxxxx)
Move specified memory block to specified Address.
Display in 1-byte units
Display in 2-byte units
Display in 4-byte units
Specify data radix
Display in binary
Display in decimal
Display in hexadecimal
Display as ASCII characters
Display as SJIS characters
Display as JIS characters
Display the specified register.
(Product dependence menu)
Followed Stack Pointer
Refresh
Scroll Area...
Keep tracking of the stack pointer position.
Refresh display.
Specify scroll range.
Font...
Change font.
1.6 Dump Window
The Dump Window displays the contents of contiguous memory in dump format.
The display is updated after each command is executed. You can open up to 30 Dump Windows.
You can use the Dump Windows to modify the contents of memory, and also to fill and move specified
blocks of memory.
1.6.1 Configuration of Register Window
The display is updated after each command is executed. You can open up to 30 Dump Windows.
You can use the Dump Windows to modify the contents of memory, and also to fill and move specified
blocks of memory.
51
!
!
!
!
!
You can select the display data from 1 byte, 2 bytes, 4 bytes (PD38 (SIM) does not support a
display in 4 bytes), decimal, hexadecimal, ASCII, SJIS and JIS (The display data is set to the 1
byte hexadecimal format by default).
You can select the window open menu while holding down the Ctrl key to specify the display
start address.
Double-click the address display area to change the display starting address.
Double-click a label or the memory display area to change the contents of memory.
A memory cache is provided to speed up display (By default, cache is set to "Disable").
1.6.2 Extended Menus
The Dump window provides the following menu when being active (This menu is called Dump window
option).
Menu
Option
Menu Options
Font
View
Scroll Area...
Address...
Data Length
Byte
Word
Lword *
Radix
Dec
Hex
ASCII
SJIS
JIS
Refresh
Debug
Set...
Fill...
Move...
Cache On
Function
Change font
Change contents of display
Specify scroll range
Specify display starting address
Specify data length
Display in 1-byte units
Display in 2-byte units
Display in 4-byte units
Specify radix
Display in decimal
Display in hexadecimal
Display as ASCII characters
Display as SJIS characters
Display as JIS characters
Refresh display
Set memory contents
Set data at specified address
Fill specified memory block with data
Move specified memory block to specified Address
Use the cache of memory
52
1. Windows / Dialogs
*Does not exist in PD38 (SIM). In PD79 (SIM) / PD77 (SIM), it is displayed as “Dword”.
1.6.3 Shortcut Menu
The Dump window provides the shortcut menu by clicking the mouse right button in the window.
Menu
Right-Click
Set…
Menu Options
Functions
Set data at specified address.
Fill…
Fill specified memory block with data.
Move
Byte
Word
Lword
Radix
Bin
Dec
Hex
ASCII
SJIS
JIS
Refresh
Scroll Area...
Move specified memory block to specified Address.
Display in 1-byte units
Display in 2-byte units
Display in 4-byte units
Specify data radix
Display in binary
Display in decimal
Display in hexadecimal
Display as ASCII characters
Display as SJIS characters
Display as JIS characters
Refresh display.
Specify scroll range.
Font...
Change font.
1.7 RAM Monitor Window
The RAM Monitor Window displays the contents of memory in the RAM monitor area in dump format.
Up to 10 RAM monitor windows can be opened. The display is updated at constant intervals (default =
100ms) during execute ion of the target program. You can set any contiguous address area as the RAM
monitor area.
1.7.1 Configuration of RAM Monitor Window
The default RAM monitor area is from 0h to 3FFh. By clicking the Area button, a dialog is
opened, which allows you to change the RAM monitor area.
! By double-clicking the address display area, a dialog is opened, which allows you to change the
!
53
!
!
!
!
!
display start address. If the specified address is outside the RAM monitor area, the RAM monitor
area is also changed.
The update interval during execution of the target program is displayed in the update interval
display field. (When the target is stopped, a character string "Address" is displayed.)
The update interval may be delayed from the specified update interval depending on the
operational factors (listed below).
Host machine performance
Window size (memory display capacity)
Number of memories in which the values have been changed
The background color of the data display area and ASCII code display area change as below
depending on the access attribute (Without any access, the background color is white).
Address which is accessed to read.
The background color turns green.
Address which is accessed to write.
The background color turns red.
You can change the display color by specifying an option.
The access attribute is cleared through the following action:
Click the Clear button.
Download the target program.
You can select the display data from 1 byte, 2 bytes, 4 bytes (PD38 (SIM) does not support a
display in 4 bytes), decimal, hexadecimal, ASCII, SJIS and JIS (The display data is set to the 1
byte hexadecimal format by default).
ATTENTION
The real-time RAM monitor function acquires the data of the bus access.
Therefore, changes in the RAM/SFR area without the access by the target program are not
reflected.
! If you are displaying data in the RAM monitor area in 2-byte or 4-byte units (by selecting Word
or Lword under [Option] -> [View] -> [Data Length]), the memory access attribute may differ for
each of the bytes. If there are such mismatches in the access attributes within one data item, the
data item is displayed in parentheses, as shown below. Note that the memory display background
color is set to the color for the access attribute of the 1st byte.
!
1.7.2 Extended Menus
The RAM Monitor window provides the following menu when being active (This menu is called RAM
Monitor window option).
Menu
Option
Menu Options
Font
View
Address...
Data Length
Byte
Word
Lword *
Radix
Dec
Hex
ASCII
SJIS
Functions
Change font
Change contents of display
Display from specified address
Specify data length
Display in 1-byte units
Display in 2-byte units
Display in 4-byte units
Specify radix
Display in decimal
Display in hexadecimal
Display as ASCII characters
Display as SJIS characters
54
1. Windows / Dialogs
JIS
Clear
Display as JIS characters
Clear access attribute
Layout
Set layout
Ascii
Turn on/off ASCII strings
RAM Monitor Area...
Set RAM monitor area
Color...
Set color of access attribute display
Sampling period...
Set sampling period for RAM monitor
*Does not exist in PD38 (SIM). In PD79 (SIM) / PD77 (SIM), it is displayed as “Dword”.
These menus can be selected even by the short cut menu by a right click in the window.
1.8 ASM Watch Window
The ASM Watch Window allows you to check the values at any specified address.
You can specify the point to watch as an address (symbol or global variable), as an address and bit No.,
or as a bit symbols.
The display is updated after each command is executed.
1.8.1 Configuration of ASM Watch Window
!
!
!
!
!
An address to be referenced is called watch point. You can register one of the following as the
watch point:
Address (can be specified with symbol)
Address + Bit number
Bit symbol
By double-clicking the radix point display area, the radix display changes (Hex -> Dec -> Bin).
The registered watch point information is saved in the environment setting file when closing
the ASM Watch window. When re-opening the file, the information is automatically registered.
When you specify a symbol/bit symbol as the watch point, the debugger re-calculates the
address expression when downloading the target program and displays the memory data using
new addresses.
A disabled watch point is displayed as "--<not active>--".
ATTENTION
!
The RAM monitor obtains the data accessed through the bus. Any change other than the access
from the target program will not be reflected.
55
!
If the display data length of the RAM monitor area is not 1 byte, the data's access attribute to
the memory may varies in units of 1 byte. In such a case that the access attribute is not unified
within a set of data, the data's access attribute cannot be displayed correctly. In this case, the
background colors the access attribute color of the first byte of the data.
1.8.2 Extended Menus
The ASM Watch window provides the following menu when being active. (This menu is called ASM
Watch window option.)
Menu
Option
Menu Options
Font
Watch
Add...
Bitadd...
Set...
Del
Del All...
Refresh
Radix
Bin
Dec
Hex
Layout
Address Area
Functions
Change font.
Register / delete watch point.
Register watch point.
Register bit-level watch point.
Set new data to be written to selected watch point.
Delete selected watch point.
Delete all watch points.
Refresh display.
Change display radix.
Display value at selected watch point in binary.
Display value at selected watch point in decimal.
Display value at selected watch point in hexadecimal.
Set layout.
Turn on/off address/bit area.
Size Area
Set color of access attribute display.
RAM Monitor
Display RAM monitor.
RAM Monitor Area...
Set RAM monitor area.
Color...
Set color of access attribute display.
Sampling period...
Set sampling period for RAM monitor.
Clear
File
Save...
Load...
Set color of access at tribute display.
Save/Load the watch points.
Save the watch points.
Load the watch points.
These menus can be selected even by the short cut menu by a right click in the window.
1.9 C Watch Window
The C Watch Window displays C expressions and their values (results of calculations).
The C expressions displayed in the C Watch Window are known as C watchpoints. The displays of the
results of calculating the C watchpoints are updated each time a command is executed.
When RAM monitor function is effective and the C watch points are within the RAM monitor area, the
displayed values are updated during execution of the target program.
56
1. Windows / Dialogs
1.9.1 Configuration of C Watch Window
!
!
!
!
!
!
!
A C language expression to be referenced is called C watch point. You can register one of the
following as the C watch point:
C symbol
Variable name and function name defined by the C language source program
C language expression
C symbols combined with expressions.
If a C language expression cannot be calculated correctly (for example, when a C symbol has
not been defined), it is registered as invalid C watch point.
It is displayed as "--<not active>--". If that C language expression can be calculated correctly at
the second time, it becomes an effective C watch point.
You can change the display radix by C language expression (Hex -> Dec -> Bin).
The address display of pointers is fixed to hexadecimal regardless of the display radix.
You cannot change the values of the C watch points listed below:
Floating-point variables
Bit field variables
Register variables
C watch point which does not indicate an address(invalid C watch point)
The registered C watch point information is saved in the C watch point information file when
closing the C Watch window. When re-opening the file, the information is automatically
registered.
A C watch point information file is created for each object file that is loaded. (The file includes
the object file name information.)
The order of arrangement can be altered (using the Drag & Drop function).
ATTENTION
!
!
The RAM monitor obtains the data accessed through the bus. Any change other than the access
from the target program will not be reflected.
If the display data length of the RAM monitor area is not 1 byte, the data's access attribute to
57
the memory may varies in units of 1 byte. In such a case that the access attribute is not unified
within a set of data, the data's access attribute cannot be displayed correctly. In this case, the
background colors the access attribute color of the first byte of the data.
1.9.2 Extended Menus
The C Watch window provides the following menu when being active. (This menu is called C Watch
window option.)
Menu
Option
Menu Options
Font
Watch
Add
Add Pointer
Del
Set...
Cancel
Del All…
View
Radix
Layout
Sort
Display String
RAM Monitor
Enable
RAM Monitor Area...
Color...
Sampling period...
Clear
Functions
Change font.
Register/delete C watch point.
Register C watch point.
Register C watch point (pointer).
Delete selected C watch point.
Set new value for selected C watch point.
Cancel selection of C watch point.
Delete all C watch points.
Change contents of display.
Change radix.
Turn on/off type name.
Sort.
Display the string / Display character.
Display RAM monitor.
Turn on/off RAM monitor area.
Set RAM monitor area.
Set color of access attribute display.
Set sampling period for RAM monitor.
Clear access attribute.
These menus can be selected even by the short cut menu by a right click in the window.
1.10 Local Window
The Local Window lists local variables in the C function with their values. The display is updated after
each command is executed.
58
1. Windows / Dialogs
1.10.1 Configuration of Local Window
!
!
!
!
The window displays a local variable of the function corresponding to the program counter
position.
If the corresponding function is changed by step execution or other operation, the local variable
after changing the function is automatically displayed.
You can register the selected C language variable to the C Watch window as a C watch point.
The address display such as a pointer is fixed to hexadecimal regardless of the display radix.
You can change the display radix for each C language variable. (Hex -> Dec -> Bin).
1.10.2 Extended Menus
The Local window provides the following menu when being active. (This menu is called Local window
option.)
Menu
Option
Menu Options
Font
Watch
Cwatch
Cwatch Pointer
Set...
Cancel
View
Radix
Layout
Sort
Display String
Functions
Change font.
Operations related to C-function.
Register selected C variable as C watch point.
Register pointer of selected C variable as C watchpoint.
Set new value for selected C variable.
Cancel selection of C variable.
Change contents of display.
Change radix.
Turn on/off type name.
Sort.
Display the string / Display character.
These menus can be selected even by the short cut menu by a right click in the window.
1.11 File Local Window
The File Local Window lists local variables in the C file with their values. The display is updated after
each command is executed.
When RAM monitor function is effective and the C watch points are within the RAM monitor area, the
59
displayed values are updated during execution of the target program.
1.11.1 Configuration of File Local Window
!
!
!
!
The window displays a file local variable of the function corresponding to the program counter
position.
If the corresponding function is changed by step execution or other operation, the local variable
after changing the function is automatically displayed.
You can register the selected C language variable to the C Watch window as a C watch point.
The address display such as a pointer is fixed to hexadecimal regardless of the display radix.
You can change the display radix for each C language variable. (Hex -> Dec -> Bin).
1.11.2 Extended Menus
The File Local window provides the following menu when being active. (This menu is called File Local
window option.)
Menu
Option
Menu Options
Font
Watch
Cwatch
Cwatch Pointer
Set...
Cancel
View
Radix
Layout
Sort
Display String
RAM Monitor
Functions
Change Fonts.
Operations related to C-function.
Register selected C variable as C watch point.
Register pointer of selected C variable as C watchpoint.
Set new value for selected C variable.
Cancel selection of C variable.
Change contents of display.
Change radix.
Turn on/off type name.
Sort.
Display the string / Display character.
Display RAM monitor.
60
1. Windows / Dialogs
Enable
Turn on/off RAM monitor area.
RAM Monitor Area...
Set RAM monitor area.
Color...
Set color of access at tribute display.
Sampling period...
Set sampling period for RAM monitor.
Clear
Clear
These menus can be selected even by the short cut menu by a right click in the window.
1.12 Global Window
The Global Window lists C global variables and their values. The display is updated after each
command is executed.
When RAM monitor function is effective and the C watch points are within the RAM monitor area, the
displayed values are updated during execution of the target program.
1.12.1 Configuration of Global Window
!
!
!
You can register the selected C language variable to the C Watch window as a C watch point.
The address display such as a pointer is fixed to hexadecimal regardless of the display radix.
You can change the display radix for each C language variable. (Hex -> Dec -> Bin).
1.12.2 Extended Menus
The Global window provides the following menu when being active. (This menu is called Global
window option.)
Menu
Menu Options
Functions
61
Option
Font
Watch
Cwatch
Catch Pointer
Set...
Cancel
View
Radix
Layout
Sort
Change Font.
Operations related to C-function.
Register selected C variable as C watch point.
Register pointer of selected C variable as C watchpoint.
Set new value for selected C variable.
Cancel selection of C variable.
Change contents of display.
Change radix.
Turn on/off type name.
Sort.
Display String
Display the string / Display character.
RAM Monitor
Display RAM monitor.
Enable
Turn on/off RAM monitor area.
RAM Monitor Area...
Set RAM monitor area.
Color...
Set color of access at tribute display.
Sampling period...
Set sampling period for RAM monitor.
Clear
Clear
These menus can be selected even by the short cut menu by a right click in the window.
1.13 Call Stack Window
The Call Stack window displays the C language function call state of the target program.
PD38 (SIM) does not support this function.
1.13.1 Configuration of Call Stack Window
!
!
!
The window displays the name of the called function and the function call position (file name,
line number, address) sequentially from the current program counter position.
The top line shows a function at the current PC position. The last line shows a function call
source.
By double-clicking the function name, the call position (line) of the function is displayed in the
Program window.
1.13.2 Extended Menus
The Call Stack window provides the following menu when being active. (This menu is called Call Stack
window option.)
Menu
Option
Menu Options
Font
Jump
Functions
Change font.
Displays the specified function on Program Window.
New window
Displays the specified function on a new Source Window.
62
1. Windows / Dialogs
These menus can be selected even by the short cut menu by a right click in the window.
1.14 Script Window
The Script Window displays the execution of text -format script commands and the results of that
execution.
Script commands can be executed using a script file or interactively. You can also write script
commands in the script file so that they are automatically executed. The results of script command
execution can also be stored in a previously specified log file.
1.14.1 Configuration of Script Window
!
!
!
!
The Script Window has a view buffer that stores the results of executing the last 1000 lines. The
results of execution can therefore be stored in a file (view file) without specifying a log file.
When a script file is opened, the command history area changes to become the script file display
area and displays the contents of the script file. When script files are nested, the contents of the
last opened script file are displayed. The script file display area shows the line currently being
executed in inverse vide.
When a script file is open, you can invoke script commands from the command input area
provided the script file is not being executed.
The Script Window can record the history of the executed commands to a file. This function is not
the same as the log function. This function records not the result but only the executed commands,
so the saved files can be used as the script files.
1.14.2 Extended Menus
The Script window provides the following menu when being active. (This menu is called Script window
option.)
Menu
Menu Options
Functions
Option
Font...
Change font.
Script
Script file operations.
Open...
Open script file.
Run
Run script file.
Step
One-step execution of script file.
Close
Close script file.
63
View
Save...
Clear
Log
On...
Off
Record
On...
Off
View buffer operations.
Save view buffer file.
Clear view buffer.
Log file operations.
Open log file (start output to file).
Close log file (stop output to file).
Record the executed commands
Record the executed commands to a file.
Stop Recording the executed commands.
These menus can be selected even by the short cut menu by a right click in the window.
1.15 Trace Point Setting Window
The Trace Point Setting window is used to set trace points. This window cannot be used on the
PC4701L emulator.
1.15.1 Configuration of Trace Point Setting Window
!
The events listed below can be specified as trace events. If the contents of events are altered,
they are marked by an asterisk (*) on the title bar. The asterisks (*) are not displayed after
setting up the emulator.
Event
PD308
PD30
PD79
64
Product Name
PD77
PD38
PD308SIM
PD30SIM
1. Windows / Dialogs
Fetch
Memory Access
Bit Access
Interrupt
Trigger
!
X*
O
O
X
O
O
O
O
O
O
O
O
O
X
O
X*
O
O
X
O
O
O
O
O
O
O
O
O
X
X
O
O
O
X
X
Events at up to six points can be used. These six events can be combined in one of the following
ways:
Trace when all of the valid events are established (AND condition)
Trace when all of the valid events are established at the same time (simultaneous AND
condition)
Trace when one of the valid events is established (OR condition)
Trace upon entering a break state during state transition (State Transition condition)
1.15.2 Specify the Trace Event
To set events, double-click to select the event you want to set from the event setting area of the Trace
Point Setting Window. This opens the dialog box shown below.
Following events can be set by specifying Event Type in this dialog box.
!
When FETCH is selected
Traces for the instruction fetch (PD308 and PD77 not support. When using these products, use
memory access instead).
65
!
When DATA ACCESS is selected
Traces for the memory access.
!
When BIT SYMBOL is selected
Traces for the bit access.
66
1. Windows / Dialogs
!
When INTERRUPT is selected
Traces for the interrupt occurrence or termination (PD308,PD79,PD77 and PDxxSIM not
support).
!
When TRIGGER is selected
Traces for the status of signal input from external trace cable (PDxxSIM not support).
1.15.3 Specify the Combinatorial Condition
To specify a combinatorial condition, specify the desired condition from the combinatorial condition
specification area.
!
When AND or OR is selected
In the event specification area, the event used and a pass count for that event can be specified. To
alter the pass count, while the event to alter is being selected, click the pass count value of that
event.
67
!
When AND (Same Time) is selected
In the event specification area, the event used can be specified. No pass counts can be specified.
!
When State Transition is selected
Click the Details... button, and the dialog box shown below appears. Specification by a state(not
supported for the PDxxSIM) transition diagram or sequential specification can be used. If the
content of any event is altered, it is marked with an asterisk (*) on the title bar. Once conditions
are set in the emulator, asterisks are not displayed. A time-out time in each state can also be
specified(not supported for the PDxxSIM).
(For PDxx)
(For PDxxSIM)
68
1. Windows / Dialogs
1.15.4 Specify the Process ID (PD79,PD77 and PDxxSIM not support)
By specifying a process ID, it is possible to detect only event establishment under specific conditions.
Example: Enable only the event that occurs in a specific task when using the realtime OS
1.15.5 Specify the Trace Range
For the emulator debugger PDxx, 32K cycles equivalent of data can be recorded. For the simulator
debugger PDxxSIM, as many cycles as specified on the Init dialog box's Trace tab can be recorded
(Descriptions below are written assuming 32K cycles).
!
!
!
!
!
Break
Stores the 32K cycles (-32K to 0 cycles) to the point at which the target program stops.
Before
Stores the 32K cycles (-32K to 1 cycles) to the point at which the trace point is passed.
About
Stores the 16K cycles (-16K to 16K cycles) either side of the trace point.
After
Stores the 32K cycles (0 to 32K cycles) of trace data after the trace point.
Full
Stores the 32K cycles (-32K to 0 cycles) of trace data after the trace starts.
1.15.6 Specify the Trace Write Condition
Conditions for cycles to be written to trace memory (32K cycles accommodated) can be specified.
69
Total
Pick up
Exclude
Writes all cycles.
Writes only the cycles where specified condition holds true.
Writes only the cycles where specified condition does not hold true.
Also, following three write modes are supported.
Only cycles where specified event is established.
Cycles from where specified event is established to where
specified event is not established.
Cycles from where start event is established to where end
event is established.
1.15.7 Command Button
The buttons at the bottom of the Trace Point Setting window have the following meanings.
Button Name
Content
Discards the contents being displayed in the window and loads contents from
Reset
the emulator in which they were set.
Save...
Saves the contents set in the window to a file
Load...
Loads event information from a file in which it was saved
Set
Sends the contents set in the window to the emulator
Close
Closes the window
1.15.8 Extended Menus
The Trace Point Setting Window has popup menus that can be brought up by right-clicking in the
window.
If this menu is checked, input history for address input is available in an event setting dialog box
opened from the Trace Point Setting Window. if not, the labels of program are listed for it.
1.16 Trace Window
The Trace window displays the measurement result of the real time trace function installed in the
emulator PC4701M/PC4701HS.
The Trace window provides the three display modes as below:
!
!
!
Bus mode
Allows you to reference the bus information by cycle. The information is displayed in the
order of execution path.
Disassemble Mode
Allows you to reference the executed command. The commands are displayed in the order of
execution path.
Source Mode
Allows you to reference the source program execution path. Operate the buttons in the tool
bar to reference the path.
70
1. Windows / Dialogs
The Trace window displays the measurement result when the real time measurement is completed. If
the real time measurement has not been completed, the Trace window displays nothing.
By default, 32 K cycles before the target program is stopped are recorded.
To change the trace measurement range to the desired event position, set the required data in the
Trace Point Setting Window.
For details on the Trace Point Setting Window, see "1.15 Trace Point Setting Window".
1.16.1 Configuration of Bus Mode
The bus mode of the trace window is the following configurations.
Following figures are examples of displaying PD30.
!
!
!
By double-clicking the cycle count display area, you can change the start cycle to be displayed.
By double-clicking the Address line in the bus information display area, you can search the
execution address.
You can change the display ratio between the label display area and the bus information
display area, using the mouse.
1.16.1.1 Display of bus information on PD308
From left to right, the contents are as follows:
!
Address
The status of address bus.
!
Data
The status of data bus.
!
BUS
The width of the external data bus ("8b" for an 8-bit data bus, and "16b" for a 16-bit data bus).
!
BIU
This shows the status between the BIU (bus interface unit) and memory, and BIU and I/O.
WAIT
RBML
No access
Executing wait instruction
Read access (bytes, ML on)
71
F
QC
RWML
INT
RB
WB
DRB
DWB
RW
WW
DRW
DWW
!
!
!
R/W
Shows the status of the data bus ("R" for r ead, "W" for wr it e, "-" for no access).
RWT
This signal shows the effective position in the bus cycle ("0" when effective. Address, Data, and
BIU signals are valid when RWT is "0”.
CPU, OPC, OPR
This shows the signal between CPU and BIU. In the column gCPU h, the data shows
whether CPU accesses BIU or not . In the Column gOPC h, the data shows the byte size of
read operat ion code. In the Column gOPR h, the data shows the byte size of read operand.
Representation
CPU
OPC
CPU
0
CPU
0
CPU
0
CPU
1
CPU
1
CPU
1
CPU
1
CPU
2
CPU
2
CPU
2
CPU
3
CPU
3
DMA
DMAT
-
!
!
!
!
Fetch access
Discontinuous Fetch access (queue buffer)
Read access (words, ML on)
Interrupt acknowledge
Read access (bytes)
Write access (bytes)
Read access by DMA (bytes)
Write access by DMA (bytes)
Read access (words)
Write access (words)
Read access by DMA (words)
Write access by DMA (words)
OPR
1
2
3
0
1
2
3
0
1
2
0
1
-
Status
Operation code size
Operand size
No accessing
0byte
1byte
0byte
2byte
0byte
3byte
1byte
0byte
1byte
1byte
1byte
2byte
1byte
3byte
2byte
0byte
2byte
1byte
2byte
2byte
3byte
0byte
3byte
1byte
DMA accessing
DMA accessing(terminal count)
B-T
Shows the level of the external break trigger (the EXTIN7 pin of the external trace signal input
cable). High level = "1", Low level = "0”.
Q-T
Shows the level of the external trace trigger (the EXTIN6 pin of the external trace signal input
cable). High level = "1", Low level = "0”.
76543210
Shows the status of the 8-bit external signal (pins EXTIN0 to EXTIN7 of the external trace
signal input cable). High level = "1", Low level = "0”.
h" m' s: ms.us
Show the elapsed time from the target program beginning.
1.16.1.2 Display of bus information on PD30
From left to right, the contents are as follows:
72
1. Windows / Dialogs
!
!
!
!
Address
The status of address bus.
Data
The status of data bus.
BUS
The width of the external data bus ("8b" for an 8-bit data bus, and "16b" for a 16-bit data bus).
BIU
This shows the status between the BIU (bus interface unit) and memory, and BIU and I/O.
Display format
DMA
INT
IB
DB
IW
DW
!
!
!
R/W
Shows the status of the data bus ("R" for read, "W" for write, "-" for no access).
RWT
This signal shows the effective position in the bus cycle ("0" when effective. Address, Data, and
BIU signals are valid when RWT is "0”.
CPU
Shows the status between CPU and BIU (bus interface unit).
Display format
CB
RB
QC
CW
RW
!
!
!
!
!
Status
No change
Data access other than a CPU cause such as DMA
Start of INTACK sequence
Instruction code read due to CPU cause (bytes)
Instruction data access due to CPU cause (bytes)
Instruction code read due to CPU cause (words)
Instruction data a ccess due to CPU cause (words)
Status
No change
Operation code read (bytes)
Operand read (bytes)
Instruction queue buffer clear
Operation code read (words)
Operand read (words)
QN
Shows the number of bytes stored in the instruction queue buffer in the range 1 to 4.
B-T
Shows the level of the external break trigger (the EXTIN7 pin of the external trace signal input
cable). High level = "1", Low level = "0”.
Q-T
Shows the level of the external trace trigger (the EXTIN6 pin of the external trace signal input
cable). High level = "1", Low level = "0”.
76543210
Shows the status of the 8-bit external signal (pins EXTIN0 to EXTIN7 of the external trace
signal input cable). High level = "1", Low level = "0”.
h" m' s: ms.us
Show the elapsed time from the target program beginning.
1.16.1.3 Display of bus information on PD79
PD79
From left to right, the contents are as follows:
!
Address
The status of address bus.
!
Data
The status of data bus.
!
BHE*
73
!
!
!
!
!
!
!
!
!
!
Indicates the status (0 or 1) of the BHE (Byte High Enable) signal. If BHE*=0, it means that
the CPU is accessing an odd address.
BHE*
Indicates the status (0 or 1) of the BHE (Byte High Enable) signal. If BHE*=0, it means that
the CPU is accessing an odd address.
BUS16*
Indicates the bus width status. The information displayed here is "16b" for the 16-bit bus, "8b"
for the 8-bit bus, or "--" for instruction execution.
DMAC
Indicates that data is being handled by the DMA controller (DMAC).
CH
Indicates the DMA operation channel by numbers 0 to 7. When DMAC = 0, it indicates "--".
BRN
Indicates branch status. When BRN = 1, the information means the start address after
branching.
CYNC
Indicates execution address/instruction code detection. When SYNC = 1, the information
means instruction execution.
INTACK*
Indicates interrupt start status. When INTACK* = 0, the information means the start address
of the interrupt routine.
R/W
Indicates the MCU data status. The information displayed here is "R" for a read, "W" for a write,
or "-" otherwise.
76543210
Shows the status of the 8-bit external signal (pins EXTIN0 to EXTIN7 of the external trace
signal input cable). High level = "1", Low level = "0”.
h" m' s: ms.us
Show the elapsed time from the target program beginning.
1.16.1.4 Display of bus information on PD77
From left to right, the contents are as follows:
!
Address
The status of address bus.
!
Data
The status of data bus.
!
BUS
The width of the external data bus ("8b" for an 8-bit data bus, and "16b" for a 16-bit data bus).
!
BHE
This shows the status of BHE (Byte High Enable) signal (0 or 1). When this signal = 0 (low), it
means that odd address is being accessed.
!
R/W
Shows the status of the data bus ("R" for read, "W" for write, "-" for no access).
!
DMA
Indicates 1 when 1-bus transfer in DMAtransfer has been performed; otherwise, it indicates 0.
!
VDA
Shows the status of VDA ( Valid Data Address ) signal ( 0 or 1 ).
!
VPA
Shows the status of VPA ( Valid Program Address ) signal ( 0 or 1 ).
!
QC
Shows the status of QCL ( Queue Buffer Clear ) signal. When this signal = Q, it means that
Queue Buffer is beeing cleared.
!
MX
Shows the status of M ( m flag) or X (x flag ) signal ( 0 or 1 ).
!
ST0
Shows the status of M37720 exclusive external signal ST0 ( 0 or 1).
74
1. Windows / Dialogs
!
!
!
!
!
ST1
Shows the status of M37720 exclusive external signal ST1 ( 0 or 1 ).
B-T
Shows the level of the external break trigger (the EXTIN7 pin of the external trace signal input
cable). High level = "1", Low level = "0”.
Q-T
Shows the level of the external trace trigger (the EXTIN6 pin of the external trace signal input
cable). High level = "1", Low level = "0”.
76543210
Shows the status of the 8-bit external signal (pins EXTIN0 to EXTIN7 of the external trace
signal input cable). High level = "1", Low level = "0”.
h" m' s: ms.us
Show the elapsed time from the target program beginning.
1.16.1.5 Display of bus information on PD38
PD38
From left to right, the contents are as follows:
!
Address
The status of address bus.
!
Data
The status of data bus.
!
Sync
This signal is output when fetching an instruction op-code. When an op-code is being fetched,
this signal indicates a logic 1.This Sync value is sometimes displayed as e(1) f.In this case, it
denotes a dummy Sync meaning that the instruction on the line is not actually executed.
!
Read
This signal determines the direct ion of the data bus. When data is to be read, this signal
indicates a logic 0.
!
Write
This signal determines the direct ion of the data bus. When data is to be written, this signal
indicates a logic 0.
!
B-T
Shows the level of the external break trigger (the EXTIN7 pin of the external trace signal input
cable). High level = "1", Low level = "0”.
!
Q-T
Shows the level of the external trace trigger (the EXTIN6 pin of the external trace signal input
cable). High level = "1", Low level = "0”.
!
76543210
Shows the status of the 8-bit external signal (pins EXTIN0 to EXTIN7 of the external trace
signal input cable). High level = "1", Low level = "0”.
!
h" m' s: ms.us
Show the elapsed time from the target program beginning.
1.16.1.6 Display of bus information on PDxxSIM
!
!
!
Address
The status of the address bus
Data
The status of the data bus
Size
Indicates the data access size.
Product
Display format
PD30SIM
PD308SIM
PD77SIM
PD79SIM
Size
DB
DW
8bit
16bit
75
PD30SIM
PD38SIM
PD32RSIM
!
!
8bit
16bit
32bit
DB
DH
DW
Type
Indicates that data has been accessed
Display format
Status
Code *
Instruction fetch
Data
Data access
* The Code data displayed by the PD30SIM, PD308SIM, PD77SIM, and PD79SIM are fixed to
16 bits long, with the rest of data omitted
R/W
Indicates the data access status.
Display format
Status
R
Read
W
Write
If Type is Code, the status is always R (code read).
!
h" m' s: ms.us
Show the elapsed time from the target program beginning.
The value enclosed in ( ) that follows indicates a total amount of instruction execution cycles
reckoning from when the program started to run.
1.16.2 Configuration of Disassemble Mode
The disassemble mode of the trace window is the following configurations.
Following figures are examples of displaying PD30.
!
!
!
By double-clicking the cycle count display area, you can change the start cycle to be displayed.
By double-clicking the address display area, you can search the execution address.
You can change the display ratio between the object code display area and the label display
area, between the label display area and the inverted-assemble result display area, and
76
1. Windows / Dialogs
between the inverted-assemble result display area and the execution time display area, using
the mouse.
1.16.3 Configuration of Source Mode
The source mode of the trace window is the following configurations.
Following figures are examples of displaying PD30.
! You can switch "Display/Hide" for the line number display area/address display area/object code
display area.
! By double-clicking the line number display area, you can change the source file to be displayed.
! By double-clicking the address display area, you can search the execution address.
! By clicking the source file display area and then clicking the Come button, you can search the
address at the clicked position (Come search).
! In the reference cycle position display area, the current cycle position is displayed as ">>". A
display of "-" indicates a line with the address information (a line for which Come search can be
executed).
1.16.4 Extended Menus
The Trace window provides the following menu when being active (This menu is called Trace window
option).
Menu
Option
Menu Options
Font...
TAB…
View
Cycle...
Address Search...
Source...
Mode
Bus
Function
Change font
Set tabs for source file display
Change contents of display
Specify cycle
Search cycle by specifying address
Change by specifying source file
Change display mode
Select bus mode
77
Disasm
Select disassemble mode
Source
Select source mode
Layout
Line Area
Address Area
Trace
Forward
Backward
Step
Come
Save...
Load...
Trace Stop
Trace Restart
Set layout
Turn on/off line No. area
Turn on/off address area
Search trace results
Search for ward (in direction of execution)
Search backward (in reverse direction of execution)
Search one step (Step search)
Search specified line (Come search)
Save real-time trace data to file
Load real-time trace data to file
Stop tracing
Restart tracing
These menus can be selected even by the short cut menu by a right click in the window.
1.17 Coverage Window
The Coverage window allows you to reference the coverage measurement result of the functions of the
target program downloaded.
Two types of windows are provided: the Coverage window in which you can check the start address/end
address of the functions and coverage measurement results; and the Coverage Source in which you can
check execution/non-execution by source line.
You cannot use these windows if you are using the emulator PC4701L.
! The coverage, which can be measured, is C0 coverage.
! The coverage measurement area is an any 256 KB area starting from the 64 KB boundary.
(For PD38 and simulator debugger PDxxSIM, all the space is the target for coverage
measurement.)
! The top address of the coverage measurement area is called coverage base address.
By default, the coverage base address is set to 0h
1.17.1 Configuration of Coverage Window
! By double clicking any function line, the corresponding function appears in the Coverage Source
window.
! During coverage measurement, "-%" appears in the coverage display area.
78
1. Windows / Dialogs
! You can change the display ratio between the function name display area and the function range
display area, using the mouse.
The Base button does not exist in PD38 (SIM) and Simulator Debugger PDxxSIM.
Note:
[PDxxSIM]
When the target program is executed using a GO or STEP command, the coverage display area of the
coverage window changes to '--'. The display is not automatically updated. If you want to update it,
press the Refresh button on the toolbar (or select [Option] -> [Refresh] from the menu). The display of
the coverage source window is automatically updated when the program has stopped.
1.17.2 Configuration of Coverage Source Window
! The background of the executed line is displayed in sky blue. The background of the non-executed
line is displayed in gray. The background of the line having no line number information
(comment line, null line) is displayed in white.
!
You can switch "Display/Hide" for the line number display area/address display area.
1.17.3 Extended Menus
The Coverage window provides the following menu when being active (This menu is called Coverage
window option).
Menu
Menu Option
Function
Option
Font...
Change font
Refresh
Update display of coverage measurement result
Clear
Initialize coverage measurement result
*
Base
Change coverage base address
File
Input/output coverage measurement result file
Save...
Save coverage measurement result file
Load...
Load coverage measurement result file
79
Layout
Set Layout
Address Area
Turn address range display area on or off
*
Does not exist in PD38 (SIM) and Simulator Debugger PDxxSIM
The Coverage Source window provides the following menu when being active (This menu is called
Coverage Source window option).
Menu
Option
Menu Option
Font...
TAB…
Layout
Line Area
Address Area
Function
Change font
Set tabs for displaying source file
Set layout
Turn line number display area on or off
Turn address range display area on or off
These menus can be selected even by the short cut menu by a right click in the window.
1.18 MR Window
Use the MR Window to display the status of the real-time OS (PD38 SIM) does not support).
You can only use the MR Window when you have downloaded a program that uses the real-time OS (if
the downloaded program does not use the MR, nothing is displayed in the MR Window when it is
opened).
1.18.1 Configuration of MR Window
You can open the MR window as many as the number of display modes (9 at maximum currently).
By clicking the desired button, the MR window display mode changes and the display data also
changes.
By double-clicking the desired task line, you can display the context data of the task.
You can drag the cursor to change the width of the display area in each mode.
If the downloaded program does not use MR, you cannot select all menus, which will select the display
mode.
If a target program created on MR30 V.1.00 is downloaded, the MPL mode cannot be used on MR30
You cannot select the menu which changes the current mode to the MPL mode).
1.18.2 Extended Menus
The MR window provides the following menu when being active (This menu is called MR window
80
1. Windows / Dialogs
option).
Menu
Option
Menu Options
Font...
Mode
Task
Ready Queue
Timeout Queue
Event Flag
Semaphore
Mailbox
Cyclic Handler
Alarm Handler
Memory Pool
MR
Context...
Layout
Status Bar
Function
Change font
Switch display mode
Display Task status
Display Ready queue status
Display Timeout queue status
Display Event flag status
Display Semaphore status
Display Mailbox status
Display Cycle handler status
Display Alarm handler status
Display Memory pool status
Display Context
Set Layout
Switch display or non-display of status bar
1.19 I/O Window
This window is used to set and display virtual port input/outputs or virtual interrupts.
Virtual port inputs, virtual interrupt settings, and virtual port output results can be displayed for your
reference in numeric or graphic mode.
1.19.1 Configuration of I/O Window
This window is split into three sections, each displaying the setup contents of virtual port inputs, the
output results of virtual port outputs, and the setup contents of virtual interrupts.
81
1.19.1.1 Virtual Port Input
Virtual Port Input refers to a function that defines changes in the data that is input from external
sources to a specified memory address. Use of this function makes it possible to simulate data inputs to
the ports defined in the SFR. The defined input data can be referenced by displaying it in chart,
numeric (hexadecimal),or graphic mode. There are following three types of virtual port inputs:
1.
Cycle synchronized input
The input data can be written to memory when program execution has reached a specified number of
cycles. The data size that can be input is one byte. The diagram below shows an example of a virtual
port input that is synchronized to machine cycles
82
1. Windows / Dialogs
As shown above, data can be input to memory address 3E0 in any desired cycle as specified by the
user.
2.
Read access synchronized input
Data can be input when the program accesses a specified memory location for read.
The data size that can be input is one byte.
The diagram below shows an example of a virtual port input that is synchronized to memory accesses
for read.
This function aims to assign the value of port 0 to variable key. In such a case, a value can be assigned
to variable key by entering it to port 0 when the program accesses port 0 (address 3E0) for read.
To support processing of functions like this, PDxxSIM provides a function that allows you to define the
data to be input according to a number of times the specified memory address is read (a virtual input
port synchronized to memory accesses for read). By using this function, you can perform an operation
where data 0x10 is input to memory address 3E0 when address 3E0 is read first and data 0x20 is input
to said memory address when the address is read next.
Number of times the address 3E0 is read
Data input to address 3E0
First
Second
Third
:
:
0x10
0x20
0x30
:
:
3.
Interrupt synchronized input
Data can be input to a specified memory location when a virtual interrupt occurs. The data size that
can be input is one byte. The diagram below shows an example of a virtual port input that is
synchronized to interrupts.
Shown in the sample program below is the case where data is read from port 1 (address 3E1) using an
83
interrupt handler routine (in this case, a timer interrupt handler routine).
This interrupt handler routine aims to assign the value of port 1 to variable key when a virtual
interrupt is generated. In such a case, a value can be assigned to variable key by entering it to port 1
when a virtual interrupt (in this case, a timer interrupt) is generated.
It is assumed that timer interrupts are generated using a separately available virtual interrupt
function. (For details, refer to the virtual interrupt function described later in this manual.)
To support processing of interrupt handlers like this, PD30SIM provides a function that allows you to
define the data to be input according to a number of times a virtual interrupt is generated (a virtual
input port synchronized to virtual interrupts). By using this function, you can perform an operation
where data 0xFF is input to memory address 3E1 when the virtual interrupt occurs first and data
0xFE is input to said memory address when the virtual interrupt occurs next time.
Number of times a virtual interrupt is
Data input to address 3E1
generated
First
Second
Third
:
:
0xFF
0xFE
0xFD
:
:
1.19.1.2 Virtual Port Output
Virtual Port Output is a function that when data is written to some memory address by the program,
allows the written data value to be recorded along with the cycle in which the data was written. The
recorded data can be displayed for your reference in chart, numeric, or graphic mode. The maximum
number of data that can be recorded by this function is 30,000 entries counted from the beginning of
program execution.
For example, if data is written to port 0 (address 3E0) by executing a program like the one shown
below,
84
1. Windows / Dialogs
the data written to address 3E0 is recorded along with the cycle count in which the data was written.
1.19.1.3 Virtual Interrupt
This function defines interrupt generation. Using this function, you can generate timer interrupts or
key input interrupts in a simulated manner without having to actually generate them.
There are following three types of virtual interrupts:
1.
Cycle synchronized interrupt
A specified virtual interrupt can be generated when program execution has reached a specified
number of cycles. The diagram below shows an example of a virtual interrupt that is synchronized to
machine cycles.
As shown above, virtual interrupts (in this case, timer A0 interrupt) can be generated in any desired
cycle.
2.
Executed address synchronized interrupt
Virtual interrupts can be generated when the program has executed a specified address. The diagram
below shows an example of a virtual interrupt that is synchronized to executed addresses.
85
As shown above, a specified virtual interrupt can be generated when program execution has moved
into address F0000.
By using this function, you can specify that a virtual interrupt be generated when address F0000 is
executed first by the program, and that no virtual interrupt be generated when the address is executed
next, as shown below.
Number of times the address
F0000 is executed
Whether virtual interrupt is generated
First
Second
Third
:
:
Virtual interrupt is generated
Virtual interrupt is not generated
Virtual interrupt is generated
:
:
3.
Interval-synchronized interrupts
A virtual interrupt can be generated at specified intervals.
The following shows an example of a virtual interrupt which is synchronized to a specified interval
time.
As shown above, virtual interrupts (in this case, timer A0 interrupt) can be generated in intervalsynchronized.
1.19.2 Structure of Virtual Port Input Screen
1.19.2.1 Screen structure for cycle-synchronized inputs
If you've set virtual port inputs that are synchronized to machine cycles, they can be displayed in one
of the three modes shown below. The display modes can be changed from the Mode menu.
1.
Chart mode (displayed in units of bits)
The virtual port input that has been set is displayed in chart mode in units of bits.
86
1. Windows / Dialogs
!
!
!
Address display area displays the memory address to which a virtual port is input.
Bit number display area displays bit numbers of memory to which a virtual port is input.
Input data display area displays the virtual port input data that has been set in chart mode in
units of bits.
This means that memory bits are in the state of logic 1.
!
2.
This means that memory bits are in the state of logic 0.
The short white lines appearing at the bottom of the input data display area indicate points at
which data are input.
To reference data values, move the mouse cursor into this area and the value and the cycle
count of the data at which the cursor is positioned will be displayed in the cycle count display
area.
Cycle count display area displays cycle counts.
Graphic mode (displayed in units of bytes)
87
!
!
!
Address display area displays the memory address to which a virtual port is input.
Input data display area displays the virtual port input data that has been set in graphic mode.
The peaks in this graph represent data values derived by equally dividing the height of the
data-displaying area by 255 (maximum value of 1-byte data).
The short white lines appearing at the bottom of the input data display area indicate points at
which data are input.
To reference data values, move the mouse cursor into this area and the value and the cycle
count of the data at which the cursor is positioned will be displayed in the cycle count display
area.
Cycle count display area displays cycle counts.
3.
Hexadecimal mode
The virtual port input that has been set is displayed in hexadecimal mode.
!
!
!
Address display area displays the memory address to which a virtual port is input.
Input data display area displays the virtual port input data that has been set by hexadecimal
numbers.
To reference data values, move the mouse cursor into this area and the value and the cycle
count of the data at which the cursor is positioned will be displayed in the cycle count display
area.
Cycle count display area displays cycle counts.
88
1. Windows / Dialogs
1.19.2.2 Screen structure for read access-synchronized inputs
If you've set virtual port inputs that are synchronized to machine cycles, they can be displayed in one
of the three modes shown below. The display modes can be changed from the Mode menu.
1.
Chart mode (displayed in units of bits)
The virtual port input that has been set is displayed in chart mode in units of bits.
!
!
!
Address display area displays the memory address to which a virtual port is input.
Bit number display area displays bit numbers of memory to which a virtual port is input.
Input data display area displays the virtual port input data that has been set in chart mode in
units of bits.
This means that memory bits are in the state of logic 1.
!
This means that memory bits are in the state of logic 0.
The short white lines appearing at the bottom of the input data display area indicate points at
which data are input.
To reference data values, move the mouse cursor into this area and the value and the cycle
count of the data at which the cursor is positioned will be displayed in the cycle count display
area.
Cycle count display area displays cycle counts.
2.
Graphic mode (displayed in units of bytes)
The virtual port input that has been set is displayed in graphic mode in units of bytes.
89
!
!
!
Address display area displays the memory address to which a virtual port is input.
Input data display area displays the virtual port input data that has been set in graphic mode.
The peaks in this graph represent data values derived by equally dividing the height of the
data-displaying area by 255 (maximum value of 1-byte data).
The short white lines appearing at the bottom of the input data display area indicate points at
which data are input.
To reference data values, move the mouse cursor into this area and the value and the cycle
count of the data at which the cursor is positioned will be displayed in the cycle count display
area.
Cycle count display area displays cycle counts.
3.
Hexadecimal mode
The virtual port input that has been set is displayed in hexadecimal mode.
!
!
!
Address display area displays the memory address to which a virtual port is input.
Input data display area displays the virtual port input data that has been set by hexadecimal
numbers.
To reference data values, move the mouse cursor into this area and the value and the cycle
count of the data at which the cursor is positioned will be displayed in the cycle count display
area.
Cycle count display area displays cycle counts.
90
1. Windows / Dialogs
1.19.2.3 Screen structure for read access-synchronized inputs
When you've set virtual port inputs that are synchronized to virtual interrupts, a display screen
configured as shown below will appear.
!
!
!
!
Address display area displays the memory address to which a virtual port is input.
Vector number display area displays the virtual interrupt vector number to be monitored.
Input data display area displays the virtual port input data that has been set by hexadecimal
numbers.
To reference data values, move the mouse cursor into this area and the value and the virtual
interrupt occurrence count of the data at which the cursor is positioned will be displayed in the
virtual interrupt occurrence count display area. Virtual interrupt occurrence count display area It
displays virtual interrupt occurrence counts.
Virtual interrupt occurrence count display area displays virtual interrupt occurrence counts.
1.19.3 Structure of Virtual Port Output Screen
Virtual port output results can be displayed in one of the three modes shown below. The display modes
can be changed from the Mode menu.
1.
Chart mode (displayed in units of bits)
Virtual port output results are displayed in chart mode in units of bits.
91
!
!
!
Address display area displays the address to be monitored for virtual port output.
Bit number display area displays bit numbers of memory being monitored for virtual port output.
Output data display area displays the data as virtual port output results in chart mode in units of
bits.
This means that memory bits are in the state of logic 1.
!
This means that memory bits are in the state of logic 0.
The short white lines appearing at the bottom of the output data display area indicate points at
which data are output.
To reference data values, move the mouse cursor into this area and the value and the cycle count
of the data at which the cursor is positioned will be displayed in the cycle count display area.
Cycle count display area displays cycle counts.
2.
Graphic mode (displayed in units of bytes)
Virtual port output results are displayed in graphic mode in units of bytes.
92
1. Windows / Dialogs
!
!
!
Address display area displays the address to be monitored for virtual port output.
Output data display area displays the data as virtual port output results in graphic mode in
units of bytes.
The peaks [ ] in this graph represent data values derived by equally dividing the height of the
data-displaying area by 255 (maximum value of 1-byte data).
The short white lines appearing at the bottom of the output data display area indicate points at
which data are output.
To reference data values, move the mouse cursor into this area and the value and the cycle
count of the data at which the cursor is positioned will be displayed in the cycle count display
area.
Cycle count display area displays cycle counts.
3.
Hexadecimal mode
Virtual port output results are displayed in hexadecimal mode.
!
!
!
!
Address display area displays the address to be monitored for virtual port output.
Output data display area displays the data as virtual port output results by hexadecimal
numbers.
To reference data values, move the mouse cursor into this area and the value and the cycle count
of the data at which the cursor is positioned will be displayed in the cycle count display area.
Cycle count display area displays cycle counts.
93
1.19.4 Structure of Virtual Interrupt Screen
1.19.4.1 Screen structure for cycle-synchronized interrupts
When you've set virtual interrupts that are synchronized to machine cycles, a display screen
configured as shown below will appear.
!
!
!
Vector number display area displays the vector number of a virtual interrupt.
Priority level display area displays the priority level of a virtual interrupt.
Virtual interrupt display area displays timing at which the virtual interrupt you've set is
generated.
This means that a virtual interrupt is generated.
!
This means that a virtual interrupt is not generated.
Cycle count display area displays cycle counts.
1.19.4.2 Screen structure for executed address-synchronized interrupts
When you've set virtual interrupts that are synchronized to executed addresses, a display screen
configured as shown below will appear.
!
!
!
!
!
Executed address display area displays the fetch address (the address where the program is
executed) at which time a virtual interrupt is generated.
Vector number display area displays the vector number of a virtual interrupt.
Priority level display area displays the priority level of a virtual interrupt.
Virtual interrupt display area displays timings by an asterisk (*) at which the virtual interrupt
you've set is generated.
When an asterisk (*) is indicated, it means that a virtual interrupt is generated. When an
asterisk (*) is not indicated, it means that a virtual interrupt is not generated.
Execution count display area displays execution counts or a number of times the program has
executed a specified address.
94
1. Windows / Dialogs
1.19.4.3 Screen configuration for interval-synchronized interrupts
To set a virtual interrupt which is synchronized to a specified interval time, click the Timer button and
use the Timer dialog box that appears. The Timer dialog box has a display screen configuration similar
to the one shown below.
!
!
!
!
In the virtual interrupt register area, specify the virtual interrupt you want to set and the
interval time at which intervals you want to generate the interrupt.
The virtual interrupt display area shows the registered virtual interrupts and the specified
interrupt generation intervals.
The operation buttons for virtual interrupts can be used to delete or disable/enable each virtual
interrupt.
The operation buttons to save/load virtual interrupts can be used to save the virtual interrupt
information to a file, as well as load the saved virtual interrupt information from the file.
1.19.5 Extended Menus
If the I/O Window is active among the windows brought up in the main display area of PDxxSIM, the
[Option] menu has the following menu items assigned to it.
Menu
Menu Options
Function
Option
Font...
Changesfont
Setup...
Sets virtualportinput,virtual portoutput,orvirtual interrupt.
Modify...
Sets virtualportinput,virtual portoutput,orvirtual interrupt.
95
Delete...
Load...
Mode...
Scale...
Color...
Timer...
Deletes
setvirtualportinput,
virtualinterruptoruser-createdI/Oscriptfile.
Loads
savedvirtualportinput,
virtualinterruptoruser-createdI/Oscriptfile.
Changesdisplaymode
Changesdisplayscale.
Changesdisplaycolor.
Interval-synchronized interrupts
virtualportoutput,or
virtualportoutput,or
These menus can be selected even by the short cut menu by a right click in the window.
1.20 GUI Input Window
The GUI Input window allows you for port input by creating a user target system key input panel
(button) in the window and clicking the created button.
1.20.1 Configuration of GUI Input Window
You can arrange the following parts on the input panel.
!
!
Button
A virtual port input or virtual interrupt (PDxxSIM only for the latter) can be executed at the time
the button is pressed.
Text
Display the text string.
You can label (name) the created button.
You can also save the created input panel in a file and reload it.
1.20.2 Extended Menus
The GUI Input window provides the following menu when being active (This menu is called GUI Input
96
1. Windows / Dialogs
window option).
Menu
Option
Menu Options
Set
Del
Copy
Paste
Make Button
Make Text
Display Grid Line
Load...
Save...
Function
Edits or moves button
Deletes button
Copies button
Pastes button
Creates button
Creates text label
Shows/hides grid line
Loads GUI input file
Saves GUI input file
These menus can be selected even by the short cut menu by a right click in the window.
1.21 GUI Output Window
The GUI Output window allows you to implement the user target system output panel in the window.
1.21.1 Configuration of GUI Output Window
You can arrange the following parts on the output panel.
!
Label (character string)
Displays/erases a character string specified by the user when any value is written to the
specified address (bit).
!
LED
Changes the display color of any area when any value is written to the specified address (bit).
(Substitution for LED ON)
!
Text
The text labels.
You can label (name) the created button.
You can also save the created output panel in a file and reload it.
You can set up to 200 address points to the created part.
If different addresses are set to the each parts, you can arrange up to 200 parts.
97
1.21.2 Extended Menus
The GUI Output window provides the following menu when being active (This menu is called GUI
Output window option).
Menu
Option
Menu Options
Set
Del
Copy
Paste
Make Label
Make LED
Make Text
Display Grid Line
Load...
Save...
Function
Edits or moves parts
Deletes parts
Copies parts
Pastes parts
Creates label
Creates LED
Create text label
Shows/hides grid line
Loads GUI output file
Saves GUI output file
These menus can be selected even by the short cut menu by a right click in the window
1.22 Output Port Window
The Output Port Window is used to display the data to be output to ports on a window or output the
data to a file. It also allows you to verify the data that is output to UARTs by the Printf function.
Output Destination
Format
Window
ASCII display
Hexadecimal display
ASCII output
Hexadecimal output
Binary output (Not including data output for the Printf function, however)
File
98
1. Windows / Dialogs
1.22.1 Configuration of Outport Window
l
l
l
l
For the output port, you can select any port or UART0 or UART1 which is the output destination
for the Printf function. For details about the Printf function output destination, see the User's
Manual of your C Compiler NCxx.
The data which are output to ports can be saved to a specified file (log file) before being presented
to the Output Port Window.
The Output Port Window has a buffer that contains 10,000 bytes of the latest execution result.
Even when you forgot to specify a log file, the data which are output to ports can be saved to a file
(view file).
The output data is displayed on a window or output to a file when the target program has
stopped.
1.22.2 Extended Menus
The Outport window provides the following menu when being active. (This menu is called Outport
window option.)
Menu
Menu Options
Function
Option
Font
Change font
Set...
Setting output port
Colm...
Setting column
Log
Log file operations
On...
Open log file (start output to file).
Off
Close log file (stop output to file).
V iew
View buffer operations.
Save...
Save view buffer file.
Clear
Clear view buffer
These menus can be selected even by the short cut menu by a right click in the window.
1.23 S/W Break Point Setting Dialog Box
The S/W Break Point Setting dialog box allows you to set software break points.
Software breaks stop the execution of instructions immediately before the specified break point.
You can also enable and disable each of those break points.
99
!
!
!
!
!
You can set up to 64 software break points.
If you have set multiple software breakpoint s, program execution stops when any one soft ware
break address is encountered (OR conditions).
You can continue to set software breakpoints until you click the "Close" button to close the S/W
Break Point Setting Dialog Box.
You can clear, enable or disable software breakpoints selected by clicking in the software
breakpoint display area. You can also enable and disable software breakpoints by double clicking
on them.
Click on the "Save" button to save the software break points in the file. To reload software break
point settings from the saved file, click the "Load" button. If you load software break points from a
file, they are added to any existing break points.
100
1. Windows / Dialogs
1.24 H/W Break Point Setting Dialog Box
The H/W Break Point Setting dialog box allows you to set hardware break points.
The hardware break point of 64 points can be set up.
You can set one address breakpoints with pass counts.
l
l
l
As address break point access types, you can specify writing data to the address break point
(Write), reading data from the address break point (Read), reading or writing data (R/W), and
fetching instructions (Fetch).
You can also specify that execution breaks if the data read from or written to the address break
point has a specific value. Moreover, you can specify valid and invalid bits for the specific value.
Hardware breakpoints can be saved to a file by clicking "Save". To read hardware breakpoint
settings from the saved file, click "Load".
101
2.
Table of Script Commands
The following script commands are prepared.
The parenthesized letter (U,M, HS, L, or S) in the command name denotes the corresponding emulator
or simulator. The script commands without parenthesized letters are useful for all PC4701 emulators
and PDxxSIM.
U: PC4701U
M: PC4701M
HS: PC4701HS
L: PC4701L
S : Simulater
The commands with yellow color displaying can be executed at run time.
The command to which "*" adheres behind is not supported according to the product.
2.1 Table of Script Commands
2.1.1 Execution Commands
Command Name
Short Name Contents
Go
G
Program execution with breakpoints
GoFree
GF
Free run program execution
GoProgramBreak
(U/M/HS/L)*
GoBreakAt (U/M/HS/L)*
GPB
Run target program with software break point
GBA
Run target program with software break point
Stop
-
Stops program execution
Status
-
Checks the operating status of the MCU
Step
S
Halts for user input until the specified time has elapsed
StepInstruction
SI
Step execution of instructions
OverStep
O
Overstep execution of source lines
OverStepInstruaction
OI
Overstep execution of instructions
Return
RET
Executes a source line return
ReturnInstruction
RETI
Executes an instruction return
Reset
Time(U/M/HS/L)
-
Resets the target MCU
-
Sets the run time display and checks the current setting
2.1.2 File Operation Commands
Command Name
Short Name Contents
Load
L
Downloads the target program
LoadHex
LH
Downloads an Intel HEX-format file
LoadMot*
LM
Downloads a Motorola S-format file
102
2. Table of Script Commands
LoadSymbol
LS
Loads source line/ASM symbol information
LoadIeee *
LI
Downloads IEEE-695 absolute-format files
Reload
-
Re-downloads the target program
UploadHex
UH
Outputs data to an Intel HEX-format file
UploadMot*
UM
Outputs data to a Motorola S-format file
2.1.3 Register Operation Commands
Command Name
Short Name Contents
Register
R
Checks and sets a register value
2.1.4 Memory Operation Commands
Commnad Name
Short Name Contents
DumpByte
DB
Displays the contents of memory (in 1-byte units)
DumpWord*
DW
Displays the contents of memory (in 2-byte units)
DumpLword*
DL
Displays the contents of memory (in 4-byte units)
DumpDword*
DD
Displays the contents of memory (in 4-byte units)
SetMemoryByte
MB
Checks and changes memory contents (in 1-byte units)
SetMemoryWord*
MW
Checks and changes memory contents (in 2-byte units)
SetMemoryLword*
ML
Checks and changes memory contents (in 4-byte units)
SetMemoryDword*
MD
Checks and changes memory contents (in 4-byte units)
FillByte
FB
Fills a memory block with the specified data (in 1-byte units)
FillWord*
FW
Fills a memory block with the specified data (in 2-byte units)
FillLword*
FL
Fills a memory block with the specified data (in 4-byte units)
FillDword*
FD
Fills a memory block with the specified data (in 4-byte units)
Move
-
Moves memory blocks
MoveWord*
MOVEW
Moves memory blocks(in 2-byte units)
2.1.5 Assemble/Disassemble Commands
Command Name
Short Name Contents
Assemble
A
Line-by-line assembly
DisAssemble
DA
Disassembles memory contents line by line
Module
MOD
Displays modules names
Scope
-
Sets and checks the effective local symbol scope
Section
SEC
Checks section information
Bit*
-
Checks and sets bit symbols
Symbol
SYM
Checks assembler symbols
Label
-
Checks assembler labels
Express
EXP
Displays an assembler expression
2.1.6 Software Break Setting Commands
Command Name
Short Name Contents
SoftwareBreak
SB
Sets and checks software breaks
SoftwareBreakClear
SBC
Clears software breaks
103
SoftwareBreakClearAll
SBCA
Clears all software breaks
SoftwareBreakDisable
SBD
Disables software breakpoints
SoftwareBreakDisableAll SBDA
Disables all software breaks
SoftwareBreakEnable
SBE
Enables software breakpoints
SoftwareBreakEnableAll
SBEA
Enables all software breaks
BreakAt
-
Sets a software breakpoint by specifying a line No.
BreakIn
-
Sets a software breakpoint by specifying a function
2.1.7 Hardware Break Setting Commands
Command Name
Short Name Contents
HardwareBreak(U/M/HS) HB
Sets and checks a hardware break
HardwareBreak(L)
HB
Sets and checks a hardware break
HardwareBreak(S)
HB
Sets and checks a hardware break
HardwareBreakClear(S)
HBC
Clears software breaks
HardwareBreakClearAll( HBCA
S)
Protect(U/M/HS)
PT
Clears all software breaks
BreakMode(U/M/HS)
BM
Sets and checks hardware break mode
BreakMode(L)
BM
Sets and checks hardware break mode
BreakMode(S)
BM
Sets and checks hardware break mode
Sets and checks protect breaks
2.1.8 Real-time Trace Commands
Command Name
Short Name Contents
TracePoint(U/M/HS)
TP
Sets and checks a trace points
TracePoint(S)
TP
Sets and checks a trace points
TraceData(U/M/HS)
TD
Realtime trace data display
TraceData(S)
TD
Realtime trace data display
TraceList(U/M/HS)
TL
Displays disassembled realtime trace data
TraceList(S)
TL
Displays disassembled realtime trace data
2.1.9 Coverage Measurement Commands
Command Name
Short Name Contents
Coverage(U/M/HS/S)
CV
Specifies and displays coverage measurement
2.1.10 Stack Utilization Monitor Command
Command Name
Short Name Contents
StackMonitor(S)
SM
Sets and checks stack utilization measurement
2.1.11 Cycle Count Monitor Command
Command Name
Short Name Contents
Cycle(S)
CY
Sets and checks cycle counting
104
2. Table of Script Commands
2.1.12 Script/Log File Commands
Command Name
Short Name Contents
Script
-
Opens and executes a script file
Exit
-
Exits the script file
Wait(U/M/HS)
-
Waits for an event to occur before command input
Wait(L)
-
Waits for an event to occur before command input
Wait(S)
-
Waits for an event to occur before command input
Pause
-
Waits for user input
Sleep
-
Halts for user input until the specified time has elapsed
Logon
-
Outputs the screen display to a log file
Logoff
-
Stops the output of the screen display to a log file
2.1.13 Program Window Control Commands
Command Name
Short Name Contents
Func
-
Up*
-
Checks function names and displays the contents of
functions
Displays the calling function
Down*
-
Displays a called function
Where*
-
Displays a function call status
Path
-
Sets and checks the search path
File
-
Checks a filename and displays the contents of that file
2.1.14 Map Commands
Command Name
Short Name Contents
Map(U/M/HS/L)
-
Checks and sets mapping data
Map(S)
-
Checks and sets mapping data
2.1.15 Clock Command
Command Name
Short Name Contents
Clock(U/M/HS/L)
CLK
Checks and changes the clock
2.1.16 C Language Debugging Commands
Command Name
Short Name Contents
Print
-
Check value of specified C variable expression
Set
-
Set specified data in specified C variable expression
2.1.17 Real-time OS Command
Command Name
Short Name Contents
MR*
-
Displays status of realtime OS (MRxx)
105
2.1.18 Custom Command/Window Commands
Command Name
Short Name Contents
Macro
-
The reference and registration of the custom programs
DelMacro
-
Delete custom program
DelMacroAll
-
Delete all custom programs
MacroPath
MPATH
Sets and checks the search path for custom programs
2.1.19 Utility Commands
Command Name
Short Name Contents
Radix
-
Sets and checks the radix for numerical input
Alias
-
Specifies and checks command alias definitions
UnAlias
-
Cancels the alias defined for a command
UnAliasAll
-
Cancels all aliases defined for commands
Version
VER
Displays the version No.
Date
-
Displays the date
Echo
-
Displays messages
Quit
-
Quits Debugger
CD
-
Specifies and checks the current directory
2.2 Table of Script Commands (alphabetical order)
Command Name
Short Name Contents
Alias
-
Specifies and checks command alias definitions
Assemble
A
Line-by-line assembly
Bit*
-
Checks and sets bit symbols
BreakAt
-
Sets a software breakpoint by specifying a line No.
BreakIn
-
Sets a software breakpoint by specifying a function
BreakMode(U/M/HS)
BM
Sets and checks hardware break mode
BreakMode(L)
BM
Sets and checks hardware break mode
BreakMode(S)
BM
Sets and checks hardware break mode
CD
-
Specifies and checks the current directory
Clock(U/M/HS/L)
CLK
Checks and changes the clock
Coverage(U/M/HS/S)
CV
Specifies and displays coverage measurement
Cycle(S)
CY
Sets and checks cycle counting
Date
-
Displays the date
DelMacro
-
Delete custom program
DelMacroAll
-
Delete all custom programs
DisAssemble
DA
Disassembles memory contents line by line
Down*
-
Displays a called function
DumpByte
DB
Displays the contents of memory (in 1-byte units)
DumpDword*
DD
Displays the contents of memory (in 4-byte units)
DumpLword*
DL
Displays the contents of memory (in 4-byte units)
DumpWord*
DW
Displays the contents of memory (in 2-byte units)
Echo
-
Displays messages
106
2. Table of Script Commands
Exit
-
Exits the script file
Express
EXP
Displays an assembler expression
File
-
Checks a filename and displays the contents of that file
FillByte
FB
Fills a memory block with the specified data (in 1-byte units)
FillDword*
FD
Fills a memory block with the specified data (in 4-byte units)
FillLword*
FL
Fills a memory block with the specified data (in 4-byte units)
FillWord*
FW
Fills a memory block with the specified data (in 2-byte units)
Func
-
Go
G
Checks function names and displays the contents of
functions
Program execution with breakpoints
GoBreakAt(U/M/HS/L)*
GBA
Run target program with software break point
GoFree
GF
Free run program execution
GoProgramBreak(U/M/H GPB
S/L)*
HardwareBreak(U/M/HS) HB
Run target program with software break point
HardwareBreak(L)
HB
Sets and checks a hardware break
HardwareBreak(S)
HB
Sets and checks a hardware break
HardwareBreakClear(S)
HBC
Clears software breaks
Sets and checks a hardware break
HardwareBreakClearAll( HBCA
S)
Label
-
Clears all software breaks
Load
L
Downloads the target program
LoadHex
LH
Downloads an Intel HEX-format file
LoadIeee*
LI
Downloads IEEE-695 absolute-format files
LoadMot*
LM
Downloads a Motorola S-format file
LoadSymbol
LS
Loads source line/ASM symbol information
Logoff
-
Stops the output of the screen display to a log file
Logon
-
Outputs the screen display to a log file
Macro
-
The reference and registration of the custom programs
MacroPath
MPATH
Sets and checks the search path for custom programs
Map
-
Checks and sets mapping data
Module
MOD
Displays modules names
Move
-
Moves memory blocks
MoveWord*
MOVEW
Moves memory blocks(in 2-byte units)
MR*
-
Displays status of realtime OS (MRxx)
OverStep
O
Overstep execution of source lines
OverStepInstruaction
OI
Overstep execution of instructions
Path
-
Sets and checks the search path
Pause
-
Waits for user input
Print
-
Check value of specified C variable expression.
Protect(U/M/HS)
PT
Sets and checks protect breaks
Quit
-
Quits Debugger
Radix
-
Sets and checks the radix for numerical input
Register
R
Checks and sets a register value
Reload
-
Re-downloads the target program
Reset
-
Resets the target MCU
Return
RET
Executes a source line return
ReturnInstruction
RETI
Executes an instruction return
Scope
-
Sets and checks the effective local symbol scope
Checks assembler labels
107
Script
-
Opens and executes a script file
Section
SEC
Checks section information
Set
-
Set specified data in specified C variable expression
SetMemoryByte
MB
Checks and changes memory contents (in 1-byte units)
SetMemoryDword*
MD
Checks and changes memory contents (in 4-byte units)
SetMemoryLword*
ML
Checks and changes memory contents (in 4-byte units)
SetMemoryWord*
MW
Checks and changes memory contents (in 2-byte units)
Sleep
-
Halts for user input until the specified time has elapsed
SoftwareBreak
SB
Sets and checks software breaks
SoftwareBreakClear
SBC
Clears software breaks
SoftwareBreakClearAll
SBCA
Clears software breaks
SoftwareBreakDisable
SBD
Disables software breakpoints
SoftwareBreakDisableAll SBDA
Disables all software breaks
SoftwareBreakEnable
SBE
Enables software breakpoints
SoftwareBreakEnableAll
SBEA
Enables all software breaks
StackMonitor
SM
Sets and checks stack utilization measurement
Status
-
Checks the operating status of the MCU
Step
S
Step execution of source line
StepInstruction
SI
Step execution of instructions
Stop
-
Stops program execution
Symbol
SYM
Checks assembler symbols
Time(U/M/HS/L)
-
Sets the run time display and checks the current setting
TraceData(U/M/HS)
TD
Realtime trace data display
TraceData(S)
TD
Realtime trace data display
TraceList(U/M/HS)
TL
Displays disassembled real-time trace data
TraceList(S)
TL
Displays disassembled real-time trace data
TracePoint(U/M/HS)
TP
Sets and checks a trace points
TracePoint(S)
TP
Sets and checks a trace points
UnAlias
-
Cancels the alias defined for a command
UnAliasAll
-
Cancels all aliases defined for commands
Up*
-
Displays the calling function
UploadHex
UH
Outputs data to an Intel HEX-format file
UploadMot*
UM
Outputs data to a Motorola S-format file
Version
VER
Displays the version No.
Wait(U/M/HS)
-
Waits for an event to occur before command input
Wait(L)
-
Waits for an event to occur before command input
Wait(S)
-
Waits for an event to occur before command input
Where*
-
Displays a function call status
108
3. Error Messages
3.
Error Messages
Please click an error number.
No.
Error Message
Notes and Action
INTERNAL ERROR:Unset err number
Contact your nearest distributor.
Error Message
Notes and Action
200
Can't open more xxxxx window.
The maximum number of the specified window
is already open.
201
202
203
204
205
206
207
209
Can't Create xxxxx window.
PDxx is already exist.
Project file (xxxxx) is broken.
File not found (xxxxx).
Path not found (xxxxx).
Not enough memory.
Can't execute.
Failed to read/write data to the archive xxxxx
(CODE: n).
Failed to read/write data to the file xxxxx
(CODE: n).
0
No.
210
No.
Error Message
Notes and Action
400
Can't change view mode.
401
Can't find source file (xxxxx).
402
Can't find search string (xxxxx).
403
Line number of Source File (xxxxx) is over 2.
The display starting address does not match
the first line of the source file, or the specified
source file cannot be found.
Specified source file was not found. Use the
PATH command, or the [Environment] ->
[Customize] menu items to specify the directory
containing the source file.
The specified search string was not found
between the starting position and end.
Because the source file has more lines than
can be displayed, the file cannot be displayed
in the Source Window. Switch to disassemble
display mode.
No.
600
601
602
603
604
605
Error Message
Notes and Action
The address value is out of range.
Can not open file(xxxxx).
Can't find file (xxxxx).
Can not save because the line number is over
xxxxx.
Can not save as the file (xxxxx). [system error:
xxxxx]
Can not edit this file (xxxxx) because it is being
109
used by another process.
No.
Error Message
Notes and Action
Value is out of range.
Can't find the register information file.
There's incorrect line in register information file.
Not enough memory.
Description of expression is illegal.
Contact your nearest distributor.
No.
Error Message
Notes and Action
1000
Address value is out range for scroll area.
800
801
802
803
804
No.
Error Message
1200
1201
Address value is out range for scroll area.
The length of the set data is different from the
length of the displayed data.
Notes and Action
No.
Error Message
Notes and Action
1400 Sampling period value is out of range.
1401 Address value is out of range.
No.
Error Message
Notes and Action
1600 Can't add new watch point because it exceeds
limit of watch point number. Max number is
(num).
1601 Address value is out of range.
1602 Data value is out of range.
1603 Bit value is out of range.
1604 Can't save watch points.
No.
Error Message
Notes and Action
1800 There are no symbol information.
1801 The expression is too long.
1802 Can't save c watch points.
No.
Error Message
Notes and Action
2000 Can't open Script File (xxxxx).
2001 Script File is not open.
2002 Can't open Log File (xxxxx).
2003 Can't open more Log File.
2004 Can't open Log File.
2005 File (xxxxx) is already log on.
2006 Can't open View File (xxxxx) for new/add.
2007 Can't save command history.
No.
Error Message
Notes and Action
2200 Address value is out of range.
2201 Data value is out of range.
2202 Start address is larger than end address.
2203 Value is under (1).
110
3. Error Messages
2204 Data value is out of range.
2205 Data is not set.
No.
Error Message
Notes and Action
2400 Illegal endi. (xxxxx line)
2401 Illegal endw. (xxxxx line)
2402 INTERNAL ERROR:ER_BAT_EOF
2403 Can't find endi. (xxxxx line)
2404 Line length is overflow. (xxxxx line)
2405 Nest level is overflow. (xxxxx line)
2406 Can't find Script File (xxxxx).
2407 Can't read Script File (xxxxx).
2408 Description is illegal. (xxxxx line)
2409 Can't find endw. (xxxxx line)
2410 The nest level exceeds the limit (num).
2411 INTERNAL ERROR:ER_BAT_NONE
Contact your nearest distributor
2412 Illegal break. (xxxxx line)
No.
Error Message
Notes and Action
2600 Syntax error.
2601 Command name is wrong.
2602 Too many aliases.
2603 You can register the only command name for
alias.
2604 Can't use the command now.
2605 Can't up more.
2606 Can't down more.
2607 Can't set break point in this function.
2608 The start address larger than the end address.
2609 Can't register that token for alias.
2610 Can't register that token for alias.
2611 Can't find File (xxxxx).
2612 Data value is out of range.
No.
Error Message
Notes and Action
6000 INTERNAL ERROR:ER_ENV_END
No.
Contact your nearest distributor.
Error Message
Notes and Action
6200 SYMBOL file is illegal.
6201 Loading is canceled.
6202 Can't find SYMBOL file (xxxxx).
6203 Can't get enough memory.
6204 Cannot open temporary file.
No.
Error Message
Notes and Action
6402 Can't find symbol.
6403 Description of expression is illegal.
6404 Description is illegal.
111
6405 Can't find scope.
6406 Can't find symbol.
6407 Can't find function.
6408 Right hand side of the expression is illegal.
6409 The Type of structure (union) are not same.
6410 Can't assign.
6411 Can't find type.
6412 Not supported float (double) operation.
6413 The operation does not be allowed to pointers.
6414 The operation does not be allowed to the
pointer.
6415 Can't decrease by pointer.
6416 Divided by 0.
6417 The operator is not supported.
6418 Type information is broken.
6419 Left value must be the pointer.
6420 Left value must be a structure or an union.
6421 Can't find member.
6422 Left value must be reference of a structure or an
union.
6423 Left value is illegal.
6424 The operand must be a value.
6425 The operand is able to be opposite sign.
6426 Can't get address value.
6427 The array variable is illegal.
6428 The essential number of array is illegal.
6429 The operand must be an address value.
6430 Type casting for register variable is not be
supported.
6431 The type of type casting is illegal.
6432 Type casting for that type is not be supported.
6433 This expression can not be exchanged for some
address value.
No.
Error Message
Notes and Action
6601 Address value is out of range.
6602 Target program is already stopped.
6603 The number of break point is over the limit
(num).
6604 The break point isn't defined at that address.
6605 Data value is out of range.
6606 INTERNAL ERROR: ER_IN1_ILLEGAL_MODE Contact your nearest distributor.
has happen. (in xxxxx)
6607 Can't read/write, because there are no memory
at that area.
6608 Register value is out of range.
6609 Can't execute that command, when the target
program is running.
6610 Start address is larger than end address.
6611 STOP execution.
112
3. Error Messages
6612 Can't search more on the stack.
6613 Specified times of number is over than 65535.
6614 INTERNAL ERROR: The memory of the odd
number byte cannot be dumped by the Word
access.
6615 Memory alignment error.
Contact your nearest distributor.
6616 Illegal register is specified.
No.
Error Message
Notes and Action
6800
The process is canceled.
6801
Can't execute this command while some source
windows are in editor mode.
No.
Error Message
Notes and Action
10000 Cannot find source file (xxxxx).
10001 The number of lines of source file (xxxxx) is over
the limit (num).
10002 The address value is out of range.
10003 Cannot open file (xxxxx).
10004 Illegal file format.
10005 Cannot read the file saved by simulator
debugger.
10006 Cannot read the file saved by emulator
debugger.
10007 Not enough memory for display all function.
No.
Error Message
Notes and Action
10200 Operation code (code) not found.
10201 File (xxxxx) not found.
10202 Duplicate event set in xxxxx.
10203 File format error (xxxxx).
No.
Error Message
Notes and Action
10400 Can't execute more come instruction.
10401 Can't execute more step instruction.
10402 Cycle value is out of range.
10403 Can't find that address.
10404 Can not open file (xxxxx).
10405 Can not read file (xxxxx).
10406 The display mode is not able to change except
the BUS mode. Trace data is not enough or is
abnormal.
No.
Error Message
Notes and Action
10600 Can't open BUTTON file (xxxxx).
10601 BUTTON file is illegal.
113
No.
Error Message
Notes and Action
10800 Illegal file format.
10801 Address value is out of range.
10802 Data value is out of range.
No.
Error Message
Notes and Action
11000 File format error (xxxxx).
11001 File (xxxxx) not found.
11002 Can't file (xxxxx) open.
11003 Failed to read/write data to the file %s
(CODE: %d).
11004 Failed to read/write data to the archive %s
(CODE: %d).
11005 Data value is out of range.
11006 Function not found.
11007 Bit Symbol not found.
11008 Can not set trace points while program is
running.
11009 Specify BYTE access for ODD address.
No.
Error Message
Notes and Action
11200 Combination of bus width and access condition.
11201 The start cycle larger than the end cycle.
11202 HardwareBreak command cannot be used while
H/W Break Point Setting Window opens.
11203 TracePoint command cannot be used while
Trace Point Setting Window, Time
Measurement Window, MR Trace/Analyze
Window or Task Trace/Analyze Window opens.
11204 These trace data can't disassemble.
11205 Can't execute this command with PC4700L.
11206 Already set hard ware break.
11207 Cycle value is out of range.
No.
Error Message
Notes and Action
11400 Can't open temporary file.
11401 Can't delete temporary file.
11402 Can't open I/O data file(filename).
11403 The I/O data not set.
11404 The Output file of the same already set.
11405 Data not found.
11406 The start cycle larger than the end cycle.
114
3. Error Messages
11407 The Output port already set.
11408 There is no data in the Input file.
11409 Illegal file format.
11410 Can't open file.
11411 Can't open ( filename ).
11412 Address value is out of range.
No.
Error Message
Notes and Action
11600 Can't execute this command.
11601 Already set hard ware break.
11602 Combination of bus width and access condition.
11603 The start cycle larger than the end cycle.
11604 HardwareBreak command cannot be used while
state transition break window opens.
11605 TracePoint command cannot be used while
State Transition Trace Window,
Time Measurement Window, MR Trace/Analyze
Window or Task Trace/Analyze Window opens.
11606 These trace data can't disassemble.
11607 Cycle value is out of range.
No.
Error Message
Notes and Action
11800 The I/O data not set.
11801 Can't open ( filename ).
11802 Can't open temporary file.
11803 Address value is out of range.
11804 Can't delete temporary file.
11805 Can't open Log File (filename).
11806 Can't open View File (filename) for new/add.
No.
Error Message
Notes and Action
16000 INTERNAL ERROR: Already connected with the Contact your nearest distributor.
target.
16001 INTERNAL ERROR: Fork error has happen.
Contact your nearest distributor.
16002 Can't find Host Name (xxxxx).
16003 INTERNAL ERROR: The Baud rate is illegal.
Contact your nearest distributor.
16004 The connection with the target isn't created.
16005 Can't connect with the target.
16006 INTERNAL ERROR: The Time of time out is out Contact your nearest distributor.
of range.
16007 Time Out ERROR.
Contact your nearest distributor.
16008 INTERNAL ERROR: Can’t disconnect with the
target.
16009 INTERNAL ERROR: Can’t send given size data. Contact your nearest distributor.
16010 INTERNAL ERROR: Parameter is illegal.
Contact your nearest distributor.
115
16011 Illegal Host Name.
16012 Communication ERROR. The connection with
the target is closed.
16013 Communication ERROR. Can't send data.
16014 Communication ERROR. Can't accept data.
16015 Target is already used.
16016 Specified communications interface doesn't
support.
16017 LAN I/F can't be used on Windows3.1.
16018 Parallel connection doesn't support on Windows
NT.
16019 Setting of the communications interface is
illegal.
16020 OverRun ERROR with serial communications.
No.
Error Message
Notes and Action
16200 Address value is out of range.
16201 That baud rate has not yet supported.
16202 Bit number is out of range.
16203 STOP execution.
16204 Data value is out of range.
16205 Monitor File (xxxxx) is broken.
16206 Can't find File (xxxxx).
16207 Target system is not constructed properly.
16208 INTERNAL ERROR: ER_IN2_ILLEGAL_MODE Contact your nearest distributor.
has happen. (in xxxxx)
16209 Mask value is out of range.
16210 Counter of measurement time is overflow.
16211 The version of string1 and the firmware on the
target are not same.
16212 Pass count value is out of range.
16213 Can't execute that command, when the target
program is running.
16214 Target MCU is reset state. Please reset target
systems.
16215 Target MCU is unable to reset. Please reset
target systems.
16216 Target MCU is HOLD state. Please reset target
systems.
16217 Target MCU is not given clock. Please reset
target systems.
16218 Target MCU is not given power. Please reset
target systems.
16219 INTERNAL ERROR: Break point number is
illegal.
16220 Please download the firmware to target.
116
Contact your nearest distributor.
3. Error Messages
16221 Can't download firmware.
16222 Can't find trace data which is able to refer.
16223 Cycle value is out of range.
16224 Target MCU is not under control. Please reset
target systems.
16225 First data is larger than second data.
16226 First address is larger than second address.
16227 No event set on the state transition path.
16228 Time out value is out of range.
16229 Process ID value is out of range.
16230 Communication protocol error. (Argument error) Contact your nearest distributor.
16231 There was sent undefined data from PC4700.
16232 Check sum error of the received data occurred.
16233 The specified data do not exist.
16234 The target program is running.
16235 The target program is not running.
16236 The measurement has already been stopping.
16237 The measurement has already been being
executed.
16238 The measurement is not completed.
16239 There is no trace data of the specified cycle.
16240 There is no trace data.
16241 The measurement counter of time overflowed.
16242 POF state was released by compulsory reset.
16243 A number of setting points exceeds the range.
16244 The program break is not set.
16245 Source line information is not loaded.
16246 The trigger mode is not a software output mode.
16247 The exception processing was detected while
executing the step.
16248 Function range error.
16249 The writing error to EEPROM occurred.
16252 Unexecutable command code was specified.
16253 The processor mode and the target system are
the disagreements. xxxxx mode is used.
16254 The specified bank isn't defined in the expansion
memory.
16255 The bank set up is duplicated.
16256 The specified area includes the debugging
monitor memory area.
16257 The specified area includes the debugging
monitor work area.
16258 Flash ROM deletion error occurred. Flash ROM
deletion error occurred.
16259 Flash ROM verify error occurred.
117
16260 Specification area includes the internal (flash)
ROM area.
16261 When Word is specified for a size, the odd
number address cannot be specified.
16262 Can not spesify the larger total bank size than
the total emulation memory size.
16263 The bank specified is defined as EXTERNAL.
16264 The setting value is invalid in this processor
mode.
16265 RDY signal of MCU is Low.
16266 HOLD signal of MCU is Low.
16267 All program break points in the spesified bank is
cleared.
16268 Please specify the address in the emulation
memory area.
16269 The mistake is found in setting the emulation
memory area.
16270 The specified area has already been used in the
debugging monitor bank address.
16271 Too many emulation memory area specification.
16272 The bank from 0 to 3 cannot be specified.
16273 The mistake is found in the specification of the
debugging monitor bank address.
16274 The mistake is found in the specification of the
debugging monitor work address.
16275 2Cannot specifiy to extend more than two
banks.
16276 Please specify the address in the emulation
memory area.
16277 Too many ROM area specification.
16278 Start address is larger than end address.
16279 Too many DMA area specification.
16281 The mistake is found in the specification of the
DMA area.
16282 When Word is specified for a size, the odd
number address cannot be specified.
16283 Too many memory mapping specification.
16284 The mistake is found in the specification of the
memory mapping.
16285 Please specify the address in the emulation
memory area.
16286 The mistake is found in setting the emulation
memory area.
16287 The specified area has already been used in the
debugging monitor bank address.
16288 Too many emulation memory area specification.
16289 The bank from 0 to 3 cannot be specified.
118
3. Error Messages
16290 The mistake is found in the specification of the
debugging monitor bank address.
16291 The mistake is found in the specification of the
debugging monitor work address.
16292 Cannot specifiy to extend more than two banks.
16293 Please specify the address in the emulation
memory area.
16294 Too many ROM area specification.
16295 Start address is larger than end address.
16296 Too many DMA area specification.
16298 The mistake is found in the specification of the
DMA area.
16299 Too many 8 bits bus mode area specification.
16300 The mistake is found in the specification of the
8-bit bus mode area.
16301 When Word is specified for a size, the odd
number address cannot be specified.
16302 The S/W breakpoint cannot be set in the SFR
area and the RAM area.
16303 The S/W breakpoint cannot be set in the flash
ROM area.
16304 The S/W breakpoint cannot be set.
16305 The H/W breakpoint cannot be set in the SFR
area and the RAM area.
16306 The H/W breakpoint cannot be set in the flash
ROM area.
16307 The H/W breakpoint cannot be set.
16308 Too many memory mapping specification.
16309 The mistake is found in the specification of the
memory mapping.
16314 Work Address value is out of range.
16315 The received data is illegal. The received data
must be 'x'. But 'y’ is received.
16316 INIT code is received.
No.
Error Message
Notes and Action
16400 INTERNAL ERROR:Already connected with the
target.
16401 INTERNAL ERROR:Fork error has happen.
16402 Can't find Host Name (hostname).
16403 INTERNAL ERROR:The Baud rate is illegal.
16404 The connection with the target isn't created.
16405 Can't connect with the target.
16406 INTERNAL ERROR:The Time of time out is out
of range.
16407 Time Out ERROR.
16408 INTERNAL ERROR:Can't disconnect with the
119
target.
16409 INTERNAL ERROR:Can't send given size data.
16410 INTERNAL ERROR: Parameter is illegal.
16411 Illegal Host Name.
16412 Communication ERROR.
The connection with the target is closed.
16413 Communication ERROR.Can't send data.
16414 Communication ERROR.
Can't send data.
16415 Target is already used.
16416 Parallel connection doesn't support on Windows
NT.
16417 Can't find Simulator Engine.
No.
Error Message
Notes and Action
16600 Address value is out of range.
16601 That baud rate has not yet supported.
16602 Bit number is out of range.
16603 STOP execution.
16604 Data value is out of range.
16605 Monitor File ( filename ) is broken.
16606 Can't find File ( filename ).
16607 Target system is not constructed properly.
16608 INTERNAL ERROR:ER_IN2_ILLEGAL_MODE
has happen(in string1).
16609 Mask value is out of range.
16610 Counter of measurement time is overflow.
16611 The version of PD and the firmware on the target
are not same.
16612 Pass count value is out of range.
16613 Can't execute that command, when the target
program is running.
16614 Target MCU is reset state.
Please reset target systems.
16615 Target MCU is unable to reset.
Please reset target systems.
16616 Target MCU is HOLD state.
16617 Target MCU is not given clock. Please reset
target system.
16618 Target MCU is not given power.
16619 INTERNAL ERROR:Break point number is
illegal.
16620 Please download the firmware to target
16621 Can't download firmware.
16622 Download firmware is finished.
120
3. Error Messages
Please restart PD.
16623 Can't find trace data which is able to refer.
16624 Cycle value is out of range.
16625 Target MCU is not under control.
Please reset target systems.
16626 First data is larger than second data.
16627 First address is larger than second address.
16628 No event set on the state transition path.
16629 Time out value is out of range.
16630 Process ID value is out of range.
16631 Communication protocol error.(Argument error)
16632 Check sum error of the received data occurred.
16633 The specified data do not exist.
16634 The target program is running.
16635 The target program is not running.
16636 The measurement has already been stopping.
16637 The measurement has already been being executed.
16638 The measurement is not completed.
16639 There is no trace data of the specified cycle.
16640 There is no trace data.
16641 The measurement counter of time overflowed.
16642 POF state was released by compulsory reset.
16643 A number of setting points exceeds the range.
16644 The program break is not set.
16645 Source line information is not loaded.
16646 The trigger mode is not a software output mode.
16647 The exception processing was detected while executing the
step.
16648 Function range error.
16649 The writing error to EEPROM occurred.
16650 There was sent undefined data from simulator.
16651 The received data is illegal.
The received data must be ( data ). But ( data ) is received.
16652 INIT code is received.
16653 Can't read/write, because there are no memory at that area.
16654 Number of points exceeds the limit ( num ).
16655 Point already set.
16656 Breakpoint of other type already set.
16657 No hardware breakpoint set at specified address.
16658 Can't get enough memory.
16659 Can't set more I/O script file.
16660 Can't set more virtual output.
16661 Specified vector No. out of range.
16662 Specified level of priority out of range.
121
16663 Stack trace mode is not enabled.
16664 The simulator engine execution error occurred.
16665 Undefined instruction was executed.
16666 Software break point can't be set up in the address.
16667 Software break point can't be set up in the odd number
address.
16668 Software break point can't be set up in the middle of 32bit
instruction.
16669 Software break point can't be set up in the LSB side parallel
instruction.
16670 A memory territory which doesn't exist was manipulated. Or, A
memory territory was manipulated on the condition which
wasn't forgiven.
16671 Can't execute from the LSB side parallel instruction.
No.
Error Message
Notes and Action
16800 Can't find '{'.(line: num )
16801 Can't find '}'. (line: num )
16802 Can't find '('.(line: num )
16803 Symbol isn't defined. (line: num , token: string )
16804 Can't find ')'.(line: num )
16805 Description of expression is illegal. (line: num ,
token: string )
16806 Nest level of the if statement is overflow. (line:
num )
16807 Nest level of the while statement is overflow.
(line: num )
16808 Too many the break statement. (line: num )
16809 There is no if statement corresponding to the
else statement. (line: num )
16810 Unknown token. (line: num , token: string )
16811 Can't open the ( filename ) file.
16812 The ( filename ) file is not a file made in the I/O
window.
16813 The description of the memory variable is illegal.
(line: num )
No.
Error Message
Notes and Action
20000 Task with specified task No. not found.
20001 Context of specified task No. not found.
20002 Corrupted MR data.
20003 Can't get enough memory.
No.
Error Message
Notes and Action
20200 History of the system call issue that conforms to
the search condition cannot be found.
122
3. Error Messages
No.
Error Message
Notes and Action
20400 Can't use Task Pause function.
20401 Task Pause function (xxxxx) was failed.
No.
Error Message
Notes and Action
20600 Can't use Task Trace Window without setting
real-time OS information.
No.
Error Message
Notes and Action
20800 The save file name (xxxxx) is wrong.
20801 Can't find symbol (xxxxx) of MR.
20802 Initialization routine of MR is not executed.
20803 Can't find the task of the specified task number.
20804 Priority out of range.
20805 Task ID out of range.
20806 Flag ID out of range.
20807 Semaphore ID out of range.
20808 Mailbox ID out of range.
20809 Memory pool ID out of range.
20810 Cyclic handler ID out of range.
20811 Address out of range.
20812 Cannot invoke system call.
20813 System call not invoked.
20814 System call not completed.
20815 Address value is out of range.
20816 File Name is illegal.
20817 Corrupted MR data.
20818 Can't get enough memory.
No.
Error Message
Notes and Action
26000 Address value is out of range.
26001 Description of Assembly language is illegal.
26002 Address value for JUMP is out of range.
26003 Operand value is out of range.
26004 Description of expression is illegal.
26005 Addressing mode specified is not appropriate.
26006 INTERNAL ERROR: 'ALIGN' is multiple
specified in '.SECTION'.
Contact your nearest distributor.
26007 Operand value is undefined.
26008 Bit-symbol is in expression.
26009 Invalid bit-symbol exist.
26010 Symbol value is not constant.
26011 Same items are multiple specified.
123
26012 Same kind items are multiple specified.
26013 Characters exist in expression.
26014 Format specified is not appropriate.
26015 Invalid symbol definition.
26016 Invalid reserved word exist in operand.
26017 INTERNAL ERROR: 'JMP.S' operand label is
not in the same section.
Contact your nearest distributor.
26018 Reserved word is missing.
26019 No space after mnemonic or directive.
26020 INTERNAL ERROR: No '.FB' statement.
Contact your nearest distributor.
26021 INTERNAL ERROR: No '.SB' statement.
Contact your nearest distributor.
26022 INTERNAL ERROR: No '.SECTION' statement.
Contact your nearest distributor.
26023 Operand value is not defined.
26024 Operand size is not appropriate.
26025 Operand type is not appropriate.
26026 INTERNAL ERROR:Section attribute is not
defined.
Contact your nearest distributor.
26027 INTERNAL ERROR: Section has already
determined as attribute.
Contact your nearest distributor.
26028 INTERNAL ERROR: Section name is missing.
Contact your nearest distributor.
26029 INTERNAL ERROR: Section type is not
appropriate.
Contact your nearest distributor.
26030 INTERNAL ERROR: Section type is multiple
specified.
Contact your nearest distributor.
26031 Size or format specified is not appropriate.
26032 Size specified is missing.
26033 String value exist in expression.
26034 Symbol is missing.
26035 Symbol is multiple defined.
26036 Symbol is missing.
26037 Symbol is multiple defined.
26038 Invalid operand exist in instruction.
26039 Syntax error in expression
26040 Invalid operand exist in instruction.
26041 Operand expression is not completed.
26042 Too many operand.
26043 Too many operand data.
26044 Undefined symbol exist.
26045 Value is out of range.
26046 Division by zero.
26047 INTERNAL ERROR:'.VER' is duplicated.
Contact your nearest distributor
26048 '#' is missing.
26049 ',' is missing.
26050 ']' is missing.
26051 ')' is missing.
124
3. Error Messages
26052 INTERNAL ERROR: Symbol defined by external Contact your nearest distributor.
reference data is defined as global symbol.
26053 Invalid operand exist in instruction.
26054 Quote is missing.
26055 Right quote is missing.
26056 Can't get enough memory.
26057 Invalid chip mode.
26058 ':' is missing.
26059 Absolute addressing is not avail.
26060 Direct addressing is not avail.
26061 Invalid addressing mode declaration included.
26062 Syntax error in indexed addressing expression.
26063 '(' is missing.
26064 Internal error.
26065 Operand value of direct addressing is out of
range.
26066 Operand value of absolute addressing is out of
range.
26067 Operand value of absolute long addressing is
out of range.
26068 Operand value of stack relative addressing is
out of range.
26069 Operand value is illegal.
26071 An odd number address can't be specified.
No.
Error Message
Notes and Action
26200 Line number is illegal.
26201 Can't find right bracket ')'.
26202 The Number of Macro constant is over the limit
(num).
26203 Immediate value is out of range.
26204 Prefix which gives radix of the constant is illegal.
26205 Description of indirect reference is illegal.
26206 Can't find end of strings (xxxxx).
26207 Description of expression is illegal.
26208 Macro constant (xxxxx) isn't defined.
26209 Symbol (xxxxx) isn't defined.
26210 Immediate value is illegal.
26211 Divide by 0.
26212 The value is over the maximum value of which
can be treated by MCU.
26213 Register name is using for macro variable name.
No.
Error Message
Notes and Action
26400 Address value is out of range.
125
26401 Bit number is out of range.
26402 File (xxxxx) is broken.
26403 Can't find File (xxxxx).
26404 Can't find sub routine information.
26405 Illegal character in the strings.
26406 INTERNAL ERROR: ER_IN2_ILLEGAL_MODE Contact your nearest distributor
has happen. (in xxxxx)
26407 Can't find that line number.
26408 Multiple definition of symbol/label.
26409 There are no code at that line.
26410 Can't get enough memory.
26411 Can't find scopes.
26412 Can't find section information.
26413 Can't find source lines which correspond to that
address.
26414 Can't find symbol (xxxxx).
26415 Can't find the scopes which include that
address.
26416 Loading is canceled.
26417 INTERNAL ERROR: The end of section
information.
Contact your nearest distributor.
26418 INTERNAL ERROR: The end of section
information.
Contact your nearest distributor.
26419 The register name is wrong.
26420 Can't find Source File (xxxxx).
26421 Unable to read Load Module File (xxxxx).
26422 The PATH name is incorrect.
26423 Cannot open the save file (xxxxx).
26424 Can't open SYSROF file.
26425 Can't read SYSROF file.
26426 Illegal file format. (no absolute format file)
26427 Illegal file format.
26428 Can't get enough memory.
26429 Can't find file.
26430 There are no address at that line.
26431 Can't find the function which correspond to that
source line.
26432 Can't find the scopes which include that
address.
26433 Can't find symbol.
26434 Can't find the function which correspond to that
source line.
26435 Loading is canceled.
26436 INTERNAL ERROR: ER_LOAD_SYMSCOPE
has happen.
126
3. Error Messages
26437 File Name is illegal.
26438 Display source codes.
26439 The path name is too long.
No.
Error Message
Notes and Action
26600 Can't open file (xxxxx).
26601 Can't create file (xxxxx).
26602 Can't close file (xxxxx).
26603 File seek error (in xxxxx).
26604 Out of disk space.
26605 Illegal file format (xxxxx --> xxxxx). (xxxxx)
26606 Out of heap space.
26607 Not yet implemented (xxxxx).
No.
Error Message
Notes and Action
30200 Comfirm the processor mode and the CNVss
terminal level.
30201 Comfirm the emulation memory allocation, or
the mapping.
No.
Error Message
Notes and Action
30400 MCU file is old format.
30401 MCU file is illegal format.
No.
Error Message
Notes and Action
30600 In connected emulation-pod, the target clock is
external fixation.
No.
Error Message
Notes and Action
38000 The value of Bank is wrong.
127
MEMO
M3T-PD308SIM V.3.20, M3T-PD30SIM V.5.20 User’s Manual
Rev. 1.00
December 1, 2003
REJ10J0370-0100Z
COPYRIGHT ©2003 RENESAS TECHNOLOGY CORPORATION
AND RENESAS SOLUTIONS CORPORATION ALL RIGHTS RESERVED
M3T-PD308SIM V.3.20 M3T-PD30SIM V.5.20
User’s Manual
1753, Shimonumabe, Nakahara-ku, Kawasaki-shi, Kanagawa 211-8668 Japan
REJ10J0370-0100Z


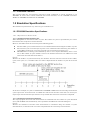
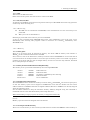
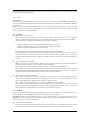
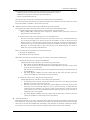
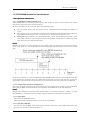
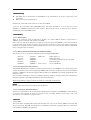
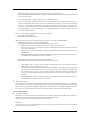
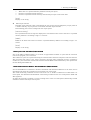

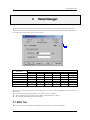
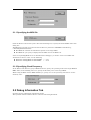
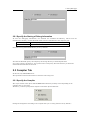
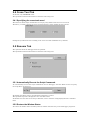
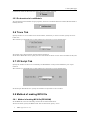
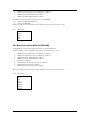
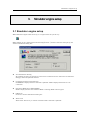
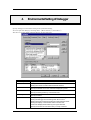
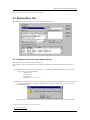
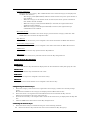

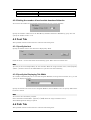
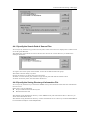
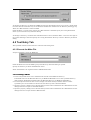
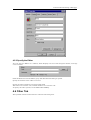
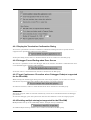
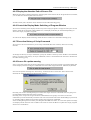
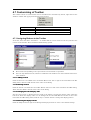
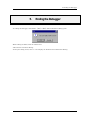


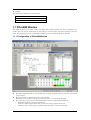
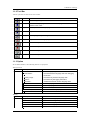
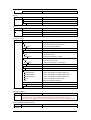
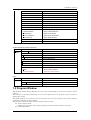
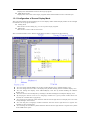
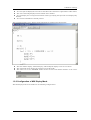
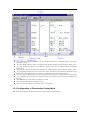
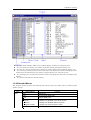
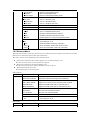
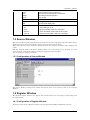
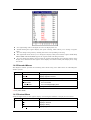
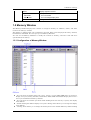
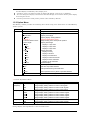
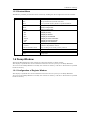
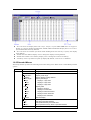
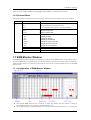
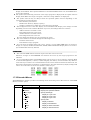
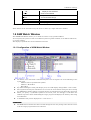
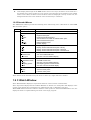
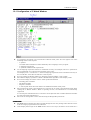
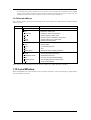
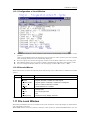
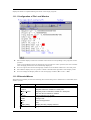
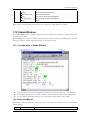
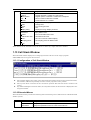
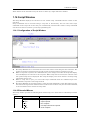
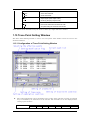
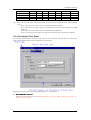
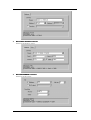
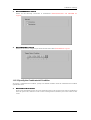
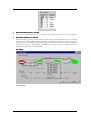
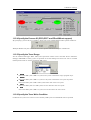
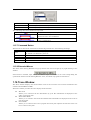
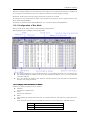
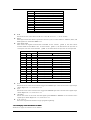
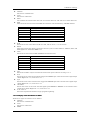
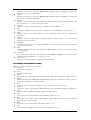
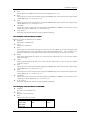
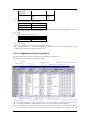
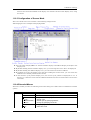
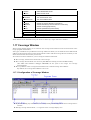
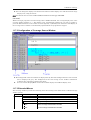
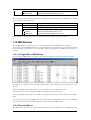
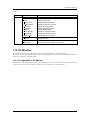
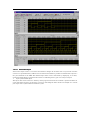
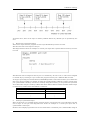
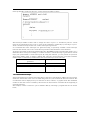
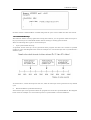
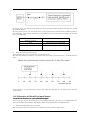
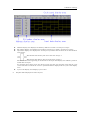
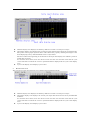
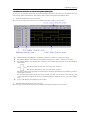
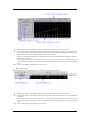
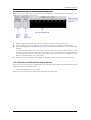
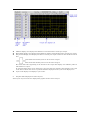
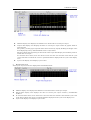
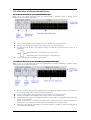
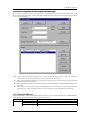
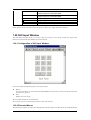
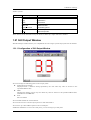
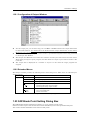
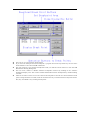
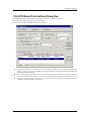
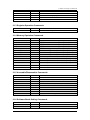
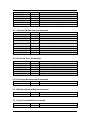
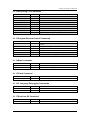

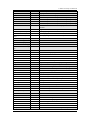

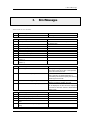
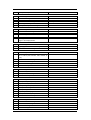

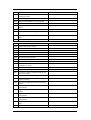
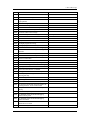
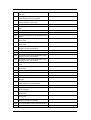
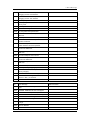


![[S3062PT-CPE] User`s Manual(Third Edition): CPE62PUE](http://vs1.manualzilla.com/store/data/005693507_1-69a1045bbc5cf41449359b406d2a53f2-150x150.png)
![[S3062PT-CPE-2] User`s Manual(First Edition): CPE62PSUE_2](http://vs1.manualzilla.com/store/data/005668190_1-0d028d6af383e5d06430420ca44dee4c-150x150.png)