1
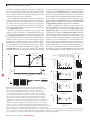
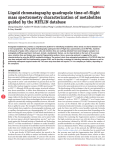
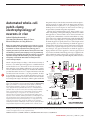
brief communications Whole-cell patch-clamp electrophysiology of neurons is a goldstandard technique for high-fidelity analysis of the biophysical mechanisms of neural computation and pathology, but it requires great skill to perform. We have developed a robot that automatically performs patch clamping in vivo, algorithmically detecting cells by analyzing the temporal sequence of electrode impedance changes. We demonstrate good yield, throughput and quality of automated intracellular recording in mouse cortex and hippocampus. Whole-cell patch clamp recording1,2 of the electrical activity of neurons in vivo utilizes glass micropipettes to establish electrical and molecular access to the insides of neurons in intact tissue. This methodology has fidelity sufficient to report the synaptic and ion channel–mediated changes in subthreshold membrane potential that enable neurons to compute information and that are affected in brain disorders or by drug treatment. In addi tion, molecular access to the cell allows the infusion of dyes for morphological visualization as well as extraction of cell contents for transcriptomic single-cell analysis3, which together enable the Figure 1 | The autopatcher: a robot for in vivo patch clamping. (a) The four stages of the automated in vivo patch algorithm (detailed in Supplementary Fig. 3). (b) Schematic of a simple robotic system capable of performing the autopatching algorithm, consisting of a conventional in vivo patch setup, equipped with a programmable linear motor, a controllable bank of pneumatic valves for pressure control, and a secondary computer interface board. (c) Current-clamp traces for an autopatched cortical neuron during current injection (top; 2-s-long pulses of −60, 0 and +80 pA current injection) and at rest (bottom; note compressed timescale relative to the top trace). Access resistance, 44 MΩ; input resistance, 41 MΩ; depth of cell 832 µm below brain surface. (d) Current-clamp traces for an autopatched hippocampal neuron during current injection (top; 2-s-long pulses of −60, 0 and +40 pA current injection) and at rest (bottom). Access resistance, 55 MΩ; input resistance, 51 MΩ; depth of cell, 1,320 µm. (e) Biocytin fill of a representative autopatched cortical pyramidal neuron. Scale bar, 50 µm. a Pipette Brain Regional pipette localization b Three-axis linear actuator Programmable linear motor Headstage Pipette holder Neuron hunting Gigaseal formation Control joystick Computer Motor controller Patch amplifier Switch Break-in e Patch digital board Secondary digital board Pipette High positive pressure Low positive pressure Atmospheric pressure Suction pressure Valves c d 40 mV npg © 2012 Nature America, Inc. All rights reserved. Suhasa B Kodandaramaiah1,2, Giovanni Talei Franzesi1, Brian Y Chow1, Edward S Boyden1,3 & Craig R Forest2 integrative analysis of molecular, anatomical and electrophysio logical properties of single cells in the intact brain. However, the skill and labor required for in vivo patching have posed a challenge for its broad adoption in neuroscience and biology and precluded systematic integrative experiments. We have discovered that unbiased, non–image guided, in vivo whole-cell patching (‘blind’ patch clamping) of neurons, in which micropipettes are lowered until a cell is detected and then an opening in the cell membrane created for intracellular recording, can be reduced to a reliable algorithm. The patch algorithm takes place in four stages (Fig. 1a): (i) ‘regional pipette localization’, in which the pipette is rapidly lowered to a desired depth under positive pressure; (ii) ‘neuron hunting’, in which the pipette is advanced more slowly at lower pressure until a neuron is detected, as reflected by a specific temporal sequence of electrode imped ance changes; (iii) ‘gigaseal formation’, in which the pipette is hyperpolarized and suction applied to create the gigaseal; and (iv) ‘break-in’, in which a brief voltage pulse (‘zap’) is applied to the cell to establish the whole-cell state. We constructed a simple auto mated robot to perform this algorithm (Fig. 1b), which actuates a 1s –62 mV –60 mV 10 mV Automated whole-cell patch-clamp electrophysiology of neurons in vivo 10 s 1Media Lab, Massachusetts Institute of Technology, Cambridge, Massachusetts, USA. 2George W. Woodruff School of Mechanical Engineering, Georgia Institute of Technology, Atlanta, Georgia, USA. 3McGovern Institute, Massachusetts Institute of Technology, Cambridge, Massachusetts, USA. Correspondence should be addressed to C.R.F. ([email protected]) or E.S.B. ([email protected]). Received 31 August 2011; accepted 30 March 2012; published online 6 May 2012; doi:10.1038/nmeth.1993 nature methods | VOL.9 NO.6 | JUNE 2012 | 585 6.2 0 0.4 0.8 1.2 1.6 2.0 Time (min) b ii iii vii Whole-cell state 1 nA 500 ms e Access resistance (MΩ) 0 0 80 1, 0 60 1, 0 40 1, 0 20 1, −45 −50 −55 −60 −65 −70 −75 −80 −85 40 0 i 200 100 0 −100 −200 −300 −400 −500 Depth (µm) Holding current (pA) d i 6.6 0 iii 0 –50 –100 –150 –200 –250 –300 Resting potential (mV) 7.0 00 ii 7.4 4.0 1, 3.5 0 −10 −20 −30 −40 −50 −60 −70 0 00 0 1, 20 0 1, 40 0 1, 60 0 1, 80 0 3.0 1, 2.5 0 2.0 Time (min) 80 1.5 70 60 50 40 30 20 10 0 80 1.0 0.5 0 0 120 100 80 60 40 20 0 60 i–iii c 40 500 iv Whole-cell state 60 0 Gigaseal state (i.e., for cellattached patch) v 1,000 Access resistance (MΩ) vi 1,500 Holding current (pA) 2,000 Pipette resistance (MΩ) Cortex Hippocampus Algorithm ends in whole-cell state Algorithm ends in gigaseal state (manual break-in) Manual whole-cell patch clamping Gigaseal formation and break-in vii Neuron hunting 2,500 of the variability in the shape and frequency of the heartbeat from cell to cell (Supplementary Note 1). Gigaseal formation is implemented as a simple feedback loop, introducing negative pressure and hyperpolarization of the pipette as needed to form the seal. Finally, break-in is implemented through the application of suction and a zap. Information about the algorithm is given in Online Methods, Supplementary Fig. 3 and Supplementary Note 1. Detailed instructions for robot construction are described in Supplementary Software (Autopatcher User Manual). The above algorithm, whose derivation took place in the cortex, was then validated in both the cortex and hippocampus to con firm generality. The robot running the algorithm (Fig. 1a,b and Supplementary Fig. 3) obtained successful whole-cell patch recordings 32.9% of the time (Supplementary Table 1; defined as <500 pA of current when held at −65 mV for at least 5 min; n = 24 out of 73 attempts) and successful gigaseal cell-attached patchclamp recording 36% of the time (defined as a stable seal of >1 GΩ resistance; n = 27 out of 75 attempts)—success rates that are simi lar to, or exceed, those of a trained investigator manually perform ing blind whole-cell patch clamping in vivo (for us, 28.8% success at whole-cell patching; n = 17 out of 59 fully manual attempts; see also refs. 2,4,5). Example traces from neurons autopatched in cor tex and hippocampus are shown in Figure 1c,d. When biocytin was included in the pipette solution, morphologies of cells could Resting potential (mV) a Pipette resistance (MΩ) set of motors and valves rapidly upon recognition of specific tem poral sequences of microelectrode impedance changes, achiev ing in vivo patch-clamp recordings in a total period of 3–7 min of robot operation. The robot is relatively inexpensive and can easily be appended to an existing patch rig. The robot (Fig. 1b) monitors pipette resistance as the pipette is lowered into the brain, and it automatically moves the pipette in incremental steps via a linear actuator. The robot also contains a set of valves connected to pressure reservoirs to provide positive pressure during pipette insertion into the brain and negative pressure for gigaseal formation and attainment of the whole-cell state (Supplementary Fig. 1). After the regional pipette localization stage, pipettes that undergo increases of resistance of >300 kΩ after this descent to depth are rejected, which greatly increases the yield of later steps (Supplementary Note 1). During neuron hunting, when the pipette is lowered into the brain in a stepwise fashion, the key indicator of neuron presence is a monotonic increase in pipette resistance across several consecutive steps (for example, a 200- to 250-kΩ increase in pipette resistance across three 2-µm steps). In our experiments, successfully detected neurons also exhib ited an increase in heartbeat modulation of the pipette current (Supplementary Fig. 2), as has been noted before2, although we omitted this in our current version of the algorithm because npg Depth (µm) 40 0 60 0 80 0 1, 00 0 1, 20 0 1, 40 0 1, 60 0 1, 80 0 Figure 2 | Autopatcher operation and performance. (a) Representative time course of pipette resistance during autopatcher operation (top), with zoomed-in view of the neuron-hunting phase (bottom). (i) The first of the series of resistance measurements that indicate neuron detection; (ii) the last of the series; (iii) when positive pressure is released; (iv) when suction is applied; Depth (µm) 1,000 (v) when holding potential starts to ramp from −30 mV to −65 mV; (vi) when it f 100 hits −65 mV; (vii) break-in. (b) Raw traces showing patch pipette currents at 80 100 the events in a, i–vii, while a square voltage wave (10 Hz, 10 mV) is applied. 60 40 (c–f) Quality of recordings from cortical and hippocampal neurons obtained with 10 20 autopatching vs. manual whole-cell patch clamping. (c) Plot of access resistances 0 1 obtained versus pipette depth (left) and bar graph summary of access resistances (mean ± s.d.) (right) for the final autopatcher whole-cell patch validation test set Depth (µm) (black symbols; n = 23); the test set in which the autopatcher concludes in the gigaseal state (open symbols, n = 24; data acquired after manual break-in); and the test set acquired via manual whole-cell patch clamp (grayed symbols; n = 15). (d) Holding current versus pipette depth (left) and summary data (right), plotted as in c. (e) Resting potential versus pipette depth (left) and summary (right), plotted as in c. (f) Holding times versus pipette depth (left) and summary (right), plotted as in c (including recordings that were either deliberately or spontaneously terminated). 40 0 60 0 80 0 1, 00 0 1, 20 0 1, 40 0 1, 60 0 1, 80 0 Holding time (min) Holding time (min) © 2012 Nature America, Inc. All rights reserved. brief communications 586 | VOL.9 NO.6 | JUNE 2012 | nature methods npg © 2012 Nature America, Inc. All rights reserved. brief communications be visualized histologically (Fig. 1e and Supplementary Fig. 4). Focusing on the robot’s performance after regional pipette locali zation (that is, leaving out losses due to pipette blockage during the descent to depth), the autopatcher was successful at whole-cell patch clamping 43.6% of the time (Supplementary Table 1; n = 24 out of 55 attempts starting with the neuron-hunting stage), and at gigaseal cell-attached patch clamping 45.8% of the time (n = 27 out of 59 attempts). Of the successful recordings approximately 10% were putative glia, as reflected by their capacitance and lack of spiking6 (4 out of 51 successful autopatched recordings; 2 out of 17 successful fully manual recordings). For simplicity we analyzed only the neurons in the rest of the paper; their various firing patterns are described in Supplementary Note 2. From the beginning of the neuron-hunting stage to acquisition of successful whole-cell or gigaseal cell-attached recordings took 5 ± 2 min for the robot to perform (Supplementary Table 1), not significantly different from the duration of fully manual patching (5 ± 3 min; P = 0.7539; t-test; n = 47 autopatched neurons, 15 fully manually patched neurons). A representative autopatcher run plotting the pipette resistance versus time is shown in Figure 2a, with key events indicated by roman numerals; raw current traces resulting from the continu ously applied voltage pulses (from which the pipette resistances were derived) are shown in Figure 2b. Note the change in pipette currents observed when a neuron is detected (Fig. 2b, event ii). See Online Methods for details of the autopatcher time course and execution. The quality of cells recorded by the autopatcher was comparable to those in published studies conducted by skilled human investigators2,4,7–9 and to our own fully manually patched cells (Fig. 2c–f and Supplementary Fig. 5). These comparisons showed no statistically significant difference between n = 23 whole-cell autopatched and n = 15 fully manually patched neu rons for access resistance, holding current, resting membrane potential, holding time, gigaseal resistance, cell membrane capacitance or cell membrane resistance (detailed statistics in Supplementary Notes 3 and 4). Once the robot has been assembled, it can easily be used to derive alternative or specialized algorithms (for example, if a specialized cell type is the target, if image-guided or other styles of patching are desired or if it is desirable to combine the auto patcher with other technologies such as optogenetics for cell type identification10). As an example, we derived a variant of the algo rithm that uses pulses of suction for break-in rather than a zap (Supplementary Fig. 6); the yields, cell qualities and cell properties obtained by the suction-pulse variation of the autopatch algorithm were comparable to those obtained by the original algorithm (Supplementary Fig. 7). The inherent data logging of the robot allows quantitative analyses of the patch process, for example, revealing that the probability of success of autopatching starts at 50–70% in the first hour, and then drops to 20–50% over the next few hours, presumably due to cellular displacement intrinsic to the in vivo patching process (Supplementary Fig. 7d). We have developed a robot that automatically performs patch clamping in vivo and demonstrated its use in the cortex and hippocampus of live mice. We anticipate that other applications of robotics to the automation of in vivo neuroscience experiments, and to other in vivo assays in bioengineering and medicine, will be possible. The ability to automatically make micropipettes in a high-throughput fashion11, and to install them automatically, might eliminate some of the few remaining steps requiring human intervention. The use of automated respiratory and temperature monitoring could enable a single human operator to control many rigs at once, further increasing throughput (see Supplementary Note 5 for discussion of throughput). Methods Methods and any associated references are available in the online version of the paper. Note: Supplementary information is available in the online version of the paper. Acknowledgments We would like to acknowledge electronic switch design by G. Holst at Georgia Tech. E.S.B. acknowledges funding by the US National Institutes of Health (NIH) Director′s New Innovator Award (DP2OD002002) and the NIH EUREKA Award program (1R01NS075421) and other NIH grants, the New York Stem Cell Foundation Robertson Neuroscience Award, the National Science Foundation (NSF) CAREER award (CBET 1053233) and other NSF grants, Jerry and Marge Burnett, Google, Human Frontiers Science Program, MIT McGovern Institute and McGovern Institute Neurotechnology Award Program, MIT Media Lab, NARSAD, Paul Allen Distinguished Investigator Award, Alfred P. Sloan Foundation and Wallace H. Coulter Foundation. C.R.F. acknowledges funding by the NSF (CISE 1110947, EHR 0965945) as well as the American Heart Association (10GRNT4430029), Georgia Economic Development Association, Wallace H. Coulter Foundation, Center for Disease Control and NSF National Nanotechnology Infrastructure Network (NNIN) and from the Georgia Tech Institute for BioEngineering and BioSciences Junior Faculty Award, Technology Fee Fund, Invention Studio and George W. Woodruff School of Mechanical Engineering. AUTHOR CONTRIBUTIONS S.B.K., G.T.F., B.Y.C, E.S.B. and C.R.F. designed devices and experiments and wrote the paper. S.B.K. conducted experiments. G.T.F. assisted with experiments and autopatcher pilot testing. COMPETING FINANCIAL INTERESTS The authors declare no competing financial interests. Published online at http://www.nature.com/doifinder/10.1038/nmeth.1993. Reprints and permissions information is available online at http://www.nature. com/reprints/index.html. 1. Hamill, O.P., Marty, A., Neher, E., Sakmann, B. & Sigworth, F.J. Pflugers Arch. 391, 85–100 (1981). 2. Margrie, T.W., Brecht, M. & Sakmann, B. Pflugers Arch. 444, 491–498 (2002). 3. Eberwine, J. et al. Proc. Natl. Acad. Sci. USA 89, 3010–3014 (1992). 4. Lee, A.K., Epsztein, J. & Brecht, M. Nat. Protoc. 4, 385–392 (2009). 5. Kitamura, K., Judkewitz, B., Kano, M., Denk, W. & Hausser, M. Nat. Methods 5, 61–67 (2008). 6. Trachtenberg, M.C. & Pollen, D.A. Science 167, 1248–1252 (1970). 7. Harvey, C.D., Collman, F., Dombeck, D.A. & Tank, D.W. Nature 461, 941–946 (2009). 8. DeWeese, M.R. & Zador, A.M. J. Neurosci. 26, 12206–12218 (2006). 9. DeWeese, M.R. Curr. Protoc. Neurosci. 38, 6.22.1–6.22.15 (2007). 10. Boyden, E.S. F1000 Biol. Rep. 3, 11 (2011). 11. Pak, N., Dergance, M.J., Emerick, M.T., Gagnon, E.B. & Forest, C.R. J. Mech. Des. 133, 061006 (2011). nature methods | VOL.9 NO.6 | JUNE 2012 | 587 © 2012 Nature America, Inc. All rights reserved. npg ONLINE METHODS Surgical procedures. All animal procedures were approved by the Massachusetts Institute of Technology (MIT) Committee on Animal Care. Adult male C57BL/6 mice, 8–12 weeks old, were purchased from Taconic. During the period before the experiment, the mice were housed in standard cages in the MIT animal facility with ad libitum food and water in a controlled light-dark cycle environment, with standard monitoring by veterinary staff. On the day of the experiment, they were anesthetized using ketamine and xylazine (initially at 100 mg kg−1 and 10 mg kg−1, respectively, and redosed at 30–45 min intervals with 10–15% of the initial keta mine dose as needed, using toe pinch reflex as a standard metric of anesthesia depth). The scalp was shaved, and the mouse placed in a custom stereotax, with ophthalmic ointment applied to the eyes, and with Betadine and 70% ethanol used to sterilize the surgical area. Three self-tapping screws (F000CE094, Morris Precision Screws and Parts) were attached to the skull, and a plastic head plate was affixed using dental acrylic, as previously described 12. Once set (~20 min), the mice were removed from the stereotactic apparatus and placed in a custom-built low profile holder. A dental drill was used to open up one or more craniotomies (1–2 mm diameter) by thinning the skull until ~100 µm thick, and then a small aperture was opened up with a 30 gauge needle tip. Cortical craniotomies occurred at stereotaxic coordinates: anteroposterior, 0 mm relative to bregma; mediolateral, 0–1 mm left or right of the midline; neuron hunting began at 400 µm depth. Hippocampal craniotomies occurred at stereotaxic coordinates: anteroposterior, −2 mm relative to bregma; mediolateral, 0.75–1.25 mm left or right of the midline; neuron hunting began at 1,100 µm depth. It is critical to ensure that bleeding is minimal and the craniotomy is clean to allow good visualization of the pipette and minimize the number of pipettes blocked after insertion into the brain. The dura was removed using a pair of fine forceps. The craniotomy was superfused with artificial cerebrospinal fluid (ACSF, con sisting of 126 mM NaCl, 3 mM KCl, 1.25 mM NaH2PO4, 2 mM CaCl2, 2 mM MgSO4, 24 mM NaHCO3 and 10 mM glucose), to keep the brain moist until the moment of pipette insertion. Seventeen mice were used to derive the autopatching algorithm (Supplementary Fig. 3). Sixteen mice were used to validate the robot for the primary test set (Fig. 2, Supplementary Fig. 5a and Supplementary Fig. 5b). For the manual experiments (Fig. 2c–f and Supplementary Fig. 5c), we used four mice. For the develop ment of the suction-based autopatching variant (Supplementary Figs. 6,7), we used five mice. Out of the five mice used for suctionbased autopatching, three were used for the throughput estima tions (Supplementary Note 5). For biocytin filling experiments (Fig. 1e and Supplementary Fig. 4) and validation of heartbeat modulation as a method for confirming neuronal detection (Supplementary Note 1), we used six additional mice. At the end of the patch-clamp recording, mice were euthanized, while still fully anesthetized, via cervical dislocation, unless bio cytin filling was attempted. In the case of biocytin filling, the mice were anesthetized with isoflurane, then transcardially perfused with 4% paraformaldehyde in phosphate buffered saline (PBS) (see “Histology and imaging”). Electrophysiology. Borosilicate glass pipettes (Warner) were pulled using a filament micropipette puller (Flaming-Brown P97 model, Sutter Instruments) within a few hours before the nature methods beginning of the experiment and stored in a closed Petri dish to reduce dust contamination. We pulled glass pipettes with resistances between 3–9 MΩ. The intracellular pipette solu tion consisted of (in mM): 125 potassium gluconate (with more added empirically at the end, to bring osmolarity up to ~290 mOsm), 0.1 CaCl2, 0.6 MgCl2, 1 EGTA, 10 HEPES, 4 MgATP, 0.4 Na GTP, 8 NaCl (pH 7.23, osmolarity 289 mOsm), similar as to what has been used in the past13. For experiments with biocytin, 0.5% biocytin (weight/volume) was added to the solu tion before the final gluconate-based osmolarity adjustment, and osmolarity then adjusted (to 292 mOsm) with potassium gluconate. We performed manual patch clamping using previously described protocols2,9, with some modifications and iterations as explained in the text, in order to prototype algorithm steps and to test them. Robot construction. We assembled the autopatcher (Fig. 1b and Supplementary Fig. 1) through modification of a standard in vivo patch-clamping system. The standard system comprised a three-axis linear actuator (MC1000e, Siskiyou Inc.) for hold ing the patch headstage and a patch amplifier (Multiclamp 700B, Molecular Devices) that connects its patch headstage to a com puter through an analog/digital interface board (Digidata 1440A, Molecular Devices). For programmable actuation of the pipette in the vertical direction, we mounted a programmable linear motor (PZC12, Newport) onto the three-axis linear actuator. (Note that if the vertical axis of the three-axis linear actuator is computercontrolled, this can be omitted.) For experiments where we attempted biocytin filling, we mounted the programmable linear motor at a 45° angle to the vertical axis to reduce the amount of background staining in the coronal plane that we did histological sectioning along. The headstage was in turn mounted on the pro grammable linear motor through a custom mounting plate. The programmable linear motor was controlled using a motor controller (PZC200, Newport Inc.) that was connected to the computer through a serial COM port. An additional data acquisition (DAQ) board (USB 6259 BNC, National Instruments Inc.) was connected to the computer via a USB port, and to the patch amplifier through BNC cables, for control of patch pipette voltage commands and acquisition of pipette current data during the execution of the autopatcher algorithm. (If the patch amplifier provides direct access to these measurements, this can be omitted.) During autopatcher operation, the USB 6259 board sent commands to the patch amplifier; after acquisition of cell-attached or wholecell patched neurons, the patch amplifier would instead receive commands from the Digidata; we used a software-controlled TTL co-axial BNC relay (CX230, Tohtsu) for driving signal switching between the USB 6259 BNC and the Digidata, so that only one would be empowered to command the patch amplifier at any time. The patch amplifier streamed its data to the analog input ports of both the USB DAQ and the Digidata throughout and after autopatching. For pneumatic control of pipette pressure, we used a set of three solenoid valves (two input, one output, LHDA0533215H-A, Lee Company). They were arranged and operated in the configuration shown in Supplementary Figure 1. The autopatcher program was coded in and run by Labview 8.6 (National Instruments). Detailed instructions for robot construc tion are described in the Supplementary Software (Autopatcher User Manual). doi:10.1038/nmeth.1993 npg © 2012 Nature America, Inc. All rights reserved. The USB6259 DAQ sampled the patch amplifier at 30 KHz and with unity gain applied, and it then filtered the signal using a moving average smoothening filter (half-width, six samples, with triangular envelope). The amplitude of the current pulses was measured using the peak-to-peak measurement function of Labview. During the entire procedure, a square wave of voltage was applied, 10 mV in amplitude at 10 Hz, to the patch amplifier pipette output via the USB6259 DAQ analog output. Resistance values were then computed by dividing applied voltage by the peak-to-peak current observed for five consecutive voltage pulses, and then these five values were averaged. Once the autopatch process was complete, neurons were recorded using Clampex software (Molecular Devices). Signals were acquired at standard rates (for example, 30–50 KHz) and low-pass filtered (Bessel filter, 10 KHz cutoff). All data was analyzed using Clampfit software (Molecular Devices) and MATLAB (MathWorks). Robot operation. At the beginning of the experiment, we installed a pipette after filling it with pipette solution using a thin polyimide/ fused silica needle (Microfil) attached to a syringe (1 mL) with syringe filter (0.2 µm). We removed excess ACSF to improve visualization of the brain surface in the pipette-lowering stage and then applied positive pressure (800–1,000 mbar), low positive pressure (25–30 mbar) and suction pressure (−15 to −20 mbar) at the designated ports (Fig. 1, Supplementary Fig. 1) and clamped the tubing to the input ports with butterfly clips; the initial state of high positive pressure was present at this time (with all valves electrically off). We used the three-axis linear actuator to manu ally position the pipette tip over the craniotomy using a control joystick with the aid of a stereomicroscope (Nikon). The pipette was lowered until it just touched the brain surface (indicated by dimpling of the surface) and retracted back by 20–30 µm. The autopatcher software then denoted this position just above the brain surface, as z = 0 for the purposes of executing the algo rithm (Supplementary Fig. 3), and acquired the baseline value R(0) of the pipette resistance. (The z axis is the vertical axis perpendicular to the earth’s surface, with greater values going downward.) The pipette voltage offset was automatically nullified by the ‘pipette offset’ function in the Multiclamp Commander (Molecular Devices). We ensured that the electrode wire in the pipette was sufficiently coated with silver chloride to minimize pipette current drift, which can affect the detection of the small resistance measurements that occur during autopatcher opera tion. The brain surface was then superfused with ACSF, and the autopatcher program was started. See included Supplementary Software (Autopatcher User Manual) for detailed description of running the Labview program for autopatching. Updated versions of the software and user manual will be made available online at http://autopatcher.org/. Details of autopatcher program execution. The autopatcher evaluates the pipette electrical resistance outside the brain (for example, between 3–9 MΩ is typical) for 30–60 s to check whether AgCl pellets or other particulates internally clog the pipette (indi cated by increases in resistance). If the pipette resistance remains constant and has an acceptable value, the autopatcher program is started. The program records the resistance of the pipette outside the brain and automatically lowers the pipette to a pre-specified target region within the brain (the stage labeled ‘regional pipette doi:10.1038/nmeth.1993 localization’ in Fig. 1a), after which a second critical examination of the pipette resistance is carried out for quality control. This check is followed by an iterative process of lowering the pipette by small increments while looking for a pipette resistance change that indicates proximity to a suitable neuron (the neuron-hunting stage). The robot uses a specific sequence of resistance changes to detect proximal neurons and avoid false positives that would waste time and decrease cell yield. After detecting this signature, the robot halts movement and begins to actuate suction and pipette voltage changes so as to form a high-quality seal con necting the pipette electrically to the outside of the cell mem brane (the gigaseal formation stage), thus resulting in a gigaseal cell-attached recording. If whole-cell access is desired, the robot can then be used to perform controlled application of suction in combination with brief electrical pulses to break into the cell (the break-in stage, Supplementary Fig. 3). Alternatively, break-in can be achieved using pulses of suction (Supplementary Fig. 6). Throughout the process, the robot applies a voltage square wave to the pipette (10 Hz, 10 mV alternating with 0 mV relative to pipette holding voltage), and the current is measured in order to calculate the resistance of the pipette at a given depth or stage of the process. Throughout the entire process of robot operation, this pipette resistance is the chief indicator of pipette quality, cell presence, seal quality and recording quality, and the algo rithm attempts to make decisions—such as whether to advance to the next stage, restart a stage or halt the process—entirely on the basis of the temporal trajectory taken by the pipette resist ance during the experiment. Robot performance is enabled by two critical abilities: its ability to monitor the pipette resistance quantitatively over time and its ability to execute actions in a temporally precise fashion once the measured pipette resistance reaches quantitative milestones. Focusing on the data for the n = 47 neurons in the main vali dation test set: the neuron-hunting stage took on average 2.5 ± 1.7 min. The time to find a target that later led to successful as compared to an unsuccessful gigaseal did not differ significantly (P = 0.8114, t-test, n = 58 unsuccessful gigaseal formation trials); that is, failed trials did not take longer than successful ones. The gigaseal formation took 2.6 ± 1.0 min, including the few seconds required for break-in for the whole-cell autopatched case; failed attempts to form gigaseals were truncated at the end of the rampdown procedure and thus took ~85 s. These durations are simi lar to those obtained by trained human investigators practicing published protocols4. Histology and imaging. For experiments with biocytin filling of cells, mice were perfused through the left cardiac ventricle with ~40 mL of ice-cold 4% paraformaldehyde in PBS while anes thetized with isoflurane. Perfused brains were then removed from the skull and postfixed overnight in the same solution at 4 °C. The fixed brains were incubated in 30% sucrose solu tion for 2 d until cryoprotected (that is, until the brains sank). The brains were flash frozen in isopentane cooled using dry ice at temperatures between −30 °C and −40 °C. The flash frozen brains were mounted on mounting plates using OCT as base and covered with tissue-embedding matrix to preserve tissue integrity. Slices 40 µm thick were cut at −20 °C using a cryostat (Leica). The brain slices were mounted on charged glass slides (for example, SuperFrost) and incubated at room temperature nature methods Image stacks were obtained using a confocal microscope (Zeiss) with 20× objective lens. Maximum intensity projections of the image stacks were taken using ImageJ software. If full neuron morphology needed to be reconstructed, multiple such maxi mum intensity projection images were auto-leveled and then montaged using Photoshop CS5 software. 12. Boyden, E.S. & Raymond, J.L. Neuron 39, 1031–1042 (2003). 13. Chow, B.Y. et al. Nature 463, 98–102 (2010). npg © 2012 Nature America, Inc. All rights reserved. for 4 h in PBS containing 0.5% Triton-X (vol/vol) and 2% goat serum (vol/vol). This was followed by 12–14 h of incubation at 4 °C in PBS containing 0.5% Triton-X (vol/vol), 2% goat serum (vol/vol) and Alexa 594 conjugated with streptavidin (Life Technologies, diluted 1:200). After incubation, the slices were thoroughly washed in PBS containing 100 mM glycine and 0.5% Triton-X (vol/vol) followed by PBS with 100 mM glycine. Slices were then mounted in Vectashield with DAPI (Vector Labs), covered using a coverslip and sealed using nail polish. nature methods doi:10.1038/nmeth.1993