1
January 1990
A. E. Ext. 90-1
A Guide to Processing Dairy Farm Business Summaries in County and Regional Extension Offices for I Micr()DFBS V 2.4 I IBM PC, XT AND IBM-Compatible Microcomputers
Linda D. Putnam Wayne A. Knoblauch Stuart F. Smith
•
.
-
Department of Agrlcuhural Economics
New York State College of Agrlcuhure and Life Sciences A Statutory College of the State University Cornell University, Ithaca, New York 14853 <
...
TABLE OF CONTENTS INTRODUCTION
1
HARDWARE REQUIREMENTS ...................................................
1
GETTING STARTED..........................................................
1
I.
Make backup copies of diskettes ................................
2
II.
Start the program ..............................................
2
III.
Final startup instructions - the INSTALL program...............
5
IV.
Enter the input data ...........................................
7
V.
Verify the data ................................................ 27 VI.
Calculate and print farm summary ............................... 28 VII.
Check the diagnostics page ..................................... 41 VIII. Update a record ................................................ 41 IX.
Display a record ............................................... 41 X.
Delete a record ................................................ 41 XI.
Help ........................................................... 41 XI I .
Qui t . . . . . . . . . . . . . . . . . . . . . . . . . . . . . . . . . . . . . . . . . . . . . . . . . . . . . . . . . .. 41 XIII. Make two backup copies of the data diskette .................... 42 DFBS ERROR MESSAGES ..................................................... 43 WHAT TO DO WHEN THE DISKETTE GETS FULL .................................. 44 HINTS FOR INTERPRETING AND USING DAIRY FARM BUSINESS SUMMARY DIAGNOSTICS .................................................. 45 APPENDIX A.
HOW TO COMPLETE DFBS CHECK-IN FORMS ........................ 59 APPENDIX B.
PROCEDURES FOR CALCULATING COST OF PRODUCING MILK .......... 71 APPENDIX C.
CREATION OF A CONFIG.SYS FILE .............................. 75 INTRODUCTION
This publication is a guide to using the Microcomputer Dairy Farm
Business Summary (Micro DFBS) computer program for analyzing individual dairy
farm businesses. County Extension agents and regional specialists are the
intended audience, however, college faculty in other states may also find
this publication of value. Farm business summary and analysis projects have
long been a basic part of the agricultural Extension program in New York
State. Records submitted by New York State dairy farmers provide the basis
for many Extension educational programs and the data for applied research
studies and classroom teaching.
Extension offices with appropriate microcomputers have the capability to
strengthen their dairy farm business analysis activities by calculating and
printing the individual farm summaries for immediate use by the agent and
farmer, at any time. After entry in the county, individual farm data is sent
to the Department of Agricultural Economics at Cornell University for
additional review prior to calculation of county, regional, and State
summaries.
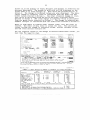
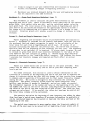
HARDWARE REQUIREMENTS
Version 2.4 of the Micro DFBS program will run on IBM
compatible computers such as Compaq with a minimum of 256K
memory (RAM). The DOS 2.0 (or higher) operating system is
two floppy disk drives or one floppy and one hard disk are
PC and XT and IBM
of random-access
needed. Either
needed.
Printers vary from one Extension office to another, and an effort is
made to make the program work with as many printers as possible. Most
printers capable of printing in pica type (10 characters per inch, 66 lines
per page) should work.
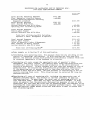
Each farm summary printout is 11 pages long and you typically need three
copies -- one for the farmer, one for your county or regional Extension
office file, and one to send to Cornell for the regional and State summaries.
Triple-copy paper will allow you to print all three copies at once if a dot
matrix printer is used.
GETTING STARTED
This tutorial section will serve as a learning guide and "hands-on"
exercise in using Micro DFBS. The user becomes familiar with the operation
of Micro DFBS by:
a)
b)
c)
d)
e)
making backup copies of diskettes
starting the program
typing information from a sample input form
calculating and printing a summary
preparing a diskette for shipment to Cornell
This tutorial assumes that a suitable microcomputer and printer are available
and the user knows how to operate them. Microcomputer hardware requirements
were explained above. If you are not familiar with the operation of your
microcomputer and operating system, refer to its ~ manual.
2
I.
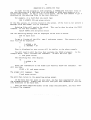
Make backup copy of diskette.
You should have received a program diskette that also has sample data
on it. Make a copy of this diskette, put the original diskette in a
safe place, and use the copy. Use the DOS "copy" command. For
example, on a computer with two floppy disk drives, after booting the
computer, place the diskette to be copied in Drive A and a blank
formatted diskette in Drive B and type:
copy a:*.* b: ~ (return key)
The names of the files being copied will appear on the screen as they
are copied. The sample farm has three data files on the diskette:
<38006>.89 is the current year's data file,
<38006>.880 is the 1988 output file, and
<38006>.870 is the 1987 output file.
The 1988 and 1987 output data files are required for use by the
current year data file «farm no.>.89) in order to print a "Progress
of the Farm Business" table on page 1 of the output. The 1989 data
file contains data from the 1988 data file, such as beginning of year
inventory values and beginning of year assets and liabilities.
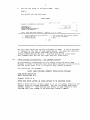
II.
Start the prosram.
Important - be sure to always enter the correct date when you start
the computer to run Micro DFBS. Micro DFBS prints this date on the
summary printout. It also assumes that the summary is for the
previous year. For example, if you enter 1-1-90, the printout will
show:
1989 Dairy Farm Business Summary
If you don't enter the date and instead leave it as the default of 1
01-1980, the printout will show:
1979 Dairy Farm Business Summary
which is probably not what you wanted.
Follow A or B depending on the hardware system you are using.
A.
1
Two floppy disk drives (IBM PC, Compaq):
Insert your DOS diskette in drive A (the left-hand drive) and turn
on the computer and printer. Wait until DOS is loaded. Type the
date and time, if asked. You should see a prompt A>. This means
that drive A is the default drive. If you were not prompted for
the date as the computer was booting, at the A> prompt type:
date 1-1-90 ~
1If you have not already done so, be sure to make a backup copy of your
program diskette.
3
Take out the DOS diskette. Insert the Micro DFBS program diskette
in drive A and a blank formatted data diskette in drive B (right
hand drive).
Copy the sample data files from the program diskette in drive A to
the blank formatted disk in drive B:
copy a:38006.* b: ~
Skip to C on page 5.
B.
One floppy and one hard drive (IBM XT):
If you have previously loaded DOS onto the hard disk 2 , turn on the
computer and printer with the floppy drive empty. Wait until DOS
is loaded from the hard disk. Type the date and time, if asked.
If you were not prompted for the date as the computer was booting
and the computer does not have an internal calendar, at the C>
prompt type:
If you will be storing data on the hard disk and/or operating the
program from the hard disk, it is advisable to set up a separate
directory on the hard disk for this purpose. 3 We'll call the
directory DFBS. First, let's check if the directory DFBS already
exists. To check, type:
CD \DFBS ~
If it does exist, you will see the prompt C> reappear. If it does
not exist, you will see 'invalid directory', so set it up. To set
up a directory named DFBS, from the prompt C>, type:
MD \DFBS ~
Each time Micro DFBS is rerun on a one-floppy/one-hard disk sys
tem, the Micro DFBS directory must be accessed using the command:
CD \DFBS ~
The program diskette contains sample data files which must be
2If you have not previously loaded DOS onto the hard disk, follow the
procedure in A, and when you see the prompt A>, type:
C:~
(The symbol ~ stands for a carriage return.)
Upper- or lower-case letters will do.
This makes drive C the default drive.
SIf you are unfamiliar with the concept of a directory, refer to your DOS
manual. Typing the command "prompt $p$g" or inserting this command in your
autoexec.bat file will change your C> prompt to show which directory you are
in, such as C:\DFBS>.
4
copied to your new Micro DFBS directory if you select to store
data on the hard disk. Insert the program disk into drive A and
copy the sample data files by typing:
COpy A:38006.* ~
The C> prompt should reappear.
The Micro DFBS program may be run from the hard disk drive or from
the floppy disk drive.
1.
Operating the Micro DFBS program from the hard disk drive:
The Micro DFBS program diskette contains all the files
necessary to run the Micro DFBS program. These files must be
copied to your 'DFBS' directory to be able to run the program
from the hard disk. If you are not already in the 'DFBS'
directory, type 'CD \DFBS'. Insert the Micro DFBS program
diskette into drive A and copy all the files to the hard disk
by typing:
COpy A:*.* ~
The names of the files being copied will appear on the screen
as they are copied to the hard disk. The C> prompt should
reappear after all the files are copied.
2.
Operating the Micro DFBS program from the floppy disk drive:
Insert the Micro DFBS program diskette in drive A.
Type:
A:~
This makes the A drive the default drive. With the Micro DFBS
program operating from the A drive, you will need to store the
data files on the C drive as there is insufficient space on
the program diskette. The "Install" program described in
Section III will enable you to specify the C drive for data
storage.
Note: The MD \DFBS and COPY commands need to be used only once
the directory and files will remain after the session is
ended and can be used in future sessions.
MM
5
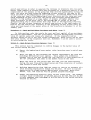
C.
You are now ready to run Micro DFBS.
Type:
DFBS ..J
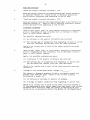
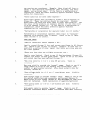
You should see the main menu.
MAIN MENU
DATF:
/
1/511y90
COl'.NELL COOPERATIVE EXTENSION
----_/
/
/
Prepared by
DEPARTMENT OF
AGRICULTURAL ECONOMICS CORNELL UNIVERSITY
/
NEW Y0RK \
Dairy Farm Business Summary
Version
Create/Update/Display Record
Verify Record
Delete Record
2.~
(C) 1989
Calculate and Print Farm Summar;
Run Install Program
Help
[ 1 Quit.
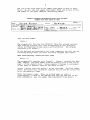
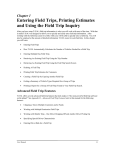
The main menu shows the options available in DFBS. A set of brackets
[ ] appears to the left of each named option. An underline character
f_J is used as the cursor and marks the first option
'CreatejUpdate/Display Record'. Practice moving the cursor keys.
What happens when you use the right and left arrow keys?
III.
Final startup instructions - the INSTALL program
An installation program must be run before using the Micro DFBS
Program in order to specify which disk drive data are to be stored on.
Use the cursor keys (t or .J.) to select "Run Install Program".
You should get the message:
DAIRY FARK BUSINESS SUMMARY INSTALLATION PROGRAM
DISX DRIVE SELECTION
Valid drives are A-G Present Drive is a:
ENTER NEV DRIVE LETTER OR PRESS RETURN TO OX EXISTING DRIVE
Enter a
correct
system,
setting
drive letter, in
drive is already
type B..J. Once
until you change
most cases A, B, or C or press return if the
specified. For the two floppy disk drive
you set the drive, it will remain at that
it by selecting "install" again.
6
You should then see the following menu:
CURRENT DIRECTORY IS \
CHOOSE OPTION:
1: HAKE A DIRECTORY
2: REMOVE A DIRECTORY
3: SET NEV PATH TO DIRECTORY
0: CONTINUE INSTALLATION
OPTION:
This menu allows the user to create and select the path for the
storage of data in the program. The current path will display at the
top of the menu. If the path displayed is correct then choose 0
(zero) to continue installation and save the current path.
If the path displayed needs to be changed or a new subdirectory needs
to be created, then select those items from the menu. For example, to
create a subdirectory on the hard disk called DFBSDATA (within the
directory c:\dfbs) you select 1 from the menu. The program will then
prompt you for the name of the new directory. To specify the name you
would type the complete path name to the new directory, e.g.,
C:\DFBS\DFBSDATA and press the return key. The program will now
create the desired subdirectory. After the new directory is created
the menu will again appear, the new path should be displayed at the
top of the screen. If the path is not correct you can use option
number 3 to set the proper path.
If you will be storing the data on a floppy diskette, it is not
necessary to create a directory on the diskette. Choose option 3 from
the menu and when prompted for the directory name simply type ~
(return/enter).
When you are satisfied with your selection, type 0 to continue
installation.
FOR DOS 1.XX USERS:
The path command is not implemented in this version of DOS and you
will get an error message if you try to specify a path or create a
subdirectory. To properly install the program for this version enter
the desired disk drive and then select option 3 from the menu and,
when prompted for a path, press return. There should be either a \ or
nothing displayed at the top of the screen where the path is normally
displayed. Once this is done type 0 to continue installation.
***FAILURE TO PROPERLY SET THE PATH WILL RESULT IN THE DATA BEING
DIRECTED TO THE WRONG SUBDIRECTORY OR IN THE PROGRAM ABORTING WITH AN
"I/O ERROR 01" ERROR MESSAGE DISPlAYED.***
The following message will appear on the screen:
PRINT PRELIMINARY SUMMARIES?
[YIN]
Typing nyu for yes will print the word "Preliminary" on page 1 of the
Dairy Farm Business Summary printout. Typing "N" for no does not
print "Preliminary" and the printout is then considered in final form.
7
This setting will remain until this part of the install program is
accessed again. County Extension offices are encouraged to leave the
setting at "Preliminary". The final versions of the summary are
printed at Cornell.
IV.
Enter the input data.·
The CreatejUpdate/Display Record option on the main menu is used to
enter input data for a new farm or to change or display a previously
entered farm record. Use the cursor keys (t or +) to select this
option. Type:
..J
to select the 'CreatejUpdate/Display Record' option.
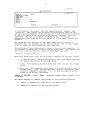
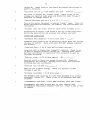
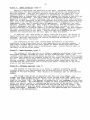
You will see a prompt to enter a farm number. The farm number
assigned will be made up of your 2·digit county number, followed by a
3·digit number identifying the individual farm.
MAIN MENU WITH FARM NUMBER PROMPT
DATE: 1/5/1990
/
CORNELL COOPERATIVE EXTENSION
/
----_/
Prepared by
/
DEPARTMENT OF
j
ECONOMICS
CORNELL UNIVERSITY
AGRICL~TURAL
NEW YORK
1 - - - - \
\-----:-
\_1
Dairy Farm
Busin~ss
Summary
2.~
Version
Create/Update/Display Record
Verify Record
Delete Record
(Cl 1989
Calculate and Print Farm Summary
Run Install Program
Help
[ J Quit
ENTER FARM NO OR PRESS ENTER TO RETURN TO
MEl'ru
Important • select farm numbers carefully following the recommended
procedure. You must assign the same number to the same farm each year
and assign a new number to a new farm. This is essential for the
first page of the summary, "Progress of The Farm Business", and page
7, "Repayment Analysis", to work properly.
If you make an error entering data and you notice it before typing the
.J (return/enter) key, you can correct the error by using the
backspace key, delete key or the ~ key to erase the error, and type
the correct entry. If you type ..J (return/enter) before noticing the
error, you can move back to the incorrect entry by using the t key,
and then retype the number.
·See Appendix A for guidelines to completing the Dairy Farm Business Summary
check· in form.
8
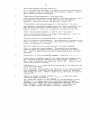
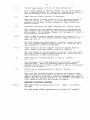
The top of the first page of our sample farm check-in form is shown
below. We will call our sample farm number 38006 and we have written
the number in the space labelled "Processing number".
CORNELL COOPERATIVE EXTENSION DAIRY FARM BUSINESS
SUMMARY AND DATA CHECK-IN FORM
SCREEN 1.
County _~R~ow.:c...="!';~~\.L::Q.=-.un'-liid.-~________
SO-rnf \e. FQs me..'""
Name
Farm Name
Address
-:'R;:-::t>~I--t:>::--Q-!~t:-::9"------
})Q.·"qt+own
Phone no.
,"07": ':).55-
N¥
'C\~7b
iLf ~,
Proc. number
<)<Jcomplete,
Update Screens:
3<& 00 b
)entered,
Year 1989
)ready
Type the farm number:
38006 ...J
The program will find the file 38006.89. This file already contains
data from the previous year, such as beginning of year inventory
values and beginning of year assets and liabilities. The program
continues on to Screen 1.
If the data you are entering is for a new cooperator you will see the
following message after you enter the newly assigned farm number:
Data files missing, create new ones (Y/N)
Enter y ...J
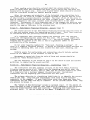
The program will continue on to Screen 1. Screen I contains the farm
name, address, and phone number from the boxed-in area at the top of
page 1 of the check-in form. Screen numbers 2 through 14 correspond
to the other 13 boxed-in areas of the check-in form.
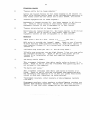
Screen 1 should look like Screen 1 on the next page. The farm number,
state, and county will already be inserted for you and the cursor will
be at the operator's name.
Enter the farmer's name. There is no farm name, so enter ...J
(return/enter) to move to the address line and type the rest of the
farm information, (use the sample farm information from above).
9
Screen II
FARM INFORMATION
Verified [N)
Farm No ......... 38006
Operator's Name.
Farm Name ...... .
Address ...•.....
City ........... .
State ........... NY
Zip .•.....•.....
County .......... ROCKLAND
Phone ........... (
)
Regular [
Irregular [ )
At the bottom of the screen, find the classifications "Regular" and
"Irregular". The regular and irregular classifications indicate the
accuracy and completeness of the information for determination of whether
or not this farm will be included in the county, regional, and state
summaries. Regular is included; irregular is not. Select the
appropriate classification by entering an "x" in the space between the
brackets.
The "Verified [N]" notation in the upper right corner of Screen 1
indicates that the data has not yet been verified. The "N" will change
to a "Y" after the verification has been completed.
The entering of farm information in Screen 1 has now been completed. It
is possible to change data in the screen at this point. For example, use
the t and .. keys to move the cursor to "Farm Name" and type:
Sam Hill ~ (return/enter)
There are three ways to get out of Screen 1 and move to the next screen:
1) ~ (return/enter). Keep pressing return until the cursor goes off
the screen and you get the message below.
2) ~ key.
below.
Keep pressing the down arrow key until you get the message
3) [Esc] key. The escape key only needs to be pressed once to get the
message below. Note: Use this key with caution. On screens with
totals or computed values use ~ or ~ to move through the entire
screen so values are calculated.
[PgDn] or [RETURN] - next, [PgUp] - previous screen, [Esc] to exit, or #
of Screen.
The above message or command line allows you four courses of action:
1) [PgDn] or [RETURN] will take you to the next screen.
2) [PgUp] will take you to the previous screen.
10 3) [Esc] will exit the screen and take you back to the main menu.
4) # of Screen, i.e., enter the number of any screen to move to that
screen. It is not necessary to ~ (Return/Enter) after entering
the Screen #.
Screen 11
FARM INFORMATION
Verified [N)
Farm No . . . . . . . . .
Operator's Name.
Farm Name ......•
Address .........
City .....•......
State ...........
Zip .............
County ..........
Phone .....•.....
38006
Sample Farmer
Sam Hill
RD1 Box 19
I
I!
Dairyto~
I!
NY
19876
ROCKLAND
(607 )255- 8(029
I
Regular [ ]
Irregular [x]
[PgDnJor[RETURN]-next, [PgUp]-previous screer., [Esc) to exit, Or
* of
Screen.
Move to Screen 2 by typing:
.J as many times as necessary.
You should see Screen 2.
Farm No.3BDD6
Screen *2
MACHINERY AND EQUIPMENT INVENTORY AND DEPRECIATION
Machinery & Equipment Inventory Beginning S
90000
Machinery & Equipment Purchased
+
S
0
Noncash Machinery Transfer to Farm
+
S
0
Machinery & Equipment Sold
-
S
0
S
0
1989 Tax Depreciation
End S
Total Beginning Inventory After Changes Machinery Appreciation (end less beginning after changes)
•
•
D
90000
-90000
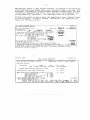
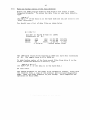
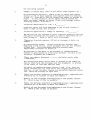
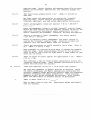
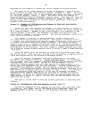
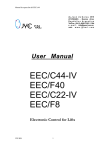
Part of page 1 of Sample Farmer's check-in sheet, the machinery inventory
and depreciation information, is shown below. The arrows show where each
item is typed into Screen 2 of Micro DFBS. The computer doesn't know
what to do with commas (or spaces within or to the left of numbers), so
11 don't type the commas. If there were previous year's data, the beginning
of year inventory value will be displayed. If this value does not need
to be revised, press ~ (return/enter) to move to the next item. If it
needs to be changed, simply type the revised value over the existing one.
Enter the data called for. Use ~ to move from one item to the next one
below. The bottom two items, marked with *. are calculated by Micro
DFBS. When you have entered all the data for Screen 2. advance to Screen
3 by typing:
[PgDn]
SCREEN 2.
I'1ACHINERl" 6- EOt'JPHP7 JNVfNT0f.1' 6- :JEPfEClATIOV (do no: includp leased irc.";]s)
Beginning of Year Inventory
$ 90.000
End of rear Invcntorj $
I'
i'!3chinerr 6- Equipment Purchased
+
'00 ~
J
Ncr-cash Hach. Transfer to Farm
(e.g .• gifts/inheritances)
+ .s;OOO Hachiner." 6- Equipmen: Sold
• /;.250
I
~989 Tax Depreciatic;mZ
./1,}. • Plilo Total Beginning Inventor\, Afr:er Cha.....ges !'Iachiner" Appreciation (end less bf'ginni g afte!' h bes
16
,~.COO
>
I
zExclude buildings and ca:tle from ACRS d
p~eci~:i
n
Scree;') 12
Farm No.38006
MACHINERY AND EQUIPMENT INVENT( R
ANi
DEPRECIATIotl
~
Machinery & Equipment Inventory
S
90000
Machinery & Equipment Purchased
+ S
10800
Noncash Machi:'lery Transfer to Farm
+
S~ 5000
Machinery & Equipment Sold
-
1250
1989 Tax Depreciation
- S
Be~inning
!
End ~ 9/,0000
III
1/,0280
Total Beginning Inventory After Changes
S
90270
Machinery Appreciation (end less beginning after changes)
$
3730
Screens 3 through 14 are handled in a similar way and. as with Screen 2,
are designed to resemble the check-in form as closely as possible.
Now finish typing the farm information for Sam Hill into Screens 3
through 14 using the data on the following pages. After Screen 14, you
should be back to the main menu.
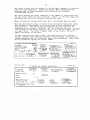
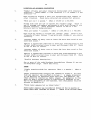
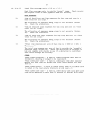
12 Screen 3, Feed and Supply Inventory, has three columns, two of which are
for data entry. The beginning and end year columns are entered and the
beginning and end year totals and inventory change column are computed.
The check-in form has additional columns in Screen 3 for quantities and $
per unit; however, these are work spaces. s If there were previous year's
data, the beginning of year inventory values will be displayed. The order
of data entry is across the rows.
The inventory change for grown feeds is calculated by subtracting the
beginning year inventory value from the end year inventory value. This
inventory change is then transferred automatically to Screen 12. the
accrual receipts screen.
The inventory changes for purchased feeds and supplies are calculated by
subtracting the end year inventory value from beginning year value for
each item. These inventory change values are then transferred to Screen
13, the accrual expenses screen.
Use the cursor (+) key or ~ (return/enter) to skip zero entries.
Total
Total
I
SCREEN j .
4
$!iJ/l1.tS
s I~
.I x17slr_$~~
~:
!'!athlve: Parts
. , ...
Fue1. ell, greasp I.~.I..
<
:lves~ock:
Se=en
Vet. supplies
O~.Jle!" supp2 i es
Crc~5: Fertilizer
.'
j .....
..LOO
-$
l.~.~
,"'$
Invfv;orv
Chn~rel
.. .,;tSf>. $ •• ,,:,A..$, ... A~'iL
..
~
..J1JJl.
~
Seeds
Pesclc"ces/Ocher Land/Bldg./Fenee: Ocher: ... Toeal Feed & Supplies
S7fiJJiS
S~
'Inventory change. are calculated: total gro." feedS - end year· beginning year and is
carried over to Soreen 12. p'Jrchased feeds and supplies - beginning year· end year,
and are carried over to Screen 13.
rC1~.:
lie..
:eGJ6
FEEt:!
.
:::::-E?E:';,
!::nd-Yea:-
P'.I:-chased Feeds:
::lair,} Gruin & Cone.
Dajry R~ugnage
Noni.3iry Fe9c
Supplies:
M"chi~le : Parts
Fue:, Oil. Grease
l·ive2tock: Ser:len
Vet. Suppl.1.es
OthEr S'"pplies
Crops: Fertilizer
See:s
Pesticides and G~her
Land/Bldg.!Fence:
Other:
Total Feed
.. Supplies
S
•
IINer.':::ry Change
$
1':'1..8:
$
~:98~
3~OO
:$
0
:>
3: SO
0
;;;
$
(;
$
t
2:5
$
$
$
87
0
$
$
$
70
$
$
a
$
200
115
I'
.3
3t:?P:'Y : lr.:E!::-;. ;:f
S
C
$
50
$
$
sao:)
laC
s
s
125
3000
S
5(1)
$
C
$
J
S
S
S
300
0
$
$
250
1,000
0
$
1,01165
$
51292
----
$
S
$
S
S
$
S
250
J
a
-25
26
0
-20 -25 2000 500 -250 -100 0
SThere are four kinds of spaces on the check-in form: ....... for work space,
for data entry items, _______ for calculated values, and x
x for
optional input.
13 Data entry in Screen 4, Livestock Inventory, starts with "leased dairy
cows" then continues across the remaining rows. All totals are
calculated. The "$ per Head" columns are calculated after the "number of
head" and "total value" entries are made for each row. If you prefer to
enter "$ per Head" values, type ..J (return/enter) for "Total Value" and
the cursor will move back to the "$ per Head" column. Enter the value
per head and press ..J (return/enter) and the "Total Value" will be
calculated. Once the "Total Value" has been calculated, the cursor will
not return to the U$ per Head" space.
If there were previous year's data, the beginning of year inventory
values will be displayed.
LFESTOCK
SCREEN 4.
Number of leased/rented dairy cows at end of year ~
December 31. 1989 Inventory Using:
12131/89 Prj ces
Jan. 1. 1989 Inventory
111189 Prices
$ per
Total
$ per
Total
$ per
Total
Head
Valu~
No.
Head
,'aluf
No.
Head
Value
Dairy Cows: .. ...... .
Total Dairy Cows
.1P,
Heifers:
Bred Heifers
$
Open (6 mo. . bred)
Calves
Total
« 6
~500
1'.30OQ
,
$11 000
~$'50
iJL -'tSQ
I~()OO 9000
.J.Q... .!:if!o.
,
$30t $Q9 .~~
mo.) He~fers
'(Sa?
$
.3't,Sq(?
Bulls & Other Lvsck.:
.. b~~~.y ..St ~er,
0$_ _
$_-,O~
Total Bulls & Other
Llvestock
. .0.
$ ... !:)..
..'1
$/~.C?Q
Total Livestock
,~O
$.'l3fo«;
J~'i
$J&!i)P.O
Farm No.38006
LIVESTOCK INVENTORY
Leased Dairy Cows End Yr.:
0
S per
Head
Nc•.
70 S
0
Total Dairy Cows
Heifers:
900 $
0
70
Bred
Open
Calves
Total Heifers
10
20
20
50
1t50
Bulls/Other Lvstk
0
0
0
Total Bulls &
Other Livestock
TOTAL LI '!ESTOCK
0
0
120
850
650
Screen lit
End of Year Inventcry Using:
Beginning of Year
Dairy Cows:
$lP.r;.Q
$/IJ,lCP
Beg. Prices
Total
Value
S per
Head
No.
63000
0
63000
80 $
0
80
8500
13000
9000
20
20
10
50
30500
End Prices
S per
Head
Total
Value
900
0
$
72000 S
0
850
17000
650
1t50
13000
1t500
31t500
1t00
0
1600
0
It
0
1,0
1600
134
108100
935001
Total
Value
950 S
0
72000
0
0
0
'II
'II
76!)Og
I
I
76000
900
650
1t50
18000
13000
1t50u •
35500
1,000
1600
0
0
1600
113100",
14 The data for Screen 5, Real Estate Inventory, is entered in the following
order: beginning year market value, end year market value, new land, new
buildings, lost capital, nonfarm noncash transfer, depreciation, and real
estate sold (beginning year value, total sale price, sale expenses, and
note/mortgage held by seller). All remaining items are calculated.
If there were previous year's data, the beginning of year inventory value
will be displayed. It may be revised, if necessary, by typing the new
value over the existing one.
REAL ESTATE INVENTORY BALANCE SCREES 5.
Land & Building Harket Value:
Beginning $ 190,000 New Real Estate: Purchased: 1$_-,--lIO~_ '/' $ 10300
$ 32.00
- +$ •• ~~().9.. value added l~~d
b1dgs./~nd iop.
lost capital
Noncash Real Estate Transfer to Farm (e.g. gitts/inherit.
'/' 40 000 Depreciation: from 1989 income tax (Include bldgs. in
t.;10 IS pre·ACES, ACES, HACP..s & ADS) Real Estate Sold: Beginning of year inventory value
- I7,OOQ Total sale price
s.ilOOoo Sale expenses
"SOD Note/mortgage held by seller· IS; 000 Net cash Bmt. rec'd. in 1989 - __ if~Q()..2 Total Beginning Value After Changes Real Estate Appreciation:
Assets owned at end of year (end - beginning after changes)
Assets sold during the year (sale price - beginning of year value)
$.133).i:~
$ ••• ,~ J $.' _
$ __ 3~QOQ.
<t
IUse ~orksheet 4, page 2. 2Calculated value is a cash inflow to the farm. If part or all of
this was converted to nonfarm. include that amount in "personal withdrawals & family
expenditures· (Screen 13. page 11).
Farm No.3B006
Screen IS
REAL ESTATE INVENTORY
Land and Building Market Value
Beginning $ 190000
End S 2(00000
New Real Estate:
Purchased:
0 +
10300
3300
=+ $
7000 land + bldgs./land imp.-lost cap.
value added Noncash Real Estate Transfer to Farm
Depreciation: From 1989 Income Tax + $
60000
- S
6615
Real estate sold: Beginning of Year Inv Value
- S 17000
Total sale price
S 20000
Sale expenses
- S
1500
Note/mort. held by seller - S 15000
Net cash amt. rec'd
= S 3500
Total Beginning Value After Changes • 233385
Real Estate Appreciation:
Assets owned at end of year (end - beginning after changes) •
6615
Assets sold during the year (sale price - beg of year value) •
3000
15 The order of data entry in Screen 6 is as follows: numbers of livestock,
milk sold, butterfat test, production record, DHI#, milking system,
business type, milking frequency, dairy housing, and financial
recordkeeping system.
The value entered for other livestock is the number of total work units
for the total number of other livestock. Table 1 on the next page shows
estimated work units for various livestock and crops.
When entering the Average Milk Plant Test, the decimal must be typed.
Business description items in Screen 6 are entered by typing the number
that appears in parentheses on the data check-in form and pressing ~
(return/enter). The appropriate business description item will be
displayed on the screen. Initially, all the items are set to I, so there
will be data on the screen when you call it up. The DHI number requires
a 6-digit entry. The first 2 digits refer to the county, the last 4
digits are unique to the farm.
If there were previous year's data, the production record, milking
system, business type, milking frequency, dairy housing, and financial
recordkeeping system will have last year's data displayed. These items
may be revised by typing the correct number.
L1 I'ESTOCK 6: BUSINESS DESCRIPTION
Avg. No.
Production Lh'estock
Record for Year
Dairy cows (owned,
~(l)D.H.I.
rented 6: leased)
~
(2)0. S.
Heifers (dairy)
~
DHIII2l.l11l.Jtj
Bulls
(3)Other
OCher: (type) l:>~:!'Y..S~t:e:rj l - L l
=(4)None
(II head) ....
w.u.'
Lbs. milk sold
'I
H...
lib,
$00
Avg. milk plant test ~. B.F.
SCREEN 6.
Primary
Business Type
__ (l)Single prop.
l1.i1kine System
__ (l)Bucket 6: carry
(2)Dumping stacion
~(2)Partnership
__ (3)Corporation
~(3)Pipeline
__ (4)Herringbone par.
__ (5)Other parlor
Primary Financial
Recordkeepine Systern
Dairy Housine
(l)ELFAC
)(.( 1 ) Stanchion!
1!.(2)Account Book
-Tie-Stall
__ (3)Agrlfax Hail-in
(2 )Freestall
__ (4JOn-Farm Computer
__(3)Comblnation __ (5)Other
Farm No,38006
Screen 16
LIVESTOCK and BUSINESS DESCRIPTION
Livestock
Average No.
For Year
Dairy Cows
77
Heifers (dairy)
50
Bulls
o
Other:
8
Milk Production
milk sold (lb)
-Production
Record
1 D.H. I
D.H.I
Milking System
Primary
Business Type
3 PIPELINE
2
*
2138123~
w.u.
Milkini
Frequency
Dairy
Housing
1 2X/DAY
1
1116500
Average Milk Plant Test
3.~O% B.F.
PARTNERSHIP
STANCHION
Financial
Recordkeeping
System
2 ACCT. BOOK
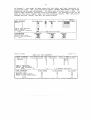
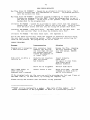
16 Table 1.
Work Units For Livestock and Crops
Work units per
head or per acre
Livestock
Beef cows
Horses
Hens (production only)
Egg processing (per dozen)
Pullets raised
Broilers raised
Brood sows
Hogs raised
Ewes
Barley
Dry beans
Potatoes
Cabbage
Snap beans for processing
Sweet corn
Onions
Apples - growing
Apples - harvest - per bushel
Work off farm, days
2
2
0.04
0.002
0.004
0.003
3
0.15
0.5
0.6
1.5
6
9
1
1
12
4
0.02
1
---------------------------- Primary Enterprises* -------------------------Livestock
Dairy cows
Heifers
Bulls
7
Hay
Hay crop silage
Corn silage
Other forage harvested
Corn for grain
Oats
Wheat
Tillable pasture
0.6
0.8
0.8
0.6
0.6
0.6
0.6
2
2
o
*Work units for the primary enterprises are built into Micro DFBS and are not
entered by the user. They are provided here for information only.
17
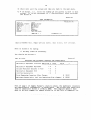
In Screen 7, the order of data entry for the labor and land inventory is
across the rows. The total months of labor, worker equivalent, and land
inventory totals are calculated. If there were previous year's data, the
entire land inventory section will be displayed. If revisions need to be
made in this data, simply type over the existing values. The "all acres"
column and the "total" row will be recalculated.
SCREEN 7.
LABOR I.NVE.NTOSr.
Operator · 1
·
2
·
4
EulJ'I~m~
Hontbs
~
~,
-
-
-
-
· 5
· 6
/"&"D ltJY.ENXJ1SY.
;t~. + 12 -
~aoa&~mflnt
~!?~ Worker Equivalent
A!::r!t~
~CQ
:aQ
.0
All Acres
.. ~c.tP..
Rented
.. ..'1.C..
IQ
If.
I §:aD
. .:4~O..
__ JJ•.$ ..
. H*'-~..
.. •.7:1:. ..
Screen
Farm No.38006
LABOR and
LABOR INVENTORY
~AND
Full-Time Months
Operator - 1
- 2
12
12
- 3
- ~
- 5
- 6
0
Family (paid emp.)
Family (unpaid emp.)
Hired (reg & seasonal)
Total
33
LAND INVENTORY
Tillable land
Pasture (nontillable)
Woods & other nontillable
Total
& kiQor
$ .::10 ODQ
$ ,:ll(OQO
$
$
$
$
-
Acres Owned
Tillable land
Pasture (nontillable)
Woods & other nontillable
Total
Ql
-
-
---"
~
Family (paid employees)
Family (unpald)
Hired (regular & seasonal)
Total
Value
'-due.
ft
.lit
fi
-I..A
· 3
l::fltU:~
Au
jj"!
INVENTORY
Age
51
28
0
0
0
0
0
0
0
Years Educ.
Value of Mgmt & labor
520000
$20000
$
0
$
0
II;
0
$
0
lI"
16
0
0
0
0
6
3
0
+
12
Acres Owned
2.75 Worker Equivalent
Ac:'es Rentec
All Acres
200
30
160
60
10
5
260
165
390
75
~65
~O
18
Screen 8 is Tillable Land Use. When entering the data in the dry matter
coefficient column, the decimal must be typed. The entry for total
production of "Other Crops" is in number of work units (see Table 1 on
page 16). The order of data entry is across the rows. Total Tillable
Acres and the Total Tons Dry Matter column are the calculated values.
Acres
Ust
TILLABLE LAND USE
CI
t
Total Production
fall cutt,'nS!s)
cmIv)
Il..o
Hay Crop (lsc cut acres only)
Hay
Hay crop silage
Corn silage
Other forage harvested
Corn for graln~
Oats
Wbeae
Otber: ..... ............... . .
Tll13Dle pasture
Idle tillable acres
Total tillable acres
1~~x~Xx
x
I
x
x
7D
,0
I
..:IS
!
/D
SCREEN 8.
Dry Hatter
Coeffi .
Total Tons
cient 6
.Drv marCeL
~~mx~~Px~~~~~~ ~~~~~~Px~n g~~~~~~~~
'0
tons
/...lW
V! ~O
tons
·41
. - Zfj~-. .....
. 35
'I '0
tons
~,-..
,AI
. ..1. _. ____
'fO
tons
3300 drY sh. lLu . Tot. en D.'! .. 1-.7.1 ....
dry bu.
S'=>O
drv bu.
r
lw.u 1
.'5
-- .
-
..
is
... •..;t(>~_ ....
IWork units.
2All cows were milked 2x for entlre year.
'All cows were mllked 3x for entlre
year.
'A portion of herd was milked 3x or total herd was milked 3x for part of year.
~Con-:ert to dry shelled equivale"t (see tables. opposite pag<').
~Enter as decimal. e.g. 4C~
is en:ered as .4.
Screen 118
Farm No.38006
TILLABLE LAND USE
Acres
(1st cut)
Hay Crop
Hay
Hay Crop Sil age
Corn Silage
Other Forage
Corn for Grain
Oats
Wheat
Other
Tillable Pasture
Idle TilL Acres
Total Till. Acres
Total Production
(all cuttings)
Dry Matter
Coeff icient
Total Tons
Dry Matter
120
70
10
35
10
D
0
15
0
260
150
1,,80
980
/eO
3300
560
0
0
tons
tons
tons
'tons
bu.
bu.
bu.
w.u.
0.85
128
0./e0
192
0.35
31,,3
16
679
0.1,,0
Total Tons D.M.:
19
Screen 9 is the Asset portion of the Farm Family Financial Situation.
The first items, beginning and end year total farm inventories, are
calculated from data entered in earlier screens and displayed here. The
order of data entry is across the rows. The calculated values are Total
Farm Assets, Total Nonfarm Assets, and Total Assets. If there were
previous year's data. the entire beginning year column will be displayed.
SCR:£EN 9.
Januaty 1. 1989'
pecember 31. 1989
$ ~ J~J:~~.S._
Total Farm Inventory'
Other Farm Assets:
I~OO
Farm cash. checking, 6: savings
Accounts receivable' ~so
FLB 6: PCA stock Other stock 6: certificates
_00
x
Prepaid expenses'
3;.}.QC
x
$ .'I$.~31.$...
Toeal Farm Assets
Nonfarm Assets: s
Personal cash, checking 6: sa" ings
x
100 x
$.5._~~'k7.
(500
,
3000
3*.00
Nonfarm real estate
()
o
Personal share auto
.2,~
Cash "alue life insurance
Stock 6: bonds
o
()
... 000
Household furnishings
S;DOO
0
Other (include mortgages 6: notes)
1I/f..l!lJ...
Total Nonfarm Assets
$ _.
TOTAL ASSETS (not includlng leases)
$.~j1,j!P- ..
Dec "mbE',
Total Farm Inventory
Other Assets:
Farm Cash. Check/Saving
Accounts Receivable
FLB & PCA Stock
Other Stock and Cert.
Prepaid Expenses
Total Farm Assets:
Nonfarm Assets:
Personal Cash. Check/Saving
Cash Value Life Insurance
Nonfarm Real Estate
Personal Share Auto
Stocks & Bonds
Household Furnishings
Other
Total Nonfarm Assets
TCTAL ASSETS
S
I,olt.665
S
13000
12500
6950
3000
200
•
1..50315
S
1500
3000
o
1'i8=
1,;98392
11200
13025
7250
3200
800
S 533867
S
1600
3200
o
2000
1500
5000
5000
14940
•
2621,;0
560107
•
o
o
S
•
1.
11500
461815
o
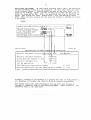
20 Screen 10, Liabilities and Planned Debt Payment Schedule, is divided into
two screens (Screen 10 and Screen lOa). Screen 10 contains the Long Term
and Intermediate Liabilities and Debt Payments. Screen lOa contains the
Short Term, Operating Debt, Accounts Payable, Advanced Government
Receipts, and Nonfarm Liabilities and Debt Payments. To move from Screen
10 to Screen lOa, press the [PgDn] key. To get back to Screen 10 from
Screen lOa, press the [PgUp] key.
The first column, the creditor description, is limited to 12 characters
of input. You may abbreviate and use upper or lower case letters,
however you wish; the description will be printed on the output just as
it is entered here.
There is a blank column under "Planned 1990 Debt Payments" where the
interest rate was entered in past years. If a value is entered in the
blank column by mistake, you will see a message at the bottom of the
screen, "Number Not Within 0.00 and 0.00 Range". To return to input,
type [delete] ...J, 0 ...J or +- ...J .
F~~
F~~ILY F!N~~CIAL
Credltor
(the first 12
cha.racters "'ill be
used 2S inDut.)
DEBT PAI'HEtiTS
Amt. of
Debt
Refinsnced 2
($)
Amount of
dIil!2lW t
Jan. 1, Dec 31. He'" Bor·
1989
1989
rowinl'!s
($)
($)
($)
Long Term Debt (~lOyrs.)
C ~SOOQ
I S't" auK It\~ 3frtOO
i
I
EL2>
SCREEN 10
SITUATION (continued)
LIABILITIES!
~
x _ _ _x
,
5.~OOO
x
dctual 1989 PVt:lts
PrinclInterest
Dal
($)
($)
.......
4QDQ
x .......
«,000
x _ _ _x
P Illnned J99t1
Arnt.
Pymts.
of
Per
P\'mts. rear
(5)
($)
iOOQ ~
i
~OQQ
.....
x
x .. " .... --.,
.u,.'
~
a.
------
-
-
Intermediate Term Debt (>lyr., <lOyrs.) £\rrt ~n\{
IfpDC
!8;000
pc,A
3A.ooo
3~OOO
x
x ...... .
o
x _ _ _x ...... .
x_ _ _x ...... .
------
x _ _ _x ...... .
x _ _ _x ...... .
--
-
x_ _ _x ...... .
_I I I ; ; I I 1 I I ;
~
I I 1 ; 1 I I " I I I 1 I i i I i i i i , ; " I , ; 1 , I I : I 1 I I I I I I I I I , I I I I I I I I I i i i 1 I I I I I I +++++-t-1-+++++H
FLB & PCA Stock
Short Term Debt - 1 year or less
(borro",ed to purchase capital items)
x_ _ _x ...... .
--- ---
-
x ...... .
-------
--
x
Operating Debt (borrowed to buy items
entered as expenses in Screen 13)
net reduction
plsnne~
1.,000 'S;000
Accounts Payable'
Advanced Gov' t Rec.·
$,$00
J,.OOO
accts.
1(' 00
0
iil,5DO pay.:
5n:
alj~:_
~
.../IU2I2
_>000
$-$'..~.
Total Farm Lisb/Pymts
$l1;l.!l!iJ>$ Jf~'S9
Nonfarm Llab/Pymts'
$---'1. $
$x~x
$ ..100Q
TOTAL LIAll/PYI1TS
$/.~${)$1'6~Q $ .. __ ....
$ .1P.tK'.
(noc Including leases)
oper.
19.P«>
$.... _... $
0
$!!.D!?9.
4fOO
$ 1.7.'-00
$
Totfsl
Han arm
Pymts.$'''tJO
21 The values entered in the "Amount of Payments" and "Payments Per Year"
columns will be multiplied together to arrive at a total annual planned
payment. The "Payments Per Year" column defaults to "12" since it is
most likely the "Amount of Payments" column will contain the monthly
payment amount. However, if it is more convenient to enter the total
annual payment amount in the "Amount of Payments" column, simply type a
"1" in the "Payments Per Year" column. If the payments are not monthly
or annual, enter the appropriate number of payments.
The "FLB & peA Stock" values at the top of Screen lOa are displayed.
These values were entered as assets in Screen 9. The order of data entry
is across the rows. The calculated values are the rows for Total Farm
Liabilities/Payments and Total Liabilities/Payments. If there were
previous year's data, the creditor description and beginning year
liability columns will be displayed.
Fanr, No. 38006
LIABILITIES & PLANNEr; DEB'l' PAYMENJ S::'HEDULE
I
Liabilities:
Debt Payment.s:
I
Amount I
Actual
Amount
of New
Jan. 1. Dec. 31. Borrow
1989
1989
ings
princiPal!lnt.
*Long Term: . . . . . . . . . . . . . . . . . . . . .
35000
1st Bank Mtg $
36000 $
$
58000
60000 $
FLB
$
0
0 $
$
0 $
a
* Intermediate: . . . . . . . . . . . . . . . . . .
:£
18000 $ 18000
First Bank
peA
$
33000
30000 $
$
0 $
0
$
0 $
0
$
0
0 $
$
0 $
0
$
0
0 $
... "' '" . .
.
$
$
$
$
$
$
$
$
~
~
$
$
S
$
S
$
$
0
0
0
0
'"
Planned 1990
1990 !Amt. of-fPymts.
Pyrnts I Yr
...................... .................... ·I i
1000 $ 3000
2800 $ ,,000
0
0 $
0
a $
........... . . .. . . .... "' .. . .. .
0 $
0
0 $
5000 $
2000 S ,,500
0
0 $
0 $
0 S
0
0 $
0 $
a
0 $
0 $
0
a $
0 $
0
0 $
.
~
..
.
$
$
$
$
326
589
0
0
$
$
$
$
$
378
675
0
0
0
0
0
. . .. . . . .. . . .. . .
S
S
~
12
12
12
12
II
II
. .. ... .,. . III'
i
12
J.~
12
12
12
12
12
II
I
I
PRESS [PgDn] OR [ESC] TO GO TO SCREEN lOA
«««SCREEN 10 CONTINUED»»»
(PRESS [PgUp) TO GO TO SCREEN 10)
Liabilities:
Amount
Jar,. 1,
1989
i
Debt Payments:
Actual
Amount
Dec. 31. of new
1989
Loans
FLB/PCA Stock $
6950 $
7250
*Short Term: . . . . . . . . . . . . . . . . . . . . ...
$
0 $
0 $
$
0 $
0 $
.,
"
...............
"
0 $
0 $
a s
.
'"
0 $
*Operating Debt: . . . . . . . . . . . . . . . . ............
...............
peA
s 16000 S 15000
$
0 $
0
*Aecta. Pay. : I
5500 S 18600
*Adv Gov Ree. I
2000
0 S
*Total Farm:
S 1721,050 I 186850
S
5000
*Nonfarm Liab S
0 S 10000 $ 12000 $
;1.000
...................................... ,. .... - .................. ............ . ...............
TOTAL:
$ 172<050 I 196850
$
7000
I
Planned
PrinciPall Int.
.......
I,
.....
"
....
0
0
I
1990 fAmt. Of fPymts. I
Pymts.
I Yr.,
.. ......................
.,
........
0 12
0 12
$
$
Net Reduction
............. .Planned: .•.........
$
$
$
3000
0
2500
S 17000
,,00
. ........ $ 17<000
$
,""
Oper. Debt S
$
Aceta Pay I
,,000
0
1000
Total Nonfarm
Payments S
6200
,
22 Financial leases are entered in Screen 11. The columns titled "amount of
each payment", "no. of payments in 1989", "no. of payments/full year",
and "no. of payments remaining" from the data check-in form are entered
on Screen 11. The total 1989 expense column is calculated. The order of
data entry is across rows.
SCREEN U.
Ir,"".ed ',rlOm
Cattle: ..................... .
EquipDlent: ..-rr.Q...G:~C'
..........
Structures: .. ...................
Amount
of each
No. of
payments
oavrnent
;n' 1989
110
No. of
payments/
full Year
No. of
payments
rema·ninJ1.
$ ...•....
$_--
$
Total
1989
IOxoense
Total
$ ........
..JA...
$ . ).. C? .'1 P.
1
$_ __
lEnter under ·Cattle leases· on Screen 13, ·page 11.
2Enter under ·Machine hire, rent. & lease" on Screen 13. page 11.
3Enter under "Real Estate rent/lease" on Screen 13. page 11.
Farm No.38006
Screen 11:1
FINANCIAL LEASES
Leased Item
Cattle
Amount of
Each Pymt
S
S
S
0
0
0
No. of
Payments
in 1989
0
0
0
Total
Equipment
S
S
S
170
0
0
12
0
0
Total
Structures
S
S
S
0
0
0
0
0
0
Total
Total
1989
Expense
No. of
Payments/
Full Year
No. of
Payments
Remaining
S
S
S
S
0
0
0
0
0
0
0
0
0
0
S
S
S
S
201,00
0
0
201,00
12
0
0
21,0
0
G
S
S
S
S
0
0
0
0
0
0
0
0
0
0
[I
i
23 Screen 12 is the Summary of Yearly Receipts and Changes in Inventory and
Accounts Receivable. The pounds of milk sold will be displayed on the
screen when it is first brought up. This value was entered earlier in
Screen 6. The change in inventory values are also displayed. The dairy
cattle change in inventory value is calculated from the dairy cow and
heifer values entered in Screen 4. The other livestock change in inven
tory value is calculated from the bulls and other livestock values
entered on Screen 4. The crops change in inventory value is calculated
from the grown feeds inventory on Screen 3. The change in advanced gov
ernment receipts is calculated from the liabilities entered in Screen 10.
There is work space to itemize other receipt items, only the total is
entered. The order of data entry is across the rows. The calculated
values include the change in inventory column, accrual receipts column,
and the total accrual receipts row.
For any negative values in the Change in Accounts Receivable column, you
must type the negative sign.
--~~".
SCREE~
in
Accounts
c.'1/ing€'
Cas;!
Far.":)
Pee,,;
~.
:>"
~;;k
. . . • l,.I-'-~1
.--:.L~:.
~QQ _.. lbs.
$1!is jl!:tS
1!J,21 00
'::.acrle
I R~a
Calves
:.:.pr LivestocK
::;~.;
r....
Q
~"Q
C:-of./s
L:';'s :0,71
J..23 0
Rece",;:>cs
C,;;',!@rn."':lIimr
;';;.s
0: $
Hachine ;"crk
7ax Refunds
0:.';0:::
f\~!.I.ndio s .. ~O~,
P..t,
,.
,
...
"
..
.
,
. .
'
$... , .
$.....
"
in
InvenCOIY'
-
r,~c;1!civa,",'"
XXJCXxxxxx
U3,~
$
xxxxXXXXX
. . J.jp~O.
.t~r*,S-
A:?c;":'<.Jl
Ppce ',n"
1I~2
S!~~.'t7D
-1000
.~'llc;.Q
-Jc:1c:1
----
.. 1.''-0.
.. 1.tt'>.Q.
.1~1!l$ .
....*~ .
. ".:';l,~l
.:45:0
xxx.xxxxxx
IRQ
xxxxxxxxx
12
... '-'~O .
....It>.Q.
'
~()O
Toc"l Other
mYAL
Sale of other stock & cere j,f icates
. .. ~.C!Q.
xxxxxxxxx.
$as1 m.s
$.. ~;J;$..
(e~~t7:~; & PCA stock)
SJgQ~.
lOCO
,
$
·\'QUf.Ir.r.: R!'£~i2'i: Cash income (,describe & ite",ize largest
..
aJ:DOLUltS: ~:r)
'~7's t~'be,: $.I$-/)p~-.; ("~!!r+ ,e, .. :
Cash use In t e USJneS$ f om non. arm ca;lca~
$ _ .. ,If!~
_,
total -$
$
Noncash ca?ita~ tnansferred Co fart:> busi::ess for cattle. crops. etc. (e.g.
gif'5/1nher'Ca~ces) [excluding .':l8chir.cry (enter Screen 2) 6 real estate
$
(e~ter Screen 5)]
)
1"3S
C1QQ
l/QOO
lEnd of year (at beglnnlng prlc~s for cattle) mlnus beginning of year.
'Use ~orksheet 6 on
pas" 8 to calcula:e _
·Char,g. in advanced go"unment nceipts (beginning year· end year)
ca~cu16ted from values entered :n Screen 10. page 7,
Screen .12
Farm No.3B006
SUMMARY 0F YEARLY RECEIPTS & CHANGES IN INVENTORY & ACCO~S RECEIVABLE
CaS!-1
Receipts
Receipts
+
Changes in
Inventory +
Changes in
Accts Rec.
1825
S
111650Cl ibs S 11.511.5
Milk
-10:l0
S
S
15300
S
13000
Dairy Cattle
S
-300
Dairy Calves
S
1630
S
$
1600
0
$
Other Livestock
0
0
S
$
12 .. 85
Crops
S
~OO
$
0
$
Government Recpts S
2230
20CO
$
0
C1Jst Mach Work
S
250
S
0
Gas Tax Refunds
S
160
S
0
Ot.her
200
S
$
5:<5
$
TOTAL
S 165315
25085
Sale cf Other Stock [. Cert.if i cates (excl1Jde FLB & peA stock l
A::c!:"ual
Rc-ce lopt.s
S 11.6970
273:)0
S
$
$
$
S
S
S
S
NONFARM RECEIPTS
Cash Income
s
S
Cash Used in B1J!Oiness from Nonfarm Capital
Noncash Capital Transferred to Farm Bu!!iness. Cattle .. Crop!! $
1330
1600
12885
230
250
160
200
I 190925
S
:OCO
10 .. 35
2000
HOO
II
I
I
24
Screen 13, Summary of Year's Expenses and Changes in Inventory or Prepaid
Expenses and Accounts Payable, is divided in two screens (Screen 13 and
Screen l3a). Screen 13 contains the hired labor, feed, machinery, and
livestock expense categories. Screen l3a contains the crops, real
estate, other. and nonfarm expense categories. To move from Screen 13 to
Screen l3a, press the [Esc] key. To get back to Screen 13 from Screen
l3a, press the [Esc] key, then type "13".
The change in inventory values in the "change in inventory or prepaid
expenses" column are displayed when Screen 13 is first brought up. These
values are calculated from the purchased feed and supply inventories
entered in Screen 3. The order of data entry is across the rows. The
calculated values are the changes in inventory, accrual expenses column.
and the total accrual expenses row.
See page 12 for instructions.
Farm
E~l2enses
HJ.r.fl d .b!!Q!2r
Feed
Dairy grain & concentrate
Dairy roughage
Nondairy feed
l1achine a.
l1achine hire, rent & lease
Hachinery repairs & parts
Auto expense (farm share)
Fuel. 011 & grease
Livesto£k
Replacement livestock
Breeding
Veterinary & me~iclne
111lk marketing
Cattle lease/rent
Other livestock expense
Change in
Inventory
Cash
+ Or Prepaid + Change in
,dcet,Pay,
Amount !laid
£.?f!lenses I
$
3,000
3.0000
,
Fertilizer & lime
Seeds & plants
Spray. other crop expense
Real litl'!!
Land, building. fence repair
Taxes
Rent & lease
Other.
Insurance
Telephone (farm share)
Electricity (farm share)
Interest
Hiscellaneous
Tal'AL OPERATING
Expansion livestock
..~.!€9. ..
.....
------_ ....
J.,OlIO
.i:;IQQ
5:00
..-::".$". .
~il:! 'If.I2CnUI.
Personal wlthdrawals & family e%penditures'
I
~OOO
....J....
19oo
%
~.~oO
oil 5.DD,
.'S.CO
,
......... -- .......
•• ,,:,~p. ..
x
5:,2 00
,iil,QQQ
..:1' "~Q
,
~QQQ
.i',.OQ
. .-:J.~ ...
.;looo
.:':~~
%
~,;z.3Q
x
x
x
t.ilQQ
x
%
llQQQ
%
11:
l ) :lag
$/P!l.7.~[:?
$ !t,QDQ
.~P.Q ..
-:r,OO
.l,9J/P. ..
.I,S~ ..
i!'QO
.o:t.::lOO
SoD
600
~~~'$.':
.. -----_ ...
$ J,7?1..
x
%
~3
() 3
.:t.9iQ
3
.il/J.qp.
.,;).g.oo..
-IOQ x
x
%
2",
,"_7..~..
.~"~' ..
.. ·!-.l~P.. .
L, ,a QQ
•
I : : I I I; I I ; I I; I I I I : : I I : : : I,' I I I 1+++
:: :~QO:Po.~
%
~~~~.
..-.-----
- .. ---........
.~~~9..
.1/4P.Q ..
x
x
t:;,'::
Accrual
£x[!enses
. . .!iOQ.
x
%
,,£J.tjQ
l,500
x
Purchase of other stock & certificates (exclude FLB & PCA stock)
rtsmilm
(0000
x iOO x
x
-
,
$.~~~ ..
$
----~--
/: / I : ; : I I I ; 1111111: t i t : ; ; ; : t I It,' I: t,'; I , : I I; t; t I I I; I I;
~
X
$%
SCREEN 13,
.I.~fJ.Q ..
.~7iO ..
...70R ..
.V~ ..
.lQQ
$.'~/.~.
1.9,ac..
. .L33~.
$/~-¥..~Ii
$..'D{)P..
$ I,}, 00.
$.$'S.2'1O
lChanges in prepaid exp, can be entered in x
x spaces. Total change in prepaid exp, must
equal the difference between prepaid exp, totals in Screen 9, page 6 (beg. year· end year),
2Use Worksheet 7 on page 10 to calculate,
'Must calculate for completion of Screen 14,
-Include all cash withdrawals plus all additional nonfarm expenses paid with farm cash or from
farm accounts, e.g., income tax, self·employment tax. life insurance. Include withdrawals
used for nonfarm loan payments, savings and investments as well as family living expenses.
Include borrowed capital used for nonfarm purchases. providing it has been entered as a new
nonfarm liability in Screen 10, page 7. If any or all "Nonfarm Cash Income" has been
excluded from the value entered in Screen 12. pg. 9. you must also exclude any family
expenses paid from that income.
25 Farm No.38006
Sere-en""',
SUMMARY OF YEARS EXPENSES & CHANGES IN INVENTOR'{ 6. ACCOUNTS PAYABLE
Expenses
Cash
Change in Inv, Change In
Amount Paid + or Prepd exp + Accts Payable
Hired Labor
$
3000
FEED
Dairy Grain/Cone $ 30000
Dairy Roughage
$
o
Nondairy Feed
$
o
MACHINERY
Mach Hire/Re~t/Ls $
20~0
Mach repair/parts $
5800
Auto Expense
$
500
!,tooo
Fuel Oil & Grease $
LIVESTOCK
Replacement Lvstk $
1800
Breeding
$
2300
Vet & Medicine
$
2500
Milk Marketing
$
8500
'
Cattle Lease
$
o
II
Other Lvstk Ex?
$
5190
~PRESS [ESC) TO GO TO SCREEN
I
I
~
««(SCREE:~
Expenses
13 CONTINUED»»»
Accrual
Expenses
z
$
o
$
$
$
250
o
o
$
$
$
,.
g,)O
$
$
200
-25
0
$
0
:
2:
:
:
$
$
$
~ .2~
$
-25
o
$
3000
6000
$
36250
0$0
$
22~:
Ii
$
:
~028
Ii
:
~ ml
~oo
$
1
7275
500
:
! .5D~
:,
1
$
5S6~
Ii
II
Ii
I
13A====================================~
(PRESS [ESC] TO GO TO SCREEN 13)
Cash
Change in Inv. Change In
Amount Paid + or Prepd exp + Accts Pay.
CROPS
$
$
Fertilizer/Lime
5700
2000
$
$
500
Seeds & Plants
2000
Spray/Other Exp
$
26~0
$
-250
REAL ESTATE
$
-100
Land/Bldg Repair
$
3000
$
$
-800
Taxes
3600
$
$
Rent/Lease
1200
0
OTHER
$
$
Insurance
2730
0
$
Telephone
700
$
0
Electricity
$
$
~200
0
$
$
Interest Paid
17000
0
$
Miscellaneous
1330
0
$
$ 109730
TOTAL
$
1758
$
Expansion Lvstk.
$
$
9000
0
Purchase of Other Stock & Cert~ficates(exclude FLB
NONFARM CASH EXPENSES
Personal Withdrawals & Family Expenditures
Accrual
Expenses
$
$
$
2200
800
600
$
$
$
9%0
3300
2990
$
$
$
0
0
0
$
$
$
2900
2800
1200
0
0
0
2100
0
13100
$
0
& PCAI
$
$
$
$
$
2730
700
<0200
19100
1330
$
$
$
$
$
$
12~588
$
$
9000
1200
$
55270
1]
26
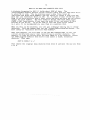
The final screen, Screen 14, contains the breakdown of crop expenses by
crop. The total crop expense row at the bottom of the screen is
displayed. These values were calculated from the crop expense data
entered in Screen 13. The rows for hay crop and corn require data
entered in them. The all other crops row is calculated as the residual
so the column totals equal the crop expenses in Screen 13.
Accrual
Fertilizer
& Lime
Crop
Hay crop (silage &- dry) $
a,ll:Z
Corn (silage &- grain)
r. 17,il
Total
~12
$
$
~,13'f
" ;).j
~ ,"9~ ... ~'J1 .
... 59.L
$.9/I.Q!'..
All other crops
SCREEN 14.
Accrual
Spray. Other
Crop Expenses
Accrual
Seeds &
PlaMs
. __ •. .7.t:!. $'~4~"
$.~~,a.
Totals a~ove must equal accrual expenSes
in Screen 13.
Screer. *110>
Farm No. 3800€,
BREAKDOWN OF 1989 ACCRUAL CROP EXPENSES BY CROI'
Accrual Fertllizer
& Lime
Crop
Accrual Seeds
& Plants
Accrual Spray. Other
Crop Expenses
Hay Crop (silage & dry)
$
3137
$
917
$
628
Corn (silage & grain)
$
6172
$
213~
$
2292
All Other Crops
$
591
$
2~9
$
70
TOTAL
$
•
$
2990
9900
3300
Totals above must equal accrual expenses in
right column of screen 13A.
At the command line, type ~ (return/enter) or [Esc] to go back to the
main menu.
1,
27 V.
Verify the data.
We all make typing mistakes occasionally. The "Verify Record" option
is an important step that will reduce the embarrassment of having a
farmer tell you that you typed one of his figures incorrectly and
printed out a "nonsense" summary for him. It is tempting to skip this
step. The best advice is don't skip this step.
Use the + cursor key to move down to "Verify Record" in the main menu
and type ~. You will be asked for the farm number. Type:
38006 ~ (return/enter)
The program will go on to Screen 1. As you see, the information that
was entered under the "CreatejUpdate/Display Record" option is
displayed. Re-enter the data for Screen 1.
If you were to incorrectly enter the Operator's name as "Sampel
Farmer", the following message would appear on the screen:
ENTRY DOES NOT HATCH PREVIOUS ENTRY
The program will give you this kind of message for up to three tries.
On the fourth try, if it still does not match a previous entry, the
following message will be displayed:
LAST ENTRY DIDN'T HATCH - ACCEPTED WITHOUT QUESTION
At this point you are on your own to see that the entry is correct.
Use the cursor key (t) to move back to the incorrect entry and retype
it.
In Screens 2 through 14, where the entries are numeric not character
data, the value you are verifying will appear as a zero.
Re-enter the data for all the screens. The cursor movement and
movement between screens are done the same as in the
"CreatejUpdate/Display Record" option.
When you have completed the verification process on Screen 14, the
program will return to the main menu.
28 VI.
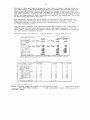
Calculate and print farm summary.s
You are now ready to calculate and print a dairy farm business
summary. Use the + cursor key to move down to "Calculate and Print
Farm Summary", You will be prompted for the farm number. Type:
38006 ~ (return/enter)
The following will be displayed on the screen 7 :
BEGINNING CALCULATIONS-If you get error 02, you may have missing data.
DFBS CALCULATION PROGRAM
ENTER DESIRED OUTPUT DEVICE; {S)creen, {P)rinter, {F)ile or {Q)uit
Select the appropriate output device: 8
1. Type liS" to have the output be displayed on the screen. The
output will scroll, so use [Control] - [num-lock]9 keys or the
[Pause] key to stop the output from scrolling. Hit any key to
continue scrolling.
2. Type IfP" to have the output printed on your printer. You will be
prompted for the number of copies to print. Before entering the
number be sure to have your printer on and the paper set at the
perforation. The program will advance the paper a couple of lines
before starting to print.
3. Type "F" to have the calculated output stored on your disk in text
format. The file name will be made up of the farm number with a
file extension of .prn «farm no.>.prn). This file will be stored
on the disk that you specified when you ran the "install" program.
This option is useful when you want to load the output into a word
processing package or print from DOS.
4. Type "Q" to go back to the main menu.
After you select one of the above, you will see the following message: Enter "A" to print All pages, "D" to print Diagnostics or Number of Page: Typing A ~ (return/enter) will display, print or file the 11 pages of output plus the diagnostic page; D ~ gives the diagnostic page only; and entering a number from 1 to 11 gives you that page number. 6S ee Appendix A for the procedure used to calculate costs of producing milk
that are printed on page 9 of the following output.
1If there were no previous year's data, the following messages will also be
displayed:
1988 FILE DOES NOT EXIST - SETTING VALUES TO 0 1987 FILE DOES NOT EXIST - SETTING VALUES TO 0 8If there is an I/O error F3 during calculation, follow the instructions in
Appendix B.
8Hold down the [ctrl] key and press the [num-lock] key.
29 *****
CORNELL COOPERATIVE EXTENSION
*
Prepared by
* * PRE LIM I N A R Y * *
*
DEPARTMENT OF AGRICULTURAL ECONOMICS
*
*
*
CORNELL UNIVERSITY
*
*********
*
*
Name
So.. tv'\ f \e..,. ~a. C YVI e.. r
*
Address
Da\<, y±C \,~ t')/
* * * * *
NY
*
ROD 1 Bo x. ) 9
*
*
*
************
NYIq 87 f:
*
*******
PRE LIM I N A R Y * * * * *
****
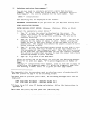
1989 DAIRY FARM BUSINESS SUMMARY
FARM NO. 38006
*
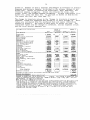
JANUARY 5, 1990
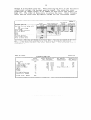
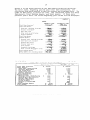
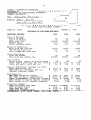
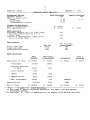
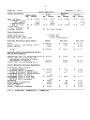
PROGRESS OF THE FARM BUSINESS
SELECTED FACTORS
.J...2ll
Size of Business
Avg
of cows
Avg
of heifers
Milk sold, lbs. Worker equiv. Total tillable acres **
65
50
910000
2.75
260
67
50
961.r800
2.75
260
77
50
1116500
2.75
260
Rates of Production
Milk sold per cow,lbs.
Hay DM per acre,tons
Corn silage per acre,tons
11.r000
2.8
11.r
1 I.rl.r 00
2.1.r
11.r
11.r500
2.7
11.r
Labor Efficiency
Cows per worker
Milk sold per worker,lbs.
21.r
330909
21.r
350836
28
1.r06000
Cost Control
Grain & conc. purch. as % milk sales
Dairy feed & crop expo per cwt. milk $
Labor and mach. costs per cow
$
26%
1.r.19 $
768 $
29%
1.r.17
908
Capital Efficiency (average for year)
Farm capital per cow
Machinery and equipment per cow
Capital turnover, years
6273
11.r67
2.7
$
$
6112
1362
2.7
$
$
61.r1.r6
1250
2.1.r
9060 $
26675 $
-1206 $
2.6%
5.,*%
257'*
19719
-'*75'*
$
$
$
3,*81.r2
53187
8'*85
3.5%
6.1%
$
$
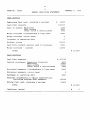
Profitability
Net farm income w/o apprec.
$
Net farm income wi appreciation
$
Labor & management income per op/mgr $
Rate return on equity capital w/apprec
Rate return on all capital w/apprec.
-1.0%
3.6%
Financial Summary
$ 22,*575
$ 229865
Farm net worth, end year
0.,*,*
0.,*,*
Debt to asset ratio
Farm debt per cow
$
2729 $
2707
Cash flow coverage ratio
1.
80
1.1t4t
PARTNERSHIP, ACCT. BOOK, OWNER, FULL-TIME, DAIRY.* $
$
25%
1.r.70
823
$ 31.r7017
0.35
$
2379
1. 39
30
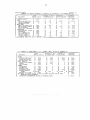
2
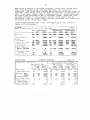
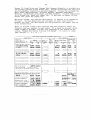
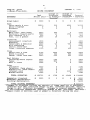
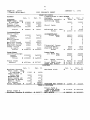
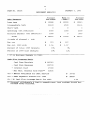
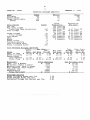
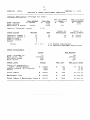
FARM NO. ~8006
Sa.m Fo..('mer
EXPENSES
JANUARY 5, 1990
INCOME STATEMENT
Change in
Change in
Inventory
Accounts
Cash
Amount paid + or Prepaid + Payable**
Expense*
Hired Labor
$
Feed
Dairy grain & cone.
Dairy roughage
Nondairy
3000
$
o
$
o
Accrual
= Expenses
$
3000
30000
250
6000
36250
20,*0
5800
500
'*000
200
-25
o
1500
28
o
o
22,*0
7275
500
,*028
1800
2300
2500
8500
o
o
o
o
-20
-500
o
o
o
5190
-25
L.t00
5565
Crops
Fertilizer & lime
Seeds & plants
Spray, other crop expo
5700
2000
26'*0
2000
500
-250
2200
800
600
9900
3300
2990
Real Estate
Land/bldg/fence repair
Taxes
Rent & lease
3000
3600
1200
-100
-800
o
2900
2800
1200
2730
700
'*200
17000
1330
o
o
o
o
o
o
o
o
o
2730
700
'*200
19100
1330
$ 12'*588
o
o
Machinery
Mach hire. rent/lease
Machinery repairs/parts
Auto expense (f.s.)
Fuel. oil & grease
Livestock
Replacement livestock
Breeding
Veterinary & medicine
Milk marketing
Cattle lease/rent
Other livestock expense
Other
Insurance
Telephone (farm share)
Electricity (farm share)
Interest paid
Miscellaneous
TOTAL OPERATING
Expansion livestock
Machinery depreciation
Building depreciation
o
o
o
o
o
1800
2300
1980
8500
o
o
o
o
o
o
2100
$ 109730
$
1758
$
13100
9000
$
o
$
o
$
o
o
$
$
$
9000
1'*280
6615
TOTAL ACCRUAL EXPENSES
$ 15i,*83
*Changes in inventory include net amounts of items used out of purchased
inventory this year (positive change is amt. inventory declined, negative
change is amt. inventory increased). Changes in prepaid expenses apply
to non-inventory categories (positive change is amt. pre-pymnt. declined.)
**Unpaid items or services used or added to inventory during the year.
31 3
JANUARY 5, 1990 INCOME STATEMENT (continued)
Chanae in
Cash
Change in
Accounts
Accrual
RECEIPTS
Receipts + Inventory* + Receiyable = Receipts
Milk sales
$ 1~51~5
$
1825
$ 1~6970
Dairy cattle
15300
$ 13000
-1000
27300
Dairy calves
1630
-300
1330
Other livestock
0
1600
0
1600
Crops
~oo
12~85
0
12885
Gov't receipts
2230
-2000**
0
230
Custom machine work
250
0
250
Gas tax refund
160
0
160
Other
200
0
200
-Noncash capital transfer
(-)
1600***
(-)
1600
TOTAL ACCRUAL RECEIPTS $ 165315
$ 23~85
$
525
$ 189325
*Change in lvstk inv. w/o apprec. & total change in grown feeds inv.
**Change in advanced government receipts.
***Gifts & inheritances of cattle & crops to the farm business.
PROFITABILITY ANALYSIS
FARM NO. 38006
Without Appreci
Apprec. + ation
RETURN TO OPERATOR(S) & FAMILY LABOR
UNPAID. MGMT .• & EQUITY CAPITAL:
Total Accrual Receipts
Livestock Appreciation
Machinery Appreciation
Real Estate Appreciation
Other Stock/Cert. Appreciation
With
= Apprec.
$ 189325
$
5000
3730
9615
o
$ 207670
$ 15~~83
$ 53187
$
$
15~~83
3~8~2
RETURN TO OPERATOR ( S) LABOR.
MANAGEMENT & EQUITY CAPITAL:
Net Farm Income
$
- Family Labor Unpaid @ $750/mo.
= RETURN TO OP.'S LABOR, MGT. & EQ. CAPITAL $
3~8~2
$
2250
32592
$
- Total Accrual Expenses
= NET FARM INCOME
53187
2250
50937
RETURN TO OPERATOR'S LABOR & MANAGEMENT:
Return to Op.'s Labor, Mgt. & Eq. Capital $
- Real Interest on $ 312~~1 Average
Equity Capital @ 5%
= LABOR & MANAGEMENT INCOME
$
LABOR & MANAGEMENT INC. PER 2. 00 OP. /MGR. $
RETURN TO EQUITY CAPITAL:
Return to Op.'s Labor Mat. & Eq. Capital
- Value of Operator's Labor & Management
= RETURN TO EQUITY CAPITAL
Rate of Return on Equity Capital
$
32592
15622
16970
8~85
32592
$
~OOOO
$
-7~08
50937
~OOOO
$
10937
3.5%
10937
19100
30037
6.1%
-2.~%
RETURN TO ALL CAPITAL:
Return to Equity Capital
+ Interest Paid
= RETURN TO ALL CAPITAL
Rate of Return on All Capital
$
-7~08
$
$
19100
11692
2.,%
$
32 FARM NO. 38006
.s 0.
T'(\
E
Ck 'I
!'Y1 e
JANUARY 5, 1990
r
1989 BALANCE SHEET
Current
Farm cash, chkg
& savings
$
Accts. rec.
Prepaid expo
Feed/supplies
13000
12500
200
~1165
FARM BUSINESS LIABILITIES & NET WORTH
Dec. 31
Current
Jan. 1
Dec. 31
Accounts payable $
5500 $ 18600
Operating debt
$
PCA
16000
15000
11200
o
o
13025
Short term:
800
o
51292
o
Total
66865
$
ASSETS
Jan. 1
$
Intermediate
Dairy cows:
owned
leased
Heifers
Bulls/other
lvstk.
Mach/eq owned
Mach/eq leased
FLB/PCA Stock
Other stock
& cert.
$
Total
63000
76000
30500
35500
$
o
9~000
3000
3200
$ 221020
198~79
~553~~
t..668~t..
o
o
21500
Intermediate
First Bank
PCA
18000
30000
18000
33000
Financial lease
(cattle/mach. )
FLB/PCA Stock
Total
5029
6950
59979
7250
61720
$
o
o
o
o
o
3~70
7250
o
Advanced Gov. Rec.
Total
$
1600
90000
5029
6950
Jan. 1
Nonfarm Assets
Pers cash, chkg.
& savings
$
1500
Cash value of
life ins
3000
Nonfarm RE
o
Auto (pers sh)
2000
Stocks & Bonds
o
Hshld. furn.
5000
All other
o
Total Nonfarm $ 11500
Total Farm &
Nonfarm Assets $
o
o
Long-Term
Land/buildings:
190000
owned
leased
o
$ 190000
Total
Total Farm
Assets
76317
$
Long-Term
1st Bank Mtg
FLB
2000
35600
o
o
o
o
o
3~70
$
36000
60000
35000
58000
Fin. lease (struc)
Total
$
96000
$ 537337
Total Farm Liab. $ 177~79
FARM NET WORTH
$ 277865
NONFARM
$ 190320
2~0000
o
o
o
o
2~0000
$
Dec. 31
$
93000
$
3~7017
$
Jan. 1
0
$
Dec. 31
10000
NONFARM NET WORTH $
FARM & NONFARM
11500
$
162~0
Nonfarm Liab.
$
o
o
o
1600
3200
o
o
1500
5000
1~9t..O
$
$
262~0
563577
Total Farm &
Nonfarm Liab.
FARM & NONFARM
$ 177t..79
NET WORTH
$
289365
$ 200320
$
363257
33
5
FARM NO. 38006
JANUARY 5 t
1990
BALANCE SHEET ANALYSIS
Financial Ratios
Percent equity
Debt to asset ratio
Total
Long-term
Intermediate/current
Farm & Nonfarm
Farm Business
6,*%
65%
0.35
0.39
0.33
Change in Net Worth
Without appreciation
With appreciation
$
$
Debt Analysis
Accounts payable as % of total debt
Long-term liabilities as a % of
total debt
Current & intermediate liabilities
as % of total debt
0.36
50807
69152
$
73892
10,"0
'*9%
51%
Debt Levels
Per Cow
Total farm debt
Long-term debt
Intermediate/current
2379
1163
1217
$
Per Tillable
Acre Owned
952
'*65
,*87
$
Farm Inventory
Real
Estate
Beginning of Year
$ 190000
Purchases
Machinery
& Equipment
$
10300*
90000
Livestock
$
93500
Feed &
Supplies
$
'*1165
$
51292
10800
+ Noncash Transfer
to Farm
60000
- Lost Capital
3300
- Sales
- Depreciation
=
5000
Net Investment
Appreciation
17000
1250
6615
1'*280
'*3385
270
6615***
End of Year
$ 2'*0000
$
1,..600**
3730
5000
9'*000
$ 113100
* $
0 Land + $
10300 Building. ** See page 9, Dairy Inventory Analysis, for dairy cow and heifer inventory detail.
*** Excludes
$
3000 of appreciation on assets sold during the year.
34
6
JANUARY 5, 1990
FARM NO. 38006
ANNUAL CASH FLOW STATEMENT
Cash Inflows
Beginning farm cash, checking & savings
Cash farm receipts
$
13000
165315
Sale of assets: Machinery
Real estate
Other stock & certificates
1250
3500
1000
Money borrowed (intermediate & long-term)
5000
Money borrowed (short-term)
0
Increase in operating debt
0
Nonfarm income
Cash from nonfarm capital used in business
Money borrowed - nonfarm
104.35
2000
12000
TOTAL
$ 213500
Cash Outflows
Cash farm expenses
$ 109730
Capital purchases: Expansion livestock
Machinery
Real estate
Other stock & certificates
9000
10800
10300
1200
Principal payments (intermediate & long-term)
5000
Principal payments (short-term)
Decrease in operating debt
0
1000
Personal withdrawals & family expenditures,
including nonfarm debt payments
55270
Ending farm cash t checking & savings
11200
TOTAL
Imbalance (error)
$ 213500
$
0
35
7
JANUARY 5, 1990
FARM NO. 38006
REPAYMENT ANALYSIS
Made in
1989
Planned
for 1989*
Debt Payments
Long term
$
10988
$
10000
Planned
for 1990
$
10980
12639
6500
12636
o
o
o
Operating (net reduction)
f..t.000
1000
f..t.000
Accounts payable (net reduction)
1000
o
1000
Intermediate term
Short-term
$
28627
$
17500
Per cow
$
372
$
227
Per cwt. 1989 milk
$
2.56
$
1. 57
Total
(% made of planned
=
$
28616
61%)
Percent of total 1989 receipts
15%
9%
Percent of 1989 milk receipts
19%
12%
* If on Business Summary in 1988.
Cash Flow Coverage Ratio
Cash Farm Receipts
$
- Cash Farm Expenses
(A)
(B)
165315
109730
+ Interest Paid
17000
- Net Pers. Withdls from Farm**
32835
= Amount Available for Debt
= Debt Payments Planned for
Service
$
39750
1989
$
28627
(A / B) Cash Flow Coverage Ratio for 1989
1. 39
** Personal withdrawals & family expenditures less nonfarm income and
nonfarm money borrowed.
36
8
FARM NO. 38006
JANUARY 5, 1990
CROPPING PROGRAM ANALYSIS
.wmg
Tillable
Nontillable
Other nontillable
Total
awned
Rented
200
30
160
390
60
10
Crop Yields
Ory hay
Hay crop silage
Total Hay Crop Production
Corn silage
260
40
165
465
5
75
Total
Production
128 Tons OM
192 Tons OM
-320 Tons OM
980 Tons
343 Tons OM
16 Tons OM
679 Tons OM
3300 Bushels
560 Bushels
o Bushels
Acres
120
70
Other forage
Total Forage
Corn grain
Oats
Wheat
Other crops
Tillable pasture
Idle tillable land
Total tillable acres
10
200
35
10
o
o
Production
Per Acre
2.67
14.00
4.90
1. 60
3.40
94.29
56.00
0.00
Tons DM
Tons
Tons DM
Tons OM
Tons OM
Bushels
Bushels
Bushels
15
"
o
260
Crop Related Accrual Expenses
Total/
Hay Crop
Per
Till.
Crops
Acre Per Acre Ion OM
Fert. & lime
$
38.08 $ 26.14 $
9.80
Seeds & plants
12.69
7.64
2.87
Spray/other
crop expense
11.50
5.23
1.96
Total Crop
$
62.27 $ 39.02 $ 14.63
Machinery
Fuel, oil & grease
Machinery repair & parts
Machine hire, rent & lease
Auto expense (farm share)
Interest (5%)
Depreciation
Total Machinery
Total $
$
Crop/Cow Factors
Total Tillable Acres per Cow
Total Forage Acres per Cow
Harvested Forage Dry Matter per Cow
58.78
20.32
$
21.83
$ 100.93
Total Expenses
$
Corn
Corn Grain
Silage/
Per Ory
Shell Bu.
Ion OM
All Corn
Pex: Acx:e
4028
7275
2240
500
4600
14280
32923
$
12.00
4.15
4.45
20.60
$
0.62
0.22
$
1.07
0.23
Per Tillable Acre
15.49
27.98
8.62
1. 92
17.69
54.92
$ 126.63
$
3.38
2.60
8.82
37
9
JANUARY 5, 1990
FARM NO. 38006
DAIRY ANALYSIS
Bred
No. Value
Heifers
Open
HQ..:.. Value
HQ..:..
10 $
8500
20 $
20 $
20 $
8500
1000
18000
Dairy Inventory
Dairy Cows
HQ..:.. Value
Beg. of Year
+ Change in Inv.
(w/o apprec.
+ Appreciation
= End of Year
Total End
(incl. leased)
Average Number
70
$
63000
$
9000
t.000
76000
)
80
80
77
50
Calves
Value
13000
o
o
20 $
13000
9000
-t.500
o
10 $
~500
All Age Groups
Milk Production
1116500 lbs.
1t.500 lbs.
3.t.0 % butterfat
Total milk sold
Milk sold per cow
Average milk plant test
Accrual Receipts From Dairy
Milk
Dairy cattle (including culls)
:lairy calves
Total
Per Cow
$ 1t.6970
Per ewt.
$
1909
355
17
$
13.16
2.t.5
0.12
$ 175600
$
2281
$
15.73
Operating cost of producing milk $ 91233
Total cost of producing milk
excluding operator's labor,
management & capital
11t.378
Total cost of producing milk
170000
$
1185
$
8.17
Total
27300
1330
Accrual Cost of Producing Milk Whole Farm Method
1t.85
2208
10.2t.
15.23
Dairy Related Accrual Expenses
Purchased dairy grain
& concentrates
Purchased dairy roughage
Total Purchased Dairy Feed
Purchased grain & concentrates
as % of milk receipts
Purchased feed & crop expo
Purchased feed & crop expo
as % of milk receipts
Breeding
Veterinary & medicine
Milk marketing
Cattle lease
Other livestock expense
$
36250
$
o
$
25%
521.l.t.0
36%
2300
1980
8500
5565
D.H.I, PIPELINE, STANCHION, 2 TIMES/DAY. 3.25
0.00
3.25
681
$
t..70
30
$
0.21
0.18
0.76
0.00
0.50
t.71
$
$
26
110
o
$
$
o
36250
$
t.71
o
$
72
$
38
10
FARM NO. 38006
CAPITAL & LABOR EFFICIENCY ANALYSIS
JANUARY 5, 1990
Capital Efficiency (Average for Year)
Farm capital
Real estate
Machinery & equip.
;eer Worker
$ 1801«88
Per
$
61«1«6
2792
1250
35000
Capital Turnover, years
~Qw
Operator number 1
Operator number 2
Family paid
Family unpaid
Hired
Total
Per Tillable
Acre Owned
$
21«82
1075
370
2.39
Years of
EducatiQn
Months
Labor FQrce
Per Tillable
Acre
$
1909
11«
16
Value of
Labor & Mgmt.
12
12
6
3
0
51
28
20000
20000
33 / 12 =
2.75 Worker Equivalent
2.00 Operator/Manager Equivalent
$
$
Labor Efficiency
Total
Cows, average no.
Milk sold, lbs.
Tillable acres
Work units
77
1116500
260
808
Labor Cost
Total
Value of Operator(s) Labor ($1050/month)
Family unpaid ($750/month)
Hired
Per Worker
28
1«06000
95 291« Per Cow
Per Till Acre $
25200
2250
3000
$
327
29
39
$
Total Labor
$
301«50
$
395
$ 117.12
Machinery Cost
$
32923
$
1«28
$ 126.63
& Machinery Costs $
63373
$
823
$ 21«3.71«
Total Labor
96.92
8.65
11.51«
39
FARM NO. 38006
Item
11
ANNUAL CASH FLOW WORKSHEET
Receipt or Expense
Total
Per Cow
77
Average Number of Cows
ACCRUAL OPERATING RECEIPTS
$ 1t..6970
Milk
27300
Dairy cattle
1330
Dairy calves
1600
Other livestock
12885
Crops
8t..0
Miscellaneous receipts
$ 190925
Total
ACCRUAL OPERATING EXPENSES
3000
Hired labor
$
Dairy grain & concentrate
36250
o
Dairy roughage
o
Nondairy feed
22t..0
Machine hire/rent/lease
7775
Mach.repair/parts & auto
Fuel, oil & grease
t..028
Replacement livestock
1800
Breeding
2300
Veterinary & medicine
1980
8500
Milk marketing
o
Cattle lease
Other livestock expense
5565
Fertilizer & lime
9900
3300
Seeds & plants
Spray/other crop expense
2990
Land, bldg., fence repair
2900
Taxes
2800
Real estate rent/lease
1200
2730
Insurance
Utilities
t..900
Miscellaneous
1330
Total Less Interest Paid $ 105t..88
JANUARY 5, 1990
Expected
Change
1990
Projection
$1908.70
35t...55
17.27
20.78
167.3t..
10.91
$2t..79.55
$_---
$
$_---
38.96
t..70.78
0.00
0.00
29.09
100.97
52.31
23.38
29.87
25.71
110.39
0.00
72.27
128.57
t..2.86
38.83
37.66
36.36
15.58
35.t..5
63.6t..
17.27
$1369.97
NET ACCRUAL OPERATING INCOME
(w/o interest paid)
$
85t..37
$1109.57
Change in lvstk/crop inv
23t..85
305.00
- Change in accounts rec.
525
6.82
+ Change in feed/supply inv
1758
22.83
+ Change in accts. payable*
11000
1t..2.86
NET CASH FLOW
$
7t..185
$ 963.t..t..
- Net personal withdrawals &
family expenditures
32835
t..26.t..3
Available for Farm Debt
Payments & Investments
$
t..1350
$ 537.01
- Farm debt payments**
17500
227.27
Avail. for Farm Investment $ 23850
$ 309.7t..
- Capital purchases; cattle,
machinery, improvements
31300
Additional Capital Heeded
* Less change in account payable for interest. **See page 7.
$_---
$_---
$_---
$_---
$_---
$_---
$
40 FARM NO. 38006
JANUARY 5, 1990
MACHINERY & EQUIPMENT INVENTORY
FEED AND SUPPLY INVENTORY
LIVESTOCK INVENTORY
REAL ESTATE INVENTORY LIVESTOCK & BUSINESS DESCRIPTION LABOR LAND INVENTORY AND CROPS ASSETS AND LIABILITIES FINANCIAL LEASES RECEIPTS EXPENSES 11.Hired labor expense ( $600 or > $1700 per month = $
500.
CROP EXPENSE BREAKDOWN
MANAGEMENT PERFORMANCE MEASURES
*.Net farm income w/appreciation = $ 53187.
*.Rate return on equity capital w/o appreciation =
-2.4.
*.Cash flow coverage ratio ( .8 or > 1.2, =
1.39.
OTHER
Farm coded irregular.
Dairy Farm
Full-Time Farm
OWNER
41 VII.
Check the dia&nostics pa&e.
The last page of the summary is a diagnostic page, a listing of data
items that fall outside of "normal" ranges for that item. These
unusual items may indicate data entry errors or simply unusual farm
situations. Look over the diagnostics page. Refer to the section
beginning on page 45 entitled, "Hints for Interpreting and Using Dairy
Farm Business Summary Diagnostics". Initial each item and write an
explanation as necessary on one copy. Send this copy to Cornell along
with the diskette and check-in form to indicate that the record is
correct. This will save everyone time and telephone calls spent
verifying and correcting farm records.
VIII.
Update a record.
Select the "Create/Update/Display Record" option on the main menu to
update a farm record. After entering the farm number, the program
will take you to Screen 1. If no updates are to be made on Screen 1,
press the [Esc] key to display the message:
[pgDn] or [RETURN] - next, [PgUp] - previous screen. [Esc] to exit, or
of Screen.
##
Enter the number of the screen where a change needs to be made. Use
the cursor keys to move to the appropriate value and retype the new
value over the old one. Important: If totals or calculated values
appear on the screen, be sure to press return or use the ~ arrow key
to move through the calculated items so they will be recalculated.
You may now move to another screen to make more changes in data or
return to the main menu.
IX.
Display a record.
To display a record, select "Create/Update/Display Record" on the main
menu. Move to any screen by entering the screen number as described
in the previous section.
X.
Delete a record.
To delete a farm record, select "Delete Record" on the main menu. You
will be prompted for a farm number. Enter the number of the farm you
want deleted. The current year's data file «farm no.>.89) will be
erased.
XI.
Help
Select the "Help" option on the main menu. A brief description of
each option on the main menu will be displayed.
XII.
Qyll
To leave the Micro DFBS program, select "Quit" on the main menu. You
will then be at the DOS prompt (C». For a two-floppy disk system.
you will be prompted to insert the DOS diskette in drive A. You can
restart Micro DFBS by typing 'dfbs'.
42
XIII.
Make two backup copies of the data diskette.
Remove the DFBS program diskette from drive A and insert a blank,
formatted diskette. To review the data files on your data diskette,
type:
DIR B:~
(Or DIR C:~ if the data is on the hard disk and you are still in the
'dfbs' directory.)
You should see a list of data files as shown below.
A:\)dir b:
Volume in drive B has no label Directory of B:\ 38006
38006
38006
260 11-01-88 10:27a
870
321 11-01-88 10:25a
880
8809
1-05-90
1:55p
89
7188~8 bytes free
3 File(s}
The 1989 farm record files entered in 1990 will have file extensions
of .89. The sample farm is file 38006.89.
To make backup copies of the farm record files from drive B to the
blank, formatted diskette in drive A, type:
COpy B:*.8* A:~
(Or COpy *.8* A: if the data is on the hard disk.)
Do this twice.
One backup diskette is now ready to be shipped to Cornell, along with
the check-in form. a copy of the printout and initialed diagnostics
page. Keep the other diskette as your backup. This completes the
operation of Micro DFBS.
43 DFBS ERROR MESSAGES Run Time Error 02 PCXXXX IO - Caused by an attempt to divide by zero. Check
input to assure that all information is correct. If problem persists,
call the authors for help.
Run Time Error F0 PCXXXX - Caused by program attempting to locate and not
finding the program file Calc.000. Check the program disk to see if
the file is present. If the file is not present, copy the file from a
backup disk to the program disk.
I/O Error 01 PCXXXX - Caused by an attempt to open a file that the program
cannot find; i.e., a data file that is not on the disk. Check to make
sure the file exists and that you are using the proper disk drive.
1/0 Error F0 PCXXXX - Disk full error. Too many files on the data disk.
the next section "What to do When the Diskette Gets Full".
I/O Error F3 PCXXXX - Too many files open.
See
See Appendix C.
All of the above errors will cause the program to terminate and will bring
the user back to the operating system. After checking and correcting the
cause of the problem, the program may be run as usual.
COMMON PROBLEMS:
Message
Interpretation
Solution
Program won't recognize
a farm record file
File extension (year,
example .89) must be
one less than the year
you entered when you
turned the computer on
or typed "DATE"
Rename the file, changing
the file extension. See
your DOS manual, RENAME
command
Disk error on drive A
(or B or C)
Diskette not inserted,
door not closed,
bad diskette
Insert diskette
Close door
Try again or copy files
from other drive.
Replace diskette.
Drive out of alignment
Service disk drive
Cannot locate a file
Check file name. Use DIR
command to check disk to
see if file exists.
CAN'T OPEN FILE!! or
other cycling keyboard won't respond
If the program locks up, the user can exit by pressing the Ctrl and C keys at
the same time or, if that fails, by turning the computer off.
Please notify the authors (607-255-8429) of any problems.
lOnXXXX" will be replaced by a number. Make note of this number. It is
useful information to the programmer if there is a persistent problem.
44 WHAT TO DO WHEN THE DISKETTE GETS FULL A diskette formatted in DOS 2.1 holds about 360K of data. The
"Create/Update/Display Record" option creates a data file for each farm which
is about 9K in size. The two previous year's data files total lK.
"Calculate and Print Farm Summary" has the option to create a file (the one
with the .prn extension) which is 3SK. So, it takes a total of 4SK for each
farm if you have previous year's data, enter new data and save the calculated
output for each summary. The data diskette should then hold about eight
(360K + 4SK) farm records if you save the print files, and about 36 farm
records if you do not. If you do wish to save the print files «farm
no.>.prn), it is recommended you save them on a separate disk.
When you fill up the diskette, you will get a message telling you to change
diskettes. This may happen when you use "Create/Update/Display Record", but
more likely at "Calculate and Print Farm Summary".
When this happens, you will need to use the DOS command COpy to copy the
current and previous years' farm record files to another diskette. For
example, to copy the record files for farm 38006 to a new diskette, remove
the DFBS program diskette from drive A and insert a blank, formatted
diskette. Then type:
COpy B:38006.* A:~
Then remove the original data diskette from drive B and move the new one from
A to B.
45 HINTS FOR INTERPRETING AND USING DAIRY FARM BUSINESS SUMMARY DIAGNOSTICS The last page(s) of a farm business summary printout are the "diagnostics".
Diagnostics serve the purpose of alerting the person editing the record to
possible data problems. Diagnostic statements are generated when data is
missing, inconsistent or outside a "normal" expected range. Each diagnostic
statement should be carefully scrutinized to help insure that the data is
accurate. One should not rely on the diagnostics to "catch" data entry or data
acquisition errors. Accurate original collection and entry of data are the best
methods.
Page No. of
Check-In Form
MACHINERY AND EQUIPMENT INVENTORY
1. "Machinery owned but no machinery depreciation,"
Check to see if machinery depreciation was collected on the check
in form (Screen 2) and not entered or if an entry error is
present. Machinery could be rented from a partner in the business
with the market value being reported, but not the depreciation.
In situations where machinery is rented from a partner, it is
preferable to enter machinery inventory values and depreciation
for business analysis purposes. However, check to make certain
machinery rental payments have been removed as a cash expense, but
that debt payments on machinery remain.
1. "Machinery depreciation - n% of beginning inventory plus new
machinery." (When n < 5% or n > 20%)
Depreciation reported is probably too low or too high (Screen 2).
Check to be certain that building and/or cattle depreciation has
not been included as a machinery entry. Low depreciation values
are expected when the average age of machinery is high (greater
than 10 years) and little if any new machinery was purchased.
High depreciation values are expected when the average age of
machinery is low (less than five years) and relatively large
purchases of new machinery occurred in recent years.
1. "Machinery appreciation exceeds depreciation."
Check to see if depreciation is within the expected range, but is
not correct (Screen 2). Low depreciation often results in
appreciation that is unrealistically high. In "normal" years of
low to moderate inflation, machinery appreciation is expected to
be less than machinery depreciation.
1. "Machinery appreciation - -$n."
machinery inventory]
[When n «-)10% of beginning
Reported machinery market values fell more than was accounted for
by depreciation (Screen 2). While this is possible, especially in
periods of "soft" machinery markets, the decrease was more than
10% of beginning machinery inventory. Check to see if all values,
especially depreciation, are correct.
46 FEED AND SUPPLIES 2.
"Feed and supply inventory increase> 25%." Feed and supply inventory increased beyond what would "normally" be expected (Screen 3). Check to see if physical quantities and/or prices increased from beginning to end of year. 2.
"Feed and supply inventory decrease> 25%." Feed and supply inventory decreased beyond what would normally be expected (Screen 3). Check to see if physical quantities and/or prices decreased from beginning to end of year. LIVESTOCK INVENTORY
3.
"End of year (bred, open, or calf) heifer inventory at beginning
prices> beginning of year inventory but no increase in (bred, open, or calf) heifer numbers." Two possible explanations exist: (1) An increase in the quality of heifers has occurred.
(2) The average age of youngstock from beginning of year to end of
year has increased and thereby value per head increased.
Check to be certain one or both of the above actually occurred
(Screen 4).
3.
"End of year (bred, open, or calf) heifer inventory at beginning
prices < beginning of year inventory, but no decrease in (bred,
open, or calf) heifer numbers."
Again, two possible explanations exist:
(1) A decrease in the quality of heifers has occurred.
(2) The average age of youngstock from beginning to end of year
has decreased and thereby value per head decreased.
Check to be certain one or both of the above actually occurred
(Screen 4).
3.
"Change in cow va1uesjhead >$100, change .
The upward or downward movement in dairy cow market prices was
greater than $100 per head. Check to see if this actually
occurred as a result of:
(1) An increase or decrease in quality of animals.
(2) A change in market conditions from beginning to end of year.
Check to be certain one or both of the above occurred (Screen 4).
If the beginning of year values taken from last year's end of year
inventory were incorrect, make the change in beginning of year
values so as to accurately reflect the market at the beginning of
47
the year being analyzed.
3. "Number of leased dairy cows> 0 but cattle lease expense - $0."
An inconsistency may exist. Check to see if cattle were leased
(Screen 4) and if lease payments were entered correctly (Screens
11 and 13). Cows may in fact be rented from others or boarded for
others. In this situation, do not report cows as leased, but
enter the rental expense on Screen 13 and total average numbers,
including rentals, on Screen 6.
3.
"Livestock appreciation is < $0, - $_____ "
Livestock values fell from beginning to end of year (Screen 4).
Check to make certain this occurred.
3.
"Livestock appreciation> change in inventory, - $_ _ _ __
It
The majority of the increase in total livestock inventory resulted
from price increases and not growth or quality improvement of the
herd (Screen 4). Check to see if this is accurate.
3.
"Expansion livestock expense > $0 but no increase in dairy cow
numbers."
An inconsistency exists. If herd size did not increase from
beginning to end of year, cattle purchases were not for increase
of herd size. Cattle purchases should be entered under
"Replacement Livestock" on Screen 13.
An exception to the above is the purchase of youngstock/bred
heifers in anticipation of a herd size increase. If this is the
situation, disregard the diagnostic.
3.
"Dairy cow numbers decreased
< $400jhead."
-----
and dairy cattle sales
The revenue from dairy cattle sales is divided by the number of
cows by which herd size decreased and this diagnostic is printed
if the result is less than $400 per head.
Did dairy cow numbers decrease (Screen 4) and, if so, were the
prices received for cull cows low or did a higher proportion of
cows die, or was the sales revenue not accurately reported (Screen
l3)? Check the accuracy of input data.
3.
"Dairy cow end year inventory at beginning prices > beginning year
inventory but no increase in dairy cow numbers."
Quality of cows increased from beginning to end of year (Screen
3). Check to see if this is accurate.
3.
"Dairy cow end year inventory at beginning prices < beginning year
inventory but no decrease in dairy cow numbers."
Quality of cows decreased from beginning to end of year (Screen
3). Check to see if this is accurate.
48 3. "Number of cows - 0, total value - $x." (Where x > 0)
"Number of cows - x, total value - $0." (Where x > 0)
(Also for heifers and bulls and other livestock.)
There is missing data. If number of livestock is entered there
must be a corresponding value for those livestock. If a value for
livestock is entered, the number of livestock must be entered.
REAL ESTATE INVENTORY
3. "Real estate appreciation> 0.05 of beginning + value added or
< 0."
Real estate appreciation is greater than expected in "normal"
circumstances or is negative (Screen 5). Real estate values may
have not been changed for several years and this year's change
reflects more than one year's increase. If this occurred, change
the beginning of year value to accurately reflect beginning of
year value.
3.
"Lost capital> 0.50 of real estate purchased -
"
Lost capital is greater than "normally" expected (Screen 5).
Small capital improvements may not add to the market value of the
property and, therefore, lost capital could be equal to the total
cost.
3.
"Land and building inventory> $30,000 but no land is owned."
Implies ownership of buildings, but no land (Screens 5 and 7).
Check to see if this is accurate. The operator could rent or
lease a farm, but own improvements or real estate consistent with
the terms of the contract. If the farm is a partnership or
corporation, check to determine if assets are recorded consistent
with expenses.
3.
"Land is owned but no land and building inventory value."
If land is owned, a market value was not entered (Screen 4).
owned may have incorrectly been entered. The above stated
possibilities should also be explored.
3.
Land
"Building depreciation> 4% of beginning real estate."
Building depreciation is greater than "normally" expected (Screen
4). Check to see if machinery and equipment or livestock depre
ciation was incorrectly included. Large investments in new
buildings may justify depreciation in excess of four percent.
3.
"Real estate inventory value added < $0."
Lost capital exceeds the value added from new real estate
purchases (Screen 5), At worst, this should be $0. Check to be
certain data entry is correct.
49 LIVESTOCK AND BUSINESS DESCRIPTION
5.
"Number of bulls and other livestock inconsistent with livestock
inventory." (When number - 0 and inventory> 0, or number> 0 and
inventory - 0)
Data entered on Screens 4 and 6 are inconsistent with respect to
other livestock. Check data collected and entered for accuracy.
5.
"Milk per cow - n pounds."
(When n <8,000 or n >18,000)
Pounds milk sold per cow is outside the "normal" range. Check to
see if average cow numbers and pounds of milk sold (Screen 6) are
entered correctly. Check butterfat content to see if a non
Holstein herd is being analyzed.
5.
"Milk per worker - n pounds."
(When n < 200,000 or n > 700,000)
Milk sold per worker is outside the "normal" range. Check to see
if months of labor (Screen 7) and milk sold (Screen 6) are entered
correctly.
5.
"Average number of dairy cows at least 25% more than total at end,
owned and leased."
Implies a significant reduction in herd size from beginning to end
of year which occurred close to year end (Screens 4 and 6). Check
to see if this is correct.
5.
"Average number of dairy cows at least 25% less than total at end.
owned and leased."
Implies a significant increase in herd size from beginning to end
of year which occurred close to year end (Screens 4 and 6). Check
to see if this is correct.
5.
"Invalid business description."
One or more of the coded business descriptions (Screen 6) are out
of acceptable range. Check data entry.
5.
"Single proprietorship but operators labor - n months."
> 12)
(When n
Single proprietorship category was checked on Screen 6, but more
than one operator was recorded on Screen 7. A single proprietor
in the majority of instances would have only one operator, the
other should be reported as family unpaid. An exception to this
would be when a second person is significantly involved in the
day-to-day management of the business, then this person would be
entered as Operator #2.
5.
"Hired labor expense but no hired labor."
Hired labor expense was recorded on Screen 13 but no months of
hired labor were recorded on Screen 7. Check to be certain these
50 two entries are consistent. Example: labor hired off farm to
repair a roof should be reported as land, building, and fence
repair, not as hired labor. If the farm is a partnership or
corporation, check the labor inventory against business organi
zation for consistency.
5. "Hired labor but no hired labor expense."
Hired labor months were recorded on Screen 7 but no expense on
Screen 13. These two entries should be consistent. Example:
Hired labor was paid with milk, beef or other farm products. Add
the value of the products to receipts (Screen 12) and then count
it as an expense (Screen 13). If the farm is a partnership or
corporation, check the labor inventory against business
organization for consistency.
5.
"Partnership or corporation but operator labor is s 12 months."
Partnership or corporation operator labor input is "normally"
expected to be greater than 12 months. Check to see if labor
input (Screen 7) is correct.
lAND AND CROPS
5.
"Land is rented but rental expense - $0."
Land is rented (Screen 7) but real estate rent/lease is $0 (Screen
13). Check to see if this is correct. Example: If land rent is
paid with a portion of crop, report that value as a crop sale and
as a rent payment.
5.
"There are less than two tillable acres per cow."
Land is very limited. Check to see if feed purchases (Screen 13)
reflect low levels of farm grown feeds. Check to see if all owned
and rented land has been omitted (Screen 7).
5.
"Hay crop yield is < 2 or > 4 tons DM per acre.
"
Yield is
Hay crop yield is outside the "normal" range. Check to see if a
large number of acres of new seeding were established, poor
weather or good weather existed. Also check acres in hay for
accuracy (Screen 8).
5.
"Corn silage yield is < 2.5 or > 7 tons DM per acre.
Yield is
"
Corn silage yield is outside "normal" range. Check to see if the
dry matter coefficient and conversion are correct (Screen 8).
Check acres of corn silage (Screen 8) and determine if some acres
were not harvested. Check calculation of quantity harvested.
5.
"Corn grain yield is < 50 or > 120 bushels per acre.
Yield is
"
Corn grain yield is outside "normal" range. Check to see if
moisture conversion and/or bushel conversions were done correctly
51 (Screen 8). Check acres in corn grain and repeat calculations of
quantity harvested.
5.
"Oat yield is < 40 or > 100 bushels per acre.
Yield is
"
Oat yield is outside the "normal" range. Check to see if oat
acreage was reported under grain and production under forage if
harvested as oatlage (Screen 8).
5.
"Tons DM harvested per cow < 4 or > 12 - _________ "
Tons of dry matter harvested is outside "normal" range. Check dry
matter harvested calculations, cow numbers, and feed purchases for
consistency.
5.
"Tillable land, all acres, does not equal total tillable acres."
Calculations on Screen 7 and Screen 8 are not correct/consistent.
Review the data entries for accuracy and recheck your math.
ASSETS AND LIABILITIES
7.
"Scheduled debt payments> 0.35 of milk sales -
"
Scheduled debt payments are 10 percentage points above the average
(Screens 10 and 12). Check milk sales and debt payment schedule
for accuracy.
7.
"Long-term debt> 0.80 of land and building inventory."
Long-term debt is higher than "normally" expected. Check to see
if data is entered correctly (Screen 10). Falling asset values
may have contributed to creation of this situation as well as
increased borrowing.
7.
"Farm ne t worth < 0.30 of farm cap i tal.
NW
"
Farm net worth is lower than normal (Screen 10). Check all
calculations for accuracy. Falling asset values and increased
borrowing may have contributed.
7.
"Debt per cow> $3,500
Debt per cow is above average.
(Screens 6 and 10).
7.
"
Check for accuracy of data
"Accounts receivable < 5% of milk sales."
The December milk check may not have been included as an account
receivable (Screen 12). Check to see if all accounts have been
included.
7.
"Intermediate term debt> total farm inventory less real estate."
Intermediate term debt is high and; in fact, greater than
intermediate term assets (Screens 9 and 10). Check to see if this
1s correct.
52 7.
"Principal payment exceeds liability."
If no new money was borrowed, the amount of principal paid should
not be greater than the beginning year liability amount. Check to
make certain the data is accurate.
7.
"Long-term planned payments> long term debt."
Long-term planned payments being greater than long-term debt would
be expected to occur only in the last year of the payment
schedule. Check all entries for accuracy (Screen 10).
7.
"Intermediate term planned payments> intermediate term debt."
Intermediate term planned payments greater than intermediate term
debt would be expected to occur only in the last year of the
payment schedule. Check all entries for accuracy (Screen 10).
7.
"Short-term planned payments> 120% of short-term debt."
Short-term planned payments are higher than expected.
accuracy of entries (Screen 10).
7.
Check for
"Planned reduction of operating debt> operating debt."
This is a definite inconsistency. The reduction in operating debt
cannot be greater than the end of year balance (Screen 10). Check
to see if interest is included.
7.
"Planned reduction of accounts payable> accounts payable."
This is a definite inconsistency. The reduction in accounts
payable cannot be greater than the end of year balance (Screen
10). Check to make certain interest and penalties have not been
included.
7.
"Liability> 0 but no scheduled payment, liability - $
-----
"
Liabilities are greater than $0 but scheduled debt payments are
$0, indicates that the payments were inadvertently omitted or, in
fact, that no payments are scheduled (Screen 10). Check to make
certain the data is accurate.
7.
"Decrease in
liability from beginning to end year does not
equal principal paid."
If no new money was borrowed, the decrease in the liability amount
from beginning to end year should equal the amount of principal
paid during the year. Check to make certain the data is accurate
(Screen 10).
7.
"Amount of money borrowed entered (______ ) does not equal
calculated money borrowed (
)."
If a value was entered in the "amount of new borrowings" column
(Screen 10), it should equal the calculated value for money
borrowed. The formula for calculating money borrowed is: (end
year liability - beginning year liability) + principal paid.
Check to make certain the data is accurate (Screen 10).
53
FINANCIAL LEASES
8.
"Leases cattle but no lease expense."
Cattle are leased (Screen 11) but lease expense is $0 (Screen 13).
Check to be certain cattle lease is not included with machinery or
real estate lease and the cattle are in fact leased, not rented.
8.
"Leases equipment but no lease expense."
Equipment is leased (Screen 11), but lease expense is $0 (Screen
13). Check to see if cattle or real estate lease includes
equipment (Screen 13) and if equipment is in fact leased.
8.
"Leases structures but no lease expense."
Structures are leased (Screen 11), but lease expense is $0 (Screen
13). Check to see if cattle or real estate lease includes
equipment (Screen 13) and if equipment is in fact leased.
RECEIPTS
9.
"Milk price < $11 or > $15.
Price - $----- per cwt."
Milk price is outside the "normal" range. Check to see if pounds
of milk sold are under-reported (Screen 6), milk sales (gross) is
over-reported (Screen 12) or a Jersey herd is being summarized
(Screen 6).
9.
"Tillable crop acres per cow> 4, but $0 crop sales."
Tillable crop acres per cow are high (Screen 7) but not crop sales
are reported (Screen 12). Check to see if crop yields are low
(Screen 8) or inventories of feed and supplies increased
(Screen 3).
9.
"No dairy cattle sales."
This statement indicates that dairy cattle sales on Screen 12 is
blank. Check to see if this was overlooked when gathering data or
not entered in the computer.
9.
"No dairy calf sales."
This statement indicates that dairy calf sales on Screen 12 is
blank. Check to see if this was overlooked when gathering data,
not entered in the computer or if in fact all calves were either
raised or died and, therefore, no sales existed.
9.
"Government receipts, other receipts or miscellaneous receipts
> $5,000."
Government receipts, other receipts or miscellaneous receipts are
greater than normally expected. Verify that the entry is correct
(Screen 12) and that other categories are not more appropriate.
54 9.
"Gas tax refund in excess of $500."
Gas tax refund is greater than normally expected. Verify that the
entry is correct (Screen 12) and that other receipts have not been
included here.
6 &9
"Total change in accounts receivable entered as a receipt does not
equal change in accounts receivable entered as an asset."
This indicates a problem in calculation or data entry as these two
totals should be equal.
EXPENSES
11.
"Hired labor expense < $400 or > $1,200 per month, - $_________
per month."
Expenses per month for family paid and hired labor are outside the
normal range. Determine if months of labor recorded (Screen 7)
and labor expense (Screen 13) are accurate.
11.
"Total accrual (item) expenses are negative."
An accrual expense (Screen 13) would not likely be a negative
value. Check the data for accuracy. Values in the column "Cash
amount paid" cannot be negative. It is possible to have negative
values in the "Change in Acct. Payable" column; however, an
offsetting value in "Cash Amt. Paid" calculates to a positive
accrual expense. It is possible to have negative values in the
"Change in Inventory" column calculated from entries made on page
2, Screen 3. However, this indicates an increase in that
inventory item and, therefore, should be offset by "Cash Amt.
Paid" or "Change in Acct. Payable".
II,
"Owns farm real estate but pays no taxes,"
Farm real estate is owned (Screen 5) but taxes are not reported
(Screen 13). Check to see if taxes were paid but not reported,
paid by a third party or not paid during the year.
11.
"Farm liabilities> $0 but no interest expense, liabilities $_--II
Farm liabilities exist (Screen 10), but no interest expense
reported (Screen 13). Check to see if special circumstances exist
or if interest was in fact not paid during the year.
11.
"Interest expense on page 11 does not equal interest payments on
page 7."
The total farm liability interest (Screen 10) does not equal total
interest expense (Screen 13). Check to see if data was collected
and entered correctly. These two totals must be identical.
55 11.
"Cattle lease expense> $0, but no lease information."
Cattle lease expense is reported (Screen 13), but lease informa
tion is missing (Screen 11). Record the information on Screen 13
once the existence of an actual lease has been verified.
11.
"Owns farm real estate but pays no insurance."
Farm real estate is owned (Screen 5) but no insurance expense is
reported (Screen 13). Check to see if insurance expense was
omitted or is included in other categories. Make certain real
estate is owned.
11.
"Personal withdrawals and family expenditures < nonfarm income."
This indicates that the nonfarm income could be subsidizing the
farm business and, therefore, the Net Personal Withdrawals from
Farm on page 7 of the Business Summary will be negative. Check to
be certain this is accurate.
6 & 11
"Total change in prepaid expenses entered as an expense ($ _______ )
does not equal the total prepaid expenses change entered as an
asset ($
).
The total change in prepaid expenses in Screen 13 does not equal
the total prepaid expenses change in Screen 9. There must be a
data acquisition or data entry problem.
7 & 11
"Total change in accounts payable entered as expense does not
equal change in accounts payable entered as liability."
The total change in accounts payable on Screen 10 does not equal
the total accounts payable change on Screen 13. There must be a
data acquisition or data entry problem.
11.
"Operating cost of producing milk is < $8 or > $12/cwt., -
$
"
The operating cost of producing milk is outside the "normally"
expected range. Check all operating expenses and nondairy
receipts for accuracy (Screens 12 and 13) as well as total pounds
of milk sold (Screen 6).
11.
"Total cost of producing milk is < $10 or > $16/cwt., $_--- "
The total cost of producing milk is outside the "normal" range.
Check all expenses and nondairy receipts, plus interest on equity
capital and value of operator's labor and management and unpaid
family labor for accuracy (Screens 12, 13, and 7). Also check the
total pounds of milk sold for accuracy (Screen 6),
MANAGEMENT PERFORMANCE MEASURES
12 & 13
"Net farm income wlo appreciation - $n."
$50,000)
(When n < $10,000 or >
Net farm income without appreciation is outside the "normally"
56 expected range. Review receipts and expenses especially accounts
payable and receivable, depreciation, and inventory changes for
accuracy.
12
&
13
"Net farm income w/appreciation - $n."
>$50,000)
(When n < $10,000 or
Net farm income with appreciation is outside the "normally"
expected range. Review receipts and expenses especially
livestock, machinery, and real estate appreciation for accuracy.
12 & 13
"Labor and management income per operator < $0 or > $30,000
$
"
Labor and management income is outside "normally" expected range.
Review the cash receipts and cash expenses (Screens 12 and 13) and
especially inventory adjustments and/or depreciation for real
estate, machinery and equipment, livestock, and feed and supplies.
12 & 13
"Return to operator's labor, management, and equity capital
< $10,000 or > $50,000."
Return to operator's labor, management, and equity capital is
outside the "normally" expected range. Check all receipts and
expenses, plus the unpaid family labor for accuracy.
12 & 13
"Grain and concentrate as % milk unusually low or high.
n%," (When n < 10% or > 40%)
Value is
Feed purchases as a percent of milk sales is outside the normally
expected range. Check feed purchases (Screen 11) for accuracy,
check to see if crop yields are high and/or a large number of crop
acres per cow exists,
12 & 13
"Rate of return on equity capital w/o appreciation - n%,"
(When n
S 0% or > 10%)
This indicates a rate of return without appreciation outside the
"normally" expected range. Check expenses and receipts as well as
assets and liabilities for accuracy.
10, 12 & 13
"Cash flow imbalance (error) is > 1% of total cash inflows."
The cash flow imbalance is greater than can be accepted, Check
the family withdrawals and family expenditures calculations for
accuracy; remember income and social security taxes are considered
personal withdrawals and family expenditures. Check principal
payments as well as new borrowings for accuracy. Also consider
gifts and inheritances as possible sources of discrepancy.
7. "Debt to asset ratio < 0.3,
Debt to asset ratio is very low.
ties for accuracy.
"
Check asset values and liabili
57 10. 12 & 13
"Cash flow coverage ratio < 0.8 or > 1.2."
Cash flow coverage ratio is outside "normal" range. Check receipt
and expense items as debt payments made for accuracy.
CROP EXPENSES
13. "Sum of fertilizer and lime expenses for hay crop and corn is >
farm total for all crops."
The allocation of expenses among crops is not accurate (Screen
14). Check the allocations.
13. "Sum of seed and plant expenses for hay crop and corn is > farm
total for all crops."
The allocation of expenses among crops is not accurate (Screen
14). Check the allocation.
13. "Sum of spray and other expenses for hay crop and corn is > farm
total for all crops."
The allocation of expenses among crops is not accurate (Screen
14). Check the allocations.
13.
"Total crop expenses per acre of.hay crop is > $150 or < $20,
.
The total crop expense per acre of hay is outside the "normally"
expected range (Screen 14). Check the allocation of expenses to
hay and compare with yields to see if a deviation is justified.
Also check acreage for accuracy.
"Farm coded irregular" ~ A farm is coded irregular when data is
incomplete, missing or judged to be inaccurate.
"Farm coded part-time" - A farm is coded part-time when operator
months are less than six months and total labor months are less
than 12.
"Farm coded renter" - A farm is coded renter when no tillable land
is owned or the real estate inventory at end year
O.
"Farm coded cash-crop" - A farm is coded dairy-cash crop when cash
crop sales amounted to more than 10 percent of accrual milk sales.
58 59 APPENDIX A HOW' TO COMPLETE DAIRY FARM BUSINESS SUMMARY DATA CHECK-IN FORMS 60
HOW TO COMPLETE DAIRY FARM BUSINESS SUMMARY DATA CHECK-IN FORMS Screen 1.
Cooperator's Name and Address (page 1)
Fill in the name of the operator(s) of the farm business, the farm name if
there is one, the address, and the county's record project in which he or she is
participating. The processing number will be assigned at Cornell if the data is
to be entered on the computer at Cornell. If entering the data in the county,
use the list of processing numbers provided by Cornell to assign numbers to new
cooperators and to confirm numbers used for continuing cooperators.
Please indicate if a farm is to be coded "irregular" at the top of the
check-in form. An "irregular" farm has missing or inaccurate data.
Worksheet 1.
Machinery and Equipment Purchased (page 1)
The only item from this section required to complete a farm business
summary is the total machinery and equipment purchased. Worksheet 1 is included
to provide a workplace for the operator, manager or managers to calculate this
information. If prior to completion of the check-in forms the farm business has
an accurate, up-to-date machinery and equipment inventory there is no particular
need to copy that information onto Worksheet 1.
If completion of the worksheet is required, list all new or used machinery
and equipment acquired during the year and the "boot" amount paid or obligated to
pay on each item. List the market value of items traded-in and make the
inventory checks in order to substantiate beginning and end inventory values.
Check reported capital expenditures with the inventory book for the business.
New items should be inventoried at "boot" plus market value of trade-in less
first year's depreciation. Loss or increase in market value may occur from date
of purchase to year end. Adjust year end value recorded in inventory to
represent year end market values of machinery and equipment purchased. Make sure
traded items are removed from this year's inventory. Do not include any leased
items. We will assume the list of capital purchases and dollar amount reported
here are correct and it will take precedence over other lists that may be
included in the record.
Worksheet 2.
Machinery and Equipment Sold or Destroyed (page 1)
List machinery and equipment that was disposed of by outright sales and
items that were destroyed by fire, flood, and other disasters. Do not list items
traded-in here. Report insurance received from machinery destroyed and check to
see that all dispositions are removed from the end inventory. Add insurance
received from machinery destroyed to total machinery and equiment sold and enter
the total in Screen 2.
As with the machinery and equipment purchased, only the total machinery and
equipment sold (including insurance proceeds) is required to complete a business
summary; consequently, if the farm records are complete and accurate, Worksheet 2
is not needed for input and need not be used.
61 Screen 2.
Machinery and Equipment Inventory and Depreciation (page 1)
The information to be collected in this section is required to calculate
the ownership costs incurred in maintaining an inventory of owned machinery and
equipment and to calculate the increase (or possibly decrease) in the value of
the machinery complement resulting from changes in the price level of farm
machinery and equipment. The fixed cost of maintaining the equipment inventory
is charged as a business expense while machinery appreciation is credited toward
the ownership income of the farm business.
Probably the most difficult information to obtain in this section is the
beginning and end-of-year inventory. If this cooperator had a business summary
the previous year, the end of the year inventory is the beginning of year
inventory for this year. The cooperator then must inventory and determine the
market value of his machinery and equipment as of December 31 of the year for
which you are summarizing. Do not include any leased items.
Machinery and equipment purchased and machinery and equipment sold are the
totals from Worksheets 1 and 2 discussed above. If an alternative source of
complete information for purchases and sales is available, it is not necessary to
complete Worksheets 1 and 2.
Machinery and equipment received from "Noncash Transfer to Farm" is entered
in Screen 2. Include machinery and equipment received as a gift/inheritance or
converted from nonfarm to a farm asset.
The next item is machinery and equipment depreciation as calculated for tax
purposes. This value is used as the charge against the farm business for the use
of the machinery and equipment complement. It is obtained by taking 1989 regular
tax depreciation, excluding buildings and cattle from ACRS and MACRS
depreciation. End-of-year inventory less the total beginning inventory after
changes is equal to machinery appreciation. This value is then used as the
contribution toward ownership income from machinery and equipment.
If machinery appreciation appears to be too high or too low given changes
in prevailing machinery and equipment prices during the year, one might consider
some of the following possible causes:
If change in inventory due to price appears to be too high. check the
following possible causes:
a)
There are more new items in the inventory book than listed as capital
purchases.
b)
New items were not depreciated t his year or were valued at "list price"
rather than at a value based on cost.
c) Trade-ins and other dispositions were not removed from book.
d) Machinery was revalued upward during the year and beginning inventory
was not adjusted in the same direction.
If change in inventory due to price appears to be too low, check these
possible causes:
a)
New items were not all listed in inventory book.
b)
Items acquired through trade were not valued correctly.
62 c) Items no longer in use were removed from end inventory or devaluated
without corresponding changes to beginning inventory.
d) Machinery was revalued downward during the year and beginning inventory
was not adjusted in the same direction.
Worksheet 3.
Grown Feed Inventory Worksheet (page 2)
This worksheet is used to calculate the grown feed inventory at the
beginning and end of year. Space is provided to enter quantities of the various
grown feeds, their market value per unit, and the calculated market value for
each grown feed. The total values of the grown feeds at beginning and end of
year need to be calculated and entered in the appropriate spaces in Screen 3.
The change will be computed and will appear on Screen 12 as a change in crop
inventory. Inventory growth will produce a positive change or increase in crop
receipts.
Screen 3.
Feed and Supply Inventory (page 2)
Report beginning and end market values of purchased feeds and supplies in
Screen 3. Workspace is provided for the quantity and market value per unit for
the purchased feed and supply categories to assist in the calculation of the
total value for each item at beginning and end of year. Of course, if an
accurate accounting was made for the previous year, the end-of-year inventory
should be used for the beginning-of-year inventory for this year. The beginning
of-year data is not optional; it is required. If winter wheat is grown, be sure
to include in grown feed end-of-year inventory (Worksheet 3) the value of the
crop based on the cost incurred in growing it. Unused silage bags should be
entered as supplies in the ttlandjbldg./fence tt category. The footnote for Screen
3 explains how inventory changes are computed and their effect on accrual
expenses.
Screen 4.
Livestock Inventory (page 3)
Report all leased dairy cows at end of year in the space provided. This
number will be added to owned dairy cows at end of year when computing debt
levels per cow.
For owned livestock, this section is used to obtain information on the
inventory of livestock at the beginning and end of the year and to separate the
change in inventory during the year into the change (a) that results from changes
in numbers and/or qualities of livestock and (b) that result from price changes
during the year. The screen is designed to help inventory the livestock by
categories. The heifer inventory allows space for three categories: bred
heifers, open heifers (6 months to breeding), and calves (under six months).
The information required is the number and value at the beginning of the year,
the number and value at the end of the year using beginning-of-year prices, and
the value at the end of the year using end-of-year prices. The value per head
columns are calculated. If you prefer, the values per head may be entered and
the total value columns will be calculated.
The quantity and value for beginning-of-year inventory can either be taken
from last year's end-of-year inventory if accurate information is available or
can be calculated based on the livestock on hand and the value per head at the
beginning of the year.
The end-of-year inventory is more complex since the livestock numbers at the end of the year need to be valued both at beginning-of-year prices and at b
•
-
63 end-of-year prices in order to separate the increase in inventory into two parts.
Unless large numbers of animals have been purchased of a different quality or the
composition of the animals in the group has been altered significantly during the
year, the value per head using the beginning-of-year prices is the same as the
value per head in the beginning-of-year inventory. Situations which could result
in the value per head in the beginning-of-year inventory and the value per head
using beginning-of-year prices for the end-of-year inventory being different
include: 1) the purchase of a large number of animals of higher quality than
those previously in the herd, and 2) the average age of calves in the end
inventory being two or three months more than those in the beginning inventory.
Finally, the end-of-year inventory at end-of-year prices is the same number of
head as for the end-of-year inventory at the beginning-of-year prices times the
value per head based on the market price of the livestock on December 31 of the
summary year.
Worksheet 4.
Land and Buildings Purchases and Sales (page 2)
In this section, only the totals for cost and lost capital of new purchases
and capital improvements, and sale price/amount received and beginning inventory
value of capital sales and losses are required. If the cooperator has an
accurate record of his or her real estate transactions, these totals can be taken
from that record; if the cooperator does not, Worksheet 4 can be used to assist
in calculating the totals.
Screen 5.
Real Estate Inventory Balance (page 3)
This section must be completed to confirm changes in the market value of
real estate during the year.
a) Report the beginning-of-year market value (previous year's end-of-year
value).
b) Enter the ~ of new purchases and capital improvements for land and
buildings and subtract lost capital. Value added (the difference
between cost of new real estate and lost capital) is that proportion of
the new investment that adds to the market value of the farm.
Enter the value of real estate that has come into the farm business
during the year from gifts/inheritances and from conversion of nonfarm
real estate to farm real estate.
c) Building depreciation from 1989 tax return is used as an estimate of a
total building depreciation charge for the year. Be sure to include
depreciation on single purpose agricultural structures, grain bins,
fences, tile, and silos as well as general purpose buildings.
d) Deduct the beginning inventory value of real estate sold. For example,
a tenant house inventoried at $20,000 and sold for $25,000 with $1,000
of sale expenses and a mortgage of $15,000 held by the seller would be
entered as follows:
64
-$20,000
Real Estate Sold: Beginning of year inventory value
$25,000
Total sale price
-1,000
Sale expenses
-15,000
Note/mortgage held by seller
-9,000
Net cash amt. rec'd. in 1989
The "note/mortgage held by seller" of $15,000 must be entered as an
"Other Nonfarm Asset" in Screen 9, page 6. If the seller is not the
mortgage holder, there would be no entry in the "note/mortgage held by
seller" space and the "Net cash amount received in 1989" would then
equal $24,000.
The calculated value, "net cash amount received in 1989", is a cash
inflow to the farm. If part or all of this was converted to nonfarm,
include that amount as a "personal withdrawal and family expenditure"
in Screen 13.
e) Beginning market value plus value added from real estate purchased,
minus depreciation and the value of sales, equals total beginning value
after changes.
f) End-of-year market value less the total beginning value after changes
is equal to real estate appreciation on the assets owned at end of
year. Real estate appreciation also needs to be calculated for the
assets sold during the year by subtracting the beginning year value of
real estate sold from the sale price. These values are then used as
the contribution toward ownership income from real estate.
Screen 6.
Livestock and Business Description (page 5)
The average number of cows for the year is a key factor. It can be taken
from the DHIA or other herd testing records. It is the average number of cows in
the herd each month totaled and divided by 12. It includes dry cows as well as
cows in milk. It includes leased cows. It is not an average of beginning and
ending inventory numbers. Also report the average number for year of dairy
heifers and bulls. If the data is being entered on a computer in the county,
enter the work units for other livestock. Use Table I, page 16 of the Micro-DFBS
User's Manual as a guide.
Total pounds of milk sold is the total weight reported by the milk plant.
Average milk plant test is not used to convert to a 3.5 equivalent. It is used
as a reference only.
Check the appropriate item under Production Record, Milking System,
Business Type, Milking Freguency, Dairy Housing, and Primary Financial
Recordkeeping System.
Under milking frequency, check "2x/day" if all cows were milked twice a day
for the entire year; check "3x/day" if all cows were milked three times a day for
the entire year; or, check "other" if a portion of the herd was milked three
times a day or the total herd was milked three times a day for part of the year.
65 Screen 7.
Labor Inventory (page 5)
Begin by identifying the operators of the farm. Operators should include
all individuals who are integrally involved in the operation and management of
the farm business. They are not limited to those who are the owner of a sole
proprietorship or are formally a member of a partnership or corporation. In
instances where a husband and wife operate and manage the farm as a team both may
be included as operators. The labor input of each operator should then be
specified in months. In most instances, this is 12 months but in some instances
where one or more operators of the farm business have other items occupying their
time, such as an off-farm enterprise, commitment to farm organizations or family
commitments; less than 12 months would be appropriate. In addition, for each
operator, indicate their age, their years of education, and the estimated value
of their management and labor input. This value should be based on what that
person could earn in a similar capacity in similar employment. Any farm expenses
for labor or perquisities for these operators should be excluded from the labor
expenses entered later in the input. This exclusion will probably be most
relevant for corporations but may also apply to other businesses.
In addition, the total months of family labor who are paid, the months of
family labor not paid, and the total full-time months of hired labor should be
recorded. The full-time months can then be totaled and divided by 12 to
determine the worker equivalent.
The conversion to full-time, worker-month equivalents is necessary;
conversion is not always easy but is very important to an accurate summary. A
high school student may provide three months of worker-month equivalent labor
during the 10 month school year by working part-time. Convert hourly labor on
the basis of 230 hours per month.
Screen 7.
Land Inventory (page 5)
The purpose of this section is to obtain a complete accounting of the owned
and rented acreages included as a part of this farm business. First, the
tillable acres owned and rented should be entered. Tillable acres should include
all acres that normally are cropped, either in row crops, hay crops, or cropland
pasture. Pasture acres owned and rented should include all acres of pasture that
are not cropland. Nontil1able woodland and other acres owned would then be
included and the three would add to total acres owned, rented and to the total
acres in the farm business.
Screen 8.
Tillable Land Use (page 5)
The purpose of this section is to obtain a complete accounting of the
tillable acres in the farm business and an accurate record of the cropping
program of the farm business. This record is an essential part of the business
summary.
The forage crops should be separated into hay, hay crop silage, corn
silage, and other forage crops harvested (could include green chop, small grain
silage, and sudan/sorghum silage). Enter only the first cut acres for all hay
crops on the first line. The measure of production of the roughages is the total
tons of dry matter. The intermediate columns of total production and percent dry
matter are used to assist in calculating the total tons of dry matter. Total
production of all hay crops are divided into dry hay and hay crop silage. The
total production of corn for grain, oats, and wheat should be reported on a dry
bushel equivalent. Worksheet 5 is included on the opposite page for conversion
of corn to a dry shelled basis.
66 Clear seeding acres should be entered under hay unless another crop is
grown on those acres and considered the major crop in which case the acres are
entered with the major crop. Acres used to grow winter wheat should be entered
with the crop grown during the regular growing season.
After the acreages and production of the harvested crop enterprises have
been reported, the acres of tillable cropland included in pasture and the acres
of idle tillable cropland should be recorded. The total of all of the acres in
each of these enterprises should be the total tillable acres. This total should
then be compared to the total tillable acres recorded above in the land
inventory. Furthermore, if this cooperator was in the summary the previous year
and has not had a change in owned or rented acres, the tillable acres should be
exactly the same as they were in the previous year.
Screen 9.
Farm Family Financial Situation - Assets (page 6)
The assets section of the Farm Family Financial Situation requires entry of
all farm and nonfarm assets for beginning and end of year. Total farm inventory
is calculated from the previously-entered inventory sections.
If a cooperator had a business summary the previous year, the end-year
assets are the beginning-year assets for this year. The x
x spaces for
prepaid expenses indicates optional input; i.e., the entire concept of prepaid
expenses may be ignored if you feel it has no significant affect on the
profitability of the business.
Do not enter negative numbers for "Farm cash, checking & savings". If
there is a negative checkbook balance, it should be considered money borrowed and
included in operating debt, and a zero entered for farm cash, checking, and
savings.
Nonfarm assets for partnerships and corporations should include nonfarm
assets of all families in the business or none at all.
Mortgages or notes held from the sale of farm real estate should be
included as "Other Nonfarm Assets".
See the footnotes at the bottom of page 6 of the check-in form for further
guidelines to completing the assets section.
Screen 10.
Farm Family Financial Situation - Liabilities (page 7)
The liabilities and debt payments sections of the Farm Family Financial
Situation require entry of all liabilities for beginning and end of year, the
principal and interest actually paid in 1989, and the planned payments for 1990.
If a cooperator had a business summary the previous year, the end-year
liabilities are the beginning-year liabilities for this year.
The primary objective in classifying liabilities is to identify the correct
term of the loan. Long-term and intermediate term loans will be analyzed
separately in the summary. If more liabilities exist than there are lines for,
liabilities for the same term may be combined. Do not include leased items, they
are entered in Screen 11.
The "Amount of New Borrowings" column is optional input.
money borrowed in 1989 is entered, this value will be compared
value for money borrowed «End year liability - beginning year
principal paid). If the two values do not agree, a diagnostic
If the amount of
to the calculated
liability) +
will be printed.
67 The calculated value for money borrowed will be used in the Annual Cash Flow
Statement.
For FLB and PCA liabilities, be sure the proceeds amount is entered as the
liability (i.e., exclude FLB and PCA stock). The amount of FLB and PCA stock
will be displayed under Intermediate Term Debt. These values are automatically
carried over from FLB and PCA stock assets entered in Screen 9, page 6.
If refinancing occurred during 1989, use of the "Amount of Debt Refinanced"
column will help you arrive at more accurate values for "Amount of New
Borrowings" and "Actual 1989 Principal Payments". The amount of the "old" loan
refinanced should be entered as a negative number in the "Amount of Debt
Refinanced" column. The "new" loan or refinanced amount added to existing loans
is entered as a positive number. These entries offset each other; therefore, the
total of the "Amount of Debt Refinanced" column would always be zero. The amount
of debt refinanced would not be included in the "Amount of New Borrowings" or the
"Actual 1989 Principal Payments" columns.
Include debt payments for all liabilities listed. If no payments are made,
please enter zero. In the event of a deferred loan (except FmHA), add the
interest to the end year liability, enter the interest as paid (under debt
payments, Screen 10 and interest expense, Screen 13), and enter the interest
amount as money borrowed. Enter planned payments for 1990. In the case of an
FmHA Deferred Loan. the unpaid interest is not converted to prinCipal; therefore,
the interest would be included as an account payable.
The total of the farm interest actually paid in 1989 (7th column) should
equal the interest expense entered in Screen 13, page 11.
The "Nonfarm Liability/Payments" line includes debt incurred for all
nonfarm assets purchased. For example, if a pleasure boat was purchased using
debt capital, record the beginning and end of year nonfarm loan balances, amount
of new borrowing for the boat, actual payments made on the boat or any other
nonfarm loan during the year, and next year's planned payments. If the farmer
prefers not to record nonfarm liabilities, any new nonfarm borrowings must also
be excluded from "personal withdrawals and family expenditures" in Screen 13,
page 11.
See the footnotes at the bottom of page 7 of the check-in form for
additional guidelines to completing this section.
Screen 11.
Financial Leases (page 8)
The purpose of this table is to help calculate the expenses associated with
financial leases and to determine the present assets and liabilities for the
leased items. Include those items for which the farmer originally had an
obligation to make specific payment for more than one year. Do not include items
such as: machines rented per hour or day; buildings, equipment and, cattle rented
from a family member; payments on purchase contracts.
The total yearly expense is calculated by multiplying the amount of each
payment times the number of payments for the year. The total yearly expenses for
each item are added to get the total expense for cattle, equipment, and
structures. The totals must be entered under expenses on page 11. The total
expense for cattle is entered under cattle lease; the total expense for equipment
is entered under machine hire, rent and lease; and the total expense for
structures is entered under real estate rent/lease.
68
Enter the number of payments in a full year and the number of payments
remaining for each item. From this information present values for assets and
liabilities can be computed for the leased items.
Worksheet 6.
Changes in Operating Accounts Receivable (page 8)
The purpose of Worksheet 6 is to assist in calculating the changes in
operating accounts receivable and to allocate the changes to the appropriate
receipt category for entry in Screen 12, page 9. If there are no operating
accounts receivable other than the January milk check, it is not necessary to use
the worksheet. Simply calculate the difference in the account receivable from
beginning to end of year and enter that value in Screen 12 in the space for
"Milk, Change in Accounts Receivable".
Note: To calculate the correct change in accounts receivable, subtract the
beginning of year balance (January 1, 1989) from the end of year balance
(December 31, 1989) to get the increase in accounts receivable. Worksheet 6 is
designed to produce the right calculation when used correctly.
The total of the column "Balance, December 31, 1989" in Worksheet 6 must
equal the value in Screen 9, page 6 for "Accounts Receivable, December 31, 1989".
The total of the column "Balance, January I, 1989" in the worksheet must equal
"Accounts Receivable, January I, 1989" in Screen 9. The totals of the "Change in
Account" and "Receipt Category Amount" columns in Worksheet 6 must be equal.
They must also equal the total of the column "Change in Accounts Receivable" in
Screen 12, page 9. See the bottom of page 8 of the check-in form for further
guidelines to recording changes in accounts receivable.
Screen 12. Summary of 1989 Receipts and Changes in Inventory and Accounts
Receivable (page 9)
Record the 1989 cash receipts and changes in accounts receivable in Screen
12. The "Change in Inventory" column is calculated by the computer program from
entries previously made in Screen 3 (grown feeds inventory) and Screen 4
(livestock inventory) and Screen 10 (advanced government receipts). Use
Worksheet 6 on page 8 to assist in the calculation of changes in accounts
receivable. The "Accrual Receipts" column is the total of the first three
columns.
Enter the amount received for sale of stock and certificates other than FLB
and PCA stock. This value will be used in the calculation of appreciation of
stock and certificates to be included as ownership income.
The section at the bottom of Screen 12 is used to record nonfarm cash
inflows. The last line in Screen 12 is for noncash capital transferred to the
farm business for cattle, crops, etc .. excluding machinery (enter in Screen 2)
and real estate (enter in Screen 5).
See the bottom of page 9 of the check-in form for further guidelines to
recording the farm and nonfarm receipts.
Worksheet 7.
Changes in Operating Accounts Payable (page 10)
The purpose of Worksheet 7 is to assist in calculating the changes in
operating accounts payable and to allocate the changes to the appropriate expense
category for entry in Screen 13, page 11. If there are no operating accounts
payable, do not use the worksheet. go directly to Screen 13 on page 11. When
Worksheet 7 is used, enter the end of year balance. then enter and subtract the
69 beginning of year balance to obtain the correct change in accounts payable.
The total of the column "Balance 12/31/89" in Worksheet 7 must equal the
value in Screen 10, page 7 for "Accounts Payable, December 31, 1989". The total
of the column "Balance 1/1/89" in the worksheet must equal the value in Screen 10
for "Accounts Payable, January 1, 1989". The totals of the two "Change in
Accounts Payable" columns in Worksheet 7 must be equal. They must also equal the
total of the column "Change in Accounts Payable" in Screen 13, page 11. See the
bottom of page 10 of the check·in form for further guidelines to recording
changes in accounts payable.
Screen 13. Summary of 1989 Expenses and Changes in Inventory and Accounts
Payable (page 11)
Record the 1989 cash expenses and changes in accounts payable in Screen 13.
Be sure to include as cash expenses any items paid directly by a bank through use
of a "line-of·credit". Payment on the "line·of-credit" is a reduction in the
account payable to the bank. Use Worksheet 7 on page 10 to assist in the
calculation of changes in accounts payable. The "Accrual Expenses" column is the
total of the first three columns.
The "change in inventory or prepaid expenses" column contains both
calculated values and optional input values. The change in inventory items (. __ _
___ spaces) are calculated by the computer program from entries previously made
in Screen 3 (purchased feed and supplies inventory). The change in prepaid
expense items (x
x spaces) are optional input (i.e., the entire concept of
prepaid expenses may be ignored if you feel it has no significant affect on the
profitability of the business). The total change in prepaid expenses must equal
the difference between prepaid expense totals in Screen 9, page 6 (beginning year
- end year).
Enter the amount spent for purchase of stock and certificates other than
FLB and PCA stock. This value will be used in the calculation of appreciation of
stock and certificates to be included as ownership income.
Enter all personal withdrawals and family expenditures in the space
provided at the bottom of Screen 13. Do not skip this entry. It is necessary
for the Annual Cash Flow Statement to balance and also for an accurate Cash Flow
Coverage Ratio to be calculated. Include all cash withdrawals plus all
additional nonfarm expenses paid with farm cash or from farm accounts, e.g.,
income tax, self-employment tax, and life insurance. Include withdrawals used
for nonfarm loan payments, savings, and investments as well as family living
expenses. Include borrowed capital used for nonfarm purchases, providing it has
been entered as a nonfarm liability in Screen 10, page 7. E.g., if a pleasure
boat was purchased using debt capital, in the year of purchase the amount
borrowed and any payments made during the year must be included as a family
expenditure. If any or all "Nonfarm Cash Income" has been excluded from the
value entered in Screen 12, page 9, you must also exclude any family expenses
paid from that income.
See page 12 of the check·in form for further guidelines to recording farm
expenses.
Screen 14. Breakdown of 1989 Crop Expenses by Crop (page 13)
Record the breakdown of crop expenses for hay crop, corn, and other crops
in Screen 14. The "Total" line at the bottom of the screen must equal the
accrual expenses on Screen 13, page 11, for fertilizer and lime, seeds and
70 plants, and spray and other. Calculate the accrual expense for these three crop
expense categories on Screen 13 by totaling "Cash Amount Paid" + "Change in
Inventory" + "Change in Accounts Payable". The "Change in Inventory" values are
calculated from the beginning and end year inventory values in Screen 3, page 2
(beginning year - end year - change in inventory).
The computer program will display on Screen 14 the total accrual expenses
for the crop expense categories from Screen 13 at the time of data entry. The
"All other crops" line will be calculated using the accrual expense totals less
the values entered in the first two lines of the screen for hay crop and corn.
Unless you have a better basis for allocation, allocate lime expenses
proportionately across all crop acres, to allow for the fact that benefits extend
to crops grown in future years, not just the first year. Charge fertilizer,
chemical, and seed costs to the crop applied to. Of course, fertilizer and
chemicals can have carryover effects on future crops as well, but in most cases,
it would be impossible to accurately allocate these carryover effects.
71 APPENDIX B PROCEDURES FOR CALCULATING COST OF PRODUCING MILK 72 73
PROCEDURES FOR CALCULATING COST OF PRODUCING MILK
1989 DAIRY FARM BUSINESS SUMMARY
Example.!a/
Total Accrual Operating Expenses
Plus: Expansion Livestock Expense
Accrual Operating Expenses Including
Expansion Livestock
Total Accrual Receipts
Less: Accrual Milk Sales
Accrual Receipts Less Milk Sales
Operating Cost of Producing Milkh/
$124,588
+9,000
$133,588
$189,325
-146,970
Total Accrual Expenses
Family Labor Unpaid
Accrual Receipts Less Milk Sales
Total Cost of Producing Milk Excluding
Operator's Labor, Management & Capital£!
Total Accrual Expenses
Family Labor Unpaid
Value of Operator's Labor & Management
Real Interest on Equity Capital
Accrual Receipts Less Milk Sales
Total Cost of Producing MilkQ/
- 42,355
$ 91,233
$154,483
+ 2,250
- 42,355
$114,378
$154,483
+ 2,250
+ 40,000
+ 15,622
- 42,355
$170,000
,gJSame example as in Section VI of this publication.
h/Considering only operating costs, this measure shows how you are doing on cost
control in "operating" the business. If milk receipts are less than this
measure, the farm has serious milk production profitability troubles which must
be corrected immediately if the business is to survive.
£!Considering all costs except the opportunity cost of operator's labor,
management, and equity capital, this measure after being subtracted from milk
receipts will show the return from milk production to the above mentioned
factors of production. If milk receipts are less than this measure of cost of
producing milk, the business has milk production profitability difficulties,
If the operating cost of producing milk is less than milk sales, but this
measure is more than milk sales, the farm business is contributing to but not
totally covering fixed costs, This situation must be corrected for long-run
business survival.
~Considering
all costs of producing milk, including the opportunity cost of
operator provided inputs, this measure is the best indicator of long-run
business survival. On many farms, the total cost of producing milk will be
less than milk sales. This does not imply the business is doomed. If milk
sales are greater than the previously discussed two measures of cost of milk
production, but less than the total cost of producing milk, the business is not
returning the total opportunity cost of operator provided inputs. For long-run
business survival, farms should strive for milk sales to meet or exceed this
cost of producing milk,
74 75 APPENDIX C CREATION OF A CONFIG.SYS FILE •
.
76 77
CREATION OF A CONFIG.SYS FILE
In order for the program to work properly, a CONFIG.SYS file must exist in
the root directory of a hard disk or on the MSDOS or PCDOS boot diskette of a
floppy based system. To see if such a file exists. use the DIR command to get a
directory of the existing files in the root directory.
For example. on a hard disk you would type:
DIR C:\CONFIG.SYS and press return.
If the file exists. it will be listed on the screen. if the file is not present a
message "FILE NOT FOUND" will be displayed.
Existing files will need to be edited.
command. To use this command, type:
This can be done by using the EDLIN
EDLIN CONFIG.SYS and press return
and the following message will be displayed if the file is found:
End of input file
*
To get a listing of the file. type 1 and press return.
file will now be displayed:
*
The contents of the
l:*FILES - 10
2: BUFFERS - 10
*
What is displayed on your screen will be similar to the above example.
You will need to edit the line that contains the FILES statement.
example above. line 1 contains the statement. To edit the line type:
1
In the
and press return.
The following will then display:
*1
1: *FILES - 10
1 :*
Enter new information on the blank line directly below the statement.
will now type:
FILES - 16
You
and press return.
The prompt will reappear.
Type:
E and press return.
You will then return to the operating system prompt.
If the file does not exist on your disk, one has been supplied for you on
the program diskette. Simply copy the file onto your boot diskette or into the
root directory of the hard disk.
Once you have completed either of the steps outlined above, you will need
to reboot the computer.
No. 89-27 Budgeting Data for Limited Resource Dairy
Farms, New York
R. Murray-Prior
B. F. Stanton
No. 89-28 Milk Quality, A Pro-Dairy Management Focus
Workshop for Farm Managers -- A Facilitator's
Manual
R. A. Milligan
No. 89-29 Milk Quality, A Pro-Dairy Management Focus
Workshop for Farm Managers -- A Participant's
Guide
R. A. Milligan
No. 89-30 The Economics of Yard Waste Composting in
Westchester County, New York
S. Sherman
No. 89-31 Feeding Management: A Pro-Dairy Management
Focus Workshop for Dairy Farm Managers,
Teacher's Manual
L. Chase
G. Bigger
J. Conway
No. 89-32 Feeding Management: A Pro-Dairy Management
Focus Workshop for Dairy Farm Managers,
Participant's Manual
L. Chase
G. Bigger
J. Conway
No. 89-33 1988 Northeast Beef Farm Business Summary
C. Rasmussen
S. Smith
D. G. Fox
No. 89·34 Farm Income Tax Management and Reporting
Reference Manual
G. Casler
S. Smith
No. 89-35 FORAGE PRODUCTION: A Pro-Dairy Management
Focus Workshop for Farm Managers,
Facilitator's and Participants Manual
N. R. Leonard
R. A. Milligan
W. D. Pardee
No. 89-36 Fruit Farm Business Summary, Lake Ontario
Region, 1988
D. P. Snyder
A. M. DeMarree
No. 89-37 New York Economic Handbook 1990, Agriculture
Situation and Outlook
Extension Staff
No. 89-38 Census of Agricultural Highlights, New York
State, 1987
B. Stanton
W. Knoblauch
L. Putnam