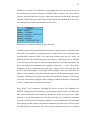
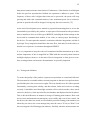
1
Riku-Pekka Silvola
INTEGRATION OF MONITORING EQUIPMENT
TO A SCADA SYSTEM
Degree Programme in Information Technologies
2015
INTEGRATION OF MONITORING EQUIPMENT TO A SCADA SYSTEM
Silvola, Riku-Pekka
Satakunnan ammattikorkeakoulu, Satakunta University of Applied Sciences
Degree Programme in Information Technologies
June 2015
Supervisor: Petteri Pulkkinen & Ari-Pekka Kainu
Number of pages: 39
Appendices: 0
Keywords: SCADA, HMI, WinCC OA, PVSS, CERN, REMUS
__________________________________________________________________
This thesis was done for the HSE SEE Computing section of CERN. Its purpose
was to integrate a radiation monitoring instrument to the REMUS SCADA system,
document the integration process and create a procedure for further integrations.
The thesis is divided into four parts. The first part details the reasons behind the
project and the underlying architecture. In the second part we go through some research methods and document the integration process and its different phases. The
third part is a case study on the integration of a radiation monitor. The fourth part
depicts the problems faced during and after the integration and the possible solutions for them.
The result of the thesis was a successful integration of the Berthold Technologies’
LB 112 micro-gamma logger, and further improvements to the REMUS supervisory
system. The integration process showed much room for improvement and inspired
the creation of the REMUS development templates that could facilitate faster development and would provide a gentler learning curve for new members of the
team.
VALVOMOLAITTEEN INTEGRAATIO SCADA-JÄRJESTELMÄÄN
Silvola, Riku-Pekka
Satakunnan ammattikorkeakoulu
Tietotekniikan koulutusohjelma
Kesäkuu 2015
Ohjaaja: Petteri Pulkkinen & Ari-Pekka Kainu
Sivumäärä: 39
Liitteitä: 0
Asiasanat: SCADA, HMI, WinCC OA, PVSS, CERN, REMUS
__________________________________________________________________
Tämä opinnäyte on tehty CERN:in HSE SEE Computing osastolle. Sen
tarkoituksena oli integroida valvomolaite REMUS SCADA-järjestelmään, ja
ohessa dokumentoida ja formalisoida integraatioprosessi.
Opinnäyte on jaettu neljään osaan. Aluksi käsittelemme projektin lähtökohtia,
päämäärää ja projektin arkkitehtuuria. Toisessa osassa käsittelemme eri tutkimus
menetelmiä ja käymme läpi yleisesti integraatio prosessia ja sen eri vaiheita. Neljäs
osa on tapaustutkimus säteilyvalvontalaitteen integraatio prosessista. Viidennessä
osassa käymme läpi projektin esille tuomia ongelmia ja mahdollisia ratkaisuja.
Tämän opinnäytteen tuloksena oli Berthold Technologiesin LB 112 mikro-gamma
dataloggerin onnistunut integraatio REMUS SCADA-järjestelmään, sekä lukuisten
parannusten tuominen järjestelmään itseensä. Integraatio prosessista löytyi
huomattavasti parantamisen varaa. Kohdatut ongelmat inspiroivat moninaisten
mallipohjien luomisen, jotka ovat auttaneet nopeuttamaan kehitystä ja
helpottamaan uusien työntekijöiden koulutusta.
INDEX
1 INTRODUCTION ...............................................................................................6
2 REMUS ...............................................................................................................8
2.1 WinCC Open Architecture .........................................................................8
2.2 REMUS SCADA system .........................................................................10
2.3 REMUS Finite State Machine .................................................................13
3 RESEARCH METHODS ..................................................................................14
4 THE INTEGRATION PROCEDURE ..............................................................16
4.1
User requirements ....................................................................................17
4.2
4.3
4.4
4.5
Analysis....................................................................................................18
Technical specification ............................................................................18
Device type design ...................................................................................19
Driver design ............................................................................................20
4.6 User Interface ...........................................................................................23
4.7 Development ............................................................................................24
4.8 Testing and validation ..............................................................................25
4.9 Deployment and maintenance ..................................................................26
5 INTEGRATING BERTHOLD LB 112 MICRO-GAMMA LOGGER ............27
5.1 Analysis....................................................................................................27
5.2 Technical documentation .........................................................................28
5.3 Driver and UI design ................................................................................29
5.4 Development ............................................................................................30
5.5 Testing and Deployment ..........................................................................31
5.6 Maintenance .............................................................................................32
6 CONCLUSIONS ...............................................................................................33
7 END NOTES .....................................................................................................36
REREFENCES.......................................................................................................37
5
Abbreviations
CERN
European Organization for Nuclear Research
HSE / DGS
Occupational Health & Safety and
Environmental Protection Unit
SEE
Safety Engineering and Environment Group
RP
Radiation Protection Group
CO
Computing Section
EN
Engineering Department
ICE
Industrial Controls & Engineering Group
REMUS
Radiation and Environment Monitoring Unified System
EDMS
Engineering and Equipment Data Management System
LHC
Large Hadron Collider
ISOLDE
The On-Line Isotope Mass Separator
(Formerly Isotope Separator On Line Detector)
SCADA
Systems Control And Data Acquisition [7]
HMI
Human Machine Interface
MS
Monitoring Station
CONTROL
Scripting language used by WinCC OA
JCOP
Joint Controls Project [8]
API
Application Programming Interface
6
1 INTRODUCTION
CERN is a European research organization located at the Franco-Swiss border near the
city of Geneva. It operates the largest collection of colliders and accelerators, facilitating researchers from around the globe. The experiments at CERN produce ionizing
radiation from collisions and interaction with the surrounding elements and run the
risk of releasing noxious gasses to the environment, and while sewage and industrial
wastewater is discharged to sewage stations in the area, some surface and cooling water is released to the nearby rivers. [1]
The Occupational Health & Safety and Environmental Protection Unit is tasked with
monitoring these risks to limit the exposure of people and the environment to a reasonable achievable level [6]. As a part of this effort, the radiation protection and the
environmental sections of the unit monitor the environment and radiation at the research facility and its immediate surrounding area. A collection of devices are distributed around CERN and outside its premises. Some of these devices come with software for remote control and possibly data acquisition, while others are strictly standalone devices [19]. A unified system would make working simpler, and by having the
same look and feel the use would be more intuitive [7]. Previous attempts have been
made to update and unify the supervision of monitoring instruments at CERN [6], but
the outsourced effort was not a success. The end product did not scale well, had very
poor performance, no reliability and negligible adaptability. Updates to this product
are slow and expensive, and the maintenance disruptive. [19]
In late 2011 work was started on a new system by the HSE SEE Computing section of
CERN. The system would be created with four basic pillars in mind; reliability, scalability, performance and adaptability. Reliability in this case would be paramount as
false or missing radiation alarms and incorrect measurement data would be simply
unacceptable. The system would have to scale massively, to facilitate the devices and
the gargantuan amount of data acquired from them. CERN already utilizes tens of
thousands of detectors and this number is continuously growing [10]. The Joint Controls Project had run extensive tests that found PVSS scalable and especially stable
[11]. This made it a prime candidate for the new system. In addition REMUS was
7
designed with a light interface, only loading what was necessary. This compartmentalization made it also highly adaptable and permitted the delegation of some of the
administration effort to a few trusted end users. By building on top of WinCC Open
Architecture, the section could leverage the organization’s prior experience and the
existing support system. The system was named REMUS, a reverse acronym standing
for Radiation and Environment Monitoring Unified Supervision.
In early 2013 I joined the team, taking over the function of integrating instruments
requiring custom drivers. At the moment, one monitoring instrument was in the process of being integrated, but the person tasked with the integration was at the end of
his contract and had no time to define a process of integration. Thus the secondary
objective was to document a process of integration specifically for REMUS that could
also work as a reference for new members of the team.
8
2 REMUS
2.1 WinCC Open Architecture
SIMATIC WinCC Open Architecture is an extremely flexible SCADA system that
allows custom tailored SCADA solutions to be produced fairly quickly [8, 9]. The
product used to be called PVSS (Prozeß-Visualisierungs- und Steuerungssystem) but
after ETM got acquired and became a subsidiary of Siemens AG, PVSS was integrated
to the SIMATIC HMI family and was renamed WinCC OA to simplify international
marketing [2]. In this thesis, the terms WinCC OA and PVSS are used interchangeably.
For some time, CERN has used WinCC OA as the basis of their supervisory control
and data acquisition systems, for which the EN ICE group has created the JCOP framework. By providing a higher level of abstraction, the framework reduces the development effort and the required resources for maintenance. The framework provides tools
for structured device creation, CERN user authentication, database integration and additional support for common industrial application layer communication protocols. [8]
Being built on WinCC OA, it has inherited some of the design decisions and is easily
customizable for individual use cases. In addition the framework’s modular nature allows projects to use only what is needed, thus creating faster and sleeker systems.
A WinCC OA application consists of several processes that are called managers. These
managers are used to handle user interfaces, the internal database and communication.
A single manager called the event manager is responsible for data flow between all
other managers, including all client user interfaces, and for the synchronization of data
between redundant servers. The event manager can become a major bottleneck as it is
single threaded [3, 4, 22]. It is possible to run multiple instances of the event manager,
even on separate servers to split the load. However the events must eventually be synchronized to the main event manager, thus only delaying the problem. It is wise to
keep this in mind when designing and developing software with WinCC OA.
There are three major ways of extending WinCC OA. Simplest are the interpreted
scripts written in CONTROL, WinCC OA’s internal scripting language. CONTROL
9
is quite limited as a language, but it is sufficient for simpler tasks such as manipulating
data point element values. In combination with the built-in drivers, they can be used
for communicating with equipment, but mostly they are restricted to handling user
interfaces and running high level background tasks.
Illustration 1. Data flow with custom manager and an inbuilt driver
WinCC OA drivers are complex managers that, instead of being built with CONTROL
scripting language, are fully fledged C++ programs leveraging WinCC OA API [3].
Their main purposes are implementing a specific protocol, low level filtering, data
transformation, conversion and smoothing [23]. On REMUS we have offloaded some
other functionality to them, including the writing of injection files, alarm generation,
and the data acquisition logic. Data between the event manager and the drivers flow
directly through API function calls, eliminating some overhead.
10
Illustration 2. Dataflow with custom driver
In addition it is possible to build so called API managers which fall in between. They
are lighter than drivers, but still much more complex to write than CONTROL scripts
[3]. The API managers have not been used in REMUS so far and will not be covered
here.
The database manager mentioned on the above illustrations is a complex but internal
manager that handles the application's internal database. The database consists of a
collection of so called data point elements that hold values and their corresponding
metadata such as addressing and connected functions. [3] This database should not be
confused with the external database used for long term data archival. The internal database suffers from severe limitations due to the way it has been implemented. Each
data point has an associated identifier, a running number that is incremented on each
data point creation. Deleted identifiers are not automatically recycled, but manual reuse has been necessary in REMUS as the maximum identifier number is fairly limited.
In any case, creation and deletion of data points is not fast and should be avoided.
REMUS keeps a local copy of some of its database’s tables to ensure smooth operation
during outages. To do this a pool of data points is used and reused, and a similar strategy is advised to avoid unnecessary deletion and creation of data points.
2.2 REMUS SCADA system
The REMUS software package consists of the base WinCC OA installation with a
customized JCOP framework, a plethora of panels, scripts, managers and drivers, and
an Oracle database.
11
Illustration 3. REMUS Architecture
In the REMUS SCADA system the representation of each monitoring unit is split to
three parts; the monitoring station, the devices and the channels. The unit as a whole
is monitoring system or MS for short. A monitoring station encapsulates the devices
and channels that make up that unit. A channel is a channel of measurement. It is an
identifier that is used to store and map the events and measured values to their corresponding monitoring stations, devices and locations. A device is an actual, physical
device. It may be the main monitoring device, or a sub device such as a detector. A
monitoring system may have an arbitrary amount of sub devices and channels. In the
below illustration one can see a possible structure of a monitoring station entity.
12
Illustration 4. Possible structure of a monitoring station
While WinCC OA provides a user interface for declaring data point types, that approach is not recommended [8]. Part of REMUS is the Oracle database that holds a
record of the structure for each monitoring station type. This structure is used when
creating new instances of that type. Each individual instance of a monitoring station
type is then declared on the database to track changes to its configuration and events.
[21]
Injection of data to the database is done either directly from WinCC OA or from injection files. In general events relating to user interactions such as requesting monitoring station mode and parameterizations have their events along with data injected directly to the database. Events and measurements acquired from devices can come in
bursts or in quick succession exceeding the limitations of what a SCADA system can
inject to the database [6] and are written to files. These files are then injected to the
database with SQL*Loader once a minute [20]. The approach allows for batch insertion of data from multiple different sources and provides much better efficiency. This
method of database injection was created for the previous, outsourced SCADA system
and was extended for our purposes with only minor modifications.
13
2.3 REMUS Finite State Machine
The REMUS Finite State Machine (FSM) is used to track the state of each monitoring
station as well as to trigger functions [30]. As REMUS can be accessed by multiple
users at the same time, it was necessary to create a system to track the state of each
device. Tracking the state allowed us to avoid problems that could rise from simultaneous operations. The FSM is a not a piece of software per se, but rather a specification
of what state should the monitoring station report in any situation. Not all of the FSM
states are implemented by every integration, but for those that are, the specification
must be followed. The states of the FSM are unique, meaning that no two numbers
should indicate the same state. The only exception are 4 and 16, which both indicate
request error. This is due to historical reasons, as one device type that has been integrated may respond with either one. When implementing the FSM, number 4 should
be used to indicate the request error state.
Illustration 5. REMUS Finite State Machine
The task of keeping the FSM in the correct state at all times is left to the developer.
Commonly the state is changed directly, but certain events such as change in the monitoring station mode can have the side effect of changing the finite machine state. For
example, the ‘Initialization’ (128) state is only allowed if the monitoring station is in
either ‘Silent’ or ‘Off’ mode and setting the mode to anything else will set the state to
0, or ‘End’. Conversely setting the mode to ‘Silent’ or ‘Off’ will set the state to ‘Initialization’ as that is the only action possible in these modes. Further details on the
REMUS FSM can be found in the REMUS Finite State Machine document on EDMS
[30], and will not be discussed here.
14
3 RESEARCH METHODS
The research methods used vary from field to field and depend on the questions to be
answered. The two main methods used in scientific research are quantitative and qualitative research. They are based in evidence and are thus part of what is called the
empirical research method. Though starkly different, they are commonly used hand in
hand as large amounts of qualitative work is often required for the quantification of
phenomena. [32]
Qualitative method is used in many different fields. The aim may vary depending on
the person or group utilizing the method, but in general it investigates the why and
how of phenomena. It is often used to define hypotheses as it provides information
only on the case studied, in contrast to quantitative methods that may find connections
in data pertaining to cases not specifically included in the research. In scientific research, data is often gathered with observation, interviews, reflexive journals and analysis of document and materials. [33]
Quantitative research investigates phenomena using statistical, mathematical or computational techniques. It tries to find connections between observations, and can be
used to prove or disprove hypothesis created using qualitative research. Though measurement is commonly stated as central to the quantitative research, it is accepted that
it can’t be used as its sole basis. [32] Use of both qualitative and quantitative methods
may provide more accurate results. Quantitatively produced conclusions can be better
understood using qualitative methods, while quantitative methods can be used to produce precise and testable expressions of qualitative ideas. [34]
In software projects, both qualitative and quantitative methods are used. A recent development has been the growing popularity of a user centric approach that includes the
end users in the project from the very beginning. The approach strives to identify the
wants, needs and limitations of the end users that are then given extensive attention
throughout the design and development process. [36] The users may be interviewed or
asked to do self-documentation. Action research is done to identify the actions taken
by users to achieve their day to day goals. In addition continuous feedback is given by
15
the users throughout the project in the form of validation and testing. [35] Such an
approach is often necessary as the developers are commonly not the end users of the
product, making it difficult for them to intuitively foresee what are the end requirements and constraints. User-centered design lends itself well for software development
when the end users are well defined, as is the case for REMUS.
16
4 THE INTEGRATION PROCEDURE
Illustration 6. Device integration process
The process of device integration follows a fairly straight forward pattern. Once the
device has been chosen by the stakeholders, it is their responsibility to produce a requirements specification documenting the constraints, required functionality and the
user interface. With the requirements and device’s documentation in hand a feasibility
analysis is made to match the required with the possible. After the proposal has been
validated by the stakeholders, a technical specification is written to document the functional and architectural design. A specification of the final user interface is made which
must also be validated by the stakeholders. Once development has finished, a user
manual is created to help users navigate the system. A test procedure is created to
verify that the end product is working as expected. This procedure is executed repeatedly, first by the developers, then by an impartial member of the team, until the product
passes with no remarks. Same procedure is then followed by the users to validate the
product for deployment. Users may add new test cases as seen necessary, and this
phase can easily take a couple of months. Once the product has been validated, it will
be deployed to production in the next scheduled production push.
At all phases of the integration, as well as in the maintenance phase, it is very important
to maintain frequent communication with the users so as to really understand what the
users want and expect. This can either make or break the whole project. In addition a
17
technical contacts with the instruments manufacturer and the company developing the
firmware can be extremely valuable and should be sought after.
4.1 User requirements
The stakeholders must provide a document specifying their functional requirements
and constraints. Usually this is simply a listing of the devices functionality, with the
added details on functionality that they would like to have implemented on top.
The devices might implement a large array of functions, but some of these will not
make sense to be available remotely and for simplicity’s sake some expert functions
should be restricted to local modification. If a function is only used when the device is
initially installed, it makes little sense to provide a way to change it remotely. In addition, as parameterization should check for data compliancy, the ranges of valid parameter values must also be specified.
Monitoring stations generate measurements at varying frequencies from once every
few minutes to every 100 milliseconds [6], and aside from special circumstances such
as exceeded alarm thresholds, these values can be averaged to save space after they
lose their pertinence. In addition, the everyday usage of the system and devices can
generate huge amounts of data, especially considering effects of scaling from one device to possibly hundreds or thousands of devices. Aside from few special events, such
as alarms, most of them lose their value in a matter of years quickly and should not be
retained longer than necessary. This point can be particularly hard to drive through to
the stakeholders, but for the long term performance and cost efficiency it is very important.
In addition a separate user interface specification can be created. Sometimes it can be
sufficient to include the UI drafts in the user requirements specification, but should the
integration introduce multiple new panels or differ from the norm, a separate document
may be useful. This specification should document the expected user interface and the
experience of using it. This includes such things as the colours of status indicators in
18
their various states, the format of numbers and dates, etc. REMUS has a colour coding
system for these indicators [15], which should be followed, but on certain indicators it
can be necessary to deviate from strictly following it, if only to reduce ambiguity in
the specific case.
4.2 Analysis
From the user requirements, the device’s manual and communication document; a feasibility analysis document is made to match the requirements with what is possible. In
addition to the limitations and functionalities stated in the documents, the device must
go through a strict analysis. Very often the limitations stated on manuals refer to an
R&D environment with a single device and minimal outside elements. While the documentation of the device and its communication protocol are invaluable in understanding the functionality and the limitations of the device, they should not be trusted
blindly. These documents very often takes a backseat during development, and is only
created and updated almost as an afterthought, leaving room for outdated and sometimes downright false information.
During the analysis every function remotely available must be tested with both valid
and invalid data. To make this testing faster, it can be useful to create a simple program
to directly communicate with the device. As some protocols require valid checksums
on messages, this might even be a necessity. This software may also be useful later on
for debugging purposes.
4.3 Technical specification
The technical specification should document in detail what will be implemented and
how it ties into the existing system. Any functionality that adds to, or diverges from
prior integrations must be documented, as well as any functionality supported by the
device that is not going to be supported. For an example, an instrument might support
19
the measurement units becquerel and curie. REMUS has been built in a way that it is
simple to add support for new measurement units, but as NIST actively discourages
the use of non-SI units [5], support for curies can be safely dropped. Another example
would be the device modes. At the time of writing REMUS supports nine modes.
These are Off, Measure, Test, Simulation, Maintenance, Calibration, Without Mode,
Silent and Degraded. However, one would be hard pressed to find any device supporting all of these modes, and even in that case, they would doubtfully call them by the
same names. Thus the document must specify which device mode maps to which
REMUS mode, and in addition what is the expected functionality in that state. For
some devices maintenance mode may simply mean that the measurements are tagged
with the mode maintenance, but others might not even do measurement in this mode.
Similar details may come up with other modes too, especially on ones artificially introduced. This is an important detail and must not be forgotten.
In its appendices the document must include sequence diagrams of all complex functions, such as the acquisition of historical measurement data and alarms. Similarly a
full list of data point elements with their data type, addressing string and their purpose
has to be included. If the list of data point elements grows too big, it may be exported
to a separate document and referenced on the technical specification. A separate document also makes it easier to add more details about the data point elements, such as
the direction of data flow to the element, and the end points of data held within. It can
be useful to know if the value originates from the driver or the device, and whether it
is stored in the database or not.
4.4 Device type design
Devices in WinCC OA are represented as instances of data point types. REMUS makes
use of JCOP frameworks template data point type creation process and the structure of
each device type is stored in the REMUS database. The details of these structures can
be refreshed from a special panel created for this purpose. The design consists of multiple levels. It details the amount of channels and sub devices that can be associated
with the device, as well restricts the types of devices that can act as sub devices. In
20
addition, it has the full structure of data point elements and the alarms related to this
device type. Certain data points are grouped together under descriptive directories. The
data points pertaining to the whole device are under directory GLB, while the channel
specific data points are grouped under CHN where N indicates the channel number,
starting from one. Furthermore, these directories have sub directories grouping data
points for configuration, parameterization, and measurements under the directories
Configuration, Parameters, and Measurements, respectfully. [18]
In addition to the data point elements uniquely required by different types of devices,
certain data points are necessary for the operation of REMUS. These included the data
points for the monitoring station name and its identifier, as well as the names and the
identifiers of the channels attached. Data points for user name and station id, as well
as date are necessary to track configuration, parameterization and control operations
[7].
Functions can be bound to data points to do statistical operations on the data held or to
dynamically call other functions. These statistical functions are limited to internal
CONTROL functions, and cannot dynamically receive values from other data points.
The function itself is written inline on the SQL statement, as opposed to dynamic function callbacks where just the name of the function is defined in the database. Dynamically called functions can be anything from internal functions to user created functions. These dynamic callbacks aren’t as efficient as inline data point functions, but
allow complex functions to be executed from unsolicited driver messages.
4.5 Driver design
Each driver must be specified in the REMUS database, much in the similar manner as
with device types, though their definitions are usually much shorter due to having less
data points and alarms.
The drivers communicate between the event manager and the devices. This is done by
passing HWObjects with derived classes inherited from the WinCC OA API library.
21
Changes to the data points with addressing to the driver will arrive as calls to the function HWService::writeData() [23] which must be implemented in the driver to receive
them. By calling HWDrvManager::toDP() the driver can pass data to data points. [3]
It should be noted that while it’s possible to write multithreaded drivers, the PVSS
libraries are not multi-thread safe. [23] Driver designs must be made with this limitation in mind. In addition there are functions in the WinCC OA library that can be used
to query singular data point elements, but these are not as efficient or thread safe, and
are not used in REMUS.
All data in PVSS passes through the event manager, including data between other
managers, the UI and the drivers. Calls to these functions should be restricted to the
bare minimum to prevent congestion. This means limiting data point updates to only
when their values have changed and for initialization purposes. The Event manager
will periodically call function HWService::workProc(). This should happen every
10ms, but the timing is done by a dispatch call which can also suffer from congestion
leading to variance of up to multiple seconds [3]. During this call the driver has the
attention of the Event manager and it is safe to pass data to the event manager with the
HWDrvManager::toDP() function.
Illustration 7. API – Driver communication
22
HWObject is a WinCC OA API library class holding the data to be passed, as well as
the information necessary to identify it. REMUS makes extensive use of the address
property. Specified in the device type’s data point elements, it holds both a numerical
identifier for the monitoring station and a textual identifier for the data point. For driver
wide data points the numerical identifier is left to zero.
Illustration 8. Simplified HWObject class elements
HWObjects pass through transformation before arriving to the driver and after being
sent to the event manager. A transformation is a custom class used to transform data
from hardware format to WinCC OA data point element types and vice versa. On
REMUS much of the measurement and event analysis is done by the driver and data
is not directly passed to devices. Instead all data points are considered internal to the
driver and thus the transformations are actually to and from C++ types. These transformations must be implemented for each type of data received and sent from the
driver to the event manager. It is possible to have multiple values sub indexed on one
address, but the number of elements must be same for all data points using the transformation. Should one not declare the amount of sub-indexed elements, API will try
to free the same memory multiple times resulting in undefined behavior. Notably this
will not crash the driver until the sixth element.
Every WinCC OA component, including the drivers, work in full redundancy on
REMUS. During normal operation the event managers of both servers will keep their
data points synchronized and consistent. Should one of the servers go down, either
abruptly or for planned maintenance, the other will take over, seamlessly continuing
from where the first left off. Data point updates are not communicated to the redundant
driver during normal operation and when a redundancy switch occurs, the driver must
be notified of the current values. The values must be updated on the driver but should
23
not be propagated to the device. This is much the same as in the initialization and it is
customary to use the ‘initializing’ FSM state during this process. If the REMUS FSM
is used, great care must be taken to send the parameters in an order that would not
disturb its state.
4.6 User Interface
The user interfaces of all REMUS integrations follow the same format [15]. On the
left hand side of the user interface there is a faceplate showing real time values and
state of the device. The faceplate also has buttons for defining, configuring, parameterizing and commanding the device. The layout of the state indicators and values is
specified by the users, but that is as far as they have power over it. The format of
configuration and parameterization panels depend on the amount of parameters, and
the maximum number of sub-devices and channels associated to the device type. Inspiration for these panels should be taken from the previous integrations, with the top
of the panel holding metadata and controls for requesting historical configurations and
parameterizations. Bottom of the panel then holds controls for applying, refreshing
and clearing the values on the panel. In addition a Retrieve button may be present in
the bottom, to request latest values from the device. By keeping the experience consistent, less user training will be required and the overall user experience will be better.
24
Illustration 9. REMUS User Interface
The User Interface Specification must document the general appearance, explain the
meaning of each element, states of each state indicator and the purpose of each button.
While the user interface will see many changes throughout the project and this document will go through multiple iterations, an initial validation should be received from
users before any real work on the user interface is undertaken. This validation is an
insurance against users suddenly changing their minds later on in the project.
4.7 Development
The development phase of any integration will depend on the device, specifications
and the designs made, but some general advice may be given.
When connecting data points to callback functions, data points that change rapidly
should have their separate connection. The function WinCC OA uses to get data point
values can cause serious performance problems and any update to a data point that is
connected to a function will trigger an internal function to get the values of all the other
25
data points connected to the same function. Furthermore, if the function is called again
before the previous operation has finished, the operation is added to a queue. If the
frequency of these calls is higher than what can be processed, the queue will keep
growing and with it the consumed memory. Once maximum queue size is reached, a
portion of queued calls will be dropped, leaving only the newest entries. [27]
At the end of development a user manual is prepared documenting how to access the
functionalities provided by the product. A major part of this manual are the procedures
how to install new devices of this type to REMUS, including the initial settings on the
device and its communication module, if one exists, to ensure proper functioning of
the devices. For most parts the manual is consistent with other integrations, and this is
by design. Every integration should have the same flow, look and feel as the others, so
that the user experience is consistent throughout REMUS.
It is very important to keep the code well commented and documentation up to date,
and the importance of this is magnified at CERN with the extremely short contracts
and high employee turnover. As the task of device integration is often given to a student, creating minute and accurate documentation is especially important.
4.8 Testing and validation
To ensure the quality of the product a rigorous test procedure is created and followed.
The tests must be executable with no external programs so that users can perform them,
provided they have the correct access rights. The tests should cover all of the requested
functionality, ensuring data validity, and that alarms, faults and events are working
correctly. It should be noted that slight variation will occur between the values stored
on device, the driver, in the injection files, the database and displayed on the faceplates.
This is due the differences in manner of storage of floating point numbers. How each
device stores and transmits measurements, varies wildly and is out of our control. On
the drivers, the values are stored as 64 bit double precision floating point numbers, but
when they are sent to the event manager they must be cast to 32 bits, as WinCC OA
does not support 64 bit floating point numbers. Similarly when the measurements are
26
written to the injection files, only six significant figures are kept. In addition, the procedure must test for product robustness; that is how it will react in case of excessive
load, networking issues and server crashes. While CERN infrastructure is very stable,
some problems with communication do happen. Routers crash and supposedly routine
maintenance from IT can have disastrous side effect. The end product must be able to
withstand these situations without losing data or producing fallacious alarms or faults.
Having been tested by the developers the product must be tested by someone with little
to no prior involvement to the project. After working on the product for an extended
amount of time, it is easy to use the device and the software in the intended way, but
it is important to also test how it behaves when one does not follow the expected pattern.
After the product has passed the test procedure with no remarks it must be validated
by the users. Prior to the product validation process, the test procedure should be validated with the stakeholders, as they may want to add some test cases to it. This process
takes a long time as they will have much less experience with REMUS.
4.9 Deployment and maintenance
Once the product is ready and it has been validated by the users, the code is frozen and
the version number is incremented to 1.0.0. On REMUS the versioning scheme the
first number is dedicated to the initial release and massive overhauls, second number
for new features and last one for minor patches and bug fixes. Until the product is
deployed the binary should be frozen to this version. The full process of deployment
is covered fully elsewhere [17] and is outside the scope of this thesis.
27
5 INTEGRATING BERTHOLD LB 112 MICRO-GAMMA LOGGER
The Berthold Technologies’ LB112 Micro-Gamma logger is a radiation monitor, logger and alarm unit all in one. Up to two radiation detectors, either probes or radiation
chambers can be connected to it. The device has an inbuilt MOXA modem and can be
communicated with by serial over TCP/IP [16]. This device had been in use at CERN
for some time but it had not been integrated to the previous unified supervisory system.
It was the second device to be integrated to REMUS.
5.1 Analysis
Unfortunately in the case of LB 112 the users had not prepared any documents for us,
and due to time constraints they were created by the team itself. One month was spent
getting comfortable with the device. Users of the current software were then approached to acquire real life use cases. So far they had used MEVIS, the remote control
and data acquisition software provided by Berthold, but due to the constant connectivity problems and the confusing user interface, they had often opted for local intervention instead. [29] This meant that there was effectively no log of parameterization
changes or the users responsible for them. This also meant that the users had not gotten
used to the functionality provided by MEVIS and removing unnecessary and dangerous functionality was fairly easy.
During the analysis and the formation of requirements and the technical specification,
multiple mistakes were found on the device’s documentation. To quickly asses the
actual constraints and responsiveness of the device, a java class was created. Developing this software helped us get better acquainted with the protocol, and the tool was
also useful in later stages of the development for testing the product and for debugging
the devices. During these tests we found additional limitations and some lacking constraints on the device. Values received by the device were not sanitized in any way and
variables expecting numbers could be passed character values instead, thus bypassing
28
the naïve range limitations [25]. The device also showed reduced responsiveness under
active communication, leading to its internal clock losing time. [24]
5.2 Technical documentation
The Berthold LB 112 stores its measurements in a circular queue that is capable of
holding up to 4000 entries. These entries are ASCII encoded strings holding a time
stamp, device status at the time of measurement and both raw and integrated measurement values and their respective units from both probes. Access to the queue happens
through an iterator allowing requesting the value of the current entry, and moving
backwards and forwards, one measurement at a time. [16] If the queue is full new
entries will overwrite the oldest ones and the iterator will be moved to the next one.
However, if the act of reading an entry from the device happens at the exact same time
as a new measurement is stored, the iterator will not be moved, and if the queue is full,
the iterator will fall behind the latest entry, effectively losing all 4000 measurements
in between [24]. To minimize the chance of this happening, it was decided to limit the
maximum frequency of measurements to once per sixty seconds. This limit also meant
that the 4000 entries now covered over two days and 18 hours of measurements,
providing a pleasant buffer.
Although the device itself does not support modes, it was decided that three artificial
modes were to be implemented on driver level. The driver would support measurement
mode as the regular working mode, maintenance mode, and silent mode that would be
used to simulate off mode and prevent any data collection including measurements,
alarms or faults. [24] This would effectively leave the device in a standalone mode,
and would allow swapping of devices without leaving fault events in the logs.
With REMUS the measurement data and events would now be stored in the unified
monitoring database along with data from all the other device types. LB112 supports
a wide array of measurement units, among which are mrem/h (milliroentgen equivalent in man per hour) and pCi/m3 (picocuries per cubic meter) [16, 28]. Support for
these two historical units was dropped as adding them to the supported units would
29
have made little sense. On LB112 this ‘unit’ is really just a tag as the actual end unit
depends on the calibration factor. The raw measurements are made with counts per
second and the users must apply specific calibration factors to convert from cps to say
µSv/h. These calibration factors depend on the instrument itself and on the type of
radiation measured. The unit must still be known and supported so that the measured
valued can be stored in a meaningful format, and to allow further conversion and calculations.
5.3 Driver and UI design
Inspiration for the driver design was taken from an older driver created for another
device. For each monitoring station the driver would create an instance of a monitoring
station class, and a thread running an infinite control and acquisition loop. The monitoring station class would hold measurement data and parameters held in data points,
and the corresponding values held in the device to detect inconsistencies and to reduce
unnecessary data transfer. The control and acquisition loop would read measurements
and write commands to the device.
A number of reader classes were created to extract and transform values received from
the device. Once a message was acquired from the device by the acquisition loop, the
buffer would be passed to a reader factory. The factory would recognize the type of
message by matching a part of it to known message types, and then returning the appropriate reader, with the message already fed to it. The reader would be then used to
get the actual values received and to store them in the correct variables on the driver.
Along with the data, these readers would hold addressing metadata to route the values
to the correct data points, and after being fully analyzed, the readers themselves would
be fed to an auxiliary function that would extract this information and pass the resulting
data to be sent to the event manager. The multithreaded nature of the driver, in contrast
to the single threaded API calls required the addition of auxiliary functions and static
buffers. Data to be sent to data points was stored in a static queue from which one entry
would be passed to the event manager each time it would call workProc().
30
As with previous drivers, measurements and events acquired or generated by the driver
would be written to injection files. Another static queue was created to which each
individual thread would add entries. Then a file writer loop was created that would get
new entries from this queue, and would write them to files. The task of injecting them
to the database is delegated to a cron job running SQL*Loader as before. The below
architecture guaranteed better communication with the API and the file system.
Illustration 10. Threads
As the users had not provided us a draft of the user interface, inspiration was once
again taken from a previous integration. The user interface went through multiple iterations of minor changes, as users requested elements to be moved around. Finally an
agreement was reached and work could start.
5.4 Development
During the analysis we had gotten very familiar with the device and subsequently there
were very few surprises during the development. Some additional idiosyncrasies were
found on the communication protocol, requiring additional constraints and safeguards
to be added [25]. To gain more control over the driver state, the LB112 integration
implemented a sort of a finite state machine [24]. This FSM has evolved to the REMUS
Finite State Machine mentioned in the prior chapters.
31
LB 112 uses serial communication wrapped in TCP/IP packages, with the encapsulation being done by a MOXA modem. Communication is half-duplex, with the device
requiring about 200 milliseconds delay between messages. Message collisions were
not of much concern on earlier firmware, but later versions exhibited lockdowns requiring local intervention. At CERN these are not always possible. While active, certain areas of the complex can have high levels of radiation, rapidly fluctuating magnetic fields or temperatures near absolute zero. The control and acquisition loop was
redesigned during the development to minimize the chance of collisions, on the expense of responsiveness.
In the later phases of the development it became evident that parts of the driver were
less than easy to modify. Simple addition of a device variable required changes in no
less than six places in the driver. As the number of variables grew, making all these
changes became more and more complex as each additional variable would cause multiple cascading effects. Creating a procedure for these changes made it obvious that
something had to be done, though it was too late for this project. It was decided that a
more generic driver would be created, with the express purpose of simplifying modifications. This lead to the template driver project, which has been used in all later integrations requiring custom drivers.
5.5 Testing and Deployment
While internal testing was fast, it was difficult to get the users to take time of their
schedules to validate the product. To emphasize the importance of their involvement
we had to offer the test procedure as the final chance to make requests and changes.
After deployment any and all changes would be released with respect to the release
cycle of the entire monitoring system and would not have the same priority as the
integration of new devices. In the end the product was accepted with little to very few
changes necessary, and on time. [26]
32
5.6 Maintenance
Later on a problem was found when a new batch of LB 112 devices was delivered to
CERN. This batch had a different wiring order for the relays used to control the alarm
unit. On MEVIS setting up relay triggers happened simply by relay number, but on
REMUS it was assumed that the relays would always be configured in the same order
for the horn, the interlock and the three different colored lights. Unfortunately it was
not possible to make a complaint, as the wiring order had not been stipulated on the
contract. Prior wiring problems had not been noticed as a representative from the company had always done the trigger configuration on MEVIS after the devices had been
installed, adjusting them according to the wiring of each device. It was decided that
the wiring should be standardized and the expected mapping was then documented on
the REMUS LB 112 User Manual’s appendix on setting up the device for integration.
[28]
In an effort to unify the devices, the radiation protection group gradually started to
update all of the devices to the new firmware. The communication problems caused
event logs to be flooded with faults, and for a year, continuous efforts were made to
reduce them by working around the new limitations, and by increasing fault thresholds,
thus masking shorter communication outages. In the end all devices were reverted to
the previous version of the firmware as the problems exhibited far outweighed the
benefits.
33
6 CONCLUSIONS
The purpose of this project was to investigate the process of monitoring instrumentation integration to the REMUS SCADA system, taking a broad view of the necessary
steps and common pit-falls. The integration of one such instrument gave in depth view
of the process and the challenges involved with interfacing with monitoring equipment.
By encouraging user participation, the project was finished on time and with minimal
change requests. The methodologies used were sound, and played an essential role in
the project’s success. No surprises were experienced in the final validation phase as
the users had been continuously involved with the project. Without their involvement
the testing and validation phase could have dragged on for much longer, as possibly
drastic modification would have been postponed until then. The users have felt at home
in the new SCADA system, leading to a sharp decline in the amount of support requests. Prior to the integration it would not be uncommon for the section to receive
calls from the users, requesting help in navigating the other systems. This can be attributed to the more intuitive user experience that was achieved by letting the users
participate in the design process.
One major problem encountered was the lack of responsiveness of the devices. The
lifetime of monitoring equipment can be up to multiple decades. A class of equipment
called ARCON that was designed and created at CERN in the 80’s is still in active use,
and has been integrated to the previous SCADA systems [6, 14]. These are not the
only legacy systems still in use, and most monitoring instruments are still not created
with remote control or continuous data acquisition in mind. It is common to utilize a
legacy industrial bus such as RS232, RS485 or Modbus [12] and then bridge it to
Ethernet with a converter [13]. This severely limits the speed and robustness of communication with these devices, adds an additional point of failure and requires consideration when designing communication with devices.
Remus was created from ground up with the purpose of empowering trusted users by
letting them add devices and create new views; tasks which had previously been left
34
to system administrators. Delegating some of the administrative tasks to trusted end
users meant that the team could concentrate on the integration of other equipment and
in the general improvement of the software. However, the users lacking understanding
of the limitations of the system ended up creating some unexpected views consisting
of unforeseen amounts of devices. While the event manager is very stable even under
extreme stress [11], the increased amount of devices and the rising amount of simultaneous users caused increasingly poorer performance as the callback functions started
to get queued up. This has required us to frequently revisit the software in an effort to
increase performance. A few different approaches have been tried, including low level
comparison and caching in different stages to reduce unnecessary communication, and
separation of volatile variables to separate function calls. These findings will be presented at ICALEPCS 2015.
The external process of injecting measurements and events to database from temporary
files was recycled from the previous SCADA system, which foresaw the possible problems of drivers interfacing with the database directly. The first few devices integrated
to REMUS produced measurements at a fairly low frequency, once every minute or
two, and for these a single threaded file writer was more than sufficient. Later integrations have included devices generating measurements at much faster rates, up to one
measurement every 0.1 seconds. With a rate as high as this, additional bottlenecks will
require consideration. In addition to the aforementioned limitations of the event manager, the disk I/O might not always be able to keep up with the incoming flood of data.
This development will require additional buffers, and possibly monitoring station specific file writing threads. In any case, changes in the file writing scheme are to be
expected.
Integration of LB112 was done with the intent of supporting just that device type, and
while the specialized code used was fast to write and easy to test, later modifications
were difficult, and subsequently very little code could be recycled to later projects.
The problems faced nearing the completion of development gave inspiration to the
REMUS template project, which has helped shorten integration times. This can be seen
in the evolution of project timelines as a student is now able to integrate two to three
devices per year as opposed to being limited to one. The templates created range from
CONTROL scripts for common panels, to a generic driver that can be easily extended
35
to support most any type of device [31]. In addition, detailed procedures were created
for each step of the integration, where possible. These templates and procedures have
significantly eased the learning curve for new members of the team, making them productive much faster.
REMUS has been shown to be very adaptable, and with the in-house development and
maintenance effort, all the problems encountered, including scalability, have been
quickly resolved. Working closely with the end users has allowed us to integrate devices at much faster pace and to the user’s satisfaction. As REMUS itself has matured,
so has the integration process. The documents and procedures, in addition to the templates provide a straight forward path to follow, with few unknowns. Roadblocks and
surprises are still encountered, but they are limited mostly to the devices themselves.
The process allows for quick and predictable integration of various types, making it
possible for technical students, who are usually employed for one year, to do at least
two integrations of different devices, thus providing them with a broad experience in
the area of SCADA systems and monitoring equipment.
36
7 END NOTES
A big part of the thesis was the actual integration of Berthold Technologies’ LB 112
monitoring instrument. The documentation, the test results and the source code are
available on request, but for liability and security reasons the requests must go through
CERN Technology Transfer.
Similarly additional details on each step of the integration procedure from analysis to
deployment is available on CERN EDMS document sharing system under the REMUS
project documents.
37
REREFENCES
[1]
S. Kleiner 2001. Monitoring of Non-Radiation Environmental Parameters at
CERN. Geneva, Switzerland. CERN
[2]
ETM WWW-page 2014. Referred 03.11.2014. http://www.etm.at/
[3]
Herve Milcent & Paul Burkimsher & Wayne Salter 2003. How do I write a
Driver? Ctrl Managers, API Managers and Drivers. CERN. Referred
03.11.2014. CERN EN Department Knowledge Base
[4]
The LHCb collaboration WWW-page 2014. PVSS Introduction for Newcomers. Referred 03.11.2014. http://lhcb-online.web.cern.ch/lhcbonline/ecs/PVSSIntro.htm
[5]
Ambler Thompson & Barry N. Taylor 2008. NIST Special Publication 811
[6]
G. Segura Millan & D. Perrin & L. Scibile 2005. RAMSES: The LHC Radiation Monitoring System for the Environment and Safety. Geneva, Switzerland.
CERN
[7]
A. Daneels & W. Salter 1999. What is SCADA?. Geneva, Switzeland. CERN
[8]
O. Holme et al 2005. The JCOP framework. Geneva, Switzerland. CERN
[9]
W. Mexner et al 2008. Experiences with PVSS II as an overall SCADA system
for ANKA. Karlsruhe, Germany. Forschungzentrum Karlsruhe
[10] A. Di Meglio, M. Gaillard, A. Purcell 2014. CERN openlab Whitepaper on Future IT Challenges in Scientific Research. Geneva, Switzerland. CERN
[11] P.C. Burkimsher 2005. Scaling up PVSS. Geneva, Switzerland. CERN
[12] M. Lechman et al 2013. Managing Infrastructure in the ALICE Detector Control System. Geneva, Switzerland. CERN
[13] B. Galloway & G. Hancke 2012. Introduction to Industrial Control Networks.
IEEE Communication Surveys and Tutorials.
38
[14] D. Forkel et al 2009. ARCON/RAMSES: Current Status and Operational Risk.
Geneva, Switzerland. CERN
[15] G. Segura & A. Ledeul 2013. REMUS – User Interface Principles and Conventions. https://edms.cern.ch/document/1283589/
[16] Berthold Technologies 2009. LB 112 Micro-Gamma Two-Channel Data-Logger Manual. Switzerland
[17] R-P. Silvola & A. Ledeul 2015. How To: Migrate REMUS to a new version.
https://edms.cern.ch/document/1491499/
[18] Adrien Ledeul 2015. How To: Create new REMUS Device Type.
https://edms.cern.ch/document/1290009/
[19] G. Segura & A. Ledeul 2013. REMUS Project Proposal.
https://edms.cern.ch/document/1290748/
[20] G. Segura & R-P Silvola 2015. REMUS Database Data Injection.
https://edms.cern.ch/document/1327197/
[21] G. Segura & N. Jacinto & K. Szkudlarek & A. Ledeul 2012. REMUS Database.
https://edms.cern.ch/document/1274246/
[22] A. Ledeul & G. Segura 2014. Radiation and Environment Supervision @
CERN. https://edms.cern.ch/document/1438380/
[23] ETM 2010. PVSS Driver Development.
[24] Riku-Pekka Silvola 2013. LB112 REMUS Integration – Technical Specification. https://edms.cern.ch/document/1276649/
[25] Riku-Pekka Silvola 2013. On LB112 Commands.
https://edms.cern.ch/document/1276650/
[26] A. Dorsival & M. Widorski 2013. LB112 REMUS Integration – Reception by
Users. https://edms.cern.ch/document/1314681/
[27] ETM 2013. PVSS Online Help.
39
[28] Riku-Pekka Silvola 2013. REMUS LB112 User Manual.
https://edms.cern.ch/document/1303340/
[29] Riku-Pekka Silvola 2013. Project Definition and User Requirements of LB112
into REMUS. https://edms.cern.ch/document/1304938/
[30] Riku-Pekka Silvola 2014. REMUS Finite State Machine.
https://edms.cern.ch/document/1410643/
[31] Riku-Pekka Silvola 2014. REMUS Template Driver Technical Specification.
https://edms.cern.ch/document/1424954/
[32] Thomas Kuhn 1961. The Function of Measurement in Modern Physical Science. Chicago, The United States of America. The University of Chicago Press
[33] C. Marshall & G.B. Rossman 1998. Designing Qualitative Research. Thousand
Oaks, The United States of America. SAGE
[34] R. Diriwächter & J. Valsiner 2006. Qualitative Developmental Research Methods in Their Historical and Epistemological Contexts. Forum: Qualitative Social Research
[35] V. Kaptelinin & B. Nardi 1997. Activity Theory: Basic Concepts and Applications. CHI 97
[36] ISO 9241-210. 2010. Human-centered design for interactive systems. ISO