1
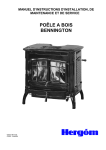
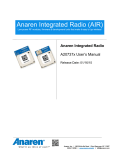
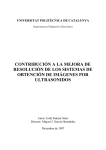
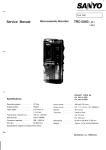
Automation Platform for Radio Spectrum Measures A Degree's Thesis Submitted to the Faculty of the Escola Tècnica d'Enginyeria de Telecomunicació de Barcelona Universitat Politècnica de Catalunya by Oriol Ros Fornells In partial fulfilment of the requirements for the degree in SCIENCE AND TELECOMMUNICATION TECHNOLOGIES ENGINEERING Advisor: Anna Umbert Juliana Barcelona, June 2014 Abstract Spectrum analyzers are one of the most powerful equipment to study radio communications systems. Nowadays, due to the expansion of these systems with the consequent growth of traffic demand it is basic to study and measure the radio spectrum to improve its efficiency of use. This is because with the current technologies it is impossible to support more users or data in the limited radio spectrum bands. In order to support these measures, it is essential to have a platform to allow configure the spectrum analyzer and automate the sample capture. In this thesis, it has been designed and developed a platform with these capabilities, which supports the spectrum analyzer R&S®FSL6. Finally, it has been validated the platform obtained, capturing frequency traces in the different ways the platform is able to do it. In conclusion, it has been obtained a complete automation platform ready to use in any project which involves the spectrum analyzer R&S®FSL6. 1 Resum Els analitzadors d’espectre són un dels equips més potents per estudiar els sistemes de comunicacions ràdio. Avui en dia, a causa de l’expansió d’aquests sistemes amb el conseqüent creixement de la demanda de trànsit és bàsic estudiar-los fent mesures de l’espectre radioelèctric per tal de millorar la seva eficiència d’ús. Això és perquè amb les tecnologies actuals resulta impossible donar servei a més usuaris o incrementar la capacitat a les limitades bandes de l’espectre radioelèctric. Per tal de realitzar aquestes mesures, és essencial disposar d’una plataforma que permeti la configuració de l’analitzador d’espectre i que automatitzi la captura de mostres. Així en aquesta tesis, s’ha dissenyat i desenvolupat una plataforma amb aquestes capacitats i que dóna suport a l’analitzador d’espectre R&S®FSL6. Finalment, s’ha validat la plataforma desenvolupada, capturant traces freqüencials amb les diferents maneres que disposa la plataforma. En conclusió, s’ha obtingut una plataforma d’automatització completa i preparada per ser utilitzada en qualsevol projecte que utilitzi l’analitzador d’espectres R&S®FSL6. 2 Resumen Los analizadores de espectro son uno de los equipos más potentes para estudiar los sistemas de comunicaciones radio. Hoy en día, debido a la expansión de estos sistemas y el consecuente crecimiento de la demanda de tráfico es básico estudiarlos haciendo medidas del espectro radioeléctrico para mejorar su eficiencia de uso. Esto es porque con las actuales tecnologías es imposible dar servicio a más usuarios o incrementar la capacidad en las limitadas bandas del espectro radioeléctrico. Para realizar estas medidas es esencial disponer de una plataforma que permita configurar el analizador de espectro y automatizar la captura de trazas. Así, en esta tesis, se ha diseñado y desarrollado una plataforma con estas capacidades que soporta el analizador R&S®FSL6. Finalmente, se ha validado la plataforma obtenida capturando trazas de frecuencia con los distintos métodos que la plataforma dispone. En conclusión, se ha obtenido una plataforma de automatización completa y lista para usar en cualquier proyecto que utilice el analizador de espectro R&S®FSL6. 3 Acknowledgements Foremost, I would like to express my sincere gratitude to my advisor professor Anna Umbert Juliana for the continuous support of my Degree's Thesis and for her motivation, enthusiasm, and immense knowledge. Her guidance helped me in all the time of developing and writing of this thesis. Also, I would like to take this time to thank the Mobile Communications Research Group (GRCM) for all of the support they were able to provide to me in order to make this thesis possible. Finally, I am so grateful to my colleague, Marc Darné, for using the automation platform in his Degree’s Thesis, to give me advice and for notify me some technical problems to fix for the final version of the platform 4 Revision history and approval record Revision Date Purpose 0 31/05/2014 Document creation 1 02/07/2014 Document revision 2 08/07/2014 Document modification 3 10/07/2014 Final document revision DOCUMENT DISTRIBUTION LIST Name e-mail Oriol Ros Fornells [email protected] Anna Umbert Juliana [email protected] Written by: Reviewed and approved by: Date 08/07/2014 Date 10/07/2014 Name Oriol Ros Fornells Name Anna Umbert Juliana Position Project Author Position Project Supervisor 5 Table of contents Abstract ............................................................................................................................ 1 Resum .............................................................................................................................. 2 Resumen .......................................................................................................................... 3 Acknowledgements .......................................................................................................... 4 Revision history and approval record ................................................................................ 5 Table of contents .............................................................................................................. 6 List of Figures ................................................................................................................... 8 1. 2. Introduction................................................................................................................ 9 1.1. Statement of purpose ......................................................................................... 9 1.2. Requirements and specifications ........................................................................ 9 1.3. Methods and procedures .................................................................................. 10 1.4. Work plan ......................................................................................................... 11 1.5. Deviations and incidences ................................................................................ 16 State of the art of the technology used or applied in this thesis................................ 17 2.1. Telecommunications systems ........................................................................... 17 2.2. Radio spectrum scarcity ................................................................................... 18 2.3. Radio spectrum government policies ................................................................ 19 2.4. State of the art of the radio technologies .......................................................... 20 2.5. A solution for spectrum scarcity ........................................................................ 22 2.6. Spectrum analyzer............................................................................................ 24 2.6.1. RF attenuator ............................................................................................ 25 2.6.2. Pre-selector or low-pass filter .................................................................... 25 2.6.3. Mixer and local oscillator (LO) ................................................................... 25 2.6.4. IF gain ....................................................................................................... 26 2.6.5. Resolution bandwidth filters ....................................................................... 27 2.6.6. Envelope detector ..................................................................................... 28 2.6.7. Detector types ........................................................................................... 28 3. Methodology / project development: ........................................................................ 29 4. Results .................................................................................................................... 34 4.1. Automation platform ......................................................................................... 34 4.2. Radio spectrum measures ................................................................................ 36 5. Budget ..................................................................................................................... 40 6. Environment Impact ................................................................................................. 41 6 7. Conclusions and future development ....................................................................... 42 Bibliography .................................................................................................................... 44 Appendices..................................................................................................................... 45 Glossary ......................................................................................................................... 46 7 List of Figures Figure 1 - Work plan diagram ......................................................................................... 11 Figure 2 - Time Plan Gantt Diagram ............................................................................... 15 Figure 3 - Global mobile traffic demand growth............................................................... 17 Figure 4 - Traffic grow per cell site and spectrum to mobile phones traffic surplus/deficit 19 Figure 5 - Smart antenna operation ................................................................................ 21 Figure 6 - Cognitive radio network operation .................................................................. 22 Figure 7 - Withe spaces in Munich COGEU database .................................................... 23 Figure 8 - Diagram block of a superheterodyne spectrum analyzer ................................ 24 Figure 9 - Three mixing stages spectrum analyzer ......................................................... 26 Figure 10 - Frequency resolution depending of resolution bandwidth ............................. 27 Figure 11 - Simplest form of an envelope detector .......................................................... 28 Figure 12 - Sample detector types of a bucket ................................................................ 28 Figure 13 - Spectrum analyzer R&S®FSL6 .................................................................... 29 Figure 14 - Omnidirectional antenna ............................................................................... 32 Figure 15 - Automation platform windows ....................................................................... 34 Figure 16 - TV channel 60 (782 to 790 MHz): free .......................................................... 37 Figure 17 - TV channel 67 (838 to 846 MHz): busy ......................................................... 37 Figure 18 - Frequency traces of the Wi-Fi band .............................................................. 38 Figure 19 - Frequency trace plotted with MATLAB .......................................................... 38 Figure 20 - Frequency trace screenshot ......................................................................... 39 8 1. Introduction 1.1. Statement of purpose The project has been carried out at the department of Signal Theory and Communications in the Escola Tècnica Superior d’Enginyeria de Telecomunicació de Barcelona (ETSETB) at Universitat Politècnica de Catalunya (UPC), specifically, in the Mobile Communications Research Group (GRCM). The purpose of this project is to design, develop and prove an automation platform for radio spectrum measures. To do this project it has been used a Rohde & Schwarz spectrum analyzer, in concrete the model R&S®FSL6. Also, it has been developed an automation platform using MATLAB; through this program it is possible to control the spectrum analyzer remotely. So, it can be configured its parameters and obtain and save the data measured. Then, if necessary, the data obtained can be processed. The project main goals are: To specify the spectrum analyzer parameters which are need to configure, like central frequency, span, resolution bandwidth, detection methods, averages, etc. To develop MATLAB functions to control remotely the spectrum analyzer and configure the main parameters to do spectrum measures. To create a user interface to interact, in a friendly and simple way, with the spectrum analyzer from any personal computer with MATLAB. To make experimental validations taking some measures in UPC Campus Nord, Barcelona. 1.2. Requirements and specifications Project requirements: - To create a MATLAB software program to configure the parameters of the spectrum analyzer needed to measure the part of the radio spectrum required. - To build a user friendly interface for the MATLAB application with a good look and feel, so the spectrum analyzer will be configured with only a few steps. - To capture the data measured with the Rhode & Schwarz spectrum analyzer and save it in a personal computer to process it later. Project specifications: - The platform must configure a FSL6 Rohde & Schwarz spectrum analyzer which covers from 9 kHz to 6 GHz. 9 - The application developed must be able to capture frequency traces in different ways using the spectrum analyzer and store it in the computer. 1.3. Methods and procedures The Mobile Communications Research Group (GRCM) performs a set of projects which involves the capture of data samples in the radio spectrum for different purposes and objectives. Until the last year they have used a spectrum analyzer from Anritsu, in concrete the model Spectrum Master MS2127B. To capture these samples they have developed in the last years a MATLAB platform to simplify the process. In the recent years the Anritsu spectrum analyzer has been outdated to do projects that require capturing a big number of traces with a huge number of points due to its slowness and few measuring points. For all of this, this year the Mobile Communications Research Group has bought a new spectrum analyzer, the model R&S®FSL6 from Rohde & Schwarz, which is a newer spectrum analyzer. So, to help to do these projects and to test the performance of the new spectrum analyzer a new platform has been built from scratch to configure these parameters and to capture the frequency traces. To develop it, only the concept and the design from the Anritsu platform has been used, because the Rohde & Schwarz spectrum analyzer works with different libraries and its functionality has changed to improve the user experience. In conclusion, it has not been used existing platforms developed for the Anritsu spectrum analyzer because they didn't work with the new Rohde & Schwarz spectrum analyzer. So, this automation platform has been developed from scratch, only using the MATLAB software and the libraries provided from Rohde & Schwarz. For the hardware used, it has been used the R&S®FSL6 spectrum analyzer, an omnidirectional antenna provided from the university department and a laptop with Windows 7 installed. 10 1.4. Work plan Project Work Packages Main Tasks Automation Platform Planning Spectrum analyzer MATLAB Environment MATLAB GUI Experimental Validations Project proposal and work plan Main parameters configuration Spectrum remote control Interface requirements Save data measured Connection via LAN to PC Configuration functions UI design Application validation MATLAB GUI application Figure 1 - Work plan diagram Work Packages: Project: Automation platform for radio spectrum measures WP ref: WP1 Major constituent: Planning Sheet 1 of 5 Short description: Definition of the project scope and goals, Planned start date: 17/02/2014 time plan, work packages and communication with the Planned end date: 07/03/2014 professor. Start event:17/02/2014 End event: 18/03/2014 Internal task T1: Delivery of the project proposal and work Deliverables: Dates: plan. Project 07/03/2014 proposal and work plan 11 Project: Automation platform for radio spectrum measures WP ref: WP2 Major constituent: Spectrum analyzer (hardware) Sheet 2 of 5 Short description: Introduction to the spectrum analyzer Planned start date: 17/02/2014 R&S®FSL6 and its modes of use to obtain the data. Planned end date: 10/03/2014 Connection between the spectrum analyzer and any personal computer via LAN. Start event: 17/02/2014 End event: 10/03/2014 Internal task T1: Configure the main parameters of the spectrum analyzer directly. Deliverables: Dates: Internal task T2: Do some measures in the radio spectrum with the spectrum analyzer and an omnidirectional antenna. Internal task T3: Connect the spectrum analyzer in a laptop with MATLAB installed via LAN. Project: Automation platform for radio spectrum measures WP ref: WP3 Major constituent: MATLAB environment (software) Sheet 3 of 5 Short description: Understand the MATLAB main functions Planned start date: 10/03/2014 and how to work with them to connect and configure the Planned end date: 21/04/2014 spectrum analyzer. Start event: 10/03/2014 End event: 21/04/2014 Internal task T1: Initialize the remote control of the spectrum Deliverables: analyzer using the libraries, drivers and programs needed. Functions Internal task T2: Configure the required parameters to do the in .m file. radio spectrum measures using MATLAB functions. Dates: 21/04/2014 Internal task T3: Create the functions that allow setting the spectrum analyzer parameters via MATLAB. 12 Project: Automation platform for radio spectrum measures WP ref: WP4 Major constituent: MATLAB GUI (software) Sheet 4 of 5 Short description: Planned start date: 24/03/2014 Developing a Graphical User Interface (GUI) with MATLAB Planned end date: 9/06/2014 which will be the basis of our automation platform. Start event: 24/03/2014 End event: 30/05/2014 Internal task T1: Know how to create GUIs with MATLAB. Deliverables: Dates: Internal task T2: Requirements to implement in the interface. MATLAB application 9/06/2014 Internal task T3: Create a design of the program interface. Internal task T4: Develop a GUI that implements the functions created with the requirements and designs selected before. Project: Automation platform for radio spectrum measures WP ref: WP5 Major constituent: Experimental validations (testing) Sheet 5 of 5 Short description: Test the MATLAB application to configure Planned start date: 02/06/2014 the spectrum analyzer and do some measures. Validation of Planned end date: 30/06/2014 the obtained results. Start event: 02/06/2014 End event: Internal task T1: Select the portion of the radio spectrum to be Deliverables: Dates: measured Set of data 30/06/2014 Internal task T2: Do some measures with an omnidirectional obtained. antenna and the spectrum analyzer controlled remotely via a Final product. MATLAB design interface. Final Report. Internal task T3: Save and process the data measured. Internal task T4: Verified the results obtained with the application. Internal task T5: Final Report of the project 13 Milestones WP# Task# Short title Milestone / deliverable Date (week) 1 1 Planning Project Proposal and Work Plan 3 2 3 Connection via LAN Connect the spectrum analyzer to a laptop via LAN 3 3 1 Initialization spectrum analyzer Initialize the spectrum analyzer via MATLAB 5 3 4 Configure parameters remotely MATLAB functions to set the spectrum analyzer parameters 6 4 3 Design the program User interface design 10 4 4 Develop the program MATLAP application 18 5 3 Experimental validation Data measured 19 5 4 System validation Final software product 21 5 5 Final Report Project report 21 14 Time Plan (Gantt Diagram) Figure 2 - Time Plan Gantt Diagram 15 1.5. Deviations and incidences During the development of the first three work packages, some incidences appeared loading the libraries required to control the spectrum analyzer in MATLAB. To load these libraries it is necessary to install some software programs like National Instruments VISA and Microsoft Visual C++ 2008 SP1. Problems occurred because it was required to work with a laptop using a 64-bit MATLAB and operating system and, initially, it only could load the libraries in a laptop using a 32-bit MATLAB and operating system. After different tests, it was seen that the computer has some programs installation errors because one of these programs didn’t work properly. Finally, after testing different combinations, all the programs needed were installed from scratch with email technical support from Rhode & Schwarz, so the errors were solved and the libraries were loaded properly in a 64-bits software environment. Once this was achieved, it was possible start to develop the functions to control all the parameters chosen in the second work package to finally obtain a GUI with these functions, which are able to obtain the data such as the user wishes. After the platform was fully developed it was seen that when continuous sweep is selected if it captures more than one trace immediately, it stores the same values than the previous sweep. So, if it is desired to save more than one trace immediately it is required to select single sweep. Thus, it was needed to modify the platform to adapt it for this trace capture situation. 16 2. State of the art of the technology used or applied in this thesis 2.1. Telecommunications systems Nowadays, telecommunications systems are an everyday characteristic in human lives. They are used in many situations and for a huge number of different applications. Electronics devices are used to communicate to each other through local networks or Internet. In the last years, the products which use a telecommunications systems have expanded in all the world with Smartphones, Tablets, PCs, laptops, Smart TVs, etc. and with an enormous growth. Also, in the future, many more of them will be available when the appliances or even the different parts of a house will be able to connect to the networks. This popularization and strong demand for electronic devices has led to an enormous demand of data, which has increase exponentially since the nineties, and it will grow a lot more in the future. Only in 2013, the global mobile traffic demand increased an 83% from 2012 [1]. The growth will be much larger in the next years due to the expansion of telecommunications devices across the world. Figure 3 - Global mobile traffic demand growth Also, every day more and more devices are design not only to be able to connect to Internet, but to do it wireless. To use wireless telecommunications systems, radio waves are used to connect the devices between them, so the radio spectrum is one of the most important elements in the operation of these systems. 17 2.2. Radio spectrum scarcity Radio spectrum refers to the part of the electromagnetic spectrum corresponding to radio frequencies, that is, frequencies lower than around 3000 GHz (or, equivalently, wavelengths longer than about 0.1 mm). Electromagnetic waves in this frequency range are called radio waves. Different parts of the radio spectrum are allocated for different radio transmission technologies and applications. In some cases, parts of the radio spectrum are sold or licensed to operators of private radio transmission services (for example, cellular telephone operators or broadcast television stations). In Annex 1, it can be found the radio spectrum frequency allocation image at the United States of America (USA) with its different applications. In Europe, there is a table of frequency allocations and applications in all the radio spectrum range but it has not been found a map such as the USA [2]. In these frequency allocation images or tables it is shown the huge number of applications and services which supports the radio spectrum and the complexity to provide a useful and quality communication system in this complex environment. The radio spectrum is limited and the best frequencies for the operators and the users are the lowest ones because, technologically, it is simpler to work with them and it is possible to achieve more range than with high frequencies using the same power. So, it is very important to use it in an efficient way because the radio frequencies cannot increase and the lowest ones are most of them, nowadays, occupied. So, for one hand, there is an increasing demand of traffic due to popularization of new devices and its strong user demand and, for the other hand, there is a radio spectrum that is limited and most of them occupied. This situation has led that the telecommunications companies said that if a solution is not found the radio spectrum will crunch because while the data demand is growing the spectrum available is declining so quickly [3]. 18 Figure 4 - Traffic grow per cell site and spectrum to mobile phones traffic surplus/deficit In the last years, companies and organizations have done research to find new methods and techniques, which permit to use the radio spectrum more efficiently and solve the spectrum scarcity problem, nowadays and in the near future. These studies have found that the two main reasons for the spectrum scarcity are government allocation policies and the state of available radio technologies [4]. 2.3. Radio spectrum government policies Traditional government policies give licenses technology and service specific, which has been seen that is an efficient method to use radio spectrum in a properly way but it cannot afford the data demand growth. Therefore, the government policies changes to improve this situation have three main points: Spectrum reallocation: the reallocation of bandwidth from government and other long-standing users to new services, such as mobile communications, broadband Internet access and video distribution. Spectrum leases: the relaxation of the technical and commercial limitations on existing spectrum licenses by, for example, permitting existing licensees to use their spectrum for new or hybrid (for example, satellite and terrestrial) services and granting most mobile radio licensees the right to lease their spectrum to third parties. Spectrum sharing: the allocation of an amount of spectrum that could be used for unlicensed or shared services. 19 Thanks to these changes radio spectrum market will be more flexible to adapt to the user and industry’s requirements and to allow the changes needed to satisfy the existing and future demand. 2.4. State of the art of the radio technologies To understand the impact new radio technologies are having on spectrum availability, it is helpful first to address a common misconception: that spectrum is a concrete and finite resource. Radio waves do not pass through some ethereal medium called "spectrum"; they are the medium. What's licensed by governments is not a piece of a finite pie but simply the right to deploy transmitters and receivers that operate in particular ways. Moreover, interference is not some inherent property of spectrum. It's a property of devices. A better receiver will pick up a transmission where an earlier one heard only noise. Whether a new radio system "interferes" or not with existing ones, is entirely dependent on the equipment involved. Consequently, the extent to which there appears to be a spectrum shortage largely depends not only on how many frequencies are available but on the technologies that can be deployed. Many regulations intended to promote harmony of the airwaves have instead, by putting artificial limits on technology, created massive inefficiency in spectrum utilization. A Spectrum Policy Task Force, organized by the FCC, recognized that much of the spectrum already licensed is not really in short supply [5]. If portions of the radio spectrum are scanned, even premium frequencies below 3 GHz in dense, revenue-rich urban areas, it will be found that most bands are free most of the time. Actually, a lot of the television channels are not used. Sometimes that's by design, as with "guard bands" spectral equivalents of highway shoulders, in which no radio signals are permitted. What's happening now is new radio transmission and networking technologies can squeeze more and more capacity out of the same spectrum. Some of the improvement comes from the shift from analog to digital transmission. For example, at least four digital TV chains can be broadcast on the same frequencies that a single analog channel now occupies. Similarly, digital cellular systems now carry three times as many phone calls as their analog predecessors. Even greater improvements in spectrum usage will come from a family of technologies that use the computational intelligence of today's wireless devices to allow multiple 20 systems to "share" the same spectrum. The first of these, spread spectrum, replaces ancient high-power, undifferentiated narrowband transmissions with modern low-power, coded wideband signals. A newly permitted method of using spectrum, ultrawideband, takes spread spectrum to its logical conclusion, operating at such low power that, subject to appropriate safeguards, it can underlie existing licensed services. That is, preexisting users of the same spectrum bands won't even know the ultrawideband transmissions are there. Another recent innovation, smart antennas, can focus adaptively to "lock into" a directional signal. Instead of radiating a signal in all directions equally, they figure out where a user is located and direct the radiation accordingly, reducing effective interference with other transmitters. Figure 5 - Smart antenna operation Now, too, novel coding algorithms can take factors that traditionally hampered transmission, such as physical obstacles and motion, and use them to generate information that increases capacity. Perhaps the greatest technological gain in wireless capacity, however, will come from systems that work cooperatively. In a network architecture called a mesh, each RF receiver also acts as a transponder, retransmitting data sent by other devices in the network. In other words, every new device uses some of the network's capacity but also adds capacity back. Because a device in a mesh no longer needs to send information continuously to its ultimate destination (such as a cell tower), it can use less power. That allows the network to add more devices without any noticeable increase in interference. The approach resembles the distributed architecture of the Internet, in which every router can move traffic along an efficient path. 21 Cognitive radios are a key enabler for all these advances. A cognitive radio can receive and transmit across a broad range of frequencies; because it processes signals in software, it is far more adaptable than a traditional radio. In principle, a software radio originally used for cellular telephony could, for example, download new software and begin to receive broadcast television signals, or, more likely, access a network that uses a new cellular transmission protocol. Even more sophisticated "cognitive radios" would work cooperatively, analyzing other nearby radios and adapting on the fly to avoid other transmissions. Figure 6 - Cognitive radio network operation 2.5. A solution for spectrum scarcity Like it has been said in the last point, one of the main key enabler to solve the spectrum scarcity is software radios or cognitive radios. A cognitive radio (CR) is a wireless communications device which can adjust its transmission based on information about the local use of the spectrum. A cognitive radio gets information about how the spectrum is being used and makes a decision on how to use the available radio resources to ensure communications with a certain quality of service [6]. This concept of a “smart radio” was introduced by Joseph Mitola III and Gerald Q. Maguire Jr. in 1999. They described a cognitive radio as a device that can match its own capabilities to external observations. A cognitive radio uses this knowledge to adapt itself to provide wireless services most appropriate to the user needs and preferences. The radio can learn from its past actions and experience and incorporate this knowledge in future decisions [7]. So, one of the most promising ways to solve the spectrum scarcity is to use the cognitive radio technology in the parts of radio spectrum that now are unused and, in the near future thanks to the government policies changes, will be available. 22 These unused portions of the radio frequency spectrum are known as white spaces. One of the first playgrounds to develop a Cognitive Radio Network (CRN) is television band, thanks to the digital switch-over [8]. Taking advantage of these parts of the spectrum with the correct technologies will allow obtain a best and faster telecommunications systems. For this, white space allocation is expected to stimulate development of wireless technologies and services provided for them. Another important piece to implement these systems is what is known as Radio Environment Maps (REM). A REM map shows the zone, where a cognitive radio system will be implemented, and indicates the white spaces available that can be used for other devices. These maps are saved in databases and some of them are public for everybody who wants to use it. One of the most important database maps in Europe is the maps provided by COGEU. COGEU is a project developed for the European Union which is a composite of technical, business, and regulatory/policy domains with the objective of taking advantage of the TV digital switch-over (or analog switch-off) by developing cognitive radio systems that leverage the favorable propagation characteristics of the TV white spaces through the introduction and promotion of real-time secondary spectrum trading and the creation of new spectrum commons regime [9]. Figure 7 - Withe spaces in Munich COGEU database To elaborate these REMs it is needed to measure the spectrum power in the different bands selected and in different places, and then create these databases and maps. To make these measures the instrument used is a spectrum analyzer which is one of the basic telecommunications instruments. 23 2.6. Spectrum analyzer A spectrum analyzer measures the magnitude of an input signal versus frequency within the full frequency range of the instrument. By analyzing the spectra of electrical signals, dominant frequency, power, distortion, harmonics, bandwidth, and other spectral components of a signal can be observed that are not easily detectable in time domain waveforms. The most common spectrum analyzer is a superheterodyne spectrum analyzer. Heterodyne means to mix, that is, to translate frequency. And super refers to super-audio frequencies, or frequencies above the audio range. In the next figure, it is shown a block diagram of a superheterodyne spectrum analyzer [10]. Figure 8 - Diagram block of a superheterodyne spectrum analyzer Like we see in the above figure, an input signal passes through an attenuator, then through a low-pass filter to a mixer, where it mixes with a signal from the local oscillator (LO). Because the mixer is a non-linear device, its output includes not only the two original signals, but also their harmonics and the sums and differences of the original frequencies and their harmonics. If any of the mixed signals falls within the pass band of the intermediate-frequency (IF) filter, it is further processed (amplified and perhaps compressed on a logarithmic scale). It is essentially rectified by the envelope detector, digitized, and displayed. A ramp generator creates the horizontal movement across the display from left to right. The ramp also tunes the LO so that its frequency change is in proportion to the ramp voltage. In next sections it will be described with detail each block to understand its function and to see how a spectrum analyzer works internally. 24 2.6.1. RF attenuator The first part of our analyzer is the RF input attenuator. Its purpose is to ensure the signal enters the mixer at the optimum level to prevent overload, gain compression, and distortion. Unfortunately, it also attenuates low frequency signals and increases the minimum useable start frequency of the analyzer to 100 Hz for some analyzers, 9 kHz for others. 2.6.2. Pre-selector or low-pass filter The low-pass filter blocks high frequency signals from reaching the mixer. This prevents out-of-band signals from mixing with the local oscillator and creating unwanted responses at the IF. 2.6.3. Mixer and local oscillator (LO) It is needed to know how to tune the spectrum analyzer to the desired frequency range. Tuning is a function of the center frequency of the IF filter, the frequency range of the LO, and the range of frequencies allowed to reach the mixer from the outside world (allowed to pass through the low-pass filter). Of all the mixing products emerging from the mixer, the two with the greatest amplitudes, and therefore the most desirable, are those created from the sum of the LO and input signal and from the difference between the LO and input signal. If it can be arranged things so that the desired signal to examine is either above or below the LO frequency by the IF, then one of the desired mixing products will fall within the pass-band of the IF filter and be detected to create an amplitude response on the display. So, it is needed to pick an LO frequency and an IF that will create an analyzer with the desired tuning range. Let’s assume that we want a tuning range from 0 to 3 GHz. Then, it is needed to choose the IF frequency. Let’s try a 1 GHz IF. Since this frequency is within our desired tuning range, it could be had an input signal at 1 GHz. Since the output of a mixer also includes the original input signals, an input signal at 1 GHz would give a constant output from the mixer at the IF. The 1 GHz signal would thus pass through the system and give a constant amplitude response on the display regardless of the tuning of the LO. The result would be a hole in the frequency range at which it could not be properly examined signals because the amplitude response would be independent of the LO frequency. Therefore, a 1 GHz IF will not work. So it shall be chosen, instead, an IF that is above the highest frequency to which it is wished to tune. An option is to choose an IF about 3.9 GHz. If it is started the LO at the IF (LO minus IF = 0 Hz) and tune it upward from there to 3 GHz above the IF, then it can be covered the tuning range with 25 the LO minus IF mixing product. Using this information, a tuning equation can be generated: fsig = fLO – fIF Where fsig = signal frequency, fLO = local oscillator frequency and fIF = intermediate frequency (IF) In summary, it can be said that for a single-band RF spectrum analyzer, it would be chosen an IF above the highest frequency of the tuning range. It would be made the LO tunable from the IF to the IF plus the upper limit of the tuning range and include a lowpass filter in front of the mixer that cuts off below the IF. To separate closely spaced signals, some spectrum analyzers have IF bandwidths as narrow as 1 kHz; others, 10 Hz; still others, 1 Hz. Such narrow filters are difficult to achieve at a center frequency of 3.9 GHz. So it must be added additional mixing stages, typically two to four stages, to down-convert from the first to the final IF. Figure 9 - Three mixing stages spectrum analyzer 2.6.4. IF gain The next component of the block diagram is a variable gain amplifier. It is used to adjust the vertical position of signals on the display without affecting the signal level at the input mixer. When the IF gain is changed, the value of the reference level is changed accordingly to retain the correct indicated value for the displayed signals. 26 2.6.5. Resolution bandwidth filters After the IF gain amplifier, it is found the IF section which consists of the analog and/or digital resolution bandwidth (RBW) filters. Frequency resolution is the ability of a spectrum analyzer to separate two input sinusoids into distinct responses. How the input signals is fixed and the local oscillator is swept, the products from the mixer are also swept. So, if the input signal has power in two frequencies to close in the display it will be only seen one peak because the swept will not detected. Some spectrum analyzers use digital techniques to realize their resolution bandwidth filters to achieve best results. Figure 10 - Frequency resolution depending of resolution bandwidth If resolution was the only criterion on which a spectrum analyzer is judged, it might be design the analyzer with the narrowest possible resolution (IF) filter and let it go at that. But resolution affects sweep time, and sweep time is a parameter too important. Sweep time directly affects how long it takes to complete a measurement. Resolution comes into play because the IF filters are band-limited circuits that require finite times to charge and discharge. If the mixing products are swept through them too quickly, there will be a loss of displayed amplitude. If it is think about how long a mixing product stays in the pass band of the IF filter, that time is directly proportional to bandwidth and inversely proportional to the sweep in Hz per unit time, or: Where RBW = resolution bandwidth and ST = sweep time. 27 2.6.6. Envelope detector Spectrum analyzers typically convert the IF signal with an envelope detector. In its simplest form, an envelope detector consists of a diode, resistive load and low-pass. The response of the detector follows the changes in the envelope of the IF signal but not the instantaneous value of the IF sine wave itself. Figure 11 - Simplest form of an envelope detector 2.6.7. Detector types With digital displays, it is needed to decide what value should be displayed for each display data point. No matter how many data points are used across the display, each point must represent what has occurred over some frequency range. In these cases the span is divided in some buckets and in each bucket it is selected one sample using one of the following detector types: sample, positive peak, negative peak, normal, average or quasi-peak. Figure 12 - Sample detector types of a bucket 28 3. Methodology / project development: At the beginning of the project it was defined the project scope and its goals, the time plan and the work packages. The first thing it was needed to do is get familiarized with the spectrum analyzer R&S®FSL6, to understand its ways of operation and its main parameters. Thus the main characteristics of the spectrum analyzer R&S®FSL6, its main capabilities and operation methods, were identified [11]. Figure 13 - Spectrum analyzer R&S®FSL6 Frequency range: 9 kHz to 6 GHz Frequency resolution: 1 Hz Frequency accuracy: 1·10-6 Resolution bandwidth: 300 Hz to 10 MHz Video bandwidth: 1 Hz to 10 MHz Sweep points: 1 to 32001 Third order intercept (TOI): typ. +18 dBm Output level: -20 dBm to 0 dBm Impedance: 50 Ω Reference Attenuation: 0 dB to 50 dB Preamplifier: 20 dB Amplitude units: dBm, dBmV, dBuV, dBuA, dBpW, W, V and A Detector methods: max peak, min peak, auto peak, sample, RMS, quasi peak and average 29 Then, it was wanted to connect the spectrum analyzer to a laptop via LAN, so it would be able to communicate to the spectrum analyzer through the laptop. Once the spectrum analyzer was in the same LAN network than the laptop it was possible to reach it, however, it was needed to install the required drivers and libraries to be able to control the spectrum analyzer via MATLAB. When the drivers and the required libraries have been installed, it was verified that it was possible to change some spectrum analyzer parameters from MATLAB interface. At this moment, it was possible to start developing the automation platform to remotely control the spectrum analyzer, but, first of all it was essential to define which parameters were wanted to configure, which value range they have and how they can be configured. The following list was elaborated with the parameters that it was thought that the platform should be able to configure. Frequency parameters: o Central frequency and span o Stop and start frequency Bandwidth parameters: o Resolution Bandwidth (RBW) value and mode o Video Bandwidth (VBW) value and mode Amplitude parameters: o Rf. Attenuation o Attenuation mode: auto or manual o Preamplifier o Reference Level Trace parameters: o Average o Average counts Sweep parameters: o Single or continuous sweep o Sweep time o Sweep points Then, this list was accorded with the thesis professor and it was started the search and the test of the functions that configure these parameters. It was found that they can be changed in two different ways, with attributes or specific functions [12]. So, depending of each parameter it was chosen the method that suits best its specific needs. 30 In Annex 2, it is added an excel document with a list of the main spectrum analyzer parameters. For each parameter, its range is shown, its function to modify it, its corresponding attribute value and it is indicated if it is implemented in the platform. This document was the base to start to develop the GUI platform. First of all, it was started developing a platform with the possibility to configure only some of these parameters and when these parameters work properly some more were added. Also, another important characteristic that it was wanted to have in the program was a field text that every time the user introduces a value or change a parameter notifies with a sentence the change made. This feature was added in the first versions of the platform. One of the main functionalities of the platform according to the project plan was the capture of data. It was wanted to have a simple, but very powerful way to capture data. This feature has different ways to take data samples and the users must select the method that fits more its needs. So, a capturing data feature with these four different methods was designed and developed: - Number of traces: with this method the user must add the number of traces to capture and the number of traces per file. The platform will capture immediately all the traces wanted and save them adding in each file the number of traces introduced in the number of traces per file field. - Number of traces with start time: using this method the user must add the number of traces to save, the number of traces per file and the start time. So, when the actual time is the start time the platform will start to capture the number of traces introduced and it will finish when all traces wanted are captured. - Traces between start and stop time: in this case the user must add the number of traces per file, the start and stop time. So, the platform will be capturing traces and saving them in files with the number of traces selected while the actual time is between the start and stop time. - Traces for frequency intervals: this is the most complex method. So, with this method the user must add the number of traces to save, the number of traces per file, the central frequency shift and the number of shifts. It is very useful to measure systems with a fixed channelization. When the user click to save the data, immediately, the platform will capture all the traces indicated in the frequency range put in the platform frequency parameters. When the platform finish to capture the traces in this interval, automatically it will shift the central frequency with the value introduced and it will capture all the traces wanted in this 31 new frequency range. The platform will do this procedure as many times as the number of shifts value. Each version of the platform was verified with the thesis advisor to check the new functionalities introduced. When all desired parameters were available and the platform was ready to use, it was decided that the platform was terminated and ready to take samples of the channels desired. Once the platform was ready to use, the next step to continue with the project development was to take some frequency traces proving the functionalities of the platform developed and verify its correct operation. To capture data it was used an omnidirectional antenna provided by the Mobile Communications Research Group (GRCM) with the following characteristics. Figure 14 - Omnidirectional antenna Receiving Range: 75 MHz – 3 GHz Impedance: 50 Ω Height: 0.87 m Weight: 690 g (aerial section only) Coaxial cable: RG-58A/U 10 m with N connector 32 Finally, with the automation platform, the spectrum analyzer and the omnidirectional antenna, the correct operation of the platform developed was verified, taking samples of the radio spectrum power in Campus Nord UPC, Barcelona (41.387334, 2.112306). It was chosen to capture data from two different radio spectrum bands. One was a part of the TV band, specifically, from channel 60 (786 MHz) to channel 69 (858 MHz) in these channels some of them are occupied and some of them not, so it can be able to see the difference between a channel used to transmit a TV signal and a channel free. The other band chosen was the WLAN (Wi-Fi) band which goes from 2.4 GHz to 2.5 GHz. Thanks to the frequency traces taken in the two radio spectrum bands and the required spectrum analyzer configuration it was verified the correct operation of the platform developed and it was demonstrated that it is ready to use it in any project which involves the use of the spectrum analyzer R&S®FSL6. 33 4. Results 4.1. Automation platform As a result of this thesis it has been obtained an automation platform for radio spectrum measures which is able to configure the spectrum analyzer R&S®FSL6 and save the data visualized in it. This platform can configure the main parameters of a spectrum analyzer, specifically, the ones proposed, debated and decided with the thesis professor. To execute the platform it is a requirement to use the MATLAB software and execute the script with the name Automation Platform FSL6.m. When this script is run a windows is shown with the following look and feel. Figure 15 - Automation platform windows Once the platform is opened, it is not possible to configure any parameter. First of all, it is indispensable to click the Connect button to connect with the spectrum analyzer and activate all the options to configure it. 34 In the platform window, there are seven different panels, three general buttons and a notifications field. Each panel configures a set of related parameters. Next it will be explained briefly the characteristics of each one: - Spectrum analyzer connection: in this panel it is needed to set the spectrum analyzer IP and with the connect button the platform will connect to the spectrum analyzer. If the platform is not connected to the spectrum it is not possible to configure any parameter or save any data. - Frequency parameters: in a spectrum analyzer one of the main and most important parameter is the frequency range displayed, so in this panel it is possible to change the frequency range with two different ways. One of them is with the central frequency and span; and the other is with the start and stop frequency. - Filter parameters: this panel can configure the resolution bandwidth and video bandwidth. They can be set to auto or manual mode, and in manual mode choose the desired value. - Trace parameters: this panel allows changing between single and continuous sweep, activate or deactivate the average and, if it has been selected continuous sweep and average, indicate the number of averages. - Sweep parameters: it allows configuring the sweep points which are the number of points per trace. This panel also indicates the time spent to complete a trace. - Amplitude parameters: in this panel, it is possible to change the attenuation mode to auto or manual. When the attenuation mode is manual it is possible to select the spectrum analyzer attenuation by setting to the Rf. Attenuation. Also, it can be changed the screen Ref. level and, finally, it is possible to activate a 20 dB preamplifier. - Save data: it allows selecting four different ways to capture traces. These methods have the following names: number of traces, number of traces with start time, traces between start and stop time, and traces for frequency intervals. Each one was explained in the earlier section. Obviously, it is required to write the file name of the file to save. - Notifications field: in this field it will be shown a message for every action made with the platform. It will indicate if the change was successful, if the value introduced is out of the spectrum analyzer range, if the value introduced is not correct or if any error occurred. 35 Finally, there are three general buttons. One of them makes a reset of the spectrum analyzer configuration, another takes a screenshot of the spectrum analyzer screen and, finally, the last one is to exit the platform. To be able to execute the automation platform with all its possibilities and to understand easily how to work with it, it has been developed a User Manual. This manual explains all the options of the platform so, for any new user who wants to use it, it is strongly recommended to read it before using the platform developed. This manual was a must requirement to complete the platform because for any software developed it is indispensable write a manual like that. So, any future user will have a complete description of the platform’s functionalities. In Annex 3, it is added the manual developed for the platform. 4.2. Radio spectrum measures To verify the platform developed it has been made some radio spectrum measures to be sure that the platform is ready to be used in projects which use the spectrum analyzer R&S®FSL6. In concrete, for the projects which target is to increase the radio spectrum efficiency. Like, it has been explained in this thesis one of the most promising bands to be a candidate to use the radio spectrum in a more efficient way is the TV band because it is affected for the government policies and some channels are not used or will be not used. TV band in Spain is divided in different channels or muxs. Each channel has a bandwidth of 8 MHz and the first one is the channel 20 with a central frequency of 466MHz. First of all it was necessary to configure the spectrum analyzer with the appropriate characteristics to capture frequency traces of the TV band. Then, it was captured the power of the channels 60 to 69 that are the channels with a central frequency of 786, 794, 802, 810, 818, 826, 834, 842, 850, 858 MHz, respectively. These channels have been chosen because next year the Spain government will reallocate the current services, so they will be available for other services. Therefore, it is important to know which ones are used or unused to know if it is possible to use them for other applications and users. The obtained files were saved and they can be opened with MATLAB easily. Right after, are shown with MATLAB two different frequency traces of different TV channels obtained with the platform. One of them is free and the other has an official transmission. 36 dBm -105 -110 -115 -120 -125 -130 -135 -140 -145 7.82 7.83 7.84 7.85 7.86 7.87 7.88 7.89 7.9 Hz 8 x 10 Figure 16 - TV channel 60 (782 to 790 MHz): free dBm -95 -100 -105 -110 -115 -120 -125 -130 -135 -140 -145 8.38 8.39 8.4 8.41 8.42 8.43 8.44 8.45 8.46 Hz 8 x 10 Figure 17 - TV channel 67 (838 to 846 MHz): busy Another band of the radio spectrum measure was the Wi-Fi band which goes to 2.4 GHz to 2.5 GHz. Of course, first of all it was configured the spectrum analyzer to adapt the spectrum parameters to the Wi-Fi band. In this case, they were taken 200 traces of the band to see the use of it along a small period of time. 37 dBm -40 -60 -80 -100 -120 -140 -160 2.4 2.41 2.42 2.43 2.44 2.45 2.46 2.47 2.48 2.49 2.5 Hz 9 x 10 Figure 18 - Frequency traces of the Wi-Fi band Finally, to verify that the trace capture function of the platform captures the samples really shown in the spectrum analyzer screen, it was done the next test. It was captured one frequency trace with the save data panel and a spectrum analyzer screenshot was taken. Then, the trace captured was plotted in MATLAB, so it was possible to confirm that the samples saved were the same ones that the samples shown in the spectrum analyzer screen. Next figures show the same frequency trace. The first one is captured with the platform, saved and plotted with MATLAB and the second one is a direct screenshot of the spectrum analyzer. dBm -55 -60 -65 -70 -75 -80 -85 -90 8.55 8.6 8.65 8.7 8.75 Hz 8 x 10 Figure 19 - Frequency trace plotted with MATLAB 38 Figure 20 - Frequency trace screenshot 39 5. Budget In this thesis, it has been developed and tested a software platform to configure and obtain traces with the spectrum analyzer R&S®FSL6. So, there are two different costs, ones are the costs of the devices necessary to use it and the others are the costs of design, develop and test the platform. Considering only the cost of design, develop and test the automation platform with an estimation of the hours dedicated evaluated at cost of a junior engineer next costs are obtained: - Design cost: 95 hours · 15 €/hour = 1425 € - Developing cost: 140 hours · 15 €/hour = 2100 € - Testing cost: 65 hours · 15 €/hour = 975 € Also, to do this project it was necessary some essential equipment. The cost of the equipment used is the following: - MATLAB 2013 software license: 3150 € - Spectrum analyzer R&S®FSL6: 12545 € - Omnidirectional antenna: 120 € - Laptop with Windows 7: 550 € The equipment used was provided by the Mobile Communications Research Group (GRCM) and it was not necessary to acquire it because they already had it and they use it for other projects and telecommunications studies. 40 6. Environment Impact This project doesn’t have any negative environment impact. The spectrum analyzer only receives electromagnetic waves sent by radio stations, TV stations or mobile stations. How a great variety of studies have proved these radio waves doesn’t affect the human health at all. They are harmless to humans because they have very little power and the frequencies used are not dangerous to humans, how higher frequencies like X rays or gamma frequencies are. Also, the spectrum analyzer doesn’t send any electromagnetic waves, it only receives it. Like it has been explained in all these thesis our objective is to have a platform to take radio spectrum measures to develop studies to use the spectrum in a better and efficient way to obtain faster and more robust telecommunications systems. 41 7. Conclusions and future development As a result of the thesis it has been developed an automation platform for radio spectrum measures with the characteristics and functionalities chosen in the project plan. This platform allows taking any radio spectrum measure with the spectrum analyzer R&S®FSL6 from Rohde&Schwarz. The main purpose to elaborate this platform was to facilitate with a simple and easy way the capture of frequency traces with the spectrum analyzer R&S®FSL6. As it has been explained before, nowadays, for a great variety of studies it is essential to measure the different frequency bands of the spectrum to see which bands are used or not and how they can be used more efficiently. This is because in the last years due to the expansion of radio communication systems and its consequent growth of traffic demand it has become essential to study the radio spectrum to find more efficient ways of use, because as the radio spectrum is used nowadays, there are scarcity problems. As mentioned, the two points to focus the solution of the spectrum scarcity are government policies and new radio technologies. For the government policies in the last and next years it has been or will be done a huge number of measures to make policy changes. Otherwise, for the new radio technologies one of the keys is the cognitive radio. A cognitive radio is able to adjust its transmission based on information about the local use of the spectrum. So, combining the cognitive radio with some radio spectrum band not used or partially used, for example with TV frequency band, since it is the first one that was tested, it is possible to use the spectrum more efficiently with more traffic and more users. Therefore, it is basic to measure the spectrum power previously to know which frequency bands are used in every place and then, published this information for all the operators and users of the zone. Thereby, it is too important to develop a platform, which helps to take all these measure, like the one developed in this project. The goals proposed initially have been accomplished like they were proposed. So, it has been executed the following tasks and activities with successful results: It has been specified the spectrum analyzer parameters which were needed to configure, like central frequency, span, resolution bandwidth, detection methods, averages, etc. It has been developed MATLAB functions to control remotely the spectrum analyzer and configure the main parameters to take spectrum measures. 42 It has been created a user interface to interact, in a friendly and simple way, with the spectrum analyzer from any personal computer with MATLAB. It has been done experimental validations taking some measures in UPC Campus Nord, Barcelona. So, the platform developed is able to do the following operations: To control remotely the spectrum analyzer R&S®FSL6. To configure the parameters of the spectrum analyzer. To capture the data measured with the Rhode & Schwarz spectrum analyzer and to save it in a personal computer to process it later. However, this project has also served as a test for the different parameters and operation ways of the spectrum analyzer R&S®FSL6. This is because this spectrum analyzer is newer, which was bought this year, so the university group hasn’t been able since now to test and use it with all its possibilities. In a conclusion, it has been demonstrated the possibility to develop an automation platform for the spectrum analyzer R&S®FSL6 which can configure its main parameters with a simple, but powerful MATLAB application and with a fine look and feel. Also, it has been tested with some measurements and all of them with successful results. As a recommendation for further developments, it is required to note that it would be strongly useful to use the automation platform developed in projects that measure the radio spectrum. Specifically, in projects that elaborate radio environmental maps to extend the use of white spaces and cognitive radios. 43 Bibliography [1] Cisco Visual Networking Index: Global Mobile Data Traffic Forecast Update, 2013– 2018, 2014 [Online] Available: http://www.cisco.com/c/en/us/solutions/collateral/serviceprovider/visual-networking-index-vni/white_paper_c11-520862.html [Accessed: 21 April 2014]. [2] Electronic Communications Committee (ECC) within the European Conference of Postal and Telecommunications Administrations (CEPT). “The European table of frequency allocations and applications in the frequency range 8.3 Khz to 3000 Ghz Approved May 2014”. Available: http://www.erodocdb.dk/docs/doc98/official/pdf/ERCRep025.pdf [Accessed: 8 July 2014]. [3] D. Goldman. “Sorry, America: Your wireless airwaves are full”, 2012. [Online] Available: http://money.cnn.com/2012/02/21/technology/spectrum_crunch/ [Accessed: 13 May 2014]. [4] G. Staple, K. Werbach. “The End of Spectrum Scarcity”, 2004. [Online] Available: http://spectrum.ieee.org/telecom/wireless/the-end-of-spectrum-scarcity [Accessed: 13 May 2014]. [5] Spectrum Policy Task Force. Spectrum Dashboard. 2014 [Online] Available: http://reboot.fcc.gov/reform/systems/spectrum-dashboard [Accessed: 16 May 2014]. [6] J. Mitola, III; G.Q. Jr Maguire. Cognitive radio: making software radios more personal, Personal Communications, IEEE Volume 6, Issue 4, Aug 1999, pp 13 – 18. [7] P. Pratim, R. Khandelwal, R. Gera, A. Agarwal. Smart Radio Spectrum Management for Cognitive Radio. International Journal of Distributed and Parallel Systems (IJDPS) Vol.2, No.4, July 2011 [8] M. Nekovee, A survey of cognitive radio access to TV White Saces, International Journal of Multimedia Broadcasting, vol. 2010, pp 1-12, 2010. [9] European Union (EU). COGnitive radio systems for efficient sharing of tv white spaces un European context. 2014. [Online] Available: http://www.ict-cogeu.eu/over_objs.htm [Accessed: 23 May 2014]. [10] Agilent Spectrum Analysis Basics. Application Note 150. 2006 [11] R&S®FSL Spectrum Analyzer Specifications. 2013 [12] How to use Rohde & Schwarz® Instruments in MATLAB®. Application Note. 2014. 44 Appendices In this thesis there are included three appendices: - Annex 1: this annex is a document with an image of the radio spectrum frequency allocation at the United States of America (USA). It is shown all the applications and the users that can use each band or have a license to use it. It is a valuable document to understand the complexity use of the radio spectrum. - Annex 2: this annex is an excel document with a list of the main spectrum analyzer parameters. For each parameter is shown its range, its function to modify it, its corresponding attribute value and it is indicated if it is implemented in the platform. - Annex 3: this annex is the User Manual of the automation platform developed. This manual explains all the options of the platform so, for any new user who wants to use it, it is strongly recommended to read it before using the platform. 45 Glossary - CRN: Cognitive Radio Network - COGEU: COGnitive radio systems for efficient sharing of TV white spaces in EUropean context - CR: Cognitive Radio - FCC: Federal Communications Commission - GUI: Graphical User Interface - IF: Intermediate Frequency - LO: Local Oscillator - R&S: Rohde & Schwarz - RBW: Resolution BandWidth - REM: Radio Environment Maps - RF: Radio Frequency - ST: Sweep Time - VBW: Video BandWidth - Wi-Fi: Wireless Fidelity - WLAN: Wireless Local Area Network 46