1
INTERACTIVE WORLD MAP: NATURAL DISASTERS
_______________
A Thesis
Presented to the
Faculty of
San Diego State University
_______________
In Partial Fulfillment
of the Requirements for the Degree
Master of Science
in
Computer Science
_______________
by
Swati Jayeshbhai Patel
Fall 2013
iii
Copyright © 2013
by
Swati Jayeshbhai Patel
All Rights Reserved
iv
DEDICATION
I dedicate this thesis to my family for nursing me with affections and love and
believing in me.
v
ABSTRACT OF THE THESIS
Interactive World Map: Natural Disasters
by
Swati Jayeshbhai Patel
Master of Science in Computer Science
San Diego State University, 2013
During the past decade, electronic learning has been one of the most important
mediums adapted by many schools. Since the increase in the use of computers and internet,
keeping kids interested in learning becomes difficult with books. Electronic learning supports
education, where the medium of the instruction is computer technology, particularly
involving digital technologies. Most higher education institutions have adapted to include
some online classes where the students rarely attend face-to-face lectures on campus, because
they study online. The internet has become a vast reserve of information and it only makes
good sense to incorporate new technologies to make learning a fun experience.
The motivation for the development of this tool is to develop an application which
provides high school teachers a convenient and interactive way to represent Natural Disasters
of the last century. This helps in using it for describing data graphically on a map, by linking
the data to various geographical features. This tool will motivate students to learn
information about the Natural Disasters. It has information in the form of text, pictures, and
links to information pertaining to the disasters. It will also have games to provide students an
opportunity to exercise what they have learned in a fun way. There will also be some practice
quizzes for the students to exercise and it also has the capability to create new
practice/graded quizzes. The application is easy to deploy and use. If one wants to change a
few things, it can be configured manually by making changes to a configuration file.
Making use of interactive technology in the classroom, both instructors and students
can make the learning process fun. The Primary intended use of this application is student
self-study.
vi
TABLE OF CONTENTS
PAGE
ABSTRACT ...............................................................................................................................v
LIST OF TABLES ................................................................................................................. viii
LIST OF FIGURES ................................................................................................................. ix
ACKNOWLEDGEMENTS .......................................................................................................x
CHAPTER
1
INTRODUCTION .........................................................................................................1
2
TECHNOLOGY ............................................................................................................3
2.1 Java ....................................................................................................................3
2.2 MapObjects Java Edition ...................................................................................4
2.2 Development Platform .......................................................................................5
3
THE REQUIREMENTS ................................................................................................6
3.1 Software Platform Requirements .......................................................................6
3.2 Data Requirements .............................................................................................6
3.3 Functional Requirements ...................................................................................7
3.4 Student Centric Requirements ...........................................................................8
4
PROTOTYPING ............................................................................................................9
5
THE DESIGN ..............................................................................................................13
5.1 High Level Architecture Diagram ...................................................................13
5.2 Classes and Class Diagram ..............................................................................14
6
INSTALLATIONS ......................................................................................................18
7
MAPOBJECTS TOOLBARS ......................................................................................21
7.1 Com.esri.mo2.ui.tb.ZoomPanToolBar .............................................................21
7.2 Com.esri.mo2.ui.tb.SelectionToolBar .............................................................22
7.3 Com.esri.mo2.ui.tb.ProjectToolBar .................................................................22
8
PROJECT LAYER ......................................................................................................24
8.1 Com.esri.mo2.ui.bean.Layer ............................................................................24
8.2 Converting CSV or Text File to Shape File .....................................................25
vii
9
FUTURE ENHANCEMENT.......................................................................................30
BIBLIOGRAPHY ....................................................................................................................31
viii
LIST OF TABLES
PAGE
Table 5.1. Importing Classes and Classes Used for Development ..........................................14
Table 7.1. Legend of MapObjects Toolbars ............................................................................21
ix
LIST OF FIGURES
PAGE
Figure 4.1. Project development cycle. ......................................................................................9
Figure 4.2. Interactive world map: Natural Disasters main screen. .........................................10
Figure 4.3. Interactive world map: Natural Disasters disaster screen......................................11
Figure 4.4. Interactive world map: Natural Disasters picture game screen. ............................12
Figure 4.5. Interactive world map: Natural Disasters quiz screen. ..........................................12
Figure 5.1. High level architecture diagram. ...........................................................................13
Figure 5.2. Class diagram for learn more tabs. ........................................................................15
Figure 5.3. Class diagram for gaming tabs. .............................................................................16
Figure 5.4. Class diagram for quiz tabs. ..................................................................................17
Figure 6.1. Library manager. ...................................................................................................18
Figure 6.2. Adding MOJO libraries to NetBeans. ...................................................................19
Figure 6.3. Command prompt showing jar file execution. ......................................................20
Figure 7.1. MapObjects toolbars. .............................................................................................21
Figure 8.1. Starting ArcMap. ...................................................................................................26
Figure 8.2. Adding a reference layer. ......................................................................................26
Figure 8.3. Adding text file as data source. .............................................................................27
Figure 8.4. Displaying XY data. ..............................................................................................27
Figure 8.5. Identifying the XY data. ........................................................................................28
Figure 8.6. Displaying the XY data. ........................................................................................28
Figure 8.7. Exporting the XY data. ..........................................................................................29
Figure 8.8. Saving the exported XY data. ................................................................................29
x
ACKNOWLEDGEMENTS
I would like to express my gratitude to Dr. Carl Eckberg for his expert guidance. His
support has motivated me throughout this endeavor.
I want to thank Dr. Joseph Lewis for providing the opportunity to work on this thesis.
I am grateful to Mr. William Root and Dr. Gary Girty for being a part of my thesis
committee and for their kind co-operation and guidance.
Finally, I would also like to express my gratitude to Mr. Richard Sutton from Helix
High school for trusting me with this project and providing his guidance and co-operation
throughout the project.
1
CHAPTER 1
INTRODUCTION
Over the centuries there have been many methods employed for imparting education
and knowledge transfer, from passing down of knowledge verbally to the use of books, chalk
boards and white boards, and more recently the use of technology such as personal
computers and the internet. Education via visual aid; is a time proven method, and making
the visual aids interactive makes it even better.
The purpose of this thesis is to provide children and teachers with a tool that can aid
in the learning about geographical features such as volcanoes, earthquakes, cyclones and
tsunamis. The topics addressed by the thesis are often known collectively as “Natural
Disasters”. GIS tool provides a method to show these geographical features in a visual format
that is interactive. Children can interact with the tool to explore these features and learn about
them.
Interactive World Map: Natural Disasters tool has been designed to easily navigate
and access information. It exhibits information in bold text and pictures to capture student’s
attention and motivate them to explore further. The tool also incorporates an interactive quiz
to provide the student an opportunity to analyze what they have learned. The tool is flexible
and can be modified easily by tutors. It is a graphic interface tool to help students understand
and learn about the Natural Disasters in a fun but effective way.
ESRI has the most prominent presence in the industry in the field of Geographic
Information System (GIS). The release of MapObjects Java Standard Edition allows
developer to build custom map applications using the open standard Java Programming
language. So the Interactive World Map for Natural Disasters GIS tool has been developed
using Java and MapObjects as a software platform. MapObjects is a suite of Java-based
developer components for creating client or server side mapping and GIS applications [1].
Also NetBeans is used as a Java IDE in which we can compile and run Java programs.
2
This thesis has been organized into nine chapters, the first two chapters concentrate
on explaining the introduction and the technologies I have used for developing the
application. Chapters three and four are about collecting the requirement from Helix High
School and about the prototyping that is used to achieve the final result. In chapters five and
six I have described the class diagram of the tool, how the tool is implemented and then
explained the functionality in brief. Chapters seven shows us the various tools provided by
MapObjects. It dives more into the coding of these tools and explains step by step how it
works. Chapter eight is all about the map layers we are using in the Interactive World Map
for Natural Disasters tool; it shows the step by step creation of a sample layer so in future if
the tool needs to be extended it would be easy to create new layers with more data in it. The
last chapter covers the future enhancement of the Interactive World Map for Natural
Disasters tool.
3
CHAPTER 2
TECHNOLOGY
This chapter discusses the technologies used in the creation of this tool. As suggested
by Dr. Joseph Lewis and Dr. Carl Eckberg, MapObjects Java Edition and Java will be best
suited to implement the Interactive World Map for NaturalDisasters. Java is a platform
independent programming language and MapObjects gels well with Java. The next section
will discuss these technologies in detail.
2.1 JAVA
Platform Independence: Java has the advantage of being platform independent i.e. it
can be moved from one computer system to another [2].
Object Oriented: Java is object-oriented because programming in Java is centered on
creating objects, manipulating objects and making them work together. This allows
the user to create modular programs and re-useable code.
Robust: Robust means reliable. Java puts a lot of emphasis on early checking for
possible errors, as Java compilers are able t o detect many problems that would first
show up during execution time in other languages.
Simple: Java was designed to be easy to use and is therefore easy to write, compile,
debug, and learn. Java is much simpler than other object oriented languages because
Java uses automatic memory allocation and garbage collection where else other
languages like C++ require the programmer to allocate memory and to collect
garbage [2].
Multithreaded: Multithreaded is the capability for a program to perform several tasks
simultaneously within a program. In Java, multithreaded programming has been
smoothly integrated into it, while in other languages, operating system-specific
procedures have to be called in order to enable multithreading. Multithreading is a
necessity in visual and network programming [2].
To give any software component a long life it has to be developed with reusability
and extensibility in mind. From above it is clear that Java enables you to do just that;
the individual classes can be extended and reused to add more features and provide
the capability to identify and fix bugs fast. Because of Java's robustness, ease of use,
cross-platform capabilities, security features it has been chosen as the language of
choice for this thesis project.
4
2.2 MAPOBJECTS JAVA EDITION
MapObjects Java Edition is a powerful collection of client and server side
components that the developers can use to build custom, cross-platform Geographic
Information System (GIS) Applications [3]. MapObjects Java Objects (MOJO) is not an end
user application; it’s a developer’s tool kit. It includes a set of JAR files containing pure Java
components that can be used to develop a usable stand-alone GIS application or to add maps
or map functionality to other applications. Since it is written in Java, applications using
MOJO can be cross platform. Java classes and components are easily integrated with classes
supplied by ESRI in MOJO [4].
Dr. Carl Eckberg also teaches a class at San Diego State University which covers
MapObjects in depth and has published a comprehensive guide on MapObjects. For
implementation of the Interactive World Map for Natural Disasters I have used MapObjects
Java Edition version 2.1.
Key features as cited from the MapObjects Java Edition brochure includes [3, 4]:
Display of real-time geographic data.
Ability to combine multiple data sources.
Helpful Tools for Building a User Interface. By using the rich Swing components
included with MapObjects Java Edition, you can quickly build applications that
include functional toolbars, dynamic symbol control, query dialogs, overview and
insert maps, and intelligent legends that make your custom applications easy to use
and even easier to develop.
Major GIS capabilities such as labeling map features, specifying projection,
displaying thematic map layers, performing geometric processing, zooming and
panning map layers, measuring distances, querying spatial data and creating layouts
etc.
Ability to Deploy Your Applications over the Web. You can easily distribute
MapObjects Java Edition applications over an Internet or Intranet through browser
hosted applets or simplify Web delivery of your application with the use of Sun Java
Web Start technology, the industry standard launching mechanism for distributing
Java applications over the Web.
Access to ESRI’s ArcIMS web services, as well as building map application for
distribution over the Internet through simple applets or JSP and servlets.
In addition to the major feature listed above, MOJO includes many helpful tools in
the development kit. Using swing components of MOJO, you can build Table-ofContents, helpful toolbars, map overview and map legends.
5
2.2 DEVELOPMENT PLATFORM
This part describes the various software applications used in the development of this
application.
Map Objects Java Edition 2.1: Map Objects comes in two editions: Windows and
Java. Here as per our requirement, I have used Map Objects Java Edition.
Java (SE) Development Kit 1.6: This is intended for standard programming
applications.
NetBeans IDE 6.9: It is an IDE for writing, compiling, and running Java programs.
JavaScript and HTML: Used for creating the quizzes. It returns Correct/Incorrect
verdict.
6
CHAPTER 3
THE REQUIREMENTS
This tool has been developed to encourage high school students to learn more about
the various Natural Disasters occurring in the last century. This application has been
developed under the guidance and requirements given by Dr. Joseph Lewis of San Diego
State University and Mr. Richard Sutton from the history department at Helix High School.
The requirements gathered have been classified into the following:
Software Platform Requirements
Data Requirements
Functional Requirements
Student Centric Requirements
3.1 SOFTWARE PLATFORM REQUIREMENTS
The Software Platform Requirements constitutes the development language to be
used, the GIS Solution that needs to be employed and the Operating System to be used for
the development of the tool. These requirements were gathered from Dr. Joseph Lewis. The
GIS tool shall be developed using:
Java
Map Objects Java Edition
Windows XP. This tools need to be platform independent. But I used Windows XP to
develop and test it.
The rationale behind using these technologies has been discussed in depth in
Chapter 2.
3.2 DATA REQUIREMENTS
The Data Requirements for the Interactive World Map for Natural Disasters were
collected from Mr. Richard Sutton from Helix High School. The Data Requirements
specified what data should be provided in the tool. How this data is provided is covered
7
under the functional and student centric requirements. Mr. Sutton and I selected 8 major
Natural Disasters. Each Disaster will cover the following topics:
Name(s) of the disaster
A description of the disaster
When did the disaster take place? E.g. start and end date (sometimes with the time of
the day)
Where did the disaster take place?
Causes of the disaster
Main Events taking place during the disaster
Casualties due to the disaster
Consequences of the disaster
Images of the disaster
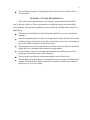
3.3 FUNCTIONAL REQUIREMENTS
The functional requirements cover the functional details of the tool and specify what
shall be provided in the tool, the behavior of the tool to different actions and other GUI
requirements. These requirements were gathered from Mr. Richard Sutton and Dr. Joseph
Lewis.
The tool shall display the world map with the selected disaster on it when it first
starts.
The tool shall be able to zoom in and zoom out and should be capable of adding new
layers during runtime e.g. rivers, cities etc.
Hot Links: This feature displays a webpage, which contains the summary of the
disaster, by clicking on the Disaster point on the world map.
Hyperlink: This tool should allow the user to go to external links over the internet to
learn more about the disaster.
This tool should have a game which requires the user to click the country
corresponding to the disaster. This will help the user to test his knowledge about the
data that he has seen.
A picture game to learn about the disasters.
Quiz: There will be an option for the teacher to create quizzes and for the students to
take them. The quiz will be helpful to measure a student’s knowledge regarding a
disaster. The quiz should be interactive so that it gives a Correct/Incorrect verdict.
The teacher has the option to create a graded or practice quiz in the form of multiple
choice questions.
8
The tool should be capable of labeling the disaster sites also user should be able to
clear the labels.
3.4 STUDENT CENTRIC REQUIREMENTS
The student centric requirements are developed to represent how the data shall be
seen by the user of the tool .These requirements were gathered keeping in mind the high
school students. The requirement gathering was done under Mr. Richard Sutton from Helix
High School.
The Interactive World Map for Natural Disasters should be easy to use, handle and
configure.
Since the intended audience for this tool is high school students who don’t have much
experience using a tool similar to this, this tool should be easy to learn. Providing tool
tip text will enable a student to learn this tool faster.
The language used to describe the summary and other facts of each disaster should be
simple and easy so that high school students can understand it.
Usage of images and games will attract the attention of the student and he will be
encouraged to learn more about Natural Disasters.
The text used to represent the information should be neat, bold and clear.
The tool shall represent the data in a format that does not overwhelm and intimate the
students. The data shall be depicted with the least amount of details first and then it
shall be easy to view more details.
9
CHAPTER 4
PROTOTYPING
Prototyping the development cycle of your project helps in reducing the risk during
implementation of the software tool. A prototype is an original type, form, or instance of
something serving as a typical example, basis, or standard for other things of the same
category. A prototype is often used as part of the product design process to allow engineers
and designers the ability to explore design alternatives, test theories and confirm performance
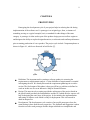
prior to starting production of a new product. The project cycle include 5 important phases as
shown in Figure 4.1, which are discussed in brief below [5].
Figure 4.1. Project development
cycle.
Definition: The important task in creating a software product is extracting the
requirements or requirements analysis. A clear definition of requirements is essential
in designing the tool. We already discussed the requirement gatherings in an earlier
section. The final output of this phase is that you will have a problem set defined to
work on in this case it was an Interactive Map for Natural Disasters.
Design: This steps involves coming up with the architecture of the project based on
the specification provided, the functionalities and the GUI which the user expects will
help in designing the outer layer of the project. It also includes the implementation
and testing of software code which is ready for deployment. This is discussed in
detail in chapter five
Development: The development cycle consists of successful prototypes where the
actual testing is done from the user perspective. The feedback and suggestion is taken
from the user after each prototype and the design redefined to accomplish the end
10
result. This process goes on until the project is ready to deliver. I found this process
very helpful to keep track of the requirements and implementation of the project.
Deployment: The actual deployment starts after the code is appropriately tested and
all other aspects of the project including documentation, has been taken care of. We
have created User Manual for the software.
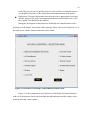
During the development of the Interactive World Map for Natural Disasters tool a
prototype was developed. Screen shots of the prototype follow. The screen in Figure 4.2 is of
the main screen which is launched when the tool is started.
Figure 4.2. Interactive world map: Natural Disasters main screen.
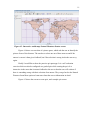
Figure 4.3 is the configured screen of Interactive World Map for Natural Disasters
with one of the disasters chosen which includes the labeled disaster and the country with a
menu bar showing various options.
11
Figure 4.3. Interactive world map: Natural Disasters disaster screen.
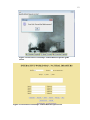
Figure 4.4 shows a screen shot of a picture game, which asks the user to identify the
picture of one of the disasters. The user has to select one out of three answers and if the
answer is correct it then gives feedback, but if the selection is wrong it asks the user to try
again.
Finally I would like to show the practice quiz prototype. It is a self evaluation
exercise which can also be configured as a graded quiz while creating the quiz. It is
interactive in the sense that it returns feedback to the user so that the user will evaluate if
there is something wrong with their selection of an answer. They can go back to the Natural
Disasters Learn More option to learn more about the correct information in detail.
Figure 4.5 shows the screen to create quiz, and a sample quiz screen.
12
Figure 4.4. Interactive world map: Natural Disasters picture game
screen.
Figure 4.5. Interactive world map: Natural Disasters quiz screen.
13
CHAPTER 5
THE DESIGN
After collecting the requirements for the project, the following design was proposed.
The tool has been names as Interactive World Map: Natural Disasters. The design created
includes the High Level Architecture diagram and the Class diagram.
5.1 HIGH LEVEL ARCHITECTURE DIAGRAM
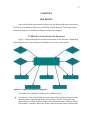
Figure 5.1 depicts the high level architecture diagram for the Interactive World Map:
Natural Disasters tool. The figure depicts the high level structure of the system.
Figure 5.1. High level architecture diagram.
The architecture is broadly divided into three different levels:
User Interface: This is the default map screen that will be displayed to the user when
the application is launched and the user has selected a disaster. The default map
screen shall have Menu options to display and clear disaster names, add user facility,
Help Window, Option to change the disaster, Map Object and custom toolbars and a
14
menu with buttons to launch the Picture Game, Create Quiz, Take Quiz, Learn More,
Learn from Internet.
Map Objects and Java Classes: The functionality and the action of all the above
buttons, custom toolbar and default GIS toolbars are defined in the java classes
created. Further discussion about the class diagrams and java classes will be done
later.
Resources files: The default user interface uses the above classes for accessing the
different resource files such as shape files, images, text files and help documentation.
5.2 CLASSES AND CLASS DIAGRAM
The class diagram helps in streamlining the overall code and its structure; it also
provides the developer a stencil to use for code development. A class diagram shows the set
of variable and functions present in the class. It also explains the interdependency of classes
used for the development. Table 5.1 [1, 6] shows the base class Disaster and its imported
classes.
Table 5.1. Importing Classes and Classes Used for Development
Importing Classes
Classes Used for Development
import javax.swing
JButtons, JPanel, JSplitPane, JToolBar, ImageIcon,
JMenuBar, JMenuItem, AbstractTableModel,
TableColumn
import com.esri.mo2.ui.bean
Map, Layer, Toc, TocAdapter, TocEvent, Legend, Tool
import com.esri.mo2.ui.tb
ZoomPanToolBar, SelectionToolBar, ProjectToolBar
import com.esri.mo2.file.shp
ShapefileFolder, ShapefileWriter
import com.esri.mo2.map.dpy
Layerset, FeatureLayer, BaseFeatureLayer
Source: ACHAL SHAH, Man made disasters GIS teaching aid, Master’s thesis, San Diego State University, San
Diego, CA, 2012.
The classes shown in Table 5.1 have been used for completing the basic functionality
provided by MapObjects in the Interactive World Map: Natural Disasters project. After
initializing the tool parameter using config file, shape files and image files, the Interactive
World Map: Natural Disasters tool is launched and the above classes enable the basic GIS
tool functionality.
There are other functionalities which are triggered using the buttons present on the
Interactive World Map: Natural Disasters tool. These buttons basically give the simplest way
15
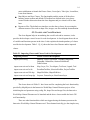
to interact with the tool and learn about the various Natural Disasters. Figure 5.2 highlights
the buttons and the class invoked by the buttons. Let’s discuss it in detail.
Figure 5.2. Class diagram for learn more tabs.
The Learn More Button creates an object of class Hotlink which implements the
PickListener Interface of MapObjects. A Pick "operation" occurs when a Tool such as Pick
or Identify is selected. In this case it occurs after the Learn More button is clicked, and the
end-user clicks in the Map. An initial beginPick() will be signaled, followed by zero or more
foundData() with a final endPick() to signal the completion of the Pick operation.
After creating the object when the user clicks on a disaster a custom dialog pops up
and shows the user detailed description of the disaster including pictures.
The Learn More from Internet button creates an object of class Hyperlink and it also
implements the PickListener interface of MapObjects. After creating the object by clicking
on the button when the user clicks on one of the disaster the foundData() method looks inside
the .dbf file of the active layer and sets the string url value corresponding to the disaster. We
16
then use the following piece of code in java to launch the external URL using the default
browser.
Runtime.getRuntime().exec("rundll32 url.dll,FileProtocolHandler " + url);
Figure 5.3 shows the block diagram of the game buttons in the tool.
Figure 5.3. Class diagram for gaming tabs.
The Play and Learn button when it is clicked the button listener creates an object of
class PlayNLearn which again implements the PickListener interface from MapObjects.
When the button is clicked it also invokes a dialog box asking the user a question about the
disaster. The user then has to respond to the question by selecting one of the options
provided, followed by selecting the country where the disaster took place. If the user is right
we verify the answer using the PickListener method and provide a feedback in the form of a
dialog box.
After clicking on The Picture Game button a dialog box pops up with an image of one
the disasters that the student has learned from the list of disasters and shows three options on
the screen. One of the random images is selected from the Images folder and it’s drawn on
17
the panel of the dialog window using the DrawImage Class. If the user selects the right
answer, a feedback is provided in the form of a dialog box displayed on the screen.
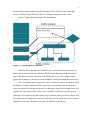
Figure 5.4 shows the block diagram for Quiz Buttons.
Figure 5.4. Class diagram for quiz tabs.
When the Take a Quiz button is clicked by the user a Quiz selection menu pops up.
Once a quiz is selected related to a disaster a HTML Page is displayed which contains the
quiz for the disaster selected. The name of the HTML page is set in the configuration file,
which can be changed if a new quiz is created using the Create Quiz button discussed below.
The Create Quiz button is meant for faculty to design new quizzes for students. When
this button is clicked it launches a HTML page based on JavaScript which is then used to
create a new quiz. For each question faculty can add images, hyper link, multiple choice and
feedback for every answer clicked. There is the capability of making it a practice quiz or
graded quiz. For a practice quiz the student will get feedback with every answer clicked, and
for a graded quiz the faculty has to enter an email address where all the answers are sent after
completion of the quiz. The student won’t get any feedback in graded quiz.
18
CHAPTER 6
INSTALLATIONS
The project was developed in Java, edited and compiled in NetBeans IDE (Integrated
Development Environment). NetBeans works really well with MapObjects when appropriate
libraries are added.
The following installations were done to build and run the project:
1. Install Java (SE) Development kit 1.6 from sun java website [7].
2. Install NetBeans IDE 1.0.6 from their website [8].
3. The Installation of MapObjects Java Edition was obtained from Dr. Carl Eckberg in
one of his classes on GIS.
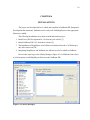
4. Integrating MapObjects and NetBeans, the libraries need to be added to NetBeans.
Here are the steps to go to the Library Manager (Figure 6.1) in NetBeans from where
we find an option to add MapObjects libraries to the NetBeans IDE.
Figure 6.1. Library manager.
19
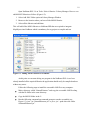
Open NetBeans IDE / Go to Tools / Select Libraries / Library Manager. Here we can
add MOJO23 libraries as follows (Figure 6.2):
1. Select Add JAR/ Folder option in Library Manager Window
2. Browse to the location where you have all the MOJO libraries
3. Select all the libraries and add them
This will add all the MOJO libraries to NetBeans IDE that are required to integrate
MapObjects into NetBeans which is mandatory for my project to compile and run.
Figure 6.2. Adding MOJO libraries to NetBeans.
At this point we can start editing our program in the NetBeans IDE. As we have
already installed all the required libraries the application should easily be complied and run
without any errors.
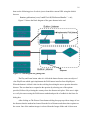
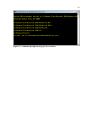
Follow the following steps to install the executable JAR file to any computer:
Make a directory called “NaturalDisasters” and copy the executable JAR file along
with the lib folder in the same directory.
Copy the MOJ20 folder in the C:
Run the following command on command prompt to run the executable (see
Figure 6.3): java –jar “NaturalDisasters.jar” or java –jar “..path where the folder
is\NaturalDisasters.jar”.
20
Figure 6.3. Command prompt showing jar file execution.
21
CHAPTER 7
MAPOBJECTS TOOLBARS
MapObjects Java Edition provides multiple beans which can be used to add basic
capabilities to the tool. Toolbars are one of these beans which can provide commonly used
functions such as zoom in, zoom out easily. This chapter discusses how these toolbars
(Table 7.1 [1, 6]) have been integrated into the GIS tool. We have used code to show how
this can be achieved. The Toolbar is shown in Figure 7.1.
Table 7.1. Legend of MapObjects Toolbars
Number
Toolbar Name
Class Name
1
Zoom Pan Tool Bar
com.esri.mo2.ui.tb.ZoomPanToolBar
2
Selection Tool Bar
com.esri.mo2.ui.tb.SelectionToolBar
3
Project Tool Bar
com.esri.mo2.ui.tb.ProjecToolBar
Source: ACHAL SHAH, Man made disasters GIS teaching aid, Master’s thesis, San Diego State
University, San Diego, CA, 2012.
Project Tool Bar
Zoom Pan Tool Bar
Figure 7.1. MapObjects toolbars.
Selection Tool Bar
7.1 COM.ESRI.MO2.UI.TB.ZOOMPANTOOLBAR
The ZoomPanToolBar uses functions provided by ZoomPanToolBarActions class. It
allows an end-user to change the map extent in a variety of ways. As the name suggest it is
used for zooming and panning a layer. The actions supported by the Toolbar include:
Zoom In and Zoom Out – Zoom In tool zooms the map down to certain level. Also
Zoom out tool is used to zoom the map out to larger size.
ZoomToFull Extent – When clicked on, this tool returns the map to the original shape
and full view. It doesn’t care about the size of the window; it resizes the map and
shows a complete view of the map.
22
Pan - Provides a tool for dragging the map to a new location without altering the
zoom level.
PanOneDirection - Pans the map in one of four directions, north, south, east, or west.
Identify - Performs an Identify on the specified "selected" layers.
setMap() function must be called before using any of these actions. The code to
integrate the toolbar with the GIS tool is:
static com.esri.mo2.ui.bean.Map map = new com.esri.mo2.ui.bean.Map();
ZoomPanToolBar zptb = new ZoomPanToolBar();
zptb.setMap(map);
getContentPane().add(zptb, BorderLayout.NORTH);
7.2 COM.ESRI.MO2.UI.TB.SELECTIONTOOLBAR
This toolbar provides functions that perform feature selection based upon attribute or
spatial queries. The actions supported by this Toolbar include:
Find - Opens a dialog for locating features whose attributes contain an end-user
provided string.
Search - Opens a dialog for locating features based on a predefined "stored query".
Query - Opens a dialog for locating features based on a query that an end-user
constructs.
Select - Provides a tool for selecting features by rubber banding a shape in the map.
Buffer - Opens a dialog for constructing a buffer polygon around the currently
selected features.
Attributes - Displays attributes of the currently selected features.
setMap() function must be called before using any of these actions. For GIS tool we
are only using the Find function. The code to integrate the toolbar with the GIS tool is:
static com.esri.mo2.ui.bean.Map map = new com.esri.mo2.ui.bean.Map();
SelectionToolBar stb = new SelectionToolBar();
stb.setMap(map);
getContentPane().add(stb, BorderLayout.NORTH);
7.3 COM.ESRI.MO2.UI.TB.PROJECTTOOLBAR
This toolbar provides actions that allow an end-user to open, close, save a map project
and print a map image to file the actions supported by this Toolbar include [9]:
OpenProject - Open a previously saved project file.
SaveProject - Save the current map project to a file.
CloseProject - Close current map project.
23
SaveMapImageToFile - Save current map to an image file.
PrintLayer - Print selected layer(s) in the TOC.
The setMap() function must be called before using any of these actions. The code to
integrate the toolbar with the GIS tool is:
static com.esri.mo2.ui.bean.Map map = new com.esri.mo2.ui.bean.Map();
ProjectToolBar ptb = new ProjectToolBar();
ptb.setMap(map);
getContentPane().add(ptb, BorderLayout.NORTH);
24
CHAPTER 8
PROJECT LAYER
In GIS a layer is a slice of the geographic data in a certain area and it is equivalent to
a legend item on a paper map. The features layers that are shown in the tool are implemented
using com.esri.mo2.map.dpy.BaseFeatureLayer class and com.esri.mo2.ui.bean.Layer class.
8.1 COM.ESRI.MO2.UI.BEAN.LAYER
The com.esri.mo2.ui.bean.Layer class from MapObjects Java Edition is used in the
default screen when the tool is launched to show the geographic data. This class uses a shape
file as the data source for showing the features and calls a method to add layers to the map.
The following code [9] shows how to use this class:
static com.esri.mo2.ui.bean.Map map = new com.esri.mo2.ui.bean.Map();
Layer layer1 = new Layer();
Layer layer2 = new Layer();
String s1,s2;
Properties configFile = new Properties();
configFile.load(new FileInputStream("config.properties"));
config =configFile.getProperty("config");
s1=config =configFile.getProperty("s1");
s2=config =configFile.getProperty("s2");
addShapefileToMap(layer1,s1); //Add a shapefile to the map
addShapefileToMap(layer2,s2);
……
……
private void addShapefileToMap(Layer layer, String s) {
String datapath = s;//C:/ESRI/MOJ20/Samples/Data/USA/states.shp
layer.setDataset("0;"+datapath);
map.add(layer);}
The details on the shape files can be found at [10]. The shape files which are used by
the com.esri.mo2.ui.bean.Layer class were created or acquired using the following ways.
The first way is: there are a lot of sources which create the geographic data as shape
files and distribute these files for free. The shape file showing the states of USA and
countries of the world as a world map was procured from the ESRI website.
25
8.2 CONVERTING CSV OR TEXT FILE TO SHAPE FILE
The second way is to create a CSV or text file with geographic data and then use the
steps mentioned below to convert it into a shape file. Comma Separated Values or CSV files
are used as data container files. They contain all the information that the project needs to plot
the region where the movements took place. The CSV files contains the information such as
coordinates in the form of latitudes and longitudes, the path of the image or the html file or
the details of the action that need to be taken when the point is clicked on the map. It stores
all the description about that active layer. Thus all information is fetched in the program and
stored in the string variables and accordingly actions are taken. The information stored in the
CSV file is displayed in the web browser. Hence, CSV files have been used in this project for
the same. It can be saved either with .csv or .txt extension [11].
Install ArcGIS 9. Contact Geography Department at SDSU for the installation CD.
Create a text file or CSV file with the data needed: Longitude, Latitude, Name of
Disaster, Link to Summary of Disaster.
Save the file as sample.txt or sample.csv.
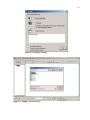
Go to the ArcGIS installation directory and launch ArcMap. Click Start with a new
map. See Figure 8.1.
Press the add button and select states.shp file for reference view. Press Add. See
Figure 8.2.
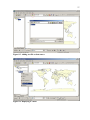
Press the add button again and select sample.txt file. Press Add. See Figure 8.3.
Right click on sample.txt and select Display XY Data…See Figure 8.4.
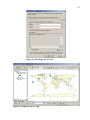
Make sure the X,Y have been correctly identified. Press OK. See Figure 8.5.
Check that the data added is shown in the map on the right correctly. See Figure 8.6.
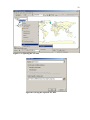
Right click on the sample.txt. Select Events and select Data->Export Data…See
Figure 8.7.
Save the file as SHP file. Press OK. See Figure 8.8.
You now have a shape file which can be used with MapObjects
com.esri.mo2.ui.bean.Layer class.
26
Figure 8.1. Starting ArcMap.
Figure 8.2. Adding a reference layer.
27
Figure 8.3. Adding text file as data source.
Figure 8.4. Displaying XY data.
28
Figure 8.5. Identifying the XY data.
Figure 8.6. Displaying the XY data.
29
Figure 8.7. Exporting the XY data.
Figure 8.8. Saving the exported XY data.
30
CHAPTER 9
FUTURE ENHANCEMENT
This project has a huge scope. But it was impossible to cover everything in the first
version of the software. This project has a huge degree for further development. This chapter
focuses on these ideas for future development of the project. The framework is designed in
such a way that it can be expanded to support more features and use cases. As we have used
object oriented JAVA as the programming language it’s easy to write code for adding extra
features in the tool.
Some of the future enhancements proposed are:
Only a few Natural Disasters have been included in this tool. It can be extended to
add a lot more.
Videos related to the disasters can be included to make it more interactive and
entertaining.
The scope of the project as of now is to deploy it on the student computers for them to
learn about the Natural Disasters in more detail. But in future it can be used as a Web
Based application where a student can access this application through the internet at
his own convenience without having to install this application on his or her computer.
We can a add time for solving the quizzes and allotting the points based on how quick
the question is solved.
More interactive games and puzzles can be added to make learning more enjoyable
and animated.
Currently we only have Wikipedia links to each disaster. We can add more data
information to the project. This includes links to different web pages on the internet
providing more information on a disaster to the student.
31
BIBLIOGRAPHY
WORKS CITED
[1]
ACHAL SHAH, Man made disasters GIS teaching aid, Master’s thesis, San Diego State
University, San Diego, CA, 2012.
[2]
CARL ECKBERG. CS 537: Component GIS architecture class notes on mapobjects java
edition, San Diego State University, San Diego, CA, 2010.
[3]
CAY S. HORSTMANN AND GARY CORNELL, Core Java, Volume 1 – Fundamentals,
Prentice Hall, Upper Saddle River, New Jersey, 2007.
[4]
CAY S. HORSTMANN AND GARY CORNELL, Java, Volume 2 – Advanced Features,
Prentice Hall, Upper Saddle River, New Jersey, 2008.
[5]
D. FALKMAN, Map objects java edition.
http://www.thaigis.com/Support/document/mo_java_bro.pdf, accessed January 2012,
2004.
[6]
ENVIRONMENTAL SYSTEMS RESEARCH INSTITUTE, ESRI shapefile technical description
- ESRI white paper. ESRI, http://www.esri.com/library/whitepapers/pdfs/shapefile.pdf,
accessed January 2013, 1998.
[7]
ENVIRONMENTAL SYSTEMS RESEARCH INSTITUTE, MapObjects java edition 2.0.1
programmer’s reference help, ESRI Press, Sacramento, California, 2004.
[8]
ENVIRONMENTAL SYSTEMS RESEARCH INSTITUTE, Map objects, java edition. ESRI,
http://www.esri.com/software/mapobjects/, accessed September 2011, 2004.
[9]
ENVIRONMENTAL SYSTEMS RESEARCH INSTITUTE, ESRI building applications with map
objects. ESRI, http://forums.arcgis.com, accessed September 2011, 1996.
[10] LYN MALONE, ANITA PALMER, AND CHRISTINE VOIGT, Mapping our world - GIS
lessons, ESRI Press, Sacramento, California, 2002.
[11] CHANGAN SHI AND ENVIRONMENTAL SYSTEMS RESEARCH INSTITUTE, Mapobjects –
Java developer’s guide, ESRI Press, Redlands, California, 2003.
WORKS CONSULTED
NetBeans IDE 6.0.1 download. Netbeans, http://dlc.sun.com/netbeans/6.0/final/, accessed
May 2012, 2011.
Java SE downloads. Oracle, http://java.sun.com/javase/downloads/, accessed January 2013,
2011.
KEN ARNOLD, AND JAMES GOSLING, Java programming language, 2nd ed., Addison-Wesley,
New York, 1998.
Software development process. Wikipedia, http://en.wikipedia.org/wiki/Software
_development_process, accessed January 2013, 2013.
32
Java advantages and disadvantages. WebDotDev, http://www.webdotdev.com/nvd/
content/view/1042/204/, accessed January 2013, 2007.