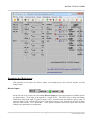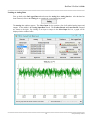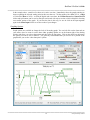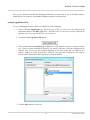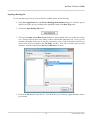
1
ProView
TM
for ProControl Series 2plus
USER’S GUIDE
Version 2.2x
EOS Research, Ltd.
ProView 2.2x User’s Guide
__________________________________________________________
LICENSE: EOS Research, Ltd. grants you the right to use the enclosed program (the “Software”). You will not use, copy, modify, rent, sell
or transfer the Software or any portion thereof except as provided for in this agreement.
You may:
1.
2.
Use the software on up to two computers
Copy the software solely for backup or archival purposes
RESTRICTIONS: You will not:
1.
2.
3.
4.
5.
Use the Software or cause the Software to be used on more than two computers at the same time.
Sub-license the Software.
Reverse engineer, decompile or disassemble the Software
Copy the Software except as provided in this agreement.
Permit simultaneous use of the Software by more than two users.
TRANSFER: You may transfer ownership of this license to another party if the receiving party agrees to the terms of this Agreement and you
retain no copies of the Software and accompanying documentation.
Transfer of the license terminates your right to use the Software.
OWNERSHIP AND COPYRIGHT OF SOFTWARE: Title to the Software and all copies thereof remain with EOS Research Ltd. or its
vendors. The Software is copyrighted and is protected by United States copyright laws and international treaty provisions. You will not
remove the copyright notice from the Software. You agree to prevent any unauthorized copying of the Software.
WARRANTY: EOS Research, Ltd. warrants that it has the right to license you to use the Software.
EOS Research, Ltd. warrants that the media on which the Software is furnished will be free from defects in materials and workmanship under
normal use for a period of one year from the date of purchase. EOS Research, Ltd.’s entire liability and your exclusive remedy shall be the
replacement of the Software if the media on which the Software is furnished proves to be defective. This warranty is void if the media defect
has resulted from accident, abuse or misapplication. Any replacement of media shall be warranted for the remainder of the original warranty
period or 90 days, whichever is longer.
DISCLAIMER: Except as provided above, the Software is provided “AS IS” without warranty of any kind.
LIMITATION OF LIABILITY: THE ABOVE WARRANTIES ARE THE ONLY WARRANTIES OF ANY KIND, EITHER EXPRESSED
OR IMPLIED, INCLUDING WARRANTIES OR MERCHANTABILITY AND FITNESS FOR A PARTICULAR PURPOSE. NEITHER EOS
RESEARCH, LTD. OR ITS VENDORS SHALL BE LIABLE FOR ANY LOSS OF PROFITS, LOSS OF USE, INTERRUPTION OF
BUSINESS, NOR FOR INDIRECT, SPECIAL, INCIDENTAL, OR CONSEQUENTIAL DAMAGES OF ANY KIND WHETHER UNDER
THIS AGREEMENT OR OTHERWISE.
AUDIT: EOS Research, Ltd. reserves the right to conduct or have conducted audits to verify your compliance with this Agreement.
TERMINATION OF THIS LICENSE: EOS Research, Ltd. may terminate this license at any time if you are in breach of any terms or
conditions. Upon termination, you will immediately destroy the Software or return all copies of the Software to EOS Research Ltd. along with
any copies you have made.
U.S. GOVERNMENT RESTRICTED RIGHTS: The Software and documentation are provided with “RESTRICTED RIGHTS.” Use,
duplication, or disclosure by the U.S. Government is subject to restrictions as set forth in FAR52-227-14 and DFAR252-227-7013 et seq or its
successor.
EXPORT LAWS: You agree that neither the Software nor the direct product thereof is intended to shipped either directly or indirectly to
foreign countries unless a validated export license is obtained from the U.S. Department of Commerce.
APPLICABLE LAWS: This Agreement is governed by the laws of the State of New Hampshire and the United States, including patent and
copyright laws. Any claim arising out of this Agreement will be brought in Strafford County, New Hampshire.
__________________________________________________________
8100\pv220man\pv220man
ProView 2.2x User’s Guide
__________________________________________________________
EOS RESEARCH, LTD.
SOFTWARE LICENSE AGREEMENT
By using this Software you are agreeing to be bound by the terms of this Agreement. Do not use the
Software until you have carefully read and agreed to the preceding terms and conditions. If you do
not agree to the terms of this agreement, promptly return this document and any accompanying
items.
Information in this document is subject to change without notice and does not represent a commitment on
the part of EOS Research, Ltd. No part of this manual may be reproduced or transmitted in any form or by
any means, electronic or mechanical, including photocopying and recording, for any purpose without the
express written consent of EOS Research, Ltd.
© 1995-2015 EOS Research, Ltd. All rights reserved. Printed in the United States of America.
ProView and ProControl are trademarks of EOS Research, Ltd.
Windows and Excel are trademarks of Microsoft Corporation.
EOS Research, Ltd.
159 Walnut Street
Rochester, NH 03867
Voice: 603.332-2099
FAX: 603.332-2727
Email: [email protected]
__________________________________________________________
8100\pv220man\pv220man
ProView 2.2x User’s Guide
__________________________________________________________
TABLE OF CONTENTS
CHAPTER 1: INTRODUCTION AND INSTALLATION ........................................... 1!
Introduction to PROVIEW ................................................................................................................... 1!
System Requirements......................................................................................................................... 1!
How to Install ProView ..................................................................................................................... 2!
Running ProView............................................................................................................................... 3!
A Word About Changing Settings ..................................................................................................... 4!
CHAPTER 2: GETTING STARTED ....................................................................... 5!
Opening a Site File............................................................................................................................. 5!
Examining the Main Screen ............................................................................................................... 7!
Printing the Setup to File ................................................................................................................... 9!
Examining the Setup File ................................................................................................................. 10!
Input and Output Configuration ....................................................................................................... 12!
Process Tasks ................................................................................................................................... 13!
Process Capability............................................................................................................................ 14!
CHAPTER 3: ESTABLISHING COMMUNICATION ............................................. 16!
On-Site Local Connection................................................................................................................ 16!
Dial-Up Remote Connection............................................................................................................ 19!
Cellular Data Connection ................................................................................................................. 20!
Ethernet Connection......................................................................................................................... 20!
Ending a Connection ........................................................................................................................ 20!
Sending a Memo .............................................................................................................................. 21!
CHAPTER 4: MANAGING YOUR SITE............................................................... 23!
Switching Between System Modes.................................................................................................. 23!
System Operations ........................................................................................................................... 24!
Date & Time ............................................................................................................................................................. 24!
Alarms ...................................................................................................................................................................... 25!
Remote Reporting ..................................................................................................................................................... 25!
Log Off Remote User ............................................................................................................................................... 25!
Initiate FAX NOW! .................................................................................................................................................. 25!
Initiate New FAX NOW! ......................................................................................................................................... 26!
__________________________________________________________
i
8100\pv220man\pv220man
ProView 2.2x User’s Guide
__________________________________________________________
CHAPTER 5: CHANGING SYSTEM PARAMETERS ............................................ 27!
Switching an Output State ............................................................................................................... 27!
Process Groups ......................................................................................................................................................... 27!
Output Cycle ............................................................................................................................................................. 28!
Output Options ......................................................................................................................................................... 28!
Notes ................................................................................................................................................ 29!
Analog Alarm Levels ....................................................................................................................... 29!
Site Information ............................................................................................................................... 32!
FAX Report Setup............................................................................................................................ 32!
Texting/Paging Setup ....................................................................................................................... 34!
Email Set-Up for Cellular Data and Ethernet Units......................................................................... 36!
Datalogging Setup............................................................................................................................ 37!
Changing the Password .................................................................................................................... 39!
Analog Output Options .................................................................................................................... 40!
Process and Instrumentation Diagram ............................................................................................. 43!
CHAPTER 6: WORKING WITH LOGGED DATA ................................................ 45!
Hour Meters ..................................................................................................................................... 45!
Totalizers.......................................................................................................................................... 46!
Trend Graphing ................................................................................................................................ 46!
Downloading Logged Data .............................................................................................................. 47!
Getting Logged Data ................................................................................................................................................ 48!
Looking at Discrete Data .......................................................................................................................................... 50!
Looking at Events Data ............................................................................................................................................ 51!
Looking at Analog Data ........................................................................................................................................... 52!
Saving Logged Data to File ...................................................................................................................................... 54!
Opening a Datalog File ............................................................................................................................................. 55!
Exporting Logged Data for use in Other Applications ............................................................................................. 56!
CHAPTER 7: OTHER OPERATIONS .................................................................. 58!
Saving the Site Configuration to File............................................................................................... 58!
Printing the Current Data to File ...................................................................................................... 59!
Reviewing the Process Configuration .............................................................................................. 61!
Annunciators .................................................................................................................................... 62!
Exiting ProView............................................................................................................................... 63!
__________________________________________________________
ii
8100\pv220man\pv220man
ProView 2.2x User’s Guide
__________________________________________________________
CHAPTER 1: INTRODUCTION AND INSTALLATION
T
his chapter provides a brief introduction to ProView features, system requirements for running the
program, and instructions for installing it.
Introduction to PROVIEW
ProView is a powerful but straightforward software package used in conjunction with the ProControl system
to provide integrated stand-alone control and remote monitoring for your operation. ProView versions 2.1
and higher can serve as an on-site or remote human-machine interface (HMI) for the Series 2plus ProControl.
With ProView you can:
Monitor system sensors
Control equipment that are outputs on the ProControl
Change the way the system operates
View and change system setpoints, alarm levels, etc.
Extract and review datalogged system information
In short, ProView can be used to remotely gain the same level of control over your operation as if you were at
the site. Although many system parameters can be set with the ProControl’s display and keypad (if included),
ProView allows a more comprehensive, easy-to-access view into system operations.
In order for ProView to function, your PC must be connected to the ProControl unit. It can be connected in
one of two ways. The first way is locally with a cable (provided with your ProControl system) that connects
your PC’s serial port with the ProControl unit. This method of connection is most often used at the system
site using a laptop PC. The second method is remotely via dial-up modem, Ethernet connection, or cellular
data connection (depending on your unit) from your office or from anywhere that a connection to the
telephone system (for dial-up systems) or internet (for Ethernet and cellular data systems) can be established.
You should be familiar with the operation of the ProControl unit and have read the ProControl
User Manual before using ProView.
System Requirements
COMPUTER: You will need a PC or compatible with Microsoft Windows XP or later. A minimum of
10MB of Hard Disk space needs to be available. A mouse or similar pointing device is also required.
!
Several functions in ProView require the use of the right mouse button. Make sure the right mouse
button is not assigned to some other function such as double-click. See your mouse driver software
for details.
__________________________________________________________
1
8100\pv220man\pv220man
ProView 2.2x User’s Guide
__________________________________________________________
MODEM (for dial-up connections): You need a Hayes compatible (AT) Modem that supports a data rate of
9600 baud (this means almost any commonly-available modem). The modem can be external or internal. It
must be assigned to COM Port 1, 2, 3 or 4.
!
Some PCs have been supplied with so-called “WinModems” or “SoftModems”, which are not true
hardware modems and will not work with ProView for communication with a ProControl system. A
true Hayes-compatible hardware modem is an inexpensive investment in reliable communications.
SERIAL PORT REDIRECTOR (for Ethernet and cellular data connections): An Internet Protocol (IP)
connection is used to connect to your ProControl unit, and IP is also used to provide outgoing email and text
messaging capability for status and alarm reporting (please note that fax reporting is not available with this
version). Third party software is required to create a virtual serial port (COM port 1, 2, 3, or 4) on your
computer for connection to the static IP addess of the ProControl over the internet. Please refer to either the
Ethernet or Cellular Data Quick Start Guide as applicable for more details.
How to Install ProView
1. Close all open programs before beginning the ProView installation procedure. Close any task bars for
software packages like Microsoft Office that may be lurking at the edge of your screen. If a ProView
installation fails, it is almost always the result of having other programs open at the time of installation.
Certain programs, when included in the Windows Startup group, may cause the ProView installation to
fail, and must be removed temporarily from the Startup group prior to installing ProView.
2. Go to our website at www.eosresearch.com, click on the ProView tab at the top, then under Downloads at
the bottom of the page click on ProView_2.2xx.exe to download the executable to your computer (be sure
to make note of the save location).
3. Go to the location of the saved file, double click on it to start the installation.
4. The ProView installation program will begin and will guide you through the rest of the installation
process.
You will also be provided with configuration files (or site files) for every ProControl unit you need to access.
At a minimum, you will have a configuration file with a “.pvs” extension and one with a “.not” extension
(these are normally supplied pre-configured for you by EOS or your system integrator). Using Windows
Explorer, copy these site files to the folder in which your ProView software was installed for ease of access.
Depending on your site configuration, you may have other files included along with the two standard site
files. The files will have the extensions of .pid or .pvg. You must copy these files to the ProView folder as
well.
When the installation is complete, you will see the ProView program group and icon. We recommend
making a shortcut to ProView that you can then move to your Windows desktop. Right-click on the ProView
turtle icon in the program group, then click on Create Shortcut. Drag your new shortcut to a prominent
position on your Windows desktop.
__________________________________________________________
2
8100\pv220man\pv220man
ProView 2.2x User’s Guide
__________________________________________________________
Running ProView
After installing ProView as described above, double-click on the ProView icon. After an introduction screen,
you will see the ProView Main screen.
The main screen contains a series of pull-down menus and a Toolbar that provides shortcut buttons for
commonly-used commands. Placing the cursor over a Toolbar button and leaving it there for a short while
produces a “balloon”. A balloon is a small pop-up message that describes the action to be taken if the
Toolbar button is “pushed”.
Right now, since no site file has been loaded, the main screen is blank, and the toolbar is disabled. All menus
except the File menu have been “ghosted”. A selection is ghosted when the operation represented by the
selection is unavailable.
Below the Toolbar are four columns of information arranged in a standard format. These columns are filled
in based on the system setup and the current system status. The Discrete Inputs column contains information
about the switches or sensors connected to inputs 1 through 16 on the ProControl unit. The two columns
labeled Discrete or Analog Inputs contain information about the 4-20 milliamp (mA) sensors or discrete
__________________________________________________________
3
8100\pv220man\pv220man
ProView 2.2x User’s Guide
__________________________________________________________
switches connected to ProControl inputs 17 through 32 (examples include analog instruments such as flow
meters or pressure transducers and digital devices such as float switches). The Analog Outputs area resides
behind the third column, and is accessed by clicking on the Discrete or Analog Inputs label at the top of the
column. The Discrete Outputs column contains information regarding the devices connected to the
ProControl’s output relays. The Extended Outputs area, behind the Discrete Outputs column, contains
information regarding any outputs configured beyond the first 14, if available on the ProControl model you
are using.
At the bottom of the screen are a series of information boxes. These show the status of certain important
system parameters when ProView is connected to a ProControl unit.
A Word About Changing Settings
ProView has been designed to make it easy to view and change the settings that govern the way your system
works. However, ProView must always be connected to the ProControl unit in order for these changes to take
effect. It is important to remember that ProView itself is only a window into the operation of the ProControl
unit. It does not provide any control functionality on its own. Chapter 3 discusses how to connect to the
ProControl.
When a setting is changed in ProView (e.g., alarm level, password, datalog interval), a “?” is temporarily
appended to the description or title of the information to indicate that the new value has been sent to the
ProControl. When the “?” disappears, the data has been received by the ProControl and confirmed by
ProView.
While many of the controls that change information in ProView are represented graphically, much of the
information is displayed in text form. To edit text-based information, click on it and make your changes as
you would in any Windows application. When you click on the text, it is highlighted to show that it has the
current focus.
!
After completing your text editing the changes must be saved by first pressing the ENTER key while
the cursor is still within the text box being edited, and then clicking on the “OK” button for the
current form.
__________________________________________________________
4
8100\pv220man\pv220man
ProView 2.2x User’s Guide
__________________________________________________________
CHAPTER 2: GETTING STARTED
This chapter explains how to open a ProView site file, describes what’s in all those little boxes on the screen,
and shows you how to print the system configuration to a file.
Opening a Site File
Every ProControl unit has a site file that tells the unit which inputs or outputs are enabled, what their
descriptive Tagnames are and how they should respond to changes in input status. This same file is used by
ProView to provide a window into what is going on within the remote ProControl unit and, by extension, with
the site operation. To open a site file:
1. Click on the File menu, then click Open Site. You will see the Open Site dialog box. You can also
use the ALT-Key combination represented by the first underlined character in the menu name. In this
case, use ALT-F.
For opening subsequent site files, you can use the Open Site Toolbar button at the top of the
main screen. ProView will also list the last four site files that you accessed at the bottom of
the File menu. If you wish to open one of these, just click on the appropriate file name.
2. In the Drives area of the dialog box click once on the down arrow to pull down the Drives list, then
click on the drive that contains the file you wish to open.
__________________________________________________________
5
8100\pv220man\pv220man
ProView 2.2x User’s Guide
__________________________________________________________
3. In the Directory area of the dialog box, click on the folder that contains the file. To move “up” in the
directory tree, double-click on the level to which you want to move. To move “down” in the
directory structure, double-click on the appropriate folder.
4. In the File area you will see all files in the selected drive and folder that have the extension .pvs or
.pvg. Only files with these extensions can be opened. Select the file you wish to open by clicking on
the file name in the file list box, then click the OK button to open the selected file.
The title bar of the main screen will change to include the file name and version number. The file name and
version number are enclosed within brackets.
5. In the Security dialog box, enter the password for your site file, and click on the OK button or hit
Enter.
A word about passwords: The password used in ProView can be different than the one used to access the ProControl
unit through its on-board display. In either case the valid characters are 0-9 and A-Z, upper case only. Up to three
characters are permitted. The password was designed as a low-level security feature sufficient to prevent inadvertent
operation and to deter tampering. It is NOT sufficient in and of itself to withstand a determined effort at system
entry. The default password is supplied to you with your ProControl unit by your system integrator.
6. If the password is incorrect, the dialog box will disappear and a beep will sound. No system
configuration information will be shown. You will need to select the Password menu and re-enter it.
7. If the password is correct, the Security dialog box will disappear and the system configuration
information will be shown on the main screen.
FYI
ProView is supplied with a View-Only Mode password, “VOM”, which may be used to connect to
the ProControl to observe the system status and obtain logged data; however, no changes to any
ProControl operating settings may be made when in this mode.
__________________________________________________________
6
8100\pv220man\pv220man
ProView 2.2x User’s Guide
__________________________________________________________
Examining the Main Screen
This particular site file shows five discrete inputs, seven analog inputs, eleven discrete outputs, and four
analog outputs.
Discrete Inputs
On the left side of the screen below the heading Discrete Inputs are shown the tagnames of enabled discrete
(or digital) inputs. To the right of the tagname is a virtual “LED”. This LED’s color or shape will change
based on the status of the input. If a discrete input is “OFF”, the LED next to the tagname is gray in color. If
a discrete input is “ON”, then the LED is green. If the discrete input is “ON” and has been set up as an alarm
input the LED becomes a red “Alarm Bell”. Some panels are blank because those inputs have not been
enabled in this particular site configuration.
__________________________________________________________
7
8100\pv220man\pv220man
ProView 2.2x User’s Guide
__________________________________________________________
Analog Inputs
In the second column below the heading Analog or Discrete Inputs are shown the enabled analog inputs.
Analog inputs can also be configured as simple discrete inputs. Below the tagname is another LED. This
LED behaves in a similar fashion to those for discrete inputs; it is gray when the input is not “active”, and
green or red when it is in the active state (see the definition for Active State in the ProControl User Manual).
A small bar graph provides a visual indication of the value of the analog input. At the left and right ends of
the bar graph are numbers that represent the lower and upper limits, respectively, of the analog input values
(corresponding to 4 and 20 mA). In this case FLOW_1 has been set up with a range of 0 to 200 GPM. Below
the bar graph is a numerical representation of the current value of FLOW_1.
Discrete Outputs
On the right side of the screen below the heading Discrete Outputs are shown the enabled discrete outputs,
corresponding to the relay outputs in the ProControl. In this site configuration there are 11 outputs. Above
the tagname of the output is either a virtual “Toggle Switch” or lamp/button representation. By its position
and/or its color it shows the state of discrete output: if the switch is left-leaning and gray the output is “OFF”;
if the switch is right-leaning and green then the output is “ON”.
Discrete outputs can be configured as an alarm lamp or button when this would be more appropriate. If the
lamp/button appears gray then the output is “OFF”. If the lamp/button appears red or green then the output is
“ON”.
Your system may also have Extended Outputs, which are located on a panel behind the discrete outputs. To
access these outputs, point your mouse at the words Discrete Outputs at the top of the column and click the
left mouse button.
FYI
Regardless of what the discrete outputs look like in ProView, they all behave the same way on the
ProControl itself – namely, the associated relay output is energized when the output is ON.
__________________________________________________________
8
8100\pv220man\pv220man
ProView 2.2x User’s Guide
__________________________________________________________
Analog Outputs
The third column contains the Analog Outputs area. It may be concealed by the second column of Discrete
or Analog Inputs. To pull the analog outputs to the front, click on the title Discrete or Analog Inputs at the
top of the third column of the ProView screen.
To the right of the tagname there is a slide-scale that indicates the current percentage of full-scale output (0%
to 100%), displayed both graphically and with text. Below the tagname is the current mode of the output.
This mode can be changed from Manual, which indicates the output is under user control, to PID or PRO,
which would indicate that the output is involved in an output control scheme and is under automatic control.
These output control schemes are described in Chapter 5 under Analog Output Options.
Printing the Setup to File
A more detailed listing of the site configuration can be made by printing the setup data to a text file. To print
the setup, do the following:
1. Click on Print Setup in the File menu.
Or
Click on the Print Setup button.
2. You will see the Print Setup to File dialog box.
__________________________________________________________
9
8100\pv220man\pv220man
ProView 2.2x User’s Guide
__________________________________________________________
3. Specify the drive and folder in which the text file will be saved.
4. ProView will select a default file name for you, with the extension .cfg. However, you can give the
file another name if you wish. You can also select an existing .cfg file name by clicking on the file
name in the file list box.
5. Click on the OK button to print the setup to the selected file.
If you are overwriting an existing file, a message box pops up to make sure that you don’t make a mistake.
A word about Files:
Do not confuse the site configuration file (.pvs), which
is a binary file, with the printed setup file (.cfg), which
is a text file. A text file can be viewed with a word
processing program while a binary file typically
cannot.
Examining the Setup File
To examine your site configuration file, use a text editor or word processor such as Notepad or Word to open
the file you have just created.
The file produced by our sample site is shown below. The first section consists of identifying information
about the ProControl unit and information about the inputs and outputs wired to it.
EOS RESEARCH LTD.
ProControl Series II+
ProView Configuration File Information
********************************************************
***** FAX Recipient:
BULLWINKLE MOOSE
*****
***** Customer:
MAYBERRY WATER DEPT
*****
***** Site Location:
MAYBERRY RFD
*****
********************************************************
***** Setup:
1
*****
***** Option:
B
*****
***** Type:
122
*****
***** Serial Number:
9999
*****
***** Date:
12/03/2014
*****
***** Time:
15:20:11
*****
***** ProView:
Version 2.200
*****
********************************************************
__________________________________________________________
10
8100\pv220man\pv220man
ProView 2.2x User’s Guide
__________________________________________________________
THE INPUTS INCLUDED IN THIS SYSTEM ARE:
#
-1
2
3
4
8
17
18
19
20
21
22
23
TAGNAME
------WEL1LO
WEL2LO
TWR_HH
TNK_HH
RESET
TWRLVL
TNKLVL
FINFLO
FLOW_2
FLOW_1
FIN_PH
FIN_CL
TAGNAME DESCRIPTION
-------------------------------------------------Well 1 Low Level
Well 2 Low Level
Water Tower High Alarm Level
Clearwell Tank High Alarm Level
Reset Switch
Water Tower Level
Clearwell Tank Water Level
Finish Flow Rate
Well 2 Flow Rate
Well 1 Flow Rate
Finish Water pH
Finish Water Chlorine Residual
SETUP*
---------D,NO,AL
D,NO,AL
D,NO,AL
D,NO,AL
D,NO,ST,SU
A,EP,ST
A,EP,AL
A,EP,ST
A,EP,ST
A,EP,ST
A,EP,AL
A,EP,AL
RANGE
-------------
0-100 FT
0-15 FT
0-600 GPM
0-400 GPM
0-200 GPM
0-14 PH
0-2 PPM
*INPUT SETUP NOTES
-----------------D - This input is a (Discrete) or ON/OFF Input.
A - This input is a (Analog) or Variable Input.
C - This input is a Pulse Flowmeter Input.
P - This input is a Pulse Accumulator Input.
UPP - Units per Pulse. Number of units (i.e. Gallons) to record for each pulse
NO-This input is a (Normally Open) Discrete Input.
NC-This input is a (Normally Closed) Discrete Input.
EP-(Endpoint) This input is "Active" when its value is outside the low to high alarm levels.
WD-(Window)
This input is "Active" when its value is between the low and high alarm levels.
ST-(Status)
This input shows a green LED in ProView when it is in its Active State.
AL-(Alarm)
This input shows a red alarm bell in ProView when it is in its Active State.
SU-(Startup) This is a menu function input. When activated it will run the startup routine.
SD-(Shutdown) This is a menu function input. When activated it will run an emergency shutdown.
MN-(Manual)
This is a menu function input. When activated it place the unit in Manual Mode.
AU-(Auto)
This is a menu function input. When activated it place the unit in Auto Mode.
SQ-(Square Root) This analog channel's reading is proportional to the square root of the input.
LT-(Lamp Test)This is a Lamp Test input. When activated it will turn on all Alarm Light outputs.
THE DISCRETE OUTPUTS INCLUDED IN THIS SYSTEM ARE:
#
-1
2
3
4
5
8
9
10
11
12
13
TAGNAME
------WLPMP1
WLPMP2
FINPMP
CHLMET
NAOMET
PH_ALM
CL_ALM
TWRALM
WL1ALM
WL2ALM
TNKALM
TAGNAME DESCRIPTION
-------------------------------------------------Well 1 Pump
Well 2 Pump
Finish Water Pump
Chlorine Metering Pump
Sodium Hydroxide Metering Pump
pH Alarm
Chlorine Alarm
Water Tower High Alarm
Well 1 Low Level Alarm
Well 2 Low Level Alarm
Clearwell Tank High Level Alarm
SETUP*
----------
AI
AI
AI
AI
AI
AI
*OUTPUT SETUP NOTES
------------------G1-(Group 1)- This output will not respond to processes 17-32.
G2-(Group 2)- This output will not respond to processes 01-16.
LT-(Lamp Test) - This output has been declared as an alarm light.
AI-(Alternate Image) - This output is displayed as an icon other than the default switch.
__________________________________________________________
11
8100\pv220man\pv220man
ProView 2.2x User’s Guide
__________________________________________________________
THE ANALOG OUTPUTS INCLUDED IN THIS SYSTEM ARE:
#
-1
2
3
4
TAGNAME
------VSPMP1
VSPMP2
NAOHFD
CHLRFD
TAGNAME DESCRIPTION
-------------------------------------------------Variable Speed Drive for Finish Water Pump
Variable Speed Drive for Well 2 Pump
Caustic Soda Feed Rate
Chlorine Feed Rate
SETUP*
---------PID,FOR
PID,FOR
PID,FOR
PRO,FOR
INPUT
-----TWRLVL
TNKLVL
FIN_PH
FLOW_2
*ANALOG OUTPUT SETUP NOTES
-------------------------PID -This output is involved in a PID (Proportional,Integral,Derivative) control loop.
PRO -This output is involved in an open (Proportional) control loop.
FOR -The PID or PRO loop will run in the (Forward) direction.
REV -The PID or PRO loop will run in the (Reverse) direction.
INPUT-This Tagname will serve as the input to the control loop.
Input and Output Configuration
The INPUTS section identifies all enabled system inputs from 1 to 32 and describes how they are configured.
the input number is followed by its TAGNAME and the TAGNAME DESCRIPTION, which is taken from the
Notes file (more on that in Chapter 5). In addition, a SETUP section further identifies each input in terms of
its signal nature, analog (A) or discrete (D); its configuration if discrete as Normally Open (NO) or Normally
Closed (NC); and its alarm display nature when active, Alarm (AL) or Status (ST). Discrete Inputs can also
be configured as functions such as Startup (SU) or Emergency Shutdown (SD), and can be used as a lamp
tester (LT) which will illuminate any Discrete Outputs that are configured as lamps. A RANGE is specified
for all Analog Inputs as well as the Active State region, denoted Endpoint (EP) or Window (WD).
FYI
See the ProControl User Manual for a further explanation of Normally Open, Normally Closed, and
related terminology and a description of Endpoint and Window Active States.
The DISCRETE OUTPUTS section is similar except that there are some different SETUP codes. Some
outputs may be assigned to groups (G1,G2) that affect the way they are viewed by the process tasks. Outputs
which display an Alternate Image (lamp image) than the standard switch image are designated AI.
The ANALOG OUTPUTS section details the setup of any enabled 4-20 mA output loops. The SETUP codes
PID and PRO indicate whether or not the output is involved in one of two analog output control schemes
known as PID loops or open loop Proportional control. The direction of the analog output control scheme is
indicated by forward (FOR) or reverse (REV). The input that provides the reference signal upon which the
analog output scheme is based is designated under the INPUT heading.
FYI
For a further explanation of PID or open loop Proportional control please see the Analog Output
Options section in Chapter 5.
In this particular setup, TWRLVL is the input to the PID control loop that operates on the variable speed pump
VSPMP1, with VSPMP1 maintaining a “setpoint” for the value of TWRLVL. The chlorine feed rate CHLRFD
will be varied in proportion to the flow rate FLOW_2 under open loop proportional control.
__________________________________________________________
12
8100\pv220man\pv220man
ProView 2.2x User’s Guide
__________________________________________________________
Process Tasks
The next section of the setup file is a listing of PROCESS CONTROL TASKS. These determine how the
ProControl unit responds to input changes while in Auto, Startup or Shutdown modes. It is important to note
that the ProView software does not take any independent action itself. All automated control decisions are
made by the ProControl unit, although you can change many operating parameters via ProView.
THE PROCESS CONTROL TASKS EXERCISED BY THIS SYSTEM ARE:
Process 01: If WEL1LO is ON
THEN Delay for 2 Seconds, Send Report[FAX #1;Page #1],
Switch WLPMP1 OFF
Page Message: 'Well 1 Low Level Mayberry North '
Process 02: If WLPMP1 is OFF AND PH_ALM is OFF AND
CL_ALM is OFF AND TWRALM is OFF AND TNKALM is OFF
THEN Delay for 30 Seconds, Switch WLPMP1 ON
Process 03: If FIN_PH is High
THEN Delay for 5 Seconds, Switch NAOMET OFF AND PH_ALM ON
Process 04: If FIN_CL is High
THEN Delay for 5 Seconds, Switch CHLMET OFF AND CL_ALM ON
Process 05: If TWR_HH is ON
THEN Delay for 2 Seconds, Send Report[FAX #1;FAX #2;Page #1;Page #2],
Initiate Shutdown, Switch TWRALM ON
Page Message: 'Tower's about to overflow, Bullwinkle - COME OUT NOW! '
Process 06: If TNK_HH is ON
THEN Delay for 2 Seconds, Send Report[FAX #1;FAX #2;Page #1;Page #2],
Switch TNKALM ON
Page Message: 'Clearwell Tank High Mayberry North '
Process 07: If TWRLVL is High
THEN Delay for 5 Seconds, Switch TWRALM ON
Process 08: If TWRLVL is NOT High or Low
THEN Delay for 5 Seconds, Switch TWRALM OFF
Process 09: If TNKLVL is High
THEN Delay for 5 Seconds, Switch TNKALM ON
Process 10: If TNKLVL is NOT High or Low
THEN Delay for 5 Seconds, Switch TNKALM OFF
Process 11: If FIN_PH is High or Low
THEN Delay for 5 Seconds, Send Report[FAX #1;Page #1],
Switch PH_ALM ON
Page Message: 'Finish Water pH Alarm Mayberry North '
Process 12: If FIN_PH is NOT High or Low
THEN Delay for 5 Seconds, Switch NAOMET ON AND PH_ALM OFF
Process 13: If FIN_CL is High or Low
THEN Delay for 5 Seconds, Send Report[FAX #1;FAX #2;Page #1;Page #2],
Switch CL_ALM ON
Page Message: 'Finish Water Chlorine Alarm Mayberry North '
Process 14: If FIN_CL is NOT High or Low
THEN Delay for 5 Seconds, Switch CHLMET ON AND CL_ALM OFF
Startup 01: Switch WLPMP1 ON AND PH_ALM OFF AND CL_ALM OFF AND TWRALM OFF AND WL1ALM OFF AND
WL2ALM OFF AND TNKALM OFF
__________________________________________________________
13
8100\pv220man\pv220man
ProView 2.2x User’s Guide
__________________________________________________________
Startup 02: Delay for 2 Seconds, Switch WLPMP2 ON
Startup 03: Delay for 2 Seconds, Switch FINPMP ON
Startup 04: Delay for 5 Seconds, Switch CHLMET ON AND NAOMET ON
Shutdown 01: Switch CHLMET OFF AND NAOMET OFF
Shutdown 02: Delay for 2 Seconds, Switch WLPMP1 OFF AND WLPMP2 OFF
Shutdown 03: Delay for 2 Seconds, Switch FINPMP OFF
This sample configuration has a fairly straightforward process flow. On startup, some of the system outputs
are switched on sequentially and all alarm indicators are switched off. On shutdown, all pump outputs and
chemical metering devices are turned off. The process tasks are mostly self-explanatory. Some process tasks
include fax and pager reporting functions. It is important to remember how and when the process tasks are
run:
Process tasks are run continuously while the ProControl unit is in AUTO mode. Process control tasks
are event-driven, i.e., they occur once when the “IF…” conditions are true (subject to any delays).
No automatic action is taken in MANUAL mode.
Startup and Shutdown processes are run in sequence. When the Startup sequence is finished, the unit
is placed in AUTO mode and the Process Tasks are run. If any Startup process in the sequence fails,
then all the non-lamp outputs are turned “OFF” and the unit reverts to MANUAL mode. A Startup
process fails when any IF condition is not satisfied for 60 seconds after the Startup process begins
(there may not be any IF conditions in your Startup sequence). The Startup sequence begins when
the ProControl or ProView operator initiates it. The Startup sequence can also begin when power is
first applied to the ProControl unit if the “Auto Startup” option has been enabled.
The Shutdown sequence works in a similar manner. When the Shutdown sequence is finished, the
ProControl unit reverts to MANUAL mode. If any Shutdown process in the sequence fails (is not run
after 60 seconds), then all the non-lamp outputs are immediately turned “OFF” and the unit reverts to
MANUAL mode. The Shutdown sequence can be initiated either by the ProControl or ProView
operator or by a process task (Process 5 does this in our example).
Process Capability
The ProControl runs process tasks which are based on Boolean IF ___ AND ___ THEN ___ logic. There are
64 available processes, 16 of which can be used as part of a startup sequence, and 16 of which can be used as
part of a shutdown sequence. Each process can:
be based on several, simultaneously existing I/O conditions
include short or long delays for de-bouncing or simple time delay
use memory variables (registers) for linking processes
cycle outputs with timers or during certain times of the day
perform system shutdowns
send reports to fax and/or pagers
__________________________________________________________
14
8100\pv220man\pv220man
ProView 2.2x User’s Guide
__________________________________________________________
FYI
If you wish to modify the ProControl programming, please contact your Control System Integrator
for assistance.
__________________________________________________________
15
8100\pv220man\pv220man
ProView 2.2x User’s Guide
__________________________________________________________
CHAPTER 3: ESTABLISHING COMMUNICATION
T
his chapter explains how to connect to the ProControl unit using ProView by local serial cable and by
remote modem.
By itself, ProView does not reveal very much about your site’s operation. It must be connected to the
ProControl unit in order to yield any data.
On-Site Local Connection
To establish a local connection to a ProControl equipped with serial port, perform the following:
1. Use the local serial cable supplied with the ProControl to connect the computer you are using to a
ProControl unit. One end of the cable terminates with a female 9-pin connector. Use this end to plug
into the serial port or USB-to-Serial adapter on your computer. The other end of the serial cable is
terminated with a 9-pin RJ-45 connector. Use this connector to plug into the “RS-232/Serial” port on
the right hand side of the ProControl unit.
!
!
!
Be sure to disconnect the serial cable from the ProControl unit after you are finished. If you do not,
remote communications and alarm reporting will not be possible.
If the ProControl unit is powered OFF for any reason, wait 45 seconds after power up (3 minutes for
a cellular data unit) before plugging in the cable to attempt a local connection. Otherwise, the
ProControl’s modem may not be properly configured.
If you have a ProControl unit with Ethernet communications, consult the Ethernet Quick Start Guide
for local connection information.
2. Click on Local Connection in the Communications menu. You can also use ALT-C.
Or
Click on the Local Connection toolbar button.
You will see the Local Communications dialog box.
__________________________________________________________
16
8100\pv220man\pv220man
ProView 2.2x User’s Guide
__________________________________________________________
3. Select the COM port to which the ProControl is connected by clicking on the “radio button” next to
the COM port you want to use. COM ports 1 through 4 are supported.
4. Click on the Connect to ProControl button.
5. You will see status messages in both the Port Status area of the Local Communications dialog box
and in a small information box near the bottom of the main screen. Usually you will see “Trying
Local...” followed by “LOCAL CONNECT” if the attempt is successful. If the attempt is
unsuccessful you will see message boxes outlining the suspected problem.
6. After connecting, click on the OK button to hide the Local Communications dialog box.
After establishing a local connection, ProView will perform an initial scan of site conditions. This will take a
few moments during which time the mouse pointer will turn into an hourglass. After the initial scan, data will
be updated on the screen every second or so.
Here is a view of the main screen after a local connection has been established:
__________________________________________________________
17
8100\pv220man\pv220man
ProView 2.2x User’s Guide
__________________________________________________________
Note that the screen has been updated to reflect the current operating conditions at the site. At the bottom of
the screen, various message panels have been filled in as well.
__________________________________________________________
18
8100\pv220man\pv220man
ProView 2.2x User’s Guide
__________________________________________________________
Dial-Up Remote Connection
For a dial-up remote connection, the procedure is a little different. Follow these steps:
1. Make sure that your modem has been installed properly and that the phone line is plugged in to the
proper port on the modem.
Your modem must be Hayes (AT) compatible and capable of operation at 9600 baud.
2. Click on Remote Connection in the Communications menu.
Or
Click on the Remote Connection toolbar button.
You will see the Remote Communications dialog box.
3. Select the COM port to which your modem is connected by clicking on the “radio button” next to the
COM port you want to use. COM ports 1 through 4 are supported.
__________________________________________________________
19
8100\pv220man\pv220man
ProView 2.2x User’s Guide
__________________________________________________________
4. Check to see that the Site Phone Number is the one you want to dial. If not, click on the phone
number and change it. If you need to dial an 8, 9 or some other prefix first to get an outside line, add
a comma or two after the prefix to obtain a pause before dialing the main number (e.g., 8,555-1212).
Do not add parentheses or dashes.
5. Examine the Initialization String to see if it is correct for your type of modem. For Series 2plus
systems, you will usually use the Initialization String for Rockwell Chipset or U.S. Robotics
modems. If these do not work, use the Default string instead.
6. Click on the Dial Remote Site button.
7. You will see status messages in both the Call Status area of the Remote Communications dialog
box and in the lower portion of the main screen. Usually you will see the following messages:
Trying Remote...
OK
Setup...
Dialing...
CONNECT 9600
REMOTE CONNECT
ProView is attempting to contact your PC’s modem
ProView has successfully connected to the modem
ProView is sending the initialization string to the modem
ProView is dialing the site phone number
Connection has been established with the remote modem
Connection has been established with the remote ProControl unit
8. If the attempt is unsuccessful you will see message boxes outlining the suspected problem.
9. After connecting, click on the OK button to hide the Remote Communications dialog box.
Cellular Data Connection
For a cellular data connection, please see the instructions in the current version of the Cellular Data
QuickStart Guide.
Ethernet Connection
For an Ethernet data connection, please see the instructions in the current version of the Ethernet Quick Start
Guide.
Ending a Connection
The simplest way to end a connection, to hang up in essence, is to click on the Disconnect button on the
Toolbar.
This works for either a local or remote connection.
Alternatively, you can re-open the Local or Remote Communications dialog box and click on either the
Disconnect from ProControl button (Local) or the Hangup button (Remote). After ending the connection,
you should see NOT CONNECTED in a message box near the bottom of the screen.
__________________________________________________________
20
8100\pv220man\pv220man
ProView 2.2x User’s Guide
__________________________________________________________
Sending a Memo
A useful feature of the ProControl is the ability to transmit short memos to a site operator. From ProView,
you can send a message of up to 160 characters to the display of the ProControl unit. The site operator must
acknowledge your memo before returning to his normal display. This feature may be useful in
communicating with a person at the remote site.
To send a memo, follow these steps:
1. From the Communications menu, select Send Memo.
2. Type your memo onto the screen of the MemoPad. It will appear on the ProControl’s display
exactly as it appears to you on the MemoPad, two lines at a time. Words will automatically wrap
around to the next line, but you may hit Enter (Carriage Return or CR) to jump to the next line if
necessary. However, the fewer <CR> characters you use, the longer the text message you can
type, since each <CR> represents 20 characters. The Message Length counter will keep track of
the number of characters you have used. The Max Length counter will decrease to let you know
how many more characters can be entered.
3. By clicking the right mouse button when the pointer is over the text window, the text window
will become larger, allowing you to view more text without having to scroll up and down.
__________________________________________________________
21
8100\pv220man\pv220man
ProView 2.2x User’s Guide
__________________________________________________________
4. Click the Send New Memo to ProControl button to send the memo to the ProControl’s display,
OK to temporarily save the memo but not transmit it, or Cancel to abort the entire procedure.
5. The Ack button on the MemoPad will flash red and your PC will beep to indicate when the
ProControl operator has acknowledged your memo.
__________________________________________________________
22
8100\pv220man\pv220man
ProView 2.2x User’s Guide
__________________________________________________________
CHAPTER 4: MANAGING YOUR SITE
This chapter explains how to change the way your ProControl system operates by switching between Manual
and Automatic modes, initiating a startup or shutdown sequence, and changing other general system settings.
Switching Between System Modes
There are four modes of operation for the ProControl: Manual, Automatic, Startup and Shutdown. To initiate
or click
a switch to a different mode, simply click on the appropriate Toolbar button
on Process Operations in the System menu.
Goto AUTO Mode:
Goto MANUAL Mode:
STARTUP System:
sequence.
SHUTDOWN System:
Shutdown sequence.
Clicking on the coffee cup will place the ProControl into Automatic mode.
Clicking on the hammer will place the ProControl into Manual mode.
Clicking on the green “power button” causes the ProControl to initiate a Startup
Clicking on the red “power down” button causes the ProControl to initiate a
Clicking on the red hand will cause an Emergency Shutdown, which turns off all
Emergency OFF:
outputs immediately and places the ProControl in Manual mode.
!
Be sure you understand the safety risks and other implications of issuing these commands. When the icons
are clicked, the actions are immediate and equipment may start up or shut down automatically. Most
importantly, switching the ProControl to Manual mode will defeat any safeguards programmed into the
system and allow equipment to continue running without any process control. Manual mode should only
be used on a short-term basis for system troubleshooting or clearing alarm conditions, preferably with depowered equipment circuits.
You can monitor the current system mode by looking at the message panel at the bottom of the main screen.
The system is currently in Manual mode.
The system is currently in Auto mode.
The system is currently in Startup mode, the last startup task run was startup task #2.
The system is currently in Shutdown mode, the last shutdown task run was shutdown task #2.
__________________________________________________________
23
8100\pv220man\pv220man
ProView 2.2x User’s Guide
__________________________________________________________
The last action to initiate a Shutdown is listed in another message panel at the bottom of the screen. In the
example below, the shutdown was initiated by a remote user.
System Operations
Following are several other operational parameters that can be set by ProView.
Date & Time
The ProControl unit maintains an internal real-time clock which it uses to time-stamp datalogged information
and control other important system functions. To set the Date & Time:
1. Click on the System Time toolbar button.
Or
Choose System Operations from the System menu and click System Time. You will see the Date &
Time dialog box.
2. The left side of the dialog box displays the current date and time kept on your PC. The right side of
the dialog box is the date and time according to the ProControl unit. Follow the procedure outlined
below if you need to change the time.
3. To set the ProControl’s clock equal to the PC’s clock click on the ProControl = System button. To
. The upper spinner changes
set the ProControl’s clock to a specific time use the time spinners
the date and lower set of three spinners change the hour, minute and second (left to right,
respectively).
4. To set your PC’s time (System time) use the Windows Control Panel.
FYI
Daylight Savings Time is not supported by the ProControl’s clock. You will need to make any
necessary changes manually.
__________________________________________________________
24
8100\pv220man\pv220man
ProView 2.2x User’s Guide
__________________________________________________________
Changing the time by a large amount can lead to discontinuities in the datalogging history of your
ProControl unit, particularly if you move the ProControl’s time forward. See the section on Datalogging
Setup in Chapter 5 to check on your system’s datalogging status.
!
Alarms
An alarm is only an audible indication to the operator that an input signal is in its active state. On the
ProControl unit, the beeper sounds if the Alarms are Set, the unit is in Manual mode and an input is in the
active state. The Alarm continues to sound until it either is acknowledged by the operator or times out by
itself. In ProView, a “Beep” sounds from the PC if the Alarms are Set, and an input that has been configured
as an Alarm Input enters the active state. No acknowledgment is necessary.
The current status of the alarm feature is displayed in a message box at the bottom of the main screen. To
enable or disable Alarms, click on the Alarms toolbar button,
which toggles this feature on and off.
Or
Click on Set Alarms in the Enable menu.
Remote Reporting
A report can be a fax or a pager message (for dial-up units) or an email or text message (for cellular data and
Ethernet units) sent by the ProControl. In order for any reporting to occur, Remote Reporting must be
enabled. The current status of the reporting feature is indicated in a message box at the bottom of the main
screen.
To enable or disable remote reporting, click on Remote Reporting under the Enable menu. A check mark is
displayed if reporting is enabled.
Log Off Remote User
This function is used occasionally to reset the remote ProControl’s display to the password menu. It is often
used to ensure that an on-site user does not change any ProControl settings while you are remotely connected,
and to ensure that password protection is restored if the last user did not Log Off locally.
To Log Off the remote user, choose System Operations from the Systems menu, and click on Log Off
Remote User.
Initiate FAX NOW!
This function is the equivalent of pressing FAX NOW on the ProControl unit. It is used to generate and send
a current fax status report to the currently enabled fax numbers. Fax reports must be enabled in the FAX
Report Setup dialog box and ProView must be connected via modem (remotely) for this command to
proceed.
__________________________________________________________
25
8100\pv220man\pv220man
ProView 2.2x User’s Guide
__________________________________________________________
ProView will disconnect from the ProControl unit (hang up) after issuing this command to free the remote
phone line for fax use. Normal FAX back operations and times will not be affected.
To initiate the fax, choose System Operations from the Systems menu, and click on Initiate FAX NOW!
Initiate New FAX NOW!
This function is identical to Initiate FAX NOW! except that you can specify a number that is not currently
enabled to receive faxes from the ProControl. You can use this for testing the fax capabilities or to send a fax
update to a third party.
To initiate the fax, choose System Operations from the Systems menu, and click on Initiate New FAX
NOW!
ProView will alert you first that you will be disconnected from the system in order for the fax to proceed.
Enter the FAX number to which the fax report will be sent, making sure you include a prefix or the numeral 1
and the area code, if necessary. Click the OK button to send the fax report.
__________________________________________________________
26
8100\pv220man\pv220man
ProView 2.2x User’s Guide
__________________________________________________________
CHAPTER 5: CHANGING SYSTEM PARAMETERS
T
his chapter explains how to change the settings that govern much of the operation of your system, such as
the state of a discrete output, analog alarm levels and fax, text, email and datalogging setups.
Switching an Output State
The state of a discrete output can be changed manually by clicking on the “switch” associated with its
tagname. ProView includes a “locking” feature for discrete outputs as a safety measure to prevent inadvertent
output changes; you must “unlock” the outputs in order to turn them on or off. The outputs are locked and
unlocked by clicking on the “slide switch” at the top of the Discrete Outputs section of the main screen.
You should leave the slide switch in the Locked position whenever possible.
!
Bear in mind that if the ProControl unit is in Auto mode, any discrete output change you make may be
“overridden” by a process control task. Do not turn outputs on or off unless you are familiar with the
process control in effect for your system.
1.
To change the state of a discrete output, click on the toggle switch.
2.
The toggle switch will change positions, and a “?” will appear for a moment after the
tagname. This indicates that the command was sent to the ProControl unit but that confirmation of
the state change has not yet been received.
3.
The “?” will disappear after confirmation of the state change has been received from the
ProControl unit.
Depending on your site configuration, you may be able to change certain parameters that affect how the
discrete outputs in your system operate in Auto mode.
Process Groups
The ability to set a Process Group is a rarely-used feature that prevents an individual output from being
switched by certain process tasks when in Auto mode. If your ProControl has been configured for Process
Groups, you can switch between Group 1 (ignore processes 17 – 32) and Group 2 (ignore processes 1 – 16).
__________________________________________________________
27
8100\pv220man\pv220man
ProView 2.2x User’s Guide
__________________________________________________________
!
Do NOT enable process groups unless your ProControl has been configured specifically to use this
feature! Be sure you understand the safety risks and other implications of issuing these commands.
Output Cycle
Some of your outputs may have been configured as “Switched” outputs, where the output is turned on and off
according to a timed cycle, or during a specific time of day.
Output Options
To change an output option, do the following:
1. Place your mouse pointer over the output’s tagname until a balloon appears. Click the right mouse
button until you see Output Options.
2. Click the left mouse button.
3. You will see the Set Output Options dialog box. The Set Process or Set Output Cycle panels may
not be visible if those options do not apply. Both panels will be disabled if ProView is not connected
to a ProControl unit.
4. To enable a Process Group click on the Enable check box and click either the Group 1 or Group 2
radio buttons in the Set Process panel. Once again, Do NOT enable process groups unless your
ProControl has been configured specifically to use this feature!
5. If the output has been configured to run in a switched mode, you will be able to change the Output
Cycle times by clicking on the value you want to change and entering the new time in an
hours:minutes format (be sure to hit Enter after you type in the new time). Alternatively, click on
the up or down spinners to increase or decrease the time you want to change.
6. Click on the OK button to confirm the changes and send them to the ProControl unit. Click on
Cancel to get rid of any changes.
__________________________________________________________
28
8100\pv220man\pv220man
ProView 2.2x User’s Guide
__________________________________________________________
Notes
Each I/O point can have its own set of associated Notes. The notes are stored on your PC in a file with a .not
extension along with your .pvs file. You can attach notes that explain the functional purpose of the I/O point
or define the I/O point in more detail. This can eliminate uncertainty that may result from the limitation of six
characters in each point’s tagname.
To edit an I/O point’s notes do the following:
1. Position the mouse pointer over the I/O point’s tagname until a balloon appears, and right-click until
you see Notes.
2. Click the left mouse button to enter the “Notes” feature. The Notepad dialog box appears.
3. Click in the Notes window to edit or add descriptive text. Any notes enclosed in angle-brackets (i.e.
<note>) will appear within the balloon when you position the mouse pointer over the tagname, and at
the top of the main screen.
4. Click the Save button to save your notes and/or definitions or press Cancel to exit without saving.
You must also save the site file before exiting ProView to retain any changes made in Notes.
FYI
Sometimes it is a good idea to provide a more complete description of what an input or output does in
the Notes; e.g., “Causes System Shutdown” or “Turns ON when Tank is Full”. Feel free to
customize the notes to suit your purposes; they are stored locally on your PC and do not affect the
operation of the ProControl itself.
Analog Alarm Levels
The analog alarm levels define what parts of an analog input’s range are considered “active” and which are
not. This affects not only the color of LED’s and bar graphs on the main screen but also can affect process
control if the analog input is used in a process task. Depending on how your system has been configured, you
__________________________________________________________
29
8100\pv220man\pv220man
ProView 2.2x User’s Guide
__________________________________________________________
will be able to set up to four “activation levels” that define when an input becomes active. Some ProControl
configurations allow you to set a Low Alarm Limit and a High Alarm Limit, while others allow you to
additionally define a Low-Low Alarm Limit and a High-High Alarm Limit. These activation levels are
somewhat more flexible in use than their names imply, in that they are not only used to trigger alarms. If an
alarm limit value is exceeded, it could be used to simply turn on a pump or reset a switch, for example.
To set an analog alarm level, do the following:
1. Position the mouse pointer over the I/O point’s tagname until a balloon appears, right-click until you
see Alarm Levels.
2. Left-click and the Alarm Levels dialog box appears.
3. The present alarm levels are shown in text as well as in the position of the sliders. Note that the High
Alarm value must be greater than the Low Alarm value, and the High High Alarm value must be
greater than the Low Low Alarm value.
4. You may adjust the alarm values by clicking and holding a red slider and moving it to the left or
right. As you move the slider the numeric value is updated to reflect the change you are making. The
alarm level will be set to a new value when you release the mouse button.
__________________________________________________________
30
8100\pv220man\pv220man
ProView 2.2x User’s Guide
__________________________________________________________
5. Alternatively, you may click on the alarm level text and edit the value for the alarm level. This is
usually a better way to input a precise value. Be sure to hit the Enter key to send the new value to the
ProControl unit. Click on the OK button to hide the Alarm Levels dialog box.
!
Remember that any changes you make to the alarm levels are immediate and may impact the process
control for your system. Be sure you understand the safety risks and other implications of issuing these
commands.
__________________________________________________________
31
8100\pv220man\pv220man
ProView 2.2x User’s Guide
__________________________________________________________
Site Information
Site Information refers to data used in the fax report and in the various files printed by ProView.
To view or change the Site Information do the following:
1. Click on Site Information in the File menu. The Site Information dialog box appears.
2. To change the Customer Name, Site Location or FAX Recipient click on the text you want to
change and edit it. Only uppercase letters, numbers and blank spaces are allowed. The Customer
Name field also appears on the main screen of the ProControl unit’s display.
3. Click on the OK button to confirm the changes and send them to the ProControl unit. Click on
Cancel to get rid of any changes.
FAX Report Setup
This setup screen is used to change when and where the ProControl’s fax report is sent, and whether
individual fax recipients are enabled (only applicable to dial-up ProControl units).
To view or change the FAX Report Setup, do the following:
1. Click on FAX Report Setup in the Communications menu.
Or
Click on the FAX Report Setup toolbar button.
You will see the FAX Report Setup dialog box.
__________________________________________________________
32
8100\pv220man\pv220man
ProView 2.2x User’s Guide
__________________________________________________________
2. If Remote Reporting is not enabled, the contents of the dialog box will appear “grayed out” or
disabled.
3. The first and second FAX number panels determine what kinds of fax reports are sent by the
ProControl unit and where they will be delivered. There are two kinds of fax reports generated by the
ProControl. A Scheduled FAX report occurs on a regular basis to provide a status report, while an
Alarm FAX report will be sent when issued by a Process Task that has been configured to do so
(usually to report an alarm condition). To enable either type of fax report click on the Alarm FAX or
Scheduled FAX check boxes. If you enable Scheduled FAX reports the Alarm FAX reports for that
same number are automatically enabled as well. You cannot enable only Scheduled FAX reports.
4. To change the phone number to which the ProControl will fax reports click on the phone number and
edit it. The ProControl can fax to two different phone numbers. It will make up to three attempts to
send the fax. If the first try is unsuccessful, the second try will be initiated 5 minutes later, and a third
attempt will be made 5 minutes after that. If the third try is unsuccessful the fax attempt will be
abandoned and the ProControl will enter a fax failure into the Events log (see Chapter 6). The
ProControl will try both phone numbers (if they are both enabled) on the first try before moving on to
a second attempt.
5. In the Scheduled FAX panel, you can select when the regularly scheduled faxes are sent. Choose the
Every Day @ button and edit the time to the right of it to have a report sent at the same time every
day (24-hour clock). To have a report sent at a specific time interval, choose the At intervals of
button and enter the time interval in HH:MM format. When you hit Enter, the data will be sent to the
ProControl unit.
6. The Next Scheduled FAX variable indicates when the next scheduled fax report will be sent. You
can also change it yourself if, for instance, the ProControl is set to fax every hour but you would like
it to skip a few hours before resuming. To set the Next Scheduled FAX time click on the time in that
panel and enter the new time in 24 hour format. Note that if you enter a Next Scheduled FAX time
that is earlier than the current time as determined by the ProControl’s clock, you will prevent any
scheduled faxes from being sent until the next day at that time.
7. Click on the OK button to confirm the changes and send them to the ProControl unit.
__________________________________________________________
33
8100\pv220man\pv220man
ProView 2.2x User’s Guide
__________________________________________________________
Texting/Paging Setup
This setup screen is used to change where the ProControl’s alarm text or pager messages are sent, and
whether individual recipients are enabled. Note that dial-up units require a modem access phone number for
texting or paging - you will need to contact your paging/messaging service directly to obtain some of the
information necessary for proper messaging setup. Cellular data and Ethernet units require the cell phone
carrier’s messaging web address (e.g., vtext.com for Verizon) in combination with the cell phone number.
The texting/paging capability is similar to the ProControl’s fax capability in that you can send information to
two cell phones/pagers and it will make three attempts at reaching each number.
!
For dial-up units you will need to obtain your pager company’s modem dial-up phone number and your
pager’s modem dial-up ID (this is often different than your regular pager ID). This information is generally
not available from the customer service staff at the pager company. You may need to ask for someone in
technical support who is familiar with TAP modem dial-up.
To view or change the texting/paging setup, do the following:
1. Click on Text Message Setup in the Communications menu.
Or
Click on the Text Massage Setup toolbar button.
You will see the Text Message Setup dialog box.
Dial-Up Unit Example
__________________________________________________________
34
8100\pv220man\pv220man
ProView 2.2x User’s Guide
__________________________________________________________
Cellular Data/Ethernet Unit Example
2. For dial-up units - In the Text Message Service panels, enter the telephone number for your
pager/messaging service company’s modem dial-up and hit enter to update the ProControl. For
cellular data and Ethernet units enter the cell phone carrier’s messaging web address and hit enter to
update the ProControl.
3. Click on the Enable Text Message check box, and choose Numeric Message or Alpha Message
(text). For cellular data and Ethernet units always select Alpha Message.
4. Enter the pager ID number you obtained from the pager company or 10-digit cell phone number in
the Text Message Identification # panels and hit enter to update the ProControl.
5. The next panel indicates whether there are any queued pages or text messages. In other words, if a
message has not yet been successfully completed and you have connected to the ProControl with
ProView, you may be interfering with the ProControl’s attempts to send a message.
6. For dial-up units only, select the baud rate in the Baud Rate for Texting panel, which is the speed at
which the message information is sent to your paging/cellular provider. It is generally recommended
that you use 1200 baud or less for the greatest reliability. Even at 300 baud, the ProControl takes
only a few seconds to transmit the information to your provider.
7. The Text Message field allows you to view and/or change the information that will be transmitted to
your cell phone/pager from specific events. If you are using a numeric pager, this message cannot
__________________________________________________________
35
8100\pv220man\pv220man
ProView 2.2x User’s Guide
__________________________________________________________
exceed nineteen digits in length and may contain only numerals. If you are using an alphanumeric
pager, this message can be up to 80 characters in length. After you edit the message, hit Enter to send
the updated message to the ProControl unit. Use the up and down spinners to view the other Process
Tasks that cause pages to be sent. You should be familiar with the process control of your system
before attempting to make changes to these messages.
8. Once you have finished making your changes click OK to close the dialog box.
Email Set-Up for Cellular Data and Ethernet Units
Cellular data and Ethernet units will send status, alarm, and datalog emails to up to 5 recipients
1. Click on the “eMail Report Setup” icon
and the following screen appears:
The report options are generally self-explanatory. Click the “Include Data Report” checkbox to have
datalog files attached to the scheduled emails. The “Data Window” indicates the number of
days/hours of data to include.
__________________________________________________________
36
8100\pv220man\pv220man
ProView 2.2x User’s Guide
__________________________________________________________
2. Click the “Settings” button to see the following screen:
Enter email addresses of the desired recipients here. Be sure to hit the “Enter” key after each entry.
The only other settings in this window are the SMTP Server and DNS addresses. EOS Research
personnel will configure these for you; please contact EOS Research before making any changes
to these settings. Click the “OK” button to save the configuration.
Datalogging Setup
There are three different types of datalogging on the ProControl. Discrete input and output changes are
logged as they happen. Events are also logged as they happen, and include changes in control mode (e.g.,
Auto, Manual), local and remote connections to the ProControl, system startup/shutdowns, fax or page
failures, and execution of Process Tasks. Analog input and output values are logged at specific time intervals
determined by the user. The Datalogging Setup dialog box is used to determine how datalogging is carried
out in the ProControl unit.
To view or change the Datalogging Setup do the following:
1. Click on Datalogging Setup in the Datalogging menu.
Or
Click on the Datalogging Setup toolbar button.
You will see the Datalogging Setup dialog box.
__________________________________________________________
37
8100\pv220man\pv220man
ProView 2.2x User’s Guide
__________________________________________________________
2. To enable a type of datalogging click on the Discrete, Analog, Event or Totalizer check boxes
located in the Datalog Enable panel.
3. To change the logging interval for analog inputs click on the time value indicated for Logging
Interval and edit it. This interval can range from 1 second to 24 hours, expressed in minute/second
format or hour/minute format (default). Clicking on the HH:MM adjacent to the Logging Interval
will toggle between hour/minute format and minute/second format.
4. The Next Point @ variable is set by the ProControl every time a data point is logged to show you
when the next analog data points will be logged. You can change this value if you wish the
ProControl to delay before resuming analog datalogging. Click on the time associated with Next
Point @ and enter the new time in either HH:MM or MM:SS format. Note that if you enter a Next
Point @ time that is earlier than the current time as determined by the ProControl’s clock, you will
prevent any analog datalogging from occurring until the next day at that time (or next hour if using
MM:SS format).
5. Totalizer logging can be performed on intervals of hours, number of days, or up to a month.
6. Once you have finished making your changes click OK to close the dialog box.
When setting your analog logging interval, be aware of the available memory in the ProControl unit
you are using. If, for instance, your ProControl has a capacity of 5,000 analog data points per input
channel and you specify a 5-minute logging interval, there will be available memory for
approximately 17 days worth of analog data. Changing the log interval to 10 minutes will make the
memory last twice that long. Once the memory is full, the oldest data points are purged one at a time to make
room for the current data.
FYI
__________________________________________________________
38
8100\pv220man\pv220man
ProView 2.2x User’s Guide
__________________________________________________________
Changing the Password
You can change the password for opening a site file in ProView or for access to the ProControl unit from its
keypad. The passwords do not have to be the same. If you change the password while ProView is connected
to a ProControl unit, the new password will be used for both ProView and the ProControl unit. If you change
the password while not connected to a ProControl unit, the new password will be used only for that site file in
ProView. In order to save the new password for the site file in ProView, you must save the site file
(File…Save Site). However, any change to the password in the ProControl unit itself is immediate.
To change the password, follow these steps:
1. Click on the Password menu.
Or
Click on the Password toolbar button.
You will see the Security dialog box.
2. Click on the Change Password button. You will prompted to enter the Old Password in the text
box. Click the OK button or hit the enter key. If you do not enter the password correctly, a beep
sounds and the security dialog box disappears.
3. You will then be prompted to enter the New Password in the text box. Recall that the password can
be up to three characters consisting of the numbers 0-9 and the letters A-Z. After clicking on the OK
button or hitting the enter key, you will be prompted for the new password again.
__________________________________________________________
39
8100\pv220man\pv220man
ProView 2.2x User’s Guide
__________________________________________________________
4. If both new password attempts were identical, the new password will be accepted and the Security
dialog box will disappear. If ProView is connected to the ProControl, the new password will be in
effect for both ProView and the ProControl unit.
Analog Output Options
If your ProControl system is configured with analog outputs, you will be able to adjust the output level, or the
parameters used in a control algorithm associated with that output. Your system integrator should have
already configured your analog outputs with these algorithms if they apply to your process. Analog outputs
can be involved in one of two different types of control scheme: PID or Proportional control. A PID
(Proportional-Integral-Derivative) Loop is a feedback-based loop that maintains an analog input at a userdefined Setpoint. The ProControl automatically adjusts the analog output using a mathematical formula that
includes Gains for the proportional, integral and derivative terms. PID control is a commonly-used process
control technique, descriptions of which can be found in most control theory texts.
If you are familiar with PID control terms, note that the PID gains used by the ProControl are
defined differently than some of the terms in traditional use. Proportional Gain on the ProControl
corresponds with the classic definition of proportional band. However, the Integral Gain and
Derivative Gain are the inverse of integral (or reset) time and derivative time. Hence, an
increase in any of these gains tends to increase the corresponding proportional, integral and derivative
action.
FYI
A PRO (Open-loop Proportional) algorithm generates an analog output signal that is directly proportional to
the value of an analog input. The analog output percentage is computed by multiplying a constant of
proportionality by the associated input’s percentage of full-scale.
If a control scheme is not assigned to an analog output (or if the output has been placed in Manual mode),
you can change the output value by clicking on the slider for that output and dragging it up or down, or by
highlighting the number beneath the slider scale and typing a new value.
You can modify the PID parameters of a PID-controlled analog output (the P, I and D Gains) if your analog
output is not responding smoothly or quickly enough to changes in its associated input. The proportional (P)
gain specifies the output level based on the error between the Set Point (desired input level) and the actual
input level. Integral (I) gain smoothes the output level based on the tracking history of the input to the Set
Point and provides a means of better steady state control. Derivative (D) gain will allow the output to
respond to quick changes in the input and provides a means of establishing good transient or instantaneous
control.
__________________________________________________________
40
8100\pv220man\pv220man
ProView 2.2x User’s Guide
__________________________________________________________
In the case of a PRO output, you can modify the P Gain to alter how much the output value changes as the
associated input changes. A value of 100 indicates that the output will be 100% when the input is at full
scale. A value of 50 indicates that the output will be 50% when the input is at full scale
The Max Change parameter allows you to regulate how much the analog output can change in one control
cycle (one control cycle is about 1/4 of a second).
!
Be sure you fully understand PID and proportional control concepts before adjusting any of these
parameters. Large changes in output can result from changing the gains or the set point, which can cause
equipment damage or unforeseen safety hazards. For help in choosing appropriate gains for your process,
contact EOS Research technical support.
To change the PRO or PID parameters, Set Point, or Max Change parameters:
1. It is highly recommended to first place your analog output into Manual mode. Click on the PID (or
PRO) beneath the Tagname and wait a second for it to change to Manual.
2. Position the mouse pointer over the analog output’s tagname until a balloon appears, and right-click until
you see PID Options.
3. Left-click and the PID Parameters dialog box appears.
4. To change any of these parameters, you can either click and drag the sliding scale or click the numerical text
and enter the value through the keyboard. You can also change the upper limit on all of the gain scales.
__________________________________________________________
41
8100\pv220man\pv220man
ProView 2.2x User’s Guide
__________________________________________________________
5. Click the OK button to save your changes. If not, click the Cancel button.
6. To restart your PID loop, click the word Manual underneath the Tagname and wait a second for it to change
to PID. Your new parameters are now in use by the ProControl.
One type of auto-tuning algorithm is provided with ProView, and can be used to calculate optimal PID
parameters for certain types of process loops. Contact EOS Research technical support to see if this version
of auto-tuning may benefit your process.
If the analog output is configured for proportional output,
the dialog box on the right will be displayed. You can
make changes as outlined above.
__________________________________________________________
42
8100\pv220man\pv220man
ProView 2.2x User’s Guide
__________________________________________________________
Process and Instrumentation Diagram
The P&ID option allows you to pull up an alternate “process and instrumentation diagram” representation of
your system, which can be used to display operating data that is superimposed on a process diagram (or map,
or picture of your dog, etc.). The P&ID option is designed to provide an alternate human-machine interface
(HMI) for ProView with customizable graphics. Note that the P&ID screen is not interactive like the main
ProView screen is; that is, data can be displayed on this screen, but commands cannot be issued from it.
Typically, your system integrator would configure this screen for you. The P&ID capability must be enabled
by the integrator in order for you to use this feature. If this option has been included in your system
configuration, you can view this diagram by clicking on the P & ID icon.
The Process and Instrumentation Diagram contains a graphical representation of your system. Digital
inputs and outputs are displayed as tagname boxes that change color when the I/O point is active (red or
green). Analog I/O are displayed as numerical values, with analog outputs also containing the % symbol to
distinguish them from analog inputs. Click the OK button to go back to the main ProView screen.
As discussed above, the P&ID screen is typically supplied by your system integrator. However, if you would
like to make changes to the P&ID screen, follow the procedures outlined below. If you want to change the
__________________________________________________________
43
8100\pv220man\pv220man
ProView 2.2x User’s Guide
__________________________________________________________
background image, you can create a new .pid file. The P&ID must be a bitmap format file (.bmp) that can be
created with a drawing program. The bitmap image can be any size you choose, the file name must be the
same as your ProView site file (.pvs) with the filename extension changed to .pid, and it must be placed in the
same folder as your .pvs file.
When you open the P&ID screen in ProView, you can move or remove the I/O boxes as you choose.
Remember to Save the site file before you exit ProView to store these changes.
To change the appearance of the P & ID:
1. To move a descriptive box containing either a tagname or value, hold the shift key and click the left
mouse button when positioned on the appropriate box. This will enable you to drag and re-position
the box wherever you choose.
2. To remove a descriptive box, double-click on the box. Once you have removed a box, it will no
longer be available to you unless you restore all boxes.
3. To restore all descriptive boxes, position the mouse at the bottom of the P & ID window in the gray
area. Then hold down the control and shift keys while simultaneously clicking the left mouse button.
__________________________________________________________
44
8100\pv220man\pv220man
ProView 2.2x User’s Guide
__________________________________________________________
CHAPTER 6: WORKING WITH LOGGED DATA
This chapter explains how to gather and analyze logged data that is being stored in the ProControl unit’s
battery-backed memory.
Hour Meters
The ProControl maintains Hour Meters for inputs and outputs to indicate how long the I/O point has been
ON and OFF. The hour meters are particularly useful in keeping track of equipment “run” times (discrete
outputs), but are also maintained for discrete and analog inputs. For analog inputs, the hour meters indicate
plus
the time the input has been in and out of its Active State (see the definition of Active State in the Series 2
User Manual). The hour meters are updated every second on the ProControl unit. The ON and OFF times are
displayed at a resolution of 1/10 (0.1) of a minute.
To read the Hour Meters, follow these steps:
1. Position the mouse pointer over the I/O point’s tagname until a balloon appears, then right-click until
you see Hour Meter.
2. Click the left mouse button to view the hour meter. The Hour Meter dialog box appears.
3. The Hour Meter box displays information in the form of Hours : Minutes.10th Minutes for both
ON time and OFF time. The Duty Cycle or ratio of ON time to total time is also displayed. It may
take a few seconds for the display to be updated once the dialog box appears.
4. To edit the Total Time ON or Total Time OFF, click and highlight the total time text and make the
required changes. Press the enter key to confirm the changes and send the new value to the
ProControl unit. Resetting the time values to zero, for instance, can be used when a motor is changed
out, to keep track of lubrication intervals, etc.
5. Click on the OK button to close the Hour Meter dialog box.
__________________________________________________________
45
8100\pv220man\pv220man
ProView 2.2x User’s Guide
__________________________________________________________
Totalizers
If your site configuration includes an analog input to which a flow meter or pulse counter is connected, it may
also include a Totalizer. Totalizers provide the ability to view the cumulative total of a flow-based input or
accumulated pulses from a counting device.
To view the Totalizer, do the following:
1. Position the mouse pointer over the I/O point’s tagname until a balloon appears, then right-click until
you see Totalizer.
2. Click the left mouse button to view the totalizer. The Totalizer dialog box appears.
3. The Total Flow for this input since the totalizer was last reset is displayed. It is updated every
second while the dialog box is visible and while ProView is connected to the ProControl unit.
4. If you would like to set the totalizer to a different value, click on the value displayed in the dialog
box. Enter the new value for the totalizer and press the enter key.
5. Click on the OK button to close the Totalizer dialog box.
Trend Graphing
ProView can display a real-time trend graph while you are connected either locally or remotely to the
ProControl. A 5-minute trend can be displayed in the lower left hand side of the ProView window.
To start trend graphing:
1. Position the mouse pointer over an analog input’s tagname until a balloon appears, then right-click
until you see Trend.
__________________________________________________________
46
8100\pv220man\pv220man
ProView 2.2x User’s Guide
__________________________________________________________
2. Click the left mouse button to produce the Trend window for that input.
3. The trend window provides a 5-minute history of the real-time data for that analog input. You will
see the trend “drift” from right to left across the window, and it will be updated as long as you are
connected to the ProControl. If you wish to observe another trend, click on the tagname of another
analog input and the trend window will be refreshed with the new data.
4. To stop trending and empty the trend window, click on the Trend for… text block in the trend panel.
Downloading Logged Data
Operations data is stored electronically in the ProControl’s memory in accordance with the datalogging setup
(Chapter 5). To view the logged data, click on Get Logged Data in the Datalogging menu. This opens the
Extract Datalogged Information dialog box.
__________________________________________________________
47
8100\pv220man\pv220man
ProView 2.2x User’s Guide
__________________________________________________________
Getting Logged Data
To extract datalogged information from the ProControl unit, do the following:
1. Select the start time in the Log Start Time panel. ProView will extract all data that has been logged
since this time. Change the start time by clicking on the spin buttons to increase or decrease the
Month, Day, Hour, Minute or Second. Click on the Update Start Time button to reset the start time
to the current time.
__________________________________________________________
48
8100\pv220man\pv220man
ProView 2.2x User’s Guide
__________________________________________________________
2. Select the type of data you wish to extract. Click on the Discrete, Analog In, Analog Out or Events
radio button.
3. Click on the Extract Log Data From ProControl System button.
4. ProView performs a scan of available data. You can then monitor the progress of the data extraction.
5. A message box will appear when the data extraction process is complete.
__________________________________________________________
49
8100\pv220man\pv220man
ProView 2.2x User’s Guide
__________________________________________________________
Looking at Discrete Data
To examine the discrete datalog record that you have extracted click on the Discrete tab.
The Discrete data window appears. On the left, the Select I/O list box contains a list of all enabled discrete
inputs and outputs. In the middle is the Discrete Data record. On the right, the Earliest Record extracted is
shown as 13:07:09 on 3/31/15. The Latest Record is 13:25:13 on 3/31/15. A total of 56 records were
extracted. Clicking on All in the Select I/O list box will show the entire discrete record in the Discrete Data
window. You can scroll through the discrete records in the window.
The Select I/O list box can be used to filter the data record to include just one discrete input or output. In the
example below, the CHLMET output has been selected. Whenever a single input or output is selected,
statistics are generated regarding the selected input or output, spanning the period of time from the first state
change to the last one in the record. There are 16 data points for CHLMET below, and the input was ON for
19 minutes and 49 seconds and OFF for 21 minutes and 11 seconds for the period of time between the first
and last record.
Moving the Earliest Record and Latest Record sliders or spin buttons will filter the total record with respect
to time. Click and hold a slider and move the mouse to the left or right. You can also click on the spin
buttons to change the time window. When you are finished filtering the time, click again on the input you
__________________________________________________________
50
8100\pv220man\pv220man
ProView 2.2x User’s Guide
__________________________________________________________
wish to examine in the Select I/O list box to see the results of your changes. In the example below, the total
record has been limited to records 17 through 35. Within this time interval, 5 state changes of CHLMET
occurred.
Looking at Events Data
First, go back to the Get Logged Data tab and extract the Events data. After the data has been extracted,
click on the Events tab to examine the event datalogging record.
The Events data window appears. The Select Event list box contains a list of all enabled processes and other
ProControl events. In the middle is the Event Data record. The Earliest Record and Latest Record
extracted are shown to the right.
To view the data, follow the same procedure described for Discrete Data. Clicking on All in the Select
Event list box will display all the events that were extracted. By clicking on an event in the Event Data
window, a description is provided in the Process Description window below.
__________________________________________________________
51
8100\pv220man\pv220man
ProView 2.2x User’s Guide
__________________________________________________________
Looking at Analog Data
First, go back to the Get Logged Data tab and extract the Analog In or Analog Out data. After the data has
been extracted, click on the Analog tab to examine the event datalogging record.
The Analog data window appears. The Select Input list box contains a list of all enabled analog inputs and
outputs. In the middle is the Analog Input Data record. The Earliest Record and Latest Record extracted
are shown to the right. By clicking on an input or output in the Select Input list box, a graph will be
displayed in the window below.
__________________________________________________________
52
8100\pv220man\pv220man
ProView 2.2x User’s Guide
__________________________________________________________
In the example above, a tank level is shown as it varies over time. Immediately above the graph, statistics are
shown regarding the selected analog point (in this case there are 726 data points with a Low of 2.91, a High
of 5.40 and a Mean of 4.29). As with the digital and events data, the Earliest Record and Latest Record
sliders and spin buttons can be used to filter the total record with respect to time, which is helpful in focusing
on a smaller portion of the graph. If you filter the data in this way, be sure to click on the input tagname
again in the Select Input list box to see the results of your changes.
Graphing Options
Graph options are available to change the look of the analog graph. You can left click on the chart and use
your mouse wheel to zoom in on the data. Other graphing options are on the bottom right of the datalog
window and allow you to show data points and show time on data points. Click on the check box adjacent to
the option you want to use to enable it. It is generally recommended that you zoom in on a portion of the
graph before you use the “show data point” options.
__________________________________________________________
53
8100\pv220man\pv220man
ProView 2.2x User’s Guide
__________________________________________________________
After you are finished examining the datalogged information, you may want to save it for future reference
within ProView or export it to a spreadsheet, database program or word processor.
Saving Logged Data to File
To save a datalogging record to a ProView-readable file, do the following:
1. Click on the Get Logged Data tab. Select the type of file you wish to save by clicking on the
appropriate button in the Data Type panel. Remember that you must have already completed the
separate step of extracting the data type you wish to save.
2. Click on the Save Log Data to File button.
3. This opens the Save xxxxxx Data Log As dialog box, where xxxxxx is the type of data you wish to
save. ProView selects a default file name for you, which is the name of the site configuration file
with the .pvd, .pva or .pve file extension depending on the type of data file you intend to save
(discrete, analog, or events, respectively). However, you may wish to change the file name to
indicate a date representative of the log you are saving, for instance.
5. Click the OK button to save the file.
__________________________________________________________
54
8100\pv220man\pv220man
ProView 2.2x User’s Guide
__________________________________________________________
Opening a Datalog File
To view data that was previously saved in ProView-readable format, do the following:
1. In the Get Logged Data tab of the Extract Datalogged Information dialog box, select the type of
data file you wish to open by clicking on the appropriate button in the Data Type panel.
2. Click on the Open Datalog File button.
3. This opens the Open xxxxxx Data Log As dialog box, where xxxxxx is the type of data you wish to
view. ProView lists any files in the folder you have selected that contain the .pvd, .pva or .pve file
extension (depending on the type of data file you intend to open). Click on the name of the file you
wish to open, and it will appear in the File Name: text box. If the file you wish to open is stored
elsewhere, select the location in the Drives: and Directory: list boxes.
4. Click on the OK button to open the file. View the data as you would any logged data that you have
just extracted.
__________________________________________________________
55
8100\pv220man\pv220man
ProView 2.2x User’s Guide
__________________________________________________________
Exporting Logged Data for use in Other Applications
ProView provides users the ability to export data for use in other applications, so that you can take advantage
of the data manipulation and graphing capabilities provided by widely-used software. ProView allows you to
export analog, discrete or event data to a CSV (Comma-Separated Variable) file, which can then be opened by
any spreadsheet or database program (e.g., Microsoft ExcelTM). You can also export discrete and event data
to a text file for use in a word processor.
1. In the Extract Datalogged Information dialog box, click on the Get Logged Data tab. Select the
type of file you wish to export by clicking on the appropriate button in the Data Type panel. Note
that analog output data cannot be exported.
2. Click on the Export to Text File or Export to CSV File button.
3. This opens the Save Analog Data Log As .CSV File, the Save Discrete Data Log As .TXT File or
other dialog box, depending on the type of file you wish to export. The default file name is the
truncated name of the site configuration file with the .csv or .txt extension. However, you may wish
to change the file name to indicate a date representative of the log you are saving, for instance.
5. Click the OK button to export the file.
6. You will be asked whether you would like to include header information in the file that is saved. The
header provides two lines of basic site information and titles for the columns of data.
__________________________________________________________
56
8100\pv220man\pv220man
ProView 2.2x User’s Guide
__________________________________________________________
!
The CSV file format is considered a Text format by most spreadsheet and database software. When you
open the .csv file created by ProView, be sure to specify that you are opening a Text file. For instance, in
Excel, in the File….Open dialog box, choose Text Files from the list in the File of type list box.
A word about the date format in the exported files: Discrete and event data are exported using a time
stamp in which the date and the time are in separate columns or separated by a comma (for example,
9/15/2000,09:39:08). Analog data are exported using a combined date/time in standard Windows
format (which is the decimal equivalent of the number of days and fractions of a day since January 1,
1900). When an analog data file is opened in a spreadsheet or database software package, you will probably
want to reformat the date/time information in the leftmost column. For instance, in Excel, select the column,
choose Format….Cells, and select a Number format that includes both the date and the time.
FYI
__________________________________________________________
57
8100\pv220man\pv220man
ProView 2.2x User’s Guide
__________________________________________________________
CHAPTER 7: OTHER OPERATIONS
T
his chapter explains how to save the site setup, print current operating data to a file, view the process
configuration, use the annunciator feature and exit the program.
Saving the Site Configuration to File
While you work in ProView, you may change certain system settings that are stored in your site configuration
(or .pvs) file. Examples of some of the parameters stored with your site file include remote communication
settings, passwords, and notes for your tagnames. You should save your .pvs file before closing ProView if
you make any changes to these parameters.
FYI
Remember that most operational settings, such as alarm levels, fax report numbers, datalogging
setup, PID gains, etc. are stored in the ProControl unit, not in your site file. ProView ”pulls up” this
information stored in the ProControl unit when you connect to it. There is no need to save your site
file if you only make changes to these operational settings.
To save your site configuration do the following:
1. Click on Save Site or Save Site As… in the File menu.
Or
The Save Site As dialog box appears. If you chose
Click on the Save File button on the toolbar.
File…Save Site, ProView bypasses the dialog box.
__________________________________________________________
58
8100\pv220man\pv220man
ProView 2.2x User’s Guide
__________________________________________________________
2. Select the Drive, Directory and File Name you would like and click on the OK button to save the
file. You will be asked whether you wish to overwrite the existing file. Choose Yes to complete the
file save.
Printing the Current Data to File
While you are connected to your ProControl via ProView, you can print the current operating data to a text
file for future reference. This can prove useful for documentation and reporting purposes.
To save your current process data to a text file, do the following:
1. Click on Print Current Data in the File menu. You will see the Save Current Data As dialog box.
2. Select the Drive, Directory and File Name you would like. ProView selects a default file name for
you, which is the name of the site configuration file with a .dat file extension. However, you may
wish to change the file name to indicate a date representative of the information you are saving, for
instance. Click the OK button to save the current data to the file.
You can examine the current data file with any text editor or word processor. An example of a file generated
for our sample operation is shown on the following pages.
__________________________________________________________
59
8100\pv220man\pv220man
ProView 2.2x User’s Guide
__________________________________________________________
EOS RESEARCH LTD.
ProControl Series II+
ProView Current Operational Information
***********************************************************************
***** FAX Recipient:
BULLWINKLE MOOSE
*****
***** Customer:
MAYBERRY WATER DEPT
*****
***** Site Location:
MAYBERRY RFD
*****
***********************************************************************
***** Setup:
1
*****
***** Option:
B
*****
***** Type:
102
*****
***** Serial Number:
9999
*****
***** Date:
12/9/2014
*****
***** Time:
14:52:35
*****
***** ProView:
Version 2.200
*****
***********************************************************************
******************************************************************
***** Communications State:
REMOTE CONNECT
*****
***** System Mode:
Auto 14
*****
***** Last Shutdown:
Last Shutdown 12:28:27 , 2/20/2014 , Remote
*****
***** Alarms:
Alarms SET
*****
***** FAX:
Report ON
*****
******************************************************************
THE CURRENT INPUT STATUS:
#
-1
2
3
4
8
17
18
19
20
21
22
23
TAGNAME
------WEL1LO
WEL2LO
TWR_HH
TNK_HH
RESET
TWRLVL
TNKLVL
FINFLO
FLOW_2
FLOW_1
FIN_PH
FIN_CL
CURRENT VALUE
------------is OFF
is OFF
is OFF
is OFF
is OFF
41.0 FT
10.07 FT
220.0 GPM
178.1 GPM
95.8 GPM
8.39 PH
0.99 PPM
LO ALARM HI ALARM
TOTALIZER
--------- --------- ---------------
30.0
9.00
0.0
0.0
35.8
7.50
0.80
55.0
11.00
600.0
400.0
170.0
8.50
1.15
2,707,032
11,535,456
10,479,505
GAL
GAL
GAL
HOURS ON
------------000,000 23.6
000,000 02.7
000,000 01.0
000,000 01.5
000,000 00.8
000,044 36.7
000,018 38.8
000,749 30.0
000,758 50.8
000,003 03.4
001,004 05.6
000,499 10.1
HOURS OFF
------------002,704 52.8
002,705 13.8
002,705 15.5
002,705 14.9
002,705 15.7
002,660 39.6
002,686 37.7
001,955 46.4
001,946 25.6
002,702 13.1
001,701 10.8
002,206 06.3
HOURS ON
------------001,871 40.2
001,871 26.7
001,871 27.5
001,655 51.6
001,099 11.9
000,991 03.1
000,485 39.2
000,028 11.2
000,000 12.0
000,000 00.1
000,003 42.3
HOURS OFF
------------000,833 36.1
000,833 48.8
000,833 48.5
001,049 24.9
001,606 04.6
001,714 13.3
002,219 37.3
002,677 05.1
002,705 04.6
002,705 16.5
002,701 34.3
THE CURRENT OUTPUT STATUS:
#
-1
2
3
4
5
8
9
10
11
12
13
TAGNAME
------WLPMP1
WLPMP2
FINPMP
CHLMET
NAOMET
PH_ALM
CL_ALM
TWRALM
WL1ALM
WL2ALM
TNKALM
CURRENT VALUE
------------is ON
is ON
is ON
is ON
is ON
is OFF
is OFF
is OFF
is OFF
is OFF
is OFF
__________________________________________________________
60
8100\pv220man\pv220man
ProView 2.2x User’s Guide
__________________________________________________________
THE CURRENT ANALOG OUTPUT STATUS:
#
-1
2
3
4
TAGNAME
------VSPMP1
VSPMP2
NAOHFD
CHLRFD
VALUE PID Mode
------- -------39.1 %
ALG
46.9 %
ALG
32.0 %
ALG
22.3 %
ALG
SETPOINT
--------40.0
10.00
8.25
P Gain
-----10.0
7.33
9.16
50
I Gain
------.010
.010
.010
D Gain
------0.1
0.5
0.1
MAX CHG
------5.0
%
5.0
%
5.0
%
5.0
%
ANALOG OUTPUT NOTES
------------------VALUE
- The current output level expressed as a percentage 0%=4ma 100%=20ma.
MAN
- (Manual) The PID or PRO control loop algorithm has been turned off.
PID
- The (Proportional, Integral, Derivative) control loop is running.
PRO
- The open loop (Proportional) algorithm is running.
MAX CHG - The maximum amount the output can change in one control cycle.
THE CURRENT REPORTING SETUP:
****************************************************************************
***** Report Enable:
ON
*****
***** FAX Number 1:
1 (999) 555-1234
*****
***** FAX Number 2:
555-4321
*****
***** Scheduled FAX:
Every Day at:
07:00
*****
***** Next Scheduled FAX:
07:00
*****
***** Pager #1:
Enabled, Numeric
*****
***** Pager #2:
Enabled, AlphaNumeric
*****
***** Paging:
Will occur at 2400 baud
*****
***** Page Number 1:
1 (700) 555-6789
*****
***** Pager ID
1:
9876543
*****
***** Page Number 2:
1 (700) 555-6789
*****
***** Pager ID
2:
3456789
*****
****************************************************************************
THE CURRENT DATALOGGING SETUP:
****************************************************************************
***** Enabled Datalogging:
Digital ,Analog ,Event
*****
***** Datalogging Interval:
00:01
*****
***** Next Datalog Time:
13:47
*****
****************************************************************************
Reviewing the Process Configuration
ProView includes a utility that can help you understand the control logic that is programmed into your
ProControl unit (if your site file is not the most up-to-date version, note that the control logic shown may not
match what is in your ProControl unit). Click on Process Configuration under the File menu, and the
following screen will appear, showing the inputs and outputs that are configured for your system:
__________________________________________________________
61
8100\pv220man\pv220man
ProView 2.2x User’s Guide
__________________________________________________________
By selecting inputs and outputs from the left and center columns, respectively, you will see a listing of
process tasks that include your selected I/O. For instance, if you choose an output from the center column,
you will see a list of processes that turn that output ON or OFF in the window on the right. Clicking on a
process will provide a description in the Process Description window. You can select both inputs and
outputs to filter the list of processes. To de-select an I/O point, <Ctrl> - left click on it.
Annunciators
The Annunciator feature is useful for those ProControl users that remain connected to their systems for
extended periods of time via ProView. The Annunciator is a visual alarm indicator for the ProView screen
that is designed to draw attention to an alarm condition that presently exists, or has occurred but has now
cleared. Clicking on Annunciation in the File menu toggles the Annunciation feature on and off. If any
discrete or analog input that is configured as an alarm input becomes active, the input’s tagname will turn red,
and the System Status panel (the panel that indicates Auto or Manual mode) will begin to flash red. The
annunciator continues to flash even if the input is no longer active, so that the operator does not miss an alarm
condition. To acknowledge the alarm, click on Clear Annunciators in the System menu. If an alarm
condition still exists, the annunciator will begin flashing again. Note that only those alarm conditions that
occur in the current ProView session will be annunciated.
__________________________________________________________
62
8100\pv220man\pv220man
ProView 2.2x User’s Guide
__________________________________________________________
Exiting ProView
You can exit ProView by clicking on the
at the top of the main screen or by clicking Exit in the File
menu. You will be asked whether you want to save your site file and any logged data that you have extracted.
__________________________________________________________
63
8100\pv220man\pv220man