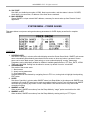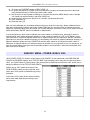
1
microHAM © 2015 All rights reserved SMΩRF RF VECTOR SIGNAL METER microHAM fax: +421 2 4594 5100 e-mail: [email protected] homepage: www.microham.com Version - preliminary 31 October, 2015 1 microHAM © 2015 All rights reserved TABLE OF CONTENTS CHAPTER PAGE 1. FEATURES AND FUNCTIONS ................................................................................................... 4 2. IMPORTANT WARNINGS .......................................................................................................... 5 3. HARDWARE DESCRIPTION ...................................................................................................... 5 Front Panel .......................................................................................................................... 6 Rear Panel ........................................................................................................................... 7 4. INSTALLATION .......................................................................................................................... 8 5. OPERATION …........................................................................................................................... 9 Sensor Selection ................................................................................................................. 9 Bar Graphs Scales and Ranges........................................................................................... 9 6. SCREEN …............................................................................................................................... 11 SCREEN: Status Bar ........................................................................................................ 11 SCREEN: Edit Mode ........................................................................................................ 12 SCREEN: Two Point Measurements ................................................................................ 12 SCREEN: Bar Graph Functions ....................................................................................... 13 SCREEN: Bar Graph Settings ...........................................................................................14 SCREEN: Tone Generator ................................................................................................16 SCREEN: Screens Menu ..................................................................................................18 7. SINGLE SENSOR SCREEN TEMPLATES ............................................................................... 19 STANDARD Screen .......................................................................................................... 19 LARGE Screen ................................................................................................................. 20 PSK Screen ...................................................................................................................... 21 TUNE Screen .................................................................................................................... 22 TECHNICAL Screen ........................................................................................................ 23 OSCILLOSCOPE Screen .................................................................................................. 25 SPECTRUM Screen ......................................................................................................... 28 AUTO Mode ..................................................................................................................... 30 8. DUAL SENSORS SCREEN TEMPLATES ................................................................................ 30 2TX Screen ....................................................................................................................... 31 PA Screen …..................................................................................................................... 32 4IN Screen ........................................................................................................................ 34 9. MAIN MENU .…........................................................................................................................ 36 10. SYSTEM MENU ....................................................................................................................... 36 METER MODE ................................................................................................................... 37 Miscellaneous Settings .......................................................................................................39 Brightness Settings .......................................................................................................... 40 LAN Settings ..................................................................................................................... 41 Power Saving ..................................................................................................................... 42 Time and Date .................................................................................................................. 44 Backup and Restore .......................................................................................................... 45 Screens Management ........................................................................................................46 11. SENSOR 1 MENU ..................................................................................................................... 48 Sensor Details .................................................................................................................... 48 Sensor Cables Table ........................................................................................................ 48 Sensor Cables Calibration ................................................................................................. 50 100% Power Levels ............................................................................................................ 51 Antenna Cables ................................................................................................................ 52 Miscellaneous .................................................................................................................. 53 Copy Settings .................................................................................................................... 54 2 microHAM © 2015 All rights reserved 12. ALARM 1 MENU ....................................................................................................................... 55 Alarms Handling and Operation .........................................................................................55 Alarm Settings .................................................................................................................... 57 SWR Alarm ...................................................................................................................... 59 LOW POWER Alarm ........................................................................................................ 60 HIGH POWER Alarm ........................................................................................................61 PSK IMD Alarm .................................................................................................................. 62 ARCING Alarm ................................................................................................................... 62 13. DATA STRUCTURE DIAGRAM ................................................................................................. 63 14. SENSORS ….............................................................................................................................. 64 15. REMOTE CONTROL …..............................................................................................................65 HTTP Server …..................................................................................................................65 VNC Server ….....................................................................................................................67 Remote Control Application ................................................................................................68 16. TECHNICAL SPECIFICATION …...............................................................................................70 17. PACKAGE CONTENT …............................................................................................................73 18. WARRANTY …............................................................................................................................ 73 DECLARATION OF CONFORMITY ........................................................................................ 74 3 microHAM © 2015 All rights reserved 1 – FEATURES AND FUNCTIONS SMΩRF™ is unique metering instrument, the most powerful and accurate, in-line vector RF power meter to date with accuracy rivaling the professional instruments. Has tons of extra features, and very high level of user customization to fit every hamshack, every operator's needs. SMΩRF™ connects to RF signal by remote sensor (coupler), available in several models for power levels from miliwatts up to 15kW and frequencies up to 500MHz. HF + 6m sensors provide sample of passing current (I) and voltage (U) on its LOAD port. VHF and UHF sensors provide sample of forward (FWD) and reflected (REF) power to meter. The meter can simultaneously measure two independent signals from any two sensors and shows measurement results on its front panel or computer. Main features: • Operating frequency from 1.8 – 500MHz. • Signed phase measurement. • Two points of measurement, at the sensor point and at the antenna point. • Phase measurement between sensors.* • Real time temperature compensation in meter and sensor. • Dual, high speed, three color, user adjustable auto-ranging LED bar graphs with configurable peak hold. • Every meter and every sensor individually factory calibrated for best accuracy. Temperature controlled, computer automatized calibration setup makes over 10,000 calibration points in each meter and over 100 points in each sensor. Calibrated per port for level, frequency, phase, and temperature. • Very wide viewing angle, sunlight readable, high contrast graphics OLED display. • Multiple, user configurable display screens for powers, impedance, waveform, spectrum, PSK, SO2R … • User configurable alarms in three importance levels (warning, alarm, fault) for two power ranges on per sensor, per band basis for SWR, Low Power and High Power alerts. Connectivity: • Internet enabled, native IEEE 802.3 Ethernet port for remote connectivity. • Internal web server for simple access from the computer browser for status checking, maintenance and firmware updates, no drivers, no specialized software installation. • TCP port for high speed remote control applications, open protocol. • High purity, DDS based test signal generator (single/dual tone, noise) for linearity and bandwidth tests. • iLINK port for simplified connection to our interfaces. • Two keying, pass thru ports and RS232 serial port for legacy connections. • Well featured Auxiliary port for future expansions (wall mount 7 segment LED displays, analog meter). Other features: • Internal speaker for audible alerts. • Internet synchronized real time clock. • Ambient light sensor for display and led bars brightness control. • Free Remote Control application for Windows and OS-X. • EMI shielded, aluminum die cast enclosure. Internal processing highlights: • 210 MIPS, 32bit floating point Cortex M4 DSP processor for extremely fast updates and accurate calculation of complex functions. • hi-grade, parallel 16bit ADC, sampled at 125ksps. • 24bit DAC at 160ksps for signal generator. * Both sensors are of the same type (U/I or FWD/REF), connected by the same length leads and operating at the same frequency. 4 microHAM © 2015 All rights reserved 2 - IMPORTANT WARNINGS ALWAYS check the polarity of the 13.8 V power supply before you connect it to the meter. If you use meter without sensors, NEVER exceed 26dBm level to the meter's IN RF ports. If you use some accessory injecting DC power to the coaxial cable, connect it ALWAYS behind the LOAD port of any CHF sensor. DO NOT connect OUT ports to inductive, AC or >24VDC loads. DO NOT place meter on hot surfaces. DO NOT touch the sensor under RF power. ALWAYS backup your settings prior firmware update. 3 - HARDWARE DESCRIPTION SMΩRF system consists of two parts, sensor and meter. Sensor is a box, inserted in transmission line (coaxial cable) between source of power (transceiver or power amplifier) and the load (antenna). Depending on used sensor, it provides sample of current (I) and voltage (U) on transmission line, or forward (FWD) and reflected (REF) power sample. All HF sensors are U/I type with current and voltage transformers inside. All VHF/UHF sensors are FWD/REF type directional couplers. All sensors have internal micro-controller and EEPROM memory for calibration data storage. Micro-controller measures internal temperature of the coupler and provides these data on request to the meter. Meter connects to sensor's sample outputs, and measures their magnitude and phase at a rate of 125,000 samples per second as well as internal and sensor temperature. Captured data are than corrected by four dimensional calibration tables taken during individual calibration for magnitude, phase, frequency and temperature for both sensor and meter. Meter then further processes the captured data. For some type of measurements where high data rate is required (alarms, oscilloscope and spectrum screens), raw data are used. For measurements where stability and smoothness is more important, data are additionally filtered in various IIR or FIR filters according to their nature. Computed results are than provided on meter's front panel or computer screen through Ethernet port. Thanks to powerful DSP CPU in the meter and optimized code, meter is capable to do all above tasks in real time and at the same time provide DDS based tone generator output for some kind of specific measurements. 5 microHAM © 2015 All rights reserved Front Panel 1. 2. 3. 4. 5. 6. 7. 8. 9. 10. 11. 12. 13. 14. 15. TOP BAR GRAPH BOTTOM BAR GRAPH TOP BAR GRAPH SCALE INDICATOR BOTTOM BAR GRAPH SCALE INDICATOR BAR GRAPH SCALE RANGE INDICATOR ◦ green color indicates top bar graph range ◦ red color indicates bottom bar graph range ◦ yellow color indicates same range for both bar graphs ALARM INDICATORS ◦ green color indicates warning ◦ red color indicates alarm ◦ flashing red color indicates fault SENSOR INDICATORS MAIN DISPLAY LEFT ← SCREEN ROTATION BUTTON ◦ button serves as left navigation button in EDIT mode and MENU system RIGHT → SCREEN ROTATION BUTTON ◦ button serves as right navigation button in EDIT mode and MENU system EDIT/MENU BUTTON ◦ short press enters EDIT mode and allows editing outlined fields on current screen ◦ pressing and holding for one second enters MENU system of the meter SENSOR 1 BUTTON ◦ when pushed briefly together with SENSOR 2 button, meter switches to the AUTO mode and automatically focuses to the first sensor passing sensing nonzero power ◦ when pushed and held together with SENSOR 2 for one second, meter switches to the DUAL mode and displays special screens designed for two sensors measurements ◦ button serves as up navigation button in MENU system. SENSOR 2 BUTTON ◦ when pushed briefly together with SENSOR 1 button, meter switches to the AUTO mode and automatically focuses to the first sensor passing sensing nonzero power ◦ when pushed and held together with SENSOR 1 for one second, meter switches to the DUAL mode and displays special screens designed for two sensors measurements ◦ button serves as down navigation button in MENU system ROTARY KNOB ◦ when rotated sets top bar graph range ◦ when pushed and rotated sets bottom bar graph range ◦ changes selected value in EDIT mode and MENU system ◦ when pushed in EDIT or MENU system, it pop ups short help for selected item ◦ during ALARM condition push snoozes or resets active alarm AMBIENT LIGHT SENSOR ◦ measures ambient light for automatic brightness control of bar graphs and main display 6 microHAM © 2015 All rights reserved Rear Panel 1. SENSOR 1 FORWARD (FWD) or VOLTAGE (U) SAMPLE INPUT FWD/U connection port of SENSOR 1 serves as INPUT 1 in 4 INPUT mode SENSOR 1 REFLECTED (REF) or CURRENT (I) SAMPLE INPUT ◦ REF/I connection port of SENSOR 1 ◦ serves as INPUT 2 in 4 INPUT mode SENSOR 2 FORWARD (FWD) or VOLTAGE (U) SAMPLE INPUT ◦ FWD/U connection port of SENSOR 2 ◦ serves as INPUT 3 in 4 INPUT mode SENSOR 2 REFLECTED (REF) or CURRENT (I) SAMPLE INPUT ◦ REF/I connection port of SENSOR 2 ◦ serves as INPUT 4 in 4 INPUT mode PTT / INHIBIT IN1 ◦ configurable input coupled to SENSOR 1 PTT / INHIBIT OUT1 ◦ configurable output coupled to SENSOR 1 PTT / INHIBIT IN2 ◦ configurable input coupled to SENSOR 2 PTT / INHIBIT OUT2 ◦ configurable output coupled to SENSOR 2 TEST TONE ◦ internal tone generator output, 4 pole 3.5mm jack LAN ◦ IEEE 802.3 Ethernet port AUX ◦ Accessory port iLINK ◦ first iLINK port for connection to iLINK enabled microHAM devices iLINK ◦ second iLINK port for connection to iLINK enabled microHAM devices SERIAL ◦ RS232 port for general low speed connectivity DC 13.8V ◦ power input, max. 16V, center positive, shell negative POWER SWITCH GROUNDING SCREW ◦ ◦ 2. 3. 4. 5. 6. 7. 8. 9. 10. 11. 12. 13. 14. 15. 16. 17. 7 microHAM © 2015 All rights reserved 4 – INSTALLATION 1. Connect sensor to the meter Connect U or FWD sample output of the sensor to the meter's SENSOR 1 – U/FWD input using supplied SMA – SMA cable. It isn't important which one of two supplied SMA – SMA cables you use, but keep the calibration certificate of the cable and mark it to reflect the connection (SENSOR #SN/U). Later you can enter calibration table of the cable from the certificate sheet to the meter memory in SENSOR MENU. It will slightly improve metering accuracy but you will need to pair calibration table to the cable, each is individually calibrated in the factory. • Connect I or REF sample output of the sensor to the meter's SENSOR 1 – I/REF input using second SMA – SMA cable. Again, keep the calibration certificate of the cable and mark it to reflect the connection (SENSOR #SN/I). • If you are connecting the second sensor, use SENSOR 2 ports on meter in the same manner as for SENSOR 1 above. Connect sensor to the transceiver and the antenna • Connect antenna port of your transceiver or power amplifier to the sensor's TX port. • Connect your antenna to the LOAD port of the sensor. Connect meter to the transceiver or microHAM interface • Connect supplied miniDIN6 – miniDIN6 cable from iLINK port of the meter to the iLINK port on microHAM interface. If you have multiple microHAM interfaces and you are unsure where to connect iLINK port, please refer to METER MODE chapter for more details. • If you don't have our interface, or you have interface without iLINK port, please refer to ALARM SETTINGS chapter for more details. This connection is not necessary for SMΩRF functionality, but when used, SMΩRF can protect your TX chain using internal ALARMs. Connect power to the meter • Connect 13.8V DC power supply to the DC power jack of the meter. DC power jack is standard 2.1/5.5 mm power jack, use supplied plug if you haven't one. • Observe the polarity!!! Center is positive (+), shell is negative (-). • Use well regulated and filtered power supply capable to provide 1.3A. • Connect grounding lead from your central grounding point in the shack to the ground terminal screw on the meter. Turn power On • Flip the power switch on the rear panel. • After power up, meter checks for presence of sensors on its inputs. When the meter finds a new sensor, it copies calibration data from the sensor's memory to the meter's memory. Each sensor has built in a large calibration table, transfer of these data to meter may take several minutes. Be patient and don't worry, it is just a one time procedure and happens only on the very first connection to the new sensor. When done, meter will automatically switch to one of the metering screens. Select metering mode • Press and hold MENU button for a second. Using ← / → buttons select SYSTEM MENU. Press briefly MENU to enter. Select METER MODE. Press briefly MENU to enter. • If you are connecting second sensor or both sensors at the same time, please refer to METER MODE chapter to understand what metering mode means and does in order to use correct one for your purpose. Otherwise select SINGLE RADIO / SINGLE SENSOR mode by rotary knob. Press MENU briefly to register. • 2. 3. 4. 5. 6. 8 microHAM © 2015 All rights reserved 5 – OPERATION Operating SMΩRF is easy and intuitive, but to use it effectively and to maximal pleasure, it is important to understand its structure and relationship between data and settings. SENSOR SELECTION First basic selection on SMΩRF is a SENSOR focus. If you have only one SENSOR, it is just the matter of pressing bottom SENSOR 1 button [12]. Press bottom SENSOR 1 button briefly to change focus to that sensor. When SENSOR 1 is selected, red SENSOR 1 indicator [7] is steadily lit. If SMΩRF has both sensors installed, there are more options. For manual selection of the sensor press SENSOR 1 [12] or SENSOR 2 [13] button. SENSOR 2 focus is indicated by green SENSOR 2 [7] indicator. When SENSOR 1 and SENSOR 2 buttons are pressed briefly together, meter switches to AUTO mode. In AUTO mode, meter switches focus automatically to the first sensor which detects power. Activated AUTO mode is indicated by gently flashing SENSOR 1 or SENSOR 2 indicator [7]. AUTO mode is useful for multiband HF+VHF/UHF transceivers where meter automatically switches between sensors according to operating band (HF vs VHF or UHF). For SO2R contesting setups where only one transceiver transmits at a time, AUTO mode is invaluable. When SENSOR 1 button and SENSOR 2 buttons are pushed and held together for one second, meter switches to DUAL mode. When meter switches to the DUAL mode, it provides measurement results of both sensors at the same time. Please note, AUTO mode and DUAL mode availability depends on selected METER MODE. It will be described in details later, just to not panic if you can't do it right now :-) . BAR GRAPHS SCALES and RANGES Bar graphs in SMΩRF are well featured and deeply customized indicators capable of displaying much more than just power or SWR. The selection of what is actually shown on the bar graph - one of available power readings (forward, reflected, delivered, all these variants at antenna) or parts of the complex impedance or SWR - can be quickly set in SCREEN EDIT mode (described below). Full functionality and settings of bar graphs will be described in separate BAR GRAPHS SETTINGS chapter, here, handling of scales and ranges is described. At the very beginning one important note to remember. Information presented on bar graphs are always related to one sensor, either SENSOR 1 or SENSOR 2 according to the SENSOR selection (see above). In DUAL mode, it is possible to select whether the bar graph shows data of SENSOR 1 or SENSOR 2 individually but both bar graphs show data of one sensor. Remote Control application on computer shows four (4) bar graphs in DUAL mode. Both TOP BAR [1] and BOTTOM BAR [2] has its own POWER reading scale. There are three (3) linear scales for each in 10/20/50 full scale divisions, and five RANGE multipliers: x0.1, x1, x10, x100, x1000. Last x1000 9 microHAM © 2015 All rights reserved multiplier is indicated by flashing x100 indicator. Bottom power reading scale is shortened to half. Final value is given by multiplying indicated value on the current scale by RANGE multiplier. Current scale on TOP bar is indicated by one of SCALE indicators [3], and current RANGE is indicated by one of RANGE indicators [5]. BOTTOM bar scale is indicated by its own SCALE [4] and RANGE indicator [5]. While scale indicators for top and bottom bar are separate, range indicators are shared and differentiated by color. TOP bar uses GREEN range indicator, BOTTOM bar RED indicator. When RANGE multiplier for both bars is the same (rare but may happen), RANGE indicator is YELLOW. Any selected power type for top and/or bottom bar graph is always shown in W [Watt] units. When bar shows POWER, both bars can have independently defined four (4) power ranges, and for each power range one of three (3) available colors can be assigned, for each band, each screen separately. These ranges and not related to scale ranges described above, they may start and end anywhere from 0W up to maximal power. Advantage of colored ranges is readability. When you set for example 50-100W range to be shown in red color, power from 50-100W will always be shown in red color, regardless of scale range (it doesn't matter if you are in 100W scale or 2000W scale). In this way you can make some nicely visible important power areas like optimal driving power for amplifier, maximal power to certain antenna etc ... When bottom bar [2] shows SWR instead of reflected power, it is indicated by YELLOW SWR scale indicator [4]. SWR has its own, specialized scale divided to four (4) linear sub-scales in order to achieve fast, simple and precise readout. SWR from 1.0 to 3.0 - the most important section - has linear division of 0.05 per bar segment. It takes 80% of the bar length. SWR from 3.0 to 4.0 has division of 0.2 per segment, from 4.0 to 7.0 division 1 per segment, while SWR 7 segment is lit when SWR is up to 10. Last but one shows SWR from 10 to 15, last one everything higher than 15. Same as for the power, also for SWR four (4) custom color ranges can be defined in the BOTTOM BAR MENU, on per band basis, settings follow the same segmented scale, but this time in a same division and ranges as are defined SWR sub-scales. When bars are configured to show parts of Complex Impedance, the two scales printed in between the two LED bars are used. Scale above the central line applies to the top bar graph and shows Resistance R or Absolute value of Impedance |Z| in 0 - 100Ω range. Scale below the central line applies to the bottom bar graph and shows Reactance X or Phase angle Φ in -100 to +100Ω or -100 to +100º range. Bar graphs can operate in MANUAL or AUTO RANGE mode. ROTARY KNOB [14] is used to select the mode and to select range in MANUAL mode. When rotated in CW direction it changes range from the lowest (least sensitive) to the highest respectively. When rotated in CCW direction, very last CCW position is AUTO RANGE. In AUTO RANGE mode meter switches range upward immediately but down-ranges with timeout. BARS DOWNRANGING timeout is adjustable in SYSTEM MENU | MISCELLANEOUS if you don't like the default value. When rotary knob is depressed and rotated, it changes ranges for bottom bar in a same manner as for top bar. In MANUAL mode it is possible to overload current range. Overloaded range is indicated by fast flashing SCALE indicator [3]. Each range allows 2% overload without overload indication. Since bar graphs are software driven, there is no damage even if they are hugely overloaded for a long time, don't worry if it happens. Last but one CCW range position of the rotary knob is percentage (%) range. When enabled, it is indicated by % RANGE indicator [5]. This range is useful for instant checking if everything is as should be, because 100% power level is always full deflection on linear scale without any range switching. 100% power levels can be precisely set on per sensor, per band basis in SENSOR MENU according to your specific requirements or available power. 100% power level value is also used in TUNE SCREEN, optimized SCREEN for tuning manual Power Amplifiers or Antenna Tuners. 10 microHAM © 2015 All rights reserved 6 – SCREENS SMΩRF provides measurement results in form of SCREENs. Every SCREEN is a group of measurements and settings for Main display [8], Bar Graphs [1],[2], Alarms [6] and Tone Generator. Up to 16 screens can be associated to each of SENSOR1 and SENSOR2, separately. The dedicated top ← [9] / → [10] buttons switch between SCREENs of one sensor. Each SCREEN in the sequence can be turned on or off in the SYSTEM MENU | SCREENS MANAGEMENT MENU. Internally, SCREENs are built on layout templates. The template defines, how the measurement results are presented on main display [8], if they are displayed numerically (classic digital wattmeter appearance) or also graphically (oscilloscope, spectrum or PSK screens). There are several built in templates covering most of situations user can face during regular operation, contesting as well as experimenting on antennas, amplifiers or matching networks. Bottom line: Main Display template (including all related settings) + Bar Graphs (including all their settings) + Alarms (individually enabled/disabled) + Tone Generator (including all its settings) forms one SCREEN. STATUS BAR On top of each screen, status indicators and bar graphs function choice (or current antenna cable choice) is shown. 1. Frequency validity Using the calibration data, each measured sample undergoes an adjustment procedure, which needs to know the frequency of incoming signal, therefore is important to see it on all the time. If measured signal is very low in power, it may happen that the signal is too weak to measure its frequency, while its amplitude is still well measurable to show the power. In this case the F indicator is off and meter uses last measured frequency. • If SMΩRF is connected to microHAM device over iLINK port, it receives exact operating frequency from this device even if transceiver is not transmitting. LAN port status • Indicates Ethernet port state and connection status. • When off, SMΩRF is not connected to LAN • When lit in half brightness, SMΩRF is physically connected to LAN but there is no active connection from a computer. • When is fully illuminated, LAN port is opened by remote device or computer. Serial port status • When lit, serial port transfers data. T-BAR: Top Bar Graph data or ANT-S1/ANT-S2: Selected Antenna Cable • Shows what data are shown on TOP Bar graph. • Shows antenna cable selected for current frequency band for SENSOR1/SENSOR2 B-BAR: Bottom Bar Graph data or ANT-S1/ANT-S2: Selected Antenna Cable • Shows what data are shown on BOTTOM Bar Graph. • Shows antenna cable selected for current frequency band for SENSOR1/SENSOR2 • 2. 3. 4. 5. 11 microHAM © 2015 All rights reserved EDIT MODE Built in SCREENs can be very easily customized in real time, cloned for the same layout but different parameters, copied between sensors etc. As was written above, to each sensor up to 16 screens can be associated, doesn't matter if they are built in, customized or cloned. You can have the same screen cloned with same settings for main display because you like the template but you need different settings for bar graphs (for example because you want slower movement on SSB) or for whatever reason. To enter EDIT mode push briefly EDIT button [11]. To exit EDIT MODE push briefly EDIT button again. In EDIT mode main display [8] shows some fields outlined. Outlined fields are parameters that can be changed, customized. Basic and globally applicable golden rule is: “What is outlined, it can be changed”. Outline around the parameter which fades in and out means that the parameter is selected and can be changed by Rotary Knob. To move selection between parameters use ← and → SCREEN buttons. Built-in HELP If you are unsure what some parameter means, push the rotary knob for short help. By rotating knob while you are in the help window, you can scroll between all available choices and read at the same time what it means or does. Push the knob or EDIT button to register new choice and exit from help window. We've put a lot of effort to make short help available for virtually every item possible to change. Once you read this manual completely, built-in help system should refresh your memory and make you able to set what you want without reaching for this manual again. Hope you find the built-in help useful. TWO POINT MEASUREMENTS, TX and ANT subscripts, - REF When you look at most of SCREENs you certainly wonder what these TX and ANT subscripted suffixes means. They present another unique feature of the SMΩRF called “two point measurement”. Thanks to the calibration correction, SMΩRF provides very accurate measurements related to the outer plane of the LOAD connector at the sensor. This point is in SMΩRF language called TX Feed Point and data measured at this point are shown with TX suffix after the data type, like FWD TX for the forward power or SWR TX for Standing Wave Ratio. Having measured all data at the TX Feed Point, SMΩRF can mathematically work out powers and transmission line parameters at the end of the cable where cable connects your antenna and show what happens there, how much power is actually radiated. This point is called ANT Feed Point and data at this point are shown with ANT suffix after the data type, like FWD ANT for the forward power or SWR ANT for Standing Wave Ratio. Although these data are calculated rather than measured, SMΩRF includes precise models of over 30 commonly used coaxial cables to choose from. Accuracy of provided results is directly related to the manufacturing differences of the cable to its specification, accuracy of the user entered cable length and accuracy of the TX feed point measurements. Good cable matches specifications within 5% according to cable manufacturer claims, how accurately you measure and enter physical cable length is up to you. The SENSOR MENU - ANTENNA CABLES chapter deals with antenna cables in more detail. Please note, by default SMΩRF uses lossless 50Ω cable model for all ANT Feed Points to avoid any confusion while you aren't familiar with this feature. It doesn't matter if you choose TX or ANT Feed Point until you edit ANTENNA CABLES table. Till than result will be the same, providing values of TX Feed point in both cases. 12 microHAM © 2015 All rights reserved Another suffix used in provided measurements is superscripted -REF as in FWD TX-REF -REF abbreviation appears only after forward power (FWD) and stands for delivered power, power which was transferred to the cable or to the antenna, cleared of reflected power. FWD TX-REF = (Forward Power – Reflected Power) FWD ANT-REF = (Forward Power – Reflected Power) ; delivered power to the coaxial cable connecting antenna ; actual delivered power to the antenna BAR GRAPHS FUNCTIONS How bar graphs scales and ranges work was already explained, now we look at bar graphs functions and settings. While settings for top and bottom bar graph are almost identical, function sets available for each are much different. Please note, bar graph function and settings are remembered separately for each SENSOR and each SCREEN. It means that you can have different bar graph behavior for every screen or screen copy. Anyway, when you are happy with new settings and you want to just clone them to another screen or sensor you can copy bar graph settings in SYSTEM MENU – SCREEN MANAGEMENT (described later). To change function of the bar graph you have to enter EDIT mode and select field (parameter) right next to T-BAR: or B-BAR: icon in top STATUS bar, depends on if you want to change top or bottom bar function. When parameter is selected, you can change function by rotating the knob. TOP BAR GRAPH FUNCTIONS 1. FWD-REF – TX – PK • Peak envelope forward power minus reflected power (delivered power) at the TX feed point. 2. FWD-REF – TX – AVG • Average forward power minus reflected power (delivered power) at the TX (Sensor) feed point. 3. FWD – TX – PK • Peak envelope forward power at the TX (Sensor) feed point. 4. FWD – TX – AVG • Average forward power at the TX (Sensor) feed point. 5. FWD-REF – ANT – PK • Peak envelope forward power minus reflected power at the ANT (Antenna) feed point. 6. FWD-REF – ANT – AVG • Average forward power minus reflected power at the ANT (Antenna) feed point. 7. FWD – ANT – PK • Peak envelope forward power at the ANT (Antenna) feed point. 8. FWD – ANT – AVG • Average forward power Power at the ANT (Antenna) feed point. 9. Z – TX – R • Real part of rectangular coordinates complex impedance at the TX (Sensor) point. 10. Z – TX – |Z| • Absolute value of polar coordinates complex impedance at the TX (Sensor) point. 11. Z – ANT – R • Real part of rectangular coordinates complex impedance at the ANT (Antenna) feed point. 12. Z – ANT – |Z| • Absolute value of polar coordinates complex impedance at the ANT (Antenna) feed point. 13 microHAM © 2015 All rights reserved BOTTOM BAR GRAPH FUNCTIONS 1. SWR – TX • Standing Wave Ratio at the TX (Sensor) feed point. 2. SWR – ANT • Standing Wave Ratio at the ANT (Antenna) feed point. 3. REF – TX – PK • Peak envelope reflected power at the TX (Sensor) feed point. 4. REF – TX – AVG • Average reflected power at the TX (Sensor) feed point. 5. REF – ANT – PK • Peak envelope reflected power at the ANT (Antenna) feed point. 6. REF – ANT – AVG • Average reflected power power at the ANT (Antenna) feed point. 7. Z – TX – X • Imaginary part of rectangular coordinates complex impedance at the TX (Sensor) feed point. 8. Z – ANT – X • Imaginary part of rectangular coordinates complex impedance at the ANT (Antenna) feed point. 9. Z – TX – Φ Phase value of polar coordinates complex impedance at the TX (Sensor) feed point. Z – ANT – Φ • Phase value of polar coordinates complex impedance at the ANT (Antenna) feed point. Z – TX – R + jX • Dual display of rectangular coordinates complex impedance. R (green) + jX (red) at the TX (Sensor) feed point. Z – ANT – R + jX • Dual display of rectangular coordinates complex impedance. R (green) + jX (red) at the ANT (Antenna) feed point. Z – TX – |Z|Φ • Dual display of polar coordinates complex impedance. |Z| (green) Φ (red) at the TX (Sensor) feed point. Z – ANT – |Z|Φ • Dual display of polar coordinates complex impedance. |Z| (green) Φ (red) at the ANT (Antenna) feed point. • 10. 11. 12. 13. 14. BAR GRAPHS SETTINGS To change bar graph settings you have to enter TOP LED BAR or BOTTOM LED BAR menu. We haven't described MENU system yet, but these two MENU items have shortcuts from the main display screen, so we can do it a bit later. To enter in by shortcut, you have to go to the EDIT mode by pushing briefly EDIT button and selecting T-BAR: or B-BAR: icon in STATUS bar. When icon is selected push EDIT button again and you will be directly moved to the TOP or the BOTTOM LED BAR MENU, depends if you have pushed EDIT button on TBAR: or B-BAR: icon respectively. Bar graph settings for top and bottom bar graph are same, only difference is that bottom bar graph has additional settings for SWR colors. 1. MODE Changes bar graph drawing mode. DOT draws just one segment of actual value, BAR draws all segments from left up to actual value. 2. AVG ATTACK/DECAY • Sets averaging time constants used for average values (AVG). Range: 0 – 2000ms, Step: 10ms. • 14 microHAM © 2015 All rights reserved 3. PK ATTACK Sets attack time used for peak values (PK). Range: 0 – 200ms, Step: 1ms. PK DECAY • Sets decay time used for peak values (PK). Range: 0 – 200ms, Step: 1ms. PEAK HOLD • Turns ON/OFF peak hold function. When enabled, peak value is held on its position as one segment. Higher peak value resets lower peak value. HOLD TIME • Sets how long the peak segment will be lit on its position. Occurrence of higher peak value during the hold will restart this time. Range: 0 – 20s, Step: 100ms. P-H DECAY • Sets decay time for peak-hold segment. Range: 0 – 20s, Step: 100ms. EDIT POWER COLOR TABLE • Defines four (4) custom power ranges and colors on per band basis. Example: • 4. 5. 6. 7. 8. BAND COLOR POWER COLOR POWER COLOR POWER COLOR 160m GRN 8W YEL 10W GRN 40W RED 10. EDIT SWR COLOR TABLE • Defines four (4) custom SWR ranges and colors on per band basis. Applicable to bottom bar graph only. Example: BAND COLOR POWER COLOR POWER COLOR POWER COLOR 160m GRN 1.50 YEL 2.00 RED 3.00 RED 15 microHAM © 2015 All rights reserved MENU SYSTEM - INTRODUCTION In above chapter we mentioned MENU system. To edit all parameters, tables and functions, SMΩRF has extensive, still easy to understand MENU system. MENU system has a tree structure always starting from the root MAIN MENU, having separate branches for global settings - SYSTEM MENU, sensor related settings SENSOR 1, 2 MENU, alarms settings for each sensor - ALARM 1, 2 MENU and four (4) MENU items for each SCREEN: TOP LED BAR, BOTTOM LED BAR, SCREEN MENU and TONE GENERATOR. Push and hold for one second MENU button [11] to enter into root MAIN MENU tree. MENU system has autoexit, it means that to exit MENU you have to pass through any branch of the MENU tree by repeatedly briefly pressing MENU button, until reaching the end of the given branch-chain and returning to the main SCREEN. In BAR GRAPH SETTINGS chapter we have described TOP LED BAR MENU and BOTTOM LED BAR MENU. Now we are going to take a look at last two MENU items coupled to the SCREEN, and it is TONE GENERATOR and SCREEN MENU. TONE GENERATOR Tone generator can be considered as an independent instrument built-in the SMΩRF. It can be used independently and simultaneously with other SMΩRF functions for many different measurements on transceiver and power amplifier. Since Tone Generator is a part of the SCREEN, it remembers its settings for each SCREEN separately. Output can be set to generate single sine wave and two tone signal from 150Hz up to 10kHz in 1Hz resolution, white and pink noise, and amplitude or frequency sweep. Generated output signal works in continuous or single shot mode with adjustable time duration. Transformer isolated output is compatible with both balanced and unbalanced microphone inputs, output level is adjustable over 100dB range in peak-to-peak volts. Output jack contains also open collector PTT keying output, always active when generator generates some signal. Audio PTT output has large, fixed 100ms lead time to prevent any kind of hot switching. Internally generator works on DDS principle in 32-bit precision, using 2 14 long sample look-up table for quarter period of the sine waveform. Output is sent to the differential 24bit D/A converter clocked at 160ksps rate. TONE GENERATOR SETTINGS 1. OUTPUT START/STOP choice enables or disables generator output. When generator is in the SINGLE shot mode, output is automatically disabled when generation TIME expires. 2. SIGNAL • SINGLE TONE generates single, sine wave tone of the frequency defined in FREQ.1 field and of amplitude defined in LEVEL1 field. • DUAL TONE generates dual tone. FREQ.1 and LEVEL 1 fields defines frequency and amplitude of the first tone, FREQ. 2 and LEVEL 2 fields defines frequency and amplitude of the second tone. • WHITE NOISE generates white noise signal of LEVEL 1 amplitude. • PINK NOISE generates pink noise signal of LEVEL 1 amplitude. • AMPLITUDE SWEEP generates amplitude sweep with linear or logarithmic response according to the SCALE field definition and of frequency defined in FREQ. 1 field. Amplitude is swept from the LEVEL 1 to the LEVEL 2, duration is defined in the TIME filed. • FREQUENCY SWEEP generates sweep in frequency with linear or logarithmic response according to the SCALE field definition and of amplitude defined in LEVEL 1 field. Frequency is swept from the • 16 microHAM © 2015 All rights reserved FREQ. 1 to the FREQ. 2, duration is defined in the TIME field. 3. MODE SINGLE/CONTINUOUS. If CONTINUOUS, generator generates output signal until stopped manually. If SINGLE, generator generates output only for time specified in the TIME field, then stops automatically. TIME • Specifies duration of the output signal generation for the single shot mode, and specifies the ramp time/repetition rate of sweeps. Range: 10 – 9900ms, Step: 10/100ms. SCALE • Sets LINEAR or LOGARITHMIC response characteristic for sweeps. FREQ. 1 • Specifies frequency for the first tone or starting frequency for the frequency sweep. Range: 150Hz – 9999Hz, Step: 1Hz. FREQ. 2 • Specifies frequency for the second tone or final frequency for the frequency sweep. Range: 150Hz – 9999Hz, Step: 1Hz. LEVEL 1 • Specifies amplitude for the first tone or starting signal level for the amplitude sweep. Range: 1μV – 130mVp-p, Step: 1 LEVEL 2 • Specifies amplitude for the second tone or final signal level for the amplitude sweep. Range: 1μV – 130mVp-p, Step: 1 MONITOR • Enables and sets monitoring level of signal generator output through internal speaker. Please note, if you do require extreme output signal purity, keep it OFF. • 4. 5. 6. 7. 8. 9. 10. CONNECTING TONE OUTPUT TO THE TRANSCEIVER Tone generator output is located at the rear panel, at the TEST TONE jack. Its output is designed to be directly connected to the microphone jack of all common transceivers, however, user is supposed to build own cable according to following instructions. Jack is 3.5mm, 4 pole type. Audio uses two poles for microphone signal and microphone ground. PTT uses another two poles for PTT and PTT ground. PTT ground is internally connected to the system ground of the meter, audio ground is isolated. Use shielded cable and chart below, shield has to be used for PTT ground (PTT GND). Microphone pin index Signal name A PTT Mobile Icom (RJ45 jack microphone) Desktop Icom (Foster 8 jack microphone) Kenwood TS-480 (RJ45 jack microphone) Kenwood & Elecraft (Foster 8 jack microphone) Mobile Yaesu (RJ45 jack microphone) Desktop Yaesu, TenTec (Foster 8 jack microphone) TenTec (Foster 4 jack microphone) 17 4 5 5 2 6 6 3 B PTT GND 7 6 4 8 7 5 4 X MIC 6 1 3 1 5 8 1 Y MIC GND 5 7 6 7 4 7 2 microHAM © 2015 All rights reserved SCREEN MENU This menu serves for setting up the SCREEN to meet user requirements. SCREEN Menu contains data which are the same (but independently adjustable) for each SCREEN, as well as data specific to particular SCREEN e.g. trigger source for Oscilloscope screen or display type for Spectrum screen. These specific data will be explained in individual SCREEN TEMPLATE chapters, here we describe common settings for all screens. 1. AVG ATTACK/DECAY Sets averaging time constants used for average values (AVG). Range: 0 – 2000ms, Step: 10ms. 2. UPDATE • Sets update rate of numerical AVG values. Range: 0 – 1000ms, Step: 10ms 3. PEAK HOLD • Sets for how long the peak value is kept displayed till resets to new, lower peak value. Higher peak value overwrites old peak value immediately. 4. TUNE JUMP • Enables or disables automatic switching to TUNE screen when SMΩRF detects tuning signal. When this function is enabled, SMΩRF inspects incoming signal waveform and if waveform matches defined criteria for “tuning detection” automatically jumps to the TUNE screen. When tuning signal disappears (waveform changes character), screen returns back from TUNE to original screen. • SCREEN ALARMS Alarms settings and adjustments will be described in details in separate chapters, but now it is necessary to put in some introduction. SMΩRF has built-in five (5) type of user configurable alarms in three (3), “importance” levels. Each alarm “importance” level (Warning, Alarm, Fault) can be individually configured for related action (visibility, audibility and TX break) for two power levels on per sensor, per band basis. There are three (3) commonly used alarms – SWR Alarm, High Power Alarm, and Low Power Alarm and two advanced alarms – PSK IMD alarm and ARCING alarm. While Alarms settings are individual for each sensor, their settings apply to all sensor's SCREENs. SCREEN MENU allows further setting, individually enable or disable each level of main three alarms (SWR, HiPower, Lo-Power) on per screen basis. For example, in this way you can disable Warning and Alarm level keeping just Faults of SWR or Low Power alarms in specific measurement screens (oscilloscope) or entirely disable Low Power alarm for PSK screen, etc etc … as you wish to best fit to your needs. To enable (YES) or disable (NO) particular importance level of the alarm, select required cell in the table and turn the knob. WARNING ALARM FAULT SWR NO YES YES Hi-POWER NO YES YES Lo-POWER NO NO YES 18 microHAM © 2015 All rights reserved 7 - SINGLE SENSOR SCREEN TEMPLATES In following chapters we are going to describe single sensor SCREEN templates, their purpose of use, settings and available functions. STANDARD SCREEN 4 1 2 3 Standard screen is a general screen providing four (4) user configurable measurements. Each measurement is related to one of two points of measurements (TX or ANT), has its numerical value, UNIT and TYPE. UNITS: Standard screen supports three (3) configurable power units: • Watts [W] • Decibels referenced to 1mW [dBm] • Decibels referenced to 1W [dBW] For example: 0dBm = 1mW, 50dBm = 100W, 53dBm = 200W, 60dBm = 1kW 0dBW = 1W, 20dBW = 100W, 23dBW = 200W, 30dBW = 1kW. TYPE: After the UNIT field, TYPE is displayed as subscript. SMΩRF supports four power types: • PK – Peak Envelope Power • AVG – Average Power. Averaging time is defined in the SCREEN MENU. • TPK – Total Peak Power. Maximal peak power achieved within one transmission cycle. • TAV – Total Average Power. Average power of one transmission cycle. Available measurements: 1. FORWARD POWER • • • • FWDTX-REF Peak envelope forward power minus reflected power (delivered power) at the TX feed point. FWDANT-REF Peak envelope forward power minus reflected power (delivered power) at the ANT feed point. FWDTX Forward power at the TX (Sensor) feed point. FWDANT Forward power at the ANT (Antenna) feed point. 19 microHAM © 2015 All rights reserved 2. REFLECTED POWER • • REFTX Reflected power at the TX (Sensor) feed point. REFANT Reflected power at the ANT (Antenna) feed point. 3. REFLECTION • • • • SWRTX Standing Wave Ratio at the TX (Sensor) feed point. SWRANT Standing Wave Ratio at the ANT (Antenna) feed point. RLTX Return Loss [dB] at the TX (Sensor) feed point. RLANT Return Loss [dB] at the ANT (Antenna) feed point. 4. IMPEDANCE • • • • IMP TX Rectangular coordinates R + jX complex impedance at the TX (Sensor) feed point. IMP TX Polar coordinates |Z|Φ complex impedance at the TX (Sensor) feed point. IMP ANT Rectangular coordinates R + jX complex impedance at the ANT (Antenna) feed point. IMP ANT Polar coordinates |Z|Φ complex impedance at the ANT (Antenna) feed point. LARGE SCREEN 1 2 Large screen is a screen providing two (2) user configurable measurements when there is no need to monitor many parameters at once, rather have non-disturbing, transparent, fast and as large as possible readout of basic parameters. Good for contesting or as general screen for users preferring large digits. Available measurements: 1. FORWARD • • • • FWDTX-REF Peak envelope forward power minus reflected power (delivered power) at the TX feed point. FWDANT-REF Peak envelope forward power minus reflected power (delivered power) at the ANT feed point. FWDTX Forward power at the TX (Sensor) feed point. FWDANT Forward power at the ANT (Antenna) feed point. 20 microHAM © 2015 All rights reserved 2. REFLECTION • • • • • • REFTX Reflected power at the TX (Sensor) feed point. REFANT Reflected power at the ANT (Antenna) feed point. SWRTX Standing Wave Ratio at the TX (Sensor) feed point. SWRANT Standing Wave Ratio at the ANT (Antenna) feed point. RLTX Return Loss [dB] at the TX (Sensor) feed point. RLANT Return Loss [dB] at the ANT (Antenna) feed point. PSK SCREEN 1 PSK screen is the specialized screen for PSK operating mode enthusiasts. It supports PSK in all speeds (31, 63, 128, 250, 500) providing numerical readout of IMD products together with waveform and spectrum displays. Scope display shows vertically auto-ranged RF waveform monitor for fixed horizontal time, optimized for PSK speed. Spectrum display shows relative level of fundamental frequency and first three, odd order harmonics of the PSK signal in decibels as a difference to fundamental component. Level of these harmonics has main impact to the output signal purity. They are shown dimmed when their level is too low to be certain for IMD quantification (below dynamic range). All measurements on this screen are related to the TX feed point. Forward power is fixed in Watt [W] units, type is adjustable. Reflections (1) can be set to SWR or REF power. Reflected power unit is fixed to Watt [W], using same type as forward power. IMD and spectrum display is updated during IDLE cycles of the PSK transmission, during data transfer IMD measurement gets dimmed and spectrum display cleared. Below the scope display, verbally evaluated quality of the PSK signal (Q:) is located, for users not very familiar with IMD figures. PSK screen has special SCREEN MENU setting for the PSK speed. It can be set to AUTO detection or one of available speeds (31.5, 63, 128 …). When speed is set to AUTO, update rate of IMD values has half the rate. If you like PSK mode and you are interested in having clean signal, this screen will help you to adjust your driving level. 21 microHAM © 2015 All rights reserved TUNE SCREEN 3 1 2 5 1 4 TUNE screen is specialized screen helping to tune manual Power Amplifiers or Antenna Tuners. It provides two forward power readings (1), reflection measurement (2), ratio of current power to user adjustable 100% power level set in SENSOR MENU displayed in percents (3), tuning progress display (4) and instant tuning status indicator (5). 1. FORWARD POWER • • BEST FWD PEAK shows maximal peak power in Watts [W] achieved from the start of tuning and is equivalent to the Total Peak Power (TPK) power type. Resets on exit from TUNE screen (switch to another screen), either manual or automatic. FWD PEAK shows instant peak power in Watts [W] and is equivalent to Peak Envelope Power (PK) type. 2. REFLECTION • • • • • • REFTX Reflected power [W] at the TX (Sensor) feed point. REFANT Reflected power [W] at the ANT (Antenna) feed point. SWRTX Standing Wave Ratio at the TX (Sensor) feed point. SWRANT Standing Wave Ratio at the ANT (Antenna) feed point. RLTX Return Loss [dB] at the TX (Sensor) feed point. RLANT Return Loss [dB] at the ANT (Antenna) feed point. 3. PERCENTAGE • Shows ratio of current power to 100% power level, in percents. In other words, it shows what is your instant power compared to desired 100% power level you have set in SENSOR MENU. When it shows 100%, your output power is tuned exactly to where you want to be. 4. TUNING PROGRESS DISPLAY • Displays power level progress in time, slowly rolling from left to right, new values coming from the right. Vertical scale is linear in Watts, range is set in % while dim line near the top shows 100% level. It serves as a progress bar and helps to quickly recognize if tuning peak you already had wasn't better than your current tuning peak. 5. INSTANT TUNING STATUS INDICATOR • • • Shows instant status of the tuning by well visible arrow. Outlined DOWN ARROW means that instant peak power is decreasing. Outlined UP ARROW indicates that instant power is rising, but its value is lower than the highest, already achieved peak BEST FWD PEAK power. 22 microHAM © 2015 All rights reserved • • Filled UP ARROW informs that instant power is rising and at the same time it is the highest achieved peak power. BEST FWD PEAK updates to new maximum. CHECKMARK means that 100% power level has been achieved, tuning is done. At the same time SMΩRF plays the sound notification through internal speaker. TUNE screen has special SCREEN MENU setting for the 100% level sound notification. Volume of the notification can be set from 0 – 100%. It is worth to note again that to the TUNE screen can be selected manually by ← and → buttons as any other screen, but it is also possible to jump here automatically from any other single sensor screen when SMΩRF detects tuning attempt, and if that screen has enabled AUTO JUMP TO TUNE screen in its SCREEN MENU. All above features provide effective aid to quickly tune your power amplifier or antenna tuner, especially when screen is combined with Z – TX – R+jX or Z – TX – |Z|Φ complex impedance reading on bottom bar graph. TECHNICAL SCREEN So far we have described screens designed for regular, day to day operation or contesting. Now we are going to describe screens which you normally don't use every day, but are extremely helpful for TX signal chain checking, troubleshooting, experimenting on antennas and matching networks or bench measurements. 1 2 6 3 5 4 TECHNICAL screen is the screen designed to provide complete overview of electrical parameters for both of two point measurement points, TX and ANT simultaneously. There are total thirteen (13) values for power, reflection, voltage, current, complex transmission line parameters as well as series and parallel equivalent circuits. Screen is vertically divided to two sides, the left side shows measurements at the TX (sensor) point, the right side shows computed values at the ANT (Antenna) feed point. Outlined center field shows losses in the antenna feed line. 1. FORWARD POWER • Shows peak power for both TX and ANT points in Watts [W], dBm or dBW units. 2. REFLECTION • • • REF Reflected power for both TX and ANT points in Watts [W], dBm or dBW units. SWR Standing Wave Ratio for both TX and ANT points. RL Return Loss [dB] for both TX and ANT points. 3. VOLTAGE, CURRENT • • • • Shows voltage and current for both TX and ANT points. pk = Peak value of voltage and current p-p = Peak-To-Peak value of voltage and current rms = Root-Mean-Square value of voltage and current 23 microHAM © 2015 All rights reserved 4. TL PARAMETERS • • • • • • R, X Rectangular coordinates complex impedance for both TX and ANT points. Z = R + jX; R = Resistance [Ω], X = Reactance [Ω] |Z|Φ Polar coordinates complex impedance for both TX and ANT points. Z = |Z|e jΦ; |Z| = Impedance magnitude [Ω], Φ = Phase [º] G, B Rectangular coordinates complex admittance for both TX and ANT points. Y = G + jB; G = Conductance [S], B = Susceptance [S] Y, Φ Polar coordinates complex admittance for both TX and ANT points. Y = |Y|ejΦ; |Z| = Admittance magnitude [S], Φ = Phase [º] Γ, Γ Rectangular coordinates complex reflection coefficient for both TX and ANT points. Γ = Re {Γ} + j Im {Γ}; Real and Imaginary part of the reflection coefficient Γ Γ, Φ Polar coordinates complex reflection coefficient for both TX and ANT points. Γ = |Γ|ejΦ; |Γ| = Reflection coefficient magnitude, Φ = Phase [º] 5. REACTANCE EQUIVALENT CIRCUIT • Switches between series (s) and parallel (p) reactance equivalent circuit. 6. TRANSMISSION LINE LOSS • Shows total loss in transmission line from the TX feed point to the ANT feed point. Value can be presented in Watts [W], dBm or dBW units. Screen has no special settings in SCREEN MENU and by default is not shown between SCREENs rotation. Visibility can be turned on in SYSTEM MENU | SCREENS MANAGEMENT | SENSOR x SCREENS ORDER. 24 microHAM © 2015 All rights reserved OSCILLOSCOPE SCREEN Oscilloscope screen is another great feature of the SMΩRF. Serves for waveform inspection, overshoots visualization, lead and tail time measurements etc etc … It mimics standard digital bench oscilloscope but since SMΩRF is an instruments for RF power measurements, it is optimized for this job, and adds some features you will not find on any standard digital oscilloscope. “We have put a lot of attention to the oscilloscope screen because oscilloscope is the most important instrument in any electronic lab. Due to high speed requirements, vertical resolution and limited accuracy, RF measurements on bench oscilloscope is tricky and inaccurate or demands very expensive model. And it is a task where SMΩRF's oscilloscope screen brings several advantages. It has no hardware-defined ranges and uses full dynamic range of the meter. That means it cannot be overloaded and cursors show exact value of amplitude even if they are not visible or hugely offset. Additionally it provides vertical ranges in Watts and dBm, not only in Volts. Both vertical and horizontal axes are fully labeled by actual value, not by common value/div style for faster readout. You won't need to count divisions and multiply by current range, you will immediately see where you are. We hope you will find it useful and enjoy it.” 3 5 4 6 2 1 7 CONTROLS: 1. MODE Sets oscilloscope operating mode: • ROLL – Rolling mode In Rolling mode screen scrolls from the right to left while new data appears on the right side. Speed of scrolling depends on horizontal timebase (3). Changing horizontal or vertical scale restarts scrolling. Scrolling waveform can be stopped anytime by moving MODE selection to the next right STOP position. Please note, in Rolling mode trigger has no sense and its adjustment is not available. • AUTO – Automatic Acquisition mode Similar to AUTO trigger setting on common oscilloscopes. Screen in the AUTO mode is overwritten every time input signal causes a trigger condition. If there is no trigger, after a short period the screen starts to be refreshed continuously. The consequence is, that if the signal disappears, even if there was a trigger previously, the display is cleared after a short period. It is a general oscilloscope screen most suitable for periodic signals. • NORM – Normal Acquisition mode NORM mode is in behavior very similar to the AUTO mode, difference is that when signal disappears, waveform stays on display until new signal, matching the trigger condition arrives. • SNGL – Single Shot Acquisition mode Single shot mode is true memory mode. It captures waveform of the input signal immediately when it passes the trigger condition. Acquisition than automatically stops and waveform stays on display for further analysis. To restart capturing, move the knob from the STOP icon to the right. Icon will show SNGL until after new waveform is captured again. 25 microHAM © 2015 All rights reserved 2. TRIGGER Sets trigger level. While trigger level is adjusted, its position is indicated by vertical line on the scope screen and numerical value is shown at Δ position in the table located on the right side. Δ sign is temporary changed to T sign. When trigger control is not selected, trigger level is still indicated by small T sign on inner left side of Y axis. Trigger's horizontal, X axis position is always zero (0) but actual zero position on the screen (Horizontal Time Offset) can be adjusted by the horizontal control. Additional trigger settings are available in the SCREEN MENU (polarity, source). 3. HORIZONTAL Sets scope time base, horizontal (X axis) scale and offset. Turning knob changes Horizontal Time Offset, moves the zero time position (trigger) across the screen. Maximal left position is set by range and sampling memory, maximal right position is the right end of screen. When knob is pushed and turned, it changes Horizontal Time Scale. Horizontal scale units are shown in next field and are set automatically according to actual range. Contrary to regular oscilloscopes, SMΩRF provides labeled scale division. 4. VERTICAL Sets scope vertical (Y axis) scale and offset. Turning knob changes Vertical Amplitude Offset. When knob is pushed and turned, it changes Vertical Amplitude Scale. Again, scale is fully labeled. Units of Y vertical scale can be changed in next right field. Volts [V] are referenced to the characteristic impedance, and Watts [W] or decibels [dBm] are related to the Forward power at the TX feed point. 5. CURSORS MODE SMΩRF provides two cursors (CURSOR 1 and CURSOR 2) for measurements on captured waveform. They can work in two modes: Tracking and Free mode. In Tacking mode indicated by CT icon, Y position of the cursor is stuck to the waveform while X position can be adjusted. In Free mode indicated by CF icon, both X and Y positions of the cursor can be adjusted. On screen, cursors are indicated by a small square labeled 1 or 2. 6. CURSORS Cursors can be controlled by placing selection to cursor 1 or 2 field. Their position in amplitude and time is numerically presented in table on the right side of display. Bottom line of the table with Δ sign shows difference between CURSOR 1 and CURSOR 2 for both amplitude and time. Cursors have slightly different control according to their mode. In Tracking mode turning the knob on selected cursor changes its horizontal time position. When pushed and turned, the other cursor changes its time position. It simplifies manipulation with both cursors. In Free mode both cursors must be controlled separately. Turning the knob on selected cursor changes its horizontal time position, when pushed and turned it changes its vertical position. 7. TONE TONE field is a shortcut to built-in Tone Generator START/STOP function. When icon is lit, Tone Generator generates defined output. Its output is defined in MAIN MENU | TONE GENERATOR and settings are unique for the Oscilloscope screen because Tone Generator is a part of SCREEN settings. Just repeating what has already been said :-) Oscilloscope screen has two special SCREEN MENU items. 1. ACQUISITION TYPE defines how sampled signal is shown on display when more than one sample per display point is available (depends on the time base). • MAXIMUM Uses peak value from samples captured for one display point. This choice should be used when you want to capture short pulses or you do not want to miss a peak in lower horizontal ranges. 26 microHAM © 2015 All rights reserved • • AVERAGE Uses averaged value from samples captured for one display point. This choice should be used when smoothness of provided waveform is more important than peaks. MIN-MAX It is a special acquisition type providing two waveforms on display. Lower is related to minimal value of the measured signal, higher to peak value of measured signal. This choice is useful to visualize noise or hum on measured signal. Oscilloscope uses peak samples from A/D convertor incoming at fixed rate of 125 thousands samples per second. For easier to use decade ranges, low ranges or advanced acquisitions, scope uses real time decimation and interpolation operations. Therefore minimal and maximal horizontal (timebase) ranges are the same for all acquisition types. 2. TRIGGER EDGE defines triggering condition. • • • • FWD RISING, rising edge of the Forward power FWD FALLING, falling edge of the Forward power IN RISING, logical rising edge (PTT activated) of the PTT IN input IN FALLING, logical falling edge (PTT deactivated) of the PTT IN input Both IN rising and falling edges includes 0.5ms software debouncing as IN input is usually driven by mechanical contact. Processing latency adds additional 0.2ms. 27 microHAM © 2015 All rights reserved SPECTRUM SCREEN Spectrum screen is similar screen to the Oscilloscope screen but visualizes data in the frequency domain instead of oscilloscope's time domain. It uses SMΩRF's peak detector data and with help of Digital Signal Processing (DSP) translates them into frequency domain using Fast Fourier Transformation (FFT). 3 CONTROLS: 2 1 4 1. FREQUENCY Sets frequency (X axis) scale and offset. 5 Turning knob changes Horizontal Scale, maximal and minimal frequency. Horizontal scale is in Hertz [Hz]. There are three linear horizontal scales and three logarithmic horizontal scales available. There is no equivalent of “horizontal offset” setting. 2. AMPLITUDE Sets amplitude (Y axis) scale and offset. Turning knob changed Amplitude Offset. When pushed and turned, it changes Vertical Amplitude Scale. Scale is labeled in decibel [dB] units. 3. CURSORS MODE Same as in Oscilloscope screen, SMΩRF provides two cursors (CURSOR 1 and CURSOR 2) for measurements on computed spectrum image. They work in two modes: Tracking and Free mode. In Tracking mode, indicated by CT icon, Y position of the cursor is stuck to the waveform while X position can be adjusted. In Free mode, indicated by CF icon, both X and Y positions of the cursor can be adjusted. On screen,cursors are indicated by small square labeled 1 or 2. 4. CURSORS Cursors can be controlled by placing selection to cursor 1 or 2 field. Their position in amplitude and frequency is numerically presented in in table on the right side of display. Bottom line of the table with Δ sign shows difference between CURSOR 1 and CURSOR 2 for both amplitude and frequency. Cursors have slightly different control according to their mode. In Tracking mode turning the knob on selected cursor changes its horizontal frequency position. When pushed and turned, the other cursor changes its frequency position. It simplifies manipulation with both cursors. In Free mode both cursors must be controlled separately. Turning the knob on selected cursor changes its horizontal position, when pushed and turned it changes its vertical position. 5. TONE TONE field is shortcut to built-in tone generator START/STOP function. When icon is lit, tone generator generates defined output. Its output is defined in MAIN MENU | TONE GENERATOR and settings are unique for the Spectrum screen. Spectrum screen has a special SCREEN MENU item - DISPLAY TYPE which defines how peak hold values are represented on display. Peak value is kept individually for each frequency considering time of its appearance. • • LINE selection draws peak value as line AREA selection draws peak value as faded area Please note, SPECTRUM screen uses RF envelope data obtained from the peak detector (similar to diode detection). Therefore do not expect to see the spectrum image of SSB signals as you know them from your digital modes program, SDR or panadapter. Phase information of the peak detected SSB signal is lost and cannot be accurately reconstructed for unknown modulation signal. However, it still shows proper spectrum image of AM signals, as well as occupied bandwidth in CW mode. 28 microHAM © 2015 All rights reserved intentionally left blank 29 microHAM © 2015 All rights reserved AUTO MODE AUTO mode is a special operating mode of the SMΩRF which can be applied for any single sensor screen. In AUTO mode, meter makes automatic sensor focus to the first sensor from which detects power. Unfocused sensor is ignored and alarms for this sensor are not generated. When power samples from the focused sensor disappear, meter restarts automatic sensing and switches focus again to the first sensor from which detects power. AUTO mode is activated by short push of SENSOR 1 and SENSOR 2 buttons together and is indicated by flashing SENSOR 1 or SENSOR 2 according to last sensor focus. AUTO mode is canceled by pushing either SENSOR1 or SENSOR 2 button. AUTO mode is useful for multiband HF+VHF/UHF transceivers where meter automatically switches between sensors according to operating band (HF vs VHF or UHF) or for SO2R contesting setups where only one transceiver transmits at a time. AUTO mode is not available in SINGLE RADIO/SINGLE SENSOR and SINGLE RADIO/SENSORS IN SERIES METER MODES. 8 - DUAL SENSORS SCREEN TEMPLATES In following chapters we describe dual sensor SCREEN templates, their purpose of use, settings and all available functions. DUAL mode is activated by longer push and hold of SENSOR 1 and SENSOR 2 buttons together and is indicated by both SENSOR 1 and SENSOR 2 indicators lit. DUAL mode is canceled by pushing either SENSOR1 or SENSOR 2 button. Please note, while single sensor screens can appear in any METER MODE, DUAL sensor screens are available only in two METER MODES and are further filtered by particular meter mode selection (SYSTEM MENU | METER MODE): • • SINGLE RADIO, SENSORS IN SERIES TWO INDEPENDENT RADIOS AND SENSORS 30 microHAM © 2015 All rights reserved 2TX SCREEN 2TX screen is a DUAL sensor screen, providing simultaneous measurements for both sensor. This screen is available in TWO INDEPENDENT RADIOS AND SENSORS meter mode, and is suitable for setups with two radios when it is normal that both radios transmit at the same time and it is necessary to monitor power of both radios simultaneously. 1 2 3 2TX screen provides three (3) user configurable measurements. Each measurement is related to the one of two feed points (TX or ANT), and setting applies to both sensors. Available measurements: 1. FORWARD POWER • • • • FWDTX-REF Peak envelope forward power minus reflected power (delivered power) at the TX feed point. FWDANT-REF Peak envelope forward power minus reflected power (delivered power) at the ANT feed point. FWDTX Forward power at the TX feed point. FWDANT Forward power at the ANT feed point. 2. REFLECTED POWER • • REFTX Reflected power at the TX (Sensor) feed point. REFANT Reflected power at the ANT (Antenna) feed point. 3. REFLECTION • • • • SWRTX Standing Wave Ratio at the TX (Sensor) feed point. SWRANT Standing Wave Ratio at the ANT (Antenna) feed point. RLTX Return Loss [dB] at the TX (Sensor) feed point. RLANT Return Loss [dB] at the ANT (Antenna) feed point. 2TX screen has a special SCREEN MENU item – LED BARS, determining which sensor data are used for the bar graphs. Selected sensor is indicated by highlighted bar graph icon on the display. 31 microHAM © 2015 All rights reserved PA SCREEN PA screen is a DUAL sensor screen providing “phase locked”, simultaneous measurements for both sensors operating at the same frequency. This screen is available in SINGLE RADIO, SENSORS IN SERIES meter mode. PA screen is primarily designed to monitor input and output of the Power Amplifier, providing power reading and reflection measurements on both input and output of the amplifier as well as its gain. However, this screen is not limited to Power Amplifiers, it can be used for any two port RF box, and be valuable for checking phasing boxes, power splitters or combiners providing amplitude and phase unbalance measurement. 1 2 1 2 PA screen provides four (4) user configurable measurements. Each measurement is related to the one of two feed points (TX or ANT) individually for each sensor. In addition to configurable reflections reading, absolute value of impedance measurement |Z| is provided. In the rectangle box, Gain and Phase between Sensor 2 and Sensor 1 respectively are shown. Available measurements: 1. FORWARD POWER • • • • FWDTX-REF Peak envelope forward power minus reflected power (delivered power) at the TX feed point. FWDANT-REF Peak envelope forward power minus reflected power (delivered power) at the ANT feed point. FWDTX Forward power at the TX (Sensor) feed point. FWDANT Forward power at the ANT (Antenna) feed point. 2. REFLECTION • • • • • • REFTX Reflected power at the TX (Sensor) feed point. REFANT Reflected power at the ANT (Antenna) feed point. SWRTX Standing Wave Ratio at the TX (Sensor) feed point. SWRANT Standing Wave Ratio at the ANT (Antenna) feed point. RLTX Return Loss [dB] at the TX (Sensor) feed point. RLANT Return Loss [dB] at the ANT (Antenna) feed point. Same as the 2TX screen, also PA screen has a special SCREEN MENU item – LED BARS, determining which sensor data will be used for bar graphs. Selected sensor is indicated by highlighted bar graph icon on display. Important note for phase measurement between two sensors. It is absolutely necessary to have all sensor cables exactly same in type and length. 32 microHAM © 2015 All rights reserved intentionally left blank 33 microHAM © 2015 All rights reserved 4IN SCREEN 4IN is a very special screen designed to use SMΩRF as a four channel level/phase meter without any sensors. This screen is available only in special, 4 DIRECT INPUTS meter mode. 2 1 3 The 4IN screen is a big help for low level measurements. Accurate measurements of amplitude and phase on four inputs simultaneously is unique feature of the SMΩRF you can find only on 4 channel oscilloscopes which are still not as sensitive and accurate as SMΩRF is, not even the very expensive models. Thanks to this mode you can measure amplitude and phase distribution of your RF boxes as 4SQ units, stacks, vertical arrays, splitters, combiners, check antenna stacks or receiving arrays for phasing error or even pass band characteristic of the filters, preselector or low noise pre-amplifier. There is a lot of applications, just always keep in mind: Keep input level below +23dBm on meter's IN RF ports. CONTROLS: 1. BAR GRAPHS RANGE Sets top limit of bar graphs from -30dBm up to +20dBm. 2. INPUT LEVEL UNITS Sets input level units to decibels [dBm] or current amplitude ratio [A/A]. 3. REFERENCE INPUT Sets reference input for current amplitude ratio and phase reading. Screen shows power and phase of the signals directly applied to the SMΩRF's RF IN ports, bypassing external sensors. Amplitudes are shown at four (4) simultaneously updated horizontal bar graphs, as well as their numerical values in dBm right next to the bar graphs. Bar graphs have linear 50dB range, maximal value can be set manually from -30dBm up to +20dBm in decade increments without any impact to numerical values. Measured amplitudes have no low limit, everything is shown from the noise floor up to the +23dBm, however, values below -60dBm are not calibrated. Input level readout can be switched from dBm to the current amplitude ratio A/A, referenced to one of the inputs. Reference input then displays 1.00, other inputs show amplitude ratio to the reference input. Phases are shown as vertical bar graphs as well as their numerical values in degrees left to the bar graphs. Phases display is always referenced to one of the inputs and has logical meaning only if frequency of all input signals is the same. Please note, phase cannot be measured between IN1/IN3 or IN2/IN4 alone. It is important to realize that calibration correction factors are applied to input pairs IN1/IN2 and IN3/IN4 separately, and that the SMΩRF needs to know this frequency to show accurate value of input amplitudes. SMΩRF measures frequency on inputs IN1 and IN3 only, therefore it is important to make sure that the frequency is locked (F icon on status bar is on). Frequency counter locks at level of about -35dBm and higher, and remains valid even if later signal level decreases. Frequency lock updates whenever signal level is above the lock threshold (F icon lights up). 34 microHAM © 2015 All rights reserved Bottom line: If you are going to measure just one signal, use IN1 or IN3 input on the SMΩRF. If measured level is below the frequency lock level (-35dBm), rise amplitude first until it locks. If you are going to measure two signals of the same frequency, use IN1/IN2 or IN3/IN4 input pairs. If measured level is below the frequency lock level, rise amplitude of the signal going to IN1 or IN3 input first, until it locks. For a phase reference you can set any one of used input. If you are going to measure two signals of different frequency, use only IN1/IN3 inputs. If measured level is below the frequency lock level, rise amplitude of each signal separately until it locks. Phase measurement is principally not possible (different frequencies). If you are going to measure three or four signals of the same frequency, you can use any inputs. If measured level is below the frequency lock level, rise amplitude of the signal going to IN1 and IN3 inputs first until they lock. For a phase reference you can set any input. 4IN screen has a special SCREEN MENU item – 50WPM synchronization detection. When this function is enabled, SMΩRF tries to find a string of 50WPM dots in the input signal. It is useful for low level measurement on antennas to recognize keyed signal from the noise or unwanted signals coming to the input. When such signal is detected, the Syn icon on the display is lit. 35 microHAM © 2015 All rights reserved 9 - MAIN MENU As was already mentioned, SMΩRF has extensive, yet still easy to understand MENU system to get access to various settings and parameters. MENU system has a tree structure always starting from the root MAIN MENU, having separate branches for global settings - SYSTEM MENU, sensor related settings - SENSOR 1, 2 MENU, alarms settings for each sensor - ALARM 1, 2 MENU and four (4) MENU items for each SCREEN: TOP LED BAR, BOTTOM LED BAR, SCREEN MENU and TONE GENERATOR. To enter MENU system, push and hold MENU button [11] for one second to get into the root - MAIN MENU tree. MENU system has auto-exit, it means that to exit MENU you have to pass through any branch of the MENU tree until MENU disappears, by brief pushes of the MENU button. Even thought MENU always starts at root MAIN MENU screen, last path through the menu branches is remembered, by simple pushing MENU button you get where you was last time. This is remembered even if you turn the SMΩRF off. TOP LED BAR MENU and BOTTOM LED BAR MENU have already been explained in the BAR GRAPH SETTINGS chapter, as well as TONE GENERATOR and SCREEN MENU in following chapters. As was mentioned several times, these four menus set parameters which belongs to the each screen separately. SENSOR 1/2 and ALARM 1/2 menus are menu items related to the particular sensor and they will be explained later. Now we take a look at system menu. 10 - SYSTEM MENU SYSTEM MENU serves to enter settings and parameters not related to individual screens or sensors but applies to the whole SMΩRF, both SENSORs and all SCREENs. It is divided into several sub-menus. 36 microHAM © 2015 All rights reserved SYSTEM MENU – METER MODE METER MODE is important system setting which defines how SMΩRF has to handle sensors and sets relationship to radios and iLINK bus. Setting correct meter mode is essential for proper SMΩRF functionality, especially if you are using more than one sensor, more than one SMΩRF device and connecting them to iLINK bus. SINGLE RADIO / SINGLE SENSOR mode First (default) meter mode is SINGLE RADIO / SINGLE SENSOR mode. Choose this METER MODE if you are using only one sensor connected to the SMΩRF. Power Amplifier (PA) drawn on screen is optional. Keep following setup instructions: – – Sensor must be connected to SENSOR 1 IN ports, IN1/IN2. If you are connecting two SMΩRF boxes to iLINK bus of MK2R+, it is necessary to set radio assignment, it defines which SMΩRF belongs to the RADIO 1 and which belongs to the RADIO 2. 1 2 1. METER MODE Sets meter mode of the SMΩRF. 2. RADIO ID ASSIGNMENT Sets radio assignment for iLINK bus. Available choices are RADIO 1 (ID=1) and RADIO 2 (ID=2). Controls apply to all meter modes. SINGLE RADIO / INDEPENDENT SENSORS mode Choose this METER MODE if you are using two sensors and both sensors are connected to the different RF ports of the same transceiver. Typical application is a HF + VHF/UHF transceiver. Both Power Amplifiers (PA1/PA2) drawn on the screen are optional. Keep following instructions: – – – Sensor 1 must be connected to SENSOR 1 IN ports, IN1/IN2. Sensor 2 must be connected to SENSOR 2 IN ports, IN3/IN4. If you are connecting two SMΩRF boxes to iLINK bus of MK2R+, it is necessary to set radio assignment, it defines which SMΩRF belongs to the RADIO 1 (ID=1) and which belongs to the RADIO 2 (ID=2). 37 microHAM © 2015 All rights reserved SINGLE RADIO / SENSORS IN SERIES mode This METER MODE has been designed for use with two sensors operating at the same frequency. In this meter mode SMΩRF provides unique features, gain (or attenuation) and phase shift measurements between sensors. Typical RF setup is when sensors are connected in series, measuring parameters of the device inserted in between them (as shown on drawing below, usually Power Amplifier) but sensors not necessary need to be in series, it is important to ensure that they operate at exactly the same frequency. They can be connected to two independent ports of any RF box (stacking/phasing box) providing both, amplitude and phase measurement between sensors. Typical application is advanced measurement on Power Amplifier or other devices under test. Keep following instructions: – – – Sensor 1 must be connected to SENSOR 1 IN ports, IN1/IN2. In series setup, this sensor should be placed in front of the tested device, towards signal source (transceiver). Sensor 2 must be connected to SENSOR 2 IN ports, IN3/IN4. In series setup, this sensor should be placed after the tested device, towards load or antenna. If you are connecting two SMΩRF boxes to iLINK bus of MK2R+, it is necessary to set radio assignment, it defines which SMΩRF belongs to RADIO 1 (ID=1) and which belongs to RADIO 2 (ID=2). TWO INDEPENDENT RADIOS AND SENSORS mode This METER MODE has been designed to use SMΩRF with two transceivers, each using its own sensor. Typical application is to use with two independent transceivers in general, but this meter mode is especially useful for SO2R setups with single SMΩRF meter. In this case Sensor 1 is fixed to Radio 1 and Sensor 2 is fixed to Radio 2. Both Power Amplifiers (PA1/PA2) drawn on the screen are optional. Keep following instructions: – – Sensor 1 must be to SENSOR 1 IN IN1/IN2 and belongs Sensor 2 must be to SENSOR 2 IN IN3/IN4 and belongs connected ports, to Radio connected ports, to Radio DIRECT INPUTS / NO SENSORS This METER MODE is very special and makes SMΩRF a four (4) channel level/phase meter without use of any external sensor. In this mode only the 4IN available, and there are no settings. There are no and ALARM settings as well graphs, scale and range which are intentionally screen is other SENSOR as bar indicators turned off. 38 microHAM © 2015 All rights reserved SYSTEM MENU – MISCELLANEOUS SETTINGS In this menu it is possible to check the version of the firmware, serial numbers of internal boards and set various global and user interface settings. Settings are applied to both SENSORs and all SCREENs. 1. FIRMWARE VERSION Shows version of the firmware. 2. SERIAL NR MAIN Shows serial number of the Main Board. 3. SERIAL NR RF Shows serial number of the RF Board. 4. CALIBRATION Shows date of the SMΩRF calibration. 5. BUTTONS BEEP 6. 7. 8. 9. 10. 11. 12. 13. 14. 15. 16. 17. Sets level of audible feedback to button presses. 0% disables button's sound. UNITS Sets units provided by SMΩRF for temperature and length. It can be set to METRIC or IMPERIAL system. SERIAL PORT Sets RS232 Serial Port speed. Range 1200 - 115200Bd. HELP LANGUAGE Sets language of built-in HELP system. STARTUP SPLASH Sets how long startup screen will be held on the display. STRICT METER MODE Limits METER MODE. When set to NO, SCREENs, AUTO mode and DUAL mode are not limited to METER MODE. NO is not recommended setting, however, if you have two sensors and often changing RF setup due to various experiments, it doesn't force you to change METER MODE on every sensor's change. SCREEN NAME Sets how long the SCREEN name will be shown on display when SCREEN is changed. BAR RANGE STATUS Sets how long the BAR GRAPH range notification will be shown on display when RANGE is changed. BAR RANGE MEMORY Sets if current BAR GRAPH range is remembered for each SCREEN. YES settings makes BAR GRAPH ranges independent for each SCREEN. NO uses current BAR GRAPH range on all SCREENs of the sensor. BARS DOWNRANGING When bar graphs are in AUTO mode, sets timeout for switching to more sensitive ranges. TUNE SENSITIVITY Sets sensitivity to the carrier stability (variation in amplitude) for automatic jump to the TUNE screen. Larger the number, more stable carrier is required. TUNE TRIG TIME Sets how long the stable carrier (stability requirement is defined in the TUNE SENSITIVITY) must last to accept carrier as a command for automatic jump to the TUNE screen. TUNE HOLDOFF Sets how long the TUNE screen will be held on the display when tuning carrier signal disappears. After timeout screen returns to the original screen from where it jumped to the TUNE screen. 39 microHAM © 2015 All rights reserved SYSTEM MENU – BRIGHTNESS SETTINGS Sets the brightness of the display and LED BAR GRAPHs to a fixed level or to automatic control according to ambient light. Brightness intensity of the display and LED BAR GRAPHs can be set separately. CONTROLS: 1. LED BAR INTENSITY 2. 3. 4. 5. 6. 7. 8. 9. Defines control type for BAR GRAPHs intensity. AUTO uses user defined MIN/MAX ranges and ambient light level. FIXED uses fixed intensity regardless of the ambient light level. FIXED Sets intensity of the LED BAR GRAPHs. Please note, 0% intentionally does not turn light off but sets them to some minimal usable level. AUTO MIN Sets minimal intensity of the LED BAR GRAPHs. AUTO MAX Sets maximal intensity of the LED BAR GRAPHs. DISPLAY INTENSITY Defines control for the display intensity. AUTO uses user defined MIN/MAX ranges and ambient light level. FIXED uses fixed intensity regardless of the ambient light level. FIXED Sets intensity of the display. Please note, 0% intentionally does not turn display off but sets them to some minimal usable level. AUTO MIN Sets minimal intensity of the display. AUTO MAX Sets maximal intensity of the display. LIGHT SENSOR Shows current ambient light. Value is not editable. 40 microHAM © 2015 All rights reserved SYSTEM MENU – LAN SETTINGS This menu serves for setting of everything related to the LAN connectivity and shows real time status of the network connection. CONTROLS: 1. LAN ENABLED 2. 3. 4. 5. 6. 7. 8. 9. Enables or disables LAN connection. YES enables LAN connectivity. Please note, ANY change of ANY parameter in this menu automatically disables LAN connection and must be manually re-enabled. STATUS Shows status of the current connection. Normally you should see just DISABLED and RUNNING state, but there are more states describing status which may help for network troubleshooting: DISABLED – LAN connection is turned off DOWN – internal PHY is turned off CONNECTING – waiting for cable connection WAIT SWITCH – waiting for response from the LAN switch DHCP SEEK – waiting for response from the DHCP server RUNNING – LAN connection is running DHCP Lets assignment of the connection parameters to the DHCP server of your internet connection, usually your local Router or ISP. MANUAL Allows to set the IP ADDRESS, NET MASK, GATEWAY and DNS ADDRESS manually. When you consequently re-enable LAN, parameters are copied to appropriate positions at DHCP fields. LOCAL NAME Sets name of the SMΩRF for local network. RESET PASSWORD Allows to reset password for HTTP and DATA port. Default access is: login: admin password: admin HTTP PORT Sets HTTP port, default port number is 80. Next to port number, real time status is shown: CLOSED, when there is no connection; SERVING, when browser is connected and user is logged in. HTTP port is protected by password. Please note, if you have changed HTTP port, you have to leave the menu and restart SMΩRF (turn it off and back on). New port address is applied after restart. DATA PORT Sets DATA port, default port number is 1234. This port is used by native Remote Control application. When SMΩRF is under external DATA control, local operation is disabled and “REMOTE” is shown on display. Data port is protected by password. VNC ENABLED Enables or disables internal VNC server. VNC server can be also enabled or disabled through the web interface. 41 microHAM © 2015 All rights reserved 10. VNC PORT Sets VNC port, default port number is 5900. Next to port number, real time status is shown: CLOSED, when there is no connection, IP address of the client when connected. 11. MAC ADDRESS Shows SMΩRF's unique network MAC address, necessary for remote wake-up from Remote Control application. SYSTEM MENU – POWER SAVING This menu allows to set power saving and wake up parameters for OLED display as well as for complete SMΩRF. CONTROLS: 1. SCREEN SAVER 2. 3. 4. 5. Sets time of inactivity in minutes, after which display enters the Screen Saver Mode. SMΩRF exits screen saver automatically when detects power data from the sensor or when any button is pressed. Screen saver can be set to blank screen (best saving) or to two modes displaying “moving” parameters. Parameters can be individually enabled or disabled. Available parameters are: UTC time, DATE, LOCAL TIME and CALLSIGN. Callsign can be edited on screen, by default it is set to “microHAM”. SCREEN MODE Sets mode of the screen saver. 1 – blank screen 2 – slowly moving parameters 3 – flying parameters Selected mode can be checked by navigating focus to TRY icon, turning knob to highlight it and pushing EDIT button. SLEEP Sets time of inactivity in minutes when SMΩRF enters into Sleep Mode. In the sleep mode SMΩRF turns completely off internal RF board and as much as possible internal circuits. From the sleep mode SMΩRF can wake up by pressing any button or knob. Sleep Mode is not entered if there is any active LAN connection ongoing. WAKEUP on LAN When enabled, SMΩRF can wake up from the Sleep Mode by “magic” packet received thru the LAN. WAKEUP on PTT When enabled, SMΩRF can wake up from the Sleep Mode by sensing activity on PTT IN port. 42 microHAM © 2015 All rights reserved SYSTEM MENU – AUX PORT intentionally left blank 43 microHAM © 2015 All rights reserved SYSTEM MENU – TIME/DATE SMΩRF has built-in Real Time Clock (RTC) to allow to mark backups with date signature as well as to provide UTC and local time/date for screen saver. Special feature is that RTC can be synchronized by internet clock reference and keep time in the SMΩRF updated and very accurate. This menu allows to set time and date, its format as well as synchronization parameters. CONTROLS: 1. UTC Sets UTC time. 2. WEB SYNCHRO 3. 4. 5. 6. 7. 8. 9. Enables synchronization of the internal RTC with internet clock reference. Next is shown real time status of the synchronization. When WEB synchronization is enabled, time is updated once an hour. Normally you should see just DOWN and SYNC state, but there are more states describing current status which may help for troubleshooting: DOWN – synchronization is turned off, or there is no internet connectivity. WAIT RESPONSE – RTC is waiting for response from the NTP server. This happens when the NTP server is busy or not responding. WAIT FOR DNS – RTC is waiting for response from the DNS server. This happens when the DNS server cannot translate NTP server's name to the IP address, usually by misstyped NTP server name. RETRY – RTC tries to reconnect to the NTP server. SYNC – synchronized, next to the status is shown time/date of the last synchronization. NTP SERVER Sets address of the time server, default is “pool.ntp.org” TIME FORMAT Sets time format to 12 or 24 hours. LOCAL TIME Set local time shift to the UTC time. Next to the shift, local time is shown in format according to settings. DAYLIGHT Enables/disables daylight saving shift for the local time. DATE Sets DATE. Next to it, local date is shown in format according to settings. DATE FORMAT Allows to set DATE format to DD-MM-YYYY or MM-DD-YYYY format. BATTERY Shows status of internal battery used for RTC powering. Battery should last for many years and is replaceable (CR2032) when needed (when drops below 2.75V). 44 microHAM © 2015 All rights reserved SYSTEM MENU – BACKUP/RESTORE Backup/Restore menu serves for backups management. SMΩRF provides three (3) separate slots where you can backup your settings. All three backup slots can be restored from the computer or exported to the computer or as single file through the web interface. These data and the file calls “SMΩRF Config”. Almost all settings of the SMΩRF can be backup-ed, including SCREEN layouts and menu settings, however there is one item which is not stored to backups, and it is the password. For security reasons, password is excluded from backups because when backups are exported to the computer, file is not encrypted and would be readable. Password can be reset in the SMΩRF menu (LAN SETTINGS) if you forget it and than changed through the web interface. Another item, which is stored to backups but internally handled separately are sensors data. Sensor's data has its own management. SMΩRF has separate memory for 16 different sensors. It means that when you attach new sensor to the SMΩRF, SMΩRF copies sensor's system and calibration data to its own memory to speed up following power ups, when only presence of the sensor is detected. When you attach 17 th sensor to the SMΩRF (probably will never happen but if), oldest sensor's data in the SMΩRF memory are replaced by the newest sensor's data. These sensor's data are exported to the computer together with content of all three backup slots. When you restore config data from the computer back to the SMΩRF, SMΩRF updates also sensor's data. 2 1 3 As was described, SMΩRF has allocated memory for three backup slots. Each slot is independent, can have its own name which is editable in the NAME field [1], and automatically stores date when backup was created (not editable). Using backups, whole SMΩRF behavior can be switched for three different setups or different QTHs, because Antenna's and Sensor's cables specification are included in the backup. What to do with the backup is specified by ACTION field [2] which can be set to BACKUP or RESTORE action. Action is confirmed by the EDIT button. CONTROLS: 1. NAME Sets backup slot name. 2. ACTION Specifies backup action BACKUP – stores all current SMΩRF's settings to the backup slot. Previous content of the backup slot is overwritten. RESTORE – restores settings stored in the backup slot and overwrites all current settings. 3. RESET to FACTORY DEFAULTS Resets all settings to the default, factory state. Please note, all your custom settings and entries will be lost and reset to the default. Only content of backup slots and sensor's data copies remain intact. Once you overwrite factory supplied backup slots you cannot get them back. However if you for any reason want to get your SMΩRF back to absolute default, factory state, you can download “factory default SMΩRF Config” from www.microham.com downloads page and restore backup slots from the computer through the web interface. 45 microHAM © 2015 All rights reserved SYSTEM MENU – SCREENS MANAGEMENT SCREENS MANAGEMENT menu allows to set appearance of the each screen in the screens sequence and copy screen's data which forms the screen (TOP/BOTTOM LED BAR, TONE GENERATOR, ALARM's table of the SCREEN SETTINGS) from one screen to another, between sensors, copy some screen in place of another or create a new screen from scratch based on built in template. Menu has several sub menus to simplify data management and user interface. SYSTEM MENU – SCREENS MANAGEMENT - SENSOR 1 SCREENS ORDER This menu allows to set if particular screen will be shown in sequence of screens for the selected sensor and allows to customize the NAME of the screen. Menu provides table, each row is assigned to one screen. Screen has own editable NAME, screen template TYPE upon which is screen built, and ENABLE attribute which can be set to YES or NO. When attribute is set to YES, screen is included in screens sequence accessed by SCREEN ← and → buttons. SENSOR 2 SCREENS ORDER menu does the same as SENSOR 1 SCREEN ORDER but for the SENSOR 2 instead of SENSOR 1. TWO SENSORS SCREENS ORDER menu does again the same but for two sensors screens, when the SMΩRF is switched to the DUAL mode, therefore these menu items will not be described separately. 46 microHAM © 2015 All rights reserved SYSTEM MENU – SCREENS MANAGEMENT – COPY SCREENS SETTINGS This menu allows to copy screen's data, (TOP/BOTTOM LED BAR, TONE GENERATOR, ALARM's table of the SCREEN SETTINGS) from the current screen to the another screen of the same or the other sensor. Screen template specific data (in SCREEN SETTINGS menu) are not copied if destination screen template type is different to current copy source. Rest is copied. 2 1 3 4 CONTROLS: 1. DATA Sets data going to be copied. ALL – copies TOP LED BAR settings, BOTTOM LED BAR settings, TONE GENERATOR settings, and ALARM table at once. TOP LED BAR – copies TOP LED BAR settings. BOTTOM LED BAR – copies BOTTOM LED BAR settings. TONE GENERATOR – copies TONE GENERATOR settings. ALARMS – copies ALARM table. 2. DESTINATION Sets destination screen where selected data will be copied. If ALL is selected, data will be copied to all screens of selected sensor EXCEPT disabled screens (NO in SENSOR x SCREENS ORDER menu). 3. SENSOR Sets destination sensor where selected data will be copied. 4. COPY Select and push EDIT button to confirm copy. SYSTEM MENU – SCREENS MANAGEMENT – COPY COMPLETE SCREEN This menu is similar to the previous menu but allows to copy screens at a higher level. Again it allows to select data (CURRENT SCREEN), destination and sensor for copying but logically serves to copy complete screen including customized screen layout (selected units, point of measurement, power and impedance types) in place of another screen for the same or different sensor. At the same time, this menu can be used to create a new screen from scratch by selecting one of the default template type to replace another screen. Essential feature if you inadvertently overwrite some screen and you haven't any other template of the same type available. 47 microHAM © 2015 All rights reserved 11 – SENSOR 1 MENU SENSOR 1 MENU is a sub menu of the MAIN MENU and serves for all sensor related settings. Actually there are two sub menus, SENSOR 1 MENU and SENSOR 2 MENU but since both have same sub-menus and settings, and only difference is that SENSOR 1 menu is associated to the SENSOR 1 and SENSOR 2 MENU is associated to the SENSOR 2, further description of the SENSOR 1 MENU can be directly applied to the SENSOR 2 MENU and it won't be described separately. SENSOR MENU has several sub menus which logically divides sensor settings into several groups. SENSOR 1 MENU – SENSOR DETAILS SENSOR DETAILS menu item is informative only. Provides these information: MODEL: SN: CALIBRATION DATE: CURRENT TEMPERATURE: Sensor model Serial Number of the Sensor Date of the Sensor calibration Internal Temperature of the Sensor SENSOR 1 MENU – SENSOR CABLES TABLE SENSOR CABLES menu provides a table where attenuation and phase difference of the cables connecting the Sensor to the SMΩRF is defined. To understand why this table is important to overall accuracy of the system, it is necessary to explain how the calibration is made. The SMΩRF and the Sensor are two separate devices, each is individually calibrated for the amplitude and phase. SMΩRF is calibrated to the plane of its IN connectors. Sensor is also individually calibrated to the plane of its SMA connectors and to the plane of the LOAD connector. If it would be possible to connect Sensor's connectors directly to the SMΩRF's connectors, table wouldn't be necessary, because only mismatch should be in connectors, and it is negligible at frequencies below 500MHz (<0.01dB/0.025°) when properly tightened. However, the point of remote sensor is to avoid routing bulky antenna cable to operating desk, therefore the Sensor and the SMΩRF needs to be connected together by coaxial cables as sensor provides samples of transmitting signal at its operating frequency. Such cables are far from ideal, lossless connection, and SMΩRF needs to know how much. 48 microHAM © 2015 All rights reserved Nature of the coaxial cables is that they have monotone (but not linear) attenuation characteristic, with rising frequency attenuation rises. If cables connecting the SMΩRF are not absolutely same in the electrical length, also some phase shift is introduced. Both this parameters have huge impact to accuracy and need to be eliminated. SMΩRF can easily null these adverse effects, but needs to know the attenuation and the phase shift of cables connecting sensor to meter, and in order to be accurate, for each frequency separately. For this reason each sensor cable is supplied with its own calibration certificate, table of the attenuation and relative phase shift for each band. Attenuation is exact value of the cable attenuation to plane of its connectors at a given frequency. Relative phase shift says nothing alone, but when subtracted from the relative phase shift of the second cable, result is absolute phase shift between these cables. These parameters need to be entered to the table from the calibration certificate. SMΩRF then interpolates between these points to get exact value of the attenuation and the phase for current operating frequency in real time. By default, the Sensor Cables Table is pre-set using typical values of the attenuations of provided cables, and zero phase shift, so results obtained from an out-of-the-box meter are not way off. Anyway, to get best out of the SMΩRF accuracy, you need to edit table using actual values from the certificate. Phase difference is absolute phase shift between cables and must be worked out using relative phase from two certificates. It is the relative phase shift of the cable connecting I or REF port of the sensor MINUS relative phase of cable connecting U or FWD port of the sensor. Formula for entering phase difference is: ΔΦ = Φ(I or REF) – Φ(U or FWD) CONTROLS: 1. FWD/U 2. 3. 4. 5. Attenuation of the cable connecting U or FWD port of the Sensor. REF/I Attenuation of the cable connecting I or REF port of the Sensor. ΔΦ Computed phase difference between both cables (formula above). SAVE Saving entered values. EXIT Exit from this menu. Contrary to most menus in the SMΩRF, this menu can be left only using dedicated EXIT button. It is an intentional change to avoid inadvertent exit from the menu without saving entered values. Still, values must be SAVED separately by SAVE button prior exit, otherwise they will be lost. 49 microHAM © 2015 All rights reserved SENSOR 1 MENU – SENSOR CABLES CALIBRATION When supplied cables are not long enough to connect a sensor to the SMΩRF, and it is necessary to use longer cables, the question is how to obtain new calibration data to the Sensor Cables Table. Solution is in this menu, providing a cables calibration process, which helps you to calibrate new sensor cables yourself by comparing them to known calibrated reference (supplied) cables without any other tool than your transceiver and a dummy load. 1 2 4 3 CONTROLS: 1. CURRENT Sets which cables are used for sampling. REFERENCE sets supplied, factory calibrated cables matching the Sensor Cables calibration table. NEW CABLE sets new, custom sensor cables. 2. FREQ [MHz] Sets calibration frequency in MHz. 3. SAVE Saves newly taken samples and recalculates Sensor Cables Table. 4. EXIT Leaves the menu. Please note, if you leave menu prior saving new values, all taken samples will be lost. CALIBRATION PROCEDURE: 1. Prepare new cables. Cable type is important, use only good quality, 50Ω coaxial cables. For lengths up 2. 3. 4. 5. 6. 7. 8. to 10m (33ft) we recommend to use 5-6mm thick cable, avoid thinner cables. Good quality RG58 is fine. They can be bought from electronics part suppliers (Mouser, Digikey, Farnell) already terminated with SMA male plugs on each end. If you prefer to make them yourself, make sure to cut them for exactly same physical length and solder or crimp connectors precisely. If you need even longer cables, use thick 7-12mm cable, double shielded RG-214 is fine again. As a termination use SMA female connectors and add short (up to 1,5m) RG58 or RG-174 cable jumpers terminated with SMA male connectors to each end. Avoid adapters. Connect sensor to the SMΩRF using supplied, REFERENCE sensor cables. Connect radio to the sensor and terminate sensor with 50Ω dummy load, rated for 50W power. Prepare transceiver frequencies and power. On each band set frequency from the Sensor Cables Table, switch mode to CW and set power to 50W. If you cannot set 50W power, use any lower, maximum available power. Once you set frequencies and power, do not touch frequency and power setting knobs anymore. On screen set CURRENT cables to REFERENCE. [1] On screen set frequency [2] and switch the radio to this band. Verify that the frequency on the screen and the radio match. Key the radio, let output power to stabilize for a second and push the MENU button to take a sample. You should see captured levels in the table, REFERENCE row. Unkey radio and return to the point 5, until after you sampled all bands. Replace reference sensor cables for new cables. Keep reference cables together with matching certificates on a safe place. You will need them whenever you will want to recalibrate or replace your custom cables. 50 microHAM © 2015 All rights reserved 9. On screen set CURRENT cables to NEW CABLE. [1] 10. On screen set frequency [2] again to the first calibration frequency and switch the radio to this band. Verify that the frequency on the screen and the radio match. 11. Key the radio, let output power to stabilize for a second and push the MENU button to take a sample. You should see captured levels in the NEW CABLE row. 12. Unkey the radio and return to the point 10, until after you sampled all bands. 13. SAVE calibration [3]. 14. Leave the menu [4]. Now you have calibrated your new cables without loosing any single bit of accuracy. Newly calibrated values have been automatically copied to the Sensor Cables Table and you can review them by entering that menu. Maybe you could write them down and create your custom calibration certificate in case you will want to use new cables with another SMΩRF without recalibration or data transfer. In some situations you don't need to calibrate new sensor cables for all frequencies, especially if sensor is located behind some single band power amplifier or radio (common situation on VHF or UHF bands). In this case, whenever it is possible calibrate cables also on adjacent bands. As was mentioned, SMΩRF calculates attenuation for other than calibration frequency by interpolating with values for adjacent calibration frequency. If adjacent calibration points don't exist, SMΩRF will use the same values for all frequencies within a band. If calibration on adjacent bands is for whatever reason not possible it is very important to use very exactly cut, as thick as possible cables, having as short as possible jumpers to avoid variation in attenuation and phase from start to the end of the band. SENSOR 1 MENU – POWER LEVELS 100% 100% POWER LEVELS is another unique feature of the SMΩRF. As was mentioned in the BAR GRAPHS SCALES and RANGES chapter, when TOP LED BAR is set to display power, range has one special position 100%. It is useful feature for a quick check if the output power is at desired level because 100% power level is always full deflection of the TOP LED BAR GRAPH. Another use of 100% power level values is the TUNE SCREEN, where you get visual and audio check when 100% power is reached during tuning procedure. In this menu 100% power levels can be precisely set for each band separately according to your requirements. 51 microHAM © 2015 All rights reserved SENSOR 1 MENU – ANTENNA CABLES In previous chapters we have several times used and described term “two point measurements”, so you should be already familiar what does mean ANT feed point. To calculate power at the ANT feed point, SMΩRF needs to know what kind of cable is used to connect antenna and its physical length. This purpose serves ANTENNA CABLES menu which allows to set cable model connecting particular antenna as well as set its length. Additionally, it allows to set meaningful cable name according to the name of the antenna (every cable ends up at some antenna) and assign antenna to bands where is used. SMΩRF has allocated memory for up to 32 different antenna cables per sensor, each cable is identified by its unique ID number. There are more than thirty (30) built in, precise models of common coaxial cables types to choose from. There is one special cable called Lossless 50Ω, which is used as default. It is a virtual cable which just specifies reference impedance for the ANT feed point calculations and since it has no loss, entered length is irrelevant. Results using this cable will be same as measured values at the TX feed point. Use this cable if your cable is not available or you have no idea what cable or length you are using to avoid reading incorrect and misleading results for the ANT feed point. CONTROLS: 1. ID Selects Antenna Cable identification number. 2. NAME Sets NAME of the Antenna or Antenna Cable. 3. L Sets physical length of the cable in meters or feet. Units are set in SYSTEM MENU | MISCELLANEOUS. 4. CABLE TYPE Defines coaxial cable type. 5. BAND ASSIGNMENT Assigns cable to one or more bands. 52 microHAM © 2015 All rights reserved SENSOR 1 MENU – MISCELLANEOUS MISCELLANEOUS menu allows to set two operating parameters. First is an ability to suppress ALC overshoots. Virtually every transceiver generates overshoots at the beginning of transmission until ALC loop stabilizes (hundreds μs up to several ms). Exact time and amplitude of overshoots can be easily Oscilloscope screen showing ALC overshot on initial dot of CW signal (“bump” on leading edge). SMΩRF has very fast measurement and reliably captures every overshoot with multiple samples. Once you are aware that this happens, it can be annoying to see “bumped” peak and peak hold values on regular screens every time ALC loop timeouts and transceiver generates new overshoot. To help with this problem, SMΩRF allows to turn on filter to SUPPRESS OVERSHOOTS. Second parameter helps to deal with false triggering. Those who are operating at multi transmitter sites are probably familiar with effect of “magic SWR needle” on analog power meters. This effect is caused by RF energy coupled from the antenna radiating power to the closely spaced antenna which is at the moment used at another position for receiving. Coupled power is high enough to be detected by sensor and since power is generated from the opposite side of the coupler, it has impact to level of reflected sample. On U/I couplers, where U and I samples are equal in amplitude under matched conditions, it causes false triggering. To avoid this issue in multi TX setups, SMΩRF provides adjustable POWER THRESHOLD, which sets minimal power necessary to initiate measurements. For FWD/REF sensors power coming from opposite direction is easy recognizable (reflected sample is larger than forward) and false triggering is eliminated by software. 1 3 2 CONTROLS: 1. SUPPRESS OVERSHOOT YES enables overshoot suppressing filter. This function is not generally applicable to all screens when enabled. Advanced metering screens like the Oscilloscope or the Spectrum screens intentionally do not suppress overshoots. Also please note, that suppression time larger than 2-3ms will have impact to peak reading amplitude of SSB signals, where peaks of such duration are normal. 2. TIME Sets time used by overshoot suppressing filter. Exact value is specific to every transceiver and can be measured on the Oscilloscope screen. Good value to start with is 2ms. 3. POWER THRESHOLD Sets minimal power to initiate measurements. If you are not operating in multi transmitter environment, it is good to set it for minimal, 10mW level. 53 microHAM © 2015 All rights reserved SENSOR 1 MENU – COPY SETTINGS In situations where both sensors are connected to similar or same setups like SO2R, it is useful to clone customized settings from one sensor to another in order to save a lot of duplicate adjustments. This menu allows to copy selected sensor's data from the SENSOR 1 to the SENSOR 2. If this menu is accessed from the root SENSOR 2 MENU, it will copy SENSOR's 2 data to SENSOR 1. CONTROLS: 1. DATA Sets data going to be copied. HiPWR ALARMS – copies High Power Alarms LoPWR ALARMS – copies Low Power Alarms SWR ALARMS – copies SWR Alarms PSK ALARMS – copies PSK Alarms ARCING ALARMS – copies Arcing Alarms ALARM SETTINGS – copies Alarm Settings ALL ALARMS – copies all Alarms and Alarm Settings 100% LEVELS – copies 100% Power Levels Table MISCELLANEOUS – copies Miscellaneous Settings SENSOR CABLES – copies Sensors Cables Table ANTENNA CABLES – copies Antenna Cables Table and Assignment ALL SETTINGS – copies all above settings at once 2. COPY Select and push the EDIT button to confirm copy. 54 microHAM © 2015 All rights reserved 12 – ALARM 1 MENU ALARM 1 MENU is a sub menu of the MAIN MENU and serves for all settings related to alarms and protection. Actually there are two sub menus, ALARM 1 MENU and ALARM 2 MENU but since both have same sub-menus and settings and only difference is that ALARM 1 menu is associated to the SENSOR 1 and ALARM 2 MENU is associated to the SENSOR 2, further description of ALARM 1 MENU can be directly applied to ALARM 2 MENU and it won't be described separately. ALARM 1 MENU has several sub menus which logically divides alarms into several groups according to TYPE of the alarm and there is a SETTINGS menu for alarm sound settings and hardware IN/OUT configuration. Before we get into individual alarm types, it is necessary to explain how alarms work and how they are handled. ALARMS HANDLING and OPERATION SMΩRF has extremely deep alarms processing and allows to configure alarm conditions and actions for various requirements and situations. SMΩRF provides five (5) different types of alarms simultaneously: SWR Alarm, Low and High Power Alarm, High IMD Alarm for PSK and Arcing (hot switch detection) Alarm. Each alarm type can be globally enabled or disabled. Disabled alarm type is disabled for all screens of the sensor. We get to alarm types later. Each alarm type can trip three different, user adjustable levels of importance. These levels are: WARNING, ALARM and FAULT. WARNING represents the lowest level of importance, ALARM middle and FAULT the highest. Higher level alarm has priority and overrides lower level alarm. When some alarm type is globally enabled, its importance levels can be individually enabled or disabled for each screen separately in SCREEN MENU. This does not apply to PSK and Arcing Alarms, they have just one importance level and cannot be controlled by the SCREEN MENU, only be globally enabled or disabled. Every enabled alarm generates visual feedback on the front panel by ALARM light. This light goes green on first WARNING level, red on ALARM level and flashing red on FAULT level. On some screens, where real estate allows it, there is also alarm icon on the display, showing which type of the alarm got tripped. Each importance level can be set for different action. There are three available actions for each alarm level: DISPLAY, SOUND and TX BREAK. • DISPLAY action enables alarm pop-up window to appear on display. Pop-up window shows alarm type, importance level and real time value which caused the alarm. There are also two icons for clearing tripped alarm: SNOOZE (SNZE) and RESET. • SOUND action, when enabled, generates audible alert for an operator. Sound and volume for all importance levels can be set in the SETTINGS menu. • TX BREAK action breaks power generation by transceiver. 55 microHAM © 2015 All rights reserved Every tripped alarm needs to be RESET. SMΩRF provides three (3) methods how to reset tripped alarm, AUTO, PTT and MANUAL. • AUTO resets alarm automatically when defined AUTO time expires. It doesn't require output power to cease, but if alarm condition is matched when alarm is auto-cleared alarm re-triggers. AUTO reset time can be set to 1 – 99 seconds. This reset is suitable for occasional alarms and low importance WARNING level when there is no risk of damage caused by consecutive, alarm tripping. • PTT resets alarm when PTT is released and RF power disappears. • MANUAL reset requires intentional operator response, alarm must be cleared by buttons on SMΩRF's front panel. ← SCREEN button or knob button snoozes alarm, → SCREEN button resets alarm. Alarm can be reset also remotely from the remote control application running on the computer. It is recommended to use MANUAL reset for FAULT level of alarms which makes you aware of critical situation, especially when combined with TX BREAK action. When MANUAL reset is selected, alarm pop-up window appears even if its appearance is disabled. Special reset choice for tripped alarm is snoozing. Tripped alarm can be SNOOZED for defined period of time in minutes in the SNZE field [3]. If alarm is snoozed and during snooze period the tripping condition is matched, alarm is ignored. This applies only to same alarm type and same importance level as was snoozed. 1 2 3 4 5 CONTROLS: 1. ENABLE Globally enables or disables alarm type for all screens of the sensor. 2. AUTO Sets time in seconds [s] for AUTO reset. 3. SNZE Sets time in minutes [m] for alarm snoozing. 4. ACTION Sets action when alarm is tripped. 5. RESET Sets reset method for tripped alarm. 56 microHAM © 2015 All rights reserved ALARM 1 MENU – ALARM SETTINGS ALARM SETTINGS menu serves for two purposes. First to let choose and adjust sound alerts for all importance levels of alarms, second for definition of IN and OUT port behavior. SMΩRF allows to choose from four (4) types of sound for audible alarm alerts. Each sound can be cycled and adjusted in level. Sounds can be set for each sensor individually. At the SMΩRF's rear panel two pairs of RCA jacks are located. Each pair belongs to its sensor, one jack of the pair is input IN, second is output OUT. Input can be set for one of two functions, PTT or INHIBIT. Output can be also set to PTT or INHIBIT function independently of input setting. For both input and output, active level can be individually set by POLARITY setting. Now it is necessary to explain how to use these inputs and outputs. On some power meters you can find similar RCA jacks with description to connect one to PTT output of the transceiver and second to keying (PTT) input of the power amplifier. Oh, there is nothing worst you can do for your amplifier as well as transceiver. When SWR is higher than normal and power meter trips SWR alarm, radio and amplifier is already delivering power under these critical, dangerous conditions to misbehaving load. Breaking PTT line from the radio to amplifier, while radio is still driving the amplifier causes even worse situation, amplifier is forced to hot switch input and output relay, putting even more stress on tube or final transistors and radio is consequently connected to misbehaving load. If you like your equipment, never do this. Proper sequence when SWR gets high is to force radio to stop generating power as quickly as possible. Only when radio is not generating any power the PTT line to amplifier can be released or safely switched to receiving state. Since SMΩRF supports configurable function for each input and output, there are several usage scenarios according to the radio and amplifier capabilities. Transceivers with inhibit input Best option is to use inhibit output from the SMΩRF provided your transceiver has INHIBIT input. All Yaesu radios as well as Elecraft's K3, K3S and Ten-Tec Orion/II have inhibit input. Driving inhibit input on the radio is only sure way to disable power generated by transceiver, regardless of how radio was switched to transmit. 1. Configure OUT to INHIBIT, POLARITY NORMAL. Normal polarity inhibits power when output is open, what is default, fails safe operation of all above radios. 2. Connect OUT of the SMΩRF to the inhibit input of the transceiver. Further setup depends on other components. • If you are connecting SMΩRF to setup with our Station Master or Station Master DeLuxe, connect its INHIBIT output to IN port of the SMΩRF and configure IN to INHIBIT, POLARITY NORMAL. • If you don't have our SM or SMD but you have amplifier with KEY OUT signal, also connect this keying output to IN port of the SMΩRF and configure IN to INHIBIT, POLARITY NORMAL. If amplifier has reversed keying output (Expert amplifiers), set IN polarity to REVERSE. • If you don't have either of above, connect transceiver's PTT output to IN port of the SMΩRF and configure IN to PTT function, POLARITY NORMAL. 57 microHAM © 2015 All rights reserved Transceivers without inhibit input Unfortunately, not all transceivers have inhibit input, Icom and Kenwood radios generally lack this important feature. While with these radios fool-proof setup cannot be made, there is still some solution, better than do nothing. In this case it is important to avoid non transparent keying (VOX, PTT over CAT, manual use of MOX button) and route all PTT source signals through SMΩRF. Configure IN and OUT ports of SMΩRF for PTT, POLARITY NORMAL. Connect OUT to the transceiver PTT input, and use IN port as only PTT input port. To IN port connect your footswitch or PTT output of your computer interface. If you are using our micro KEYER II or MK2R+, connect iLINK port of the SMΩRF to the iLINK port on the keyer. Even for radios which don't have inhibit, this brings significant advantage, because both MKII and MK2R+ disables all modulation and signal paths (CW, PTT) when they receive protection alert over iLINK. Then only remaining uncontrolled situation is when radio is manually switched to transmit state by MOX button in FSK (RTTY) mode. 1 2 3 4 6 8 5 7 CONTROLS: 1. SOUND Selects sound for audible alarm alert. 2. CYCLE Sets number of sound repetitions. 3. LEVEL 4. 5. 6. 7. 8. Sets volume of the sound. TRY Allows to check the sound. INPUT Sets IN port function. PTT – sets IN port to operate as PTT input. INHIBIT – sets IN port to operate as INHIBIT input. INPUT POLARITY Sets IN port active level. NORMAL – sets IN port active level, active PTT IN = closed to ground, active INHIBIT = open. REVERSE – sets IN port active level, active PTT IN = open, active INHIBIT = closed to ground. OUTPUT Sets OUT port function. PTT – sets OUT port to operate as PTT output. INHIBIT – set OUT port to operate as INHIBIT output. OUTPUT POLARITY Sets OUT port active level. NORMAL – sets OUT port active level, active PTT OUT = closed to ground, active INHIBIT = open. REVERSE – sets OUT port active level, active PTT OUT = open, active INHIBIT = closed to ground. Please note, OUT port is open collector output of the small signal bipolar NPN transistor. OUT port is NOT designed to key inductive loads (relays) or high voltage circuits (>24VDC, >100mA). It is perfectly suitable for all above functions, but keep it in mind if you are going to experiment with your own designs. Damage caused by improper use is not covered by warranty. 58 microHAM © 2015 All rights reserved ALARM 1 MENU – SWR ALARM First type of the alarm is the most common SWR ALARM. But name of the alarm is probably the only thing what SMΩRF has in common with other units. SMΩRF allows to set three different SWR values to trip three importance levels (WARNING, ALARM, FAULT) for each band separately. In addition, SMΩRF provides two power ranges where SWR can be handled separately, it allows to set different SWR tripping values for an amplifier and different for bare transceiver. It is possible to set minimal power level from where SWR value can trip alarm and ignore lower levels. It is also possible to turn some alarm levels off. Lets take 160m band and screen shot as an example. First power range is set to 10W – 180W, second power range for 180W and more. It means if output power will be under 10W, no SWR alarm will be generated. For the first power range the WARNING level is turned off (---). It means that if output power will be in between 10-180W, WARNING level will not be generated, but if SWR will be larger than 2.5 or larger than 3.5, ALARM or FAULT level alarms will trip respectively. For ALARM level, a pop-up window will be shown and audible alert will be played (DISPLAY = YES, SOUND = YES). Alarm will be reset by releasing PTT (RESET = PTT). For FAULT level audible alert won't sound (SOUND = NO) but pop-up window is forced despite being turned off (DISPLAY = NO) because reset is set to MANUAL. In addition, SMΩRF breaks power generated by the radio (TX BREAK = YES). If output power will be higher than 180W, SMΩRF will generate ALARM and FAULT level alarms with the same actions and reset conditions as above, but at different SWR values, ALARM at SWR >2.0 and FAULT at SWR > 3.0. In addition it also generates lowest WARNING level alarm for SWR >1.8. When WARNING is generated, pop-up window will be shown (DISPLAY = YES) without sound or breaking power (SOUND = NO, TX BREAK = NO). Warning will be cleared automatically when SWR drops below 1.8 and after a 1s timeout (AUTO: 1s) without requirement to interrupt power (RESET = AUTO). Of course all SWR, power values, actions and reset conditions are adjustable. Easy to understand example values were chosen to show that settings can fit everything from “I don't care about alarms or one rule for everything above 3.0 is good for me” up to “I need precise adjustments and rules for each band separately.” 1 CONTROLS: 2 1. MINIMAL POWER for 1st POWER RANGE 2. 3. 4. 5. Sets minimal power for the 1st power range from where alarms will be generated for all three importance levels WARNING, ALARM, FAULT. MIN settings sets power to power threshold value. MINIMAL POWER for 2nd POWER RANGE Sets minimal power for second range from where alarms will be generated for all three importance levels WARNING, ALARM, FAULT. W-SWR Sets tripping SWR value for the WARNING level. Alarm level can be disabled when set to ---. A-SWR Sets the SWR value for the ALARM level. Value has to be higher than the value set for the WARNING level. F-SWR Sets the SWR value for the FAULT alarm level. Value has to be higher than the value set for the ALARM level. 59 3 4 5 microHAM © 2015 All rights reserved ALARM 1 MENU – LOW POWER ALARM LOW POWER ALARM is a second common alarm type. Same as SWR alarm, also LOW POWER ALARM has extensive settings, allows to set three different POWER values to trip three alarm levels (WARNING, ALARM, FAULT) for each band separately as well as provides two power ranges where different power levels can trip different alarm levels. With low power alarm it is important to realize “inverse effect” which can be at the beginning bit confusing because as power is decreasing, higher alarm level is tripped. Lets take again 160m example for explanation. You operate barefoot with 100W transceiver, and also use an amplifier which needs to be driven by at least 50W to get 1200W output on 160m. If PA is over driven it starts to generate unwanted IMD products, when it is under driven it generates less power than desired. LOW POWER alarm can take care of under drive. Maximal POWER UP TO value is set to 48W, W-PWR is set to 45W, A-PWR to 40W and F-PWR to 35W. It means if power is above 48W, SMΩRF will not generate any LOW POWER alarm, but if power is lower and is in range from 45-48W, it generates WARNING. In range from 40-45W it generates ALARM and in range 35-40W FAULT. Below 35W it again doesn't generate LOW POWER alarm. This first range is useful for low driving power alert when amplifier is bypassed if you are using only one sensor behind power amplifier. If you are using two sensors, one in front and one behind the amplifier, alarm is active all the time. Second range, maximal POWER UP TO is set to 1150W, W-PWR to 1100W, A-PWR to 900W and F-PWR to 200W. While power will be larger than 1150W, everything will be OK and no LOW POWER alarms will be generated. However, if power drops and be in between 1100-1150W, SMΩRF will generate WARNING indicating slightly mistuned or under driven amplifier. If drops even lower and be in 900-1100W range it will generate ALARM for higher attention (ALARM level is set to generate display alert) and if drops even more and be in range between 200-900W it generates FAULT indicating seriously mistuned amplifier. Since no LOW POWER alarm is explicitly dangerous, TX BREAK is disabled for all levels, but FAULT level reset is set to MANUAL to keep alarm pop-up window on the screen to not miss it. CONTROLS: 1. POWER UP TO 1st RANGE 2. 3. 4. 5. Sets the highest power for the 1st power range down from alarms will be generated. POWER UP TO 2nd RANGE Sets the highest power for the 2nd power range down from alarms will be generated. W-PWR Sets the second margin for the WARNING alarm level. Value has to be lower than the power value in the POWER UP TO cell. A-PWR Sets the second margin for the ALARM level. Value has to be lower than the power value in the WARNING cell. F-PWR Sets the second margin for the FAULT alarm level. Value has to be lower than the power value in the ALARM cell. Hint: If you want to turn some importance levels off, set both margins to the same value. For example, if you don't want to generate alarms for first two importance levels (WARNING, ALARM) in the first power range, set POWER UP TO and W-PWR margin to same value as has A-PWR, i.e. 40W. It will looks like 40/40/40/35W and only FAULT will be generated in range from 35-40W. Or you can set 40/35/35/35W, than only WARNING will be generated in range from 35-40W. 60 microHAM © 2015 All rights reserved ALARM 1 MENU – HIGH POWER ALARM HIGH POWER ALARM is a third common alarm. Same as the LOW POWER ALARM, it allows to set three different POWER values to trip three importance levels (WARNING, ALARM, FAULT) for each band separately as well as provides two power ranges where different power levels can trip different alarm levels. Contrary to the LOW POWER ALARM which trips when power is lower than tripping level, the HIGH POWER ALARM trips when power exceeds tripping level. Lets take our 160m example once again for explanation. You operate barefoot with 100W transceiver, and also use an amplifier which needs to be driven by at least 50W to get 1200W output on 160m. If amplifier is overdriven it starts to generate unwanted IMD products, when it is under driven it generates less power than desired. HIGH POWER alarm can watch to not over drive the amplifier. Minimal POWER FROM value is set to 52W, W-PWR is set to 55W, A-PWR to 60W and F-PWR to 90W. It means, if power is below 52W, SMΩRF will not generate any HIGH POWER alarm, but if power rises and is in range from 52-55W, it generates WARNING. In range from 55-60W it generates ALARM and in range 60-90W FAULT. Above 90W it again doesn't generate HIGH POWER alarm up to 2 nd range POWER FROM value, so operating at 100W level without amplifier will not trip any alarm. This first range is useful for high driving power alert. Second range, minimal POWER FROM is set to 1220W, W-PWR to 1250W, A-PWR to 1300W and F-PWR to 1500W. While power will be lower than 1220W, everything will be OK and no HIGH POWER alarms will be generated. However, if power rises and be in between 1220-1250W, SMΩRF will generate WARNING, indicating that the amplifier is being overdriven. If power rises even higher, and be in 1250-1300W range it will generate ALARM for higher attention (ALARM level is set to generate display alert) and if rises even more and be in range between 1300-1500W, than it generates FAULT, indicating seriously overdriven amplifier generating a lot of IMD products. Since the HIGH POWER alarm trips dangerous situations, TX BREAK is enabled for FAULT levels, and reset is set to MANUAL to keep alarm pop-up window on screen to not miss it. CONTROLS: 1. POWER FROM 1st RANGE 2. 3. 4. 5. Sets the lowest power for the 1st power range up from alarms will be generated. POWER FROM 2nd RANGE Sets the lowest power for the 2nd power range up from alarms will be generated. W-PWR Sets the upper margin for the WARNING alarm level. Value has to be higher than the power value in the POWER FROM cell. A-PWR Sets the upper margin for the ALARM level. Value has to be higher than the power value in the WARNING cell. F-PWR Sets the upper margin for the FAULT alarm level. Value has to be higher than the power value in the ALARM cell. Hint: If you want to turn some importance levels off, set both margins to the same value. For example, if you don't want to generate alarms for first two importance levels (WARNING, ALARM) in the first power range, set POWER FROM and W-PWR margin to same value as has A-PWR, i.e. 60W. It will looks like 60/60/60/90W and only FAULT will be generated in range from 60-90W. Or you can set 60/90/90/90W, than only WARNING will be generated in range from 60-90W. 61 microHAM © 2015 All rights reserved ALARM 1 MENU – PSK IMD ALARM PSK IMD ALARM is special, advanced type of the alarm. SMΩRF makes background DSP analysis on the signal receiving from the sensor all the time, and when finds PSK idle tone pattern in incoming samples, measures its spectral purity. Based on these results can trigger special, PSK IMD ALARM. PSK IMD ALARM has just one, WARNING level, there is no reason to make more levels of importance. There is just one additional settings which allows to set alarm level based on measured PSK IMD levels. 1 CONTROLS: 1. PSK IMD Sets IMD level in dB which causes alarm when exceeds. Range is from -45dB up to -15dB. For those not familiar with IMD figures, lower the IMD number (more negative) means nicer output signal. We recommend to set alarm to -25dB level at least. ALARM 1 MENU – ARCING ALARM ARCING ALARM is another special, SMΩRF's unique advanced type of alarm. Of course, detection of real arcing with just sensor is not technically possible but it is possible to detect side effect of the arcing and it is short lasting sudden change of impedance. Thanks to high sampling rate and CPU power, SMΩRF can detect these sudden changes on every sample and therefore detect changes lasting just several micro seconds. And it is exactly what ARCING ALARM does. If SMΩRF detects sudden impedance change causing SWR to jump above apx. 5, it activates ARCING ALARM. With alarm enabled, it is possible to catch even slightly hot switched relays, poorly made or weakly tightened connectors, feedline problems or poor bonds at the antenna. ARCING ALARM has no settings, it can be just enabled or disabled. When enabled, we recommend to let it break your TX path (TX BREAK = YES) and reset by PTT or MANUAL, because tripped ARCING ALARM means that you have some serious problem in T/R timing, transmission path or antenna, which sooner or later results in some kind of damage. 62 microHAM © 2015 All rights reserved 13 – DATA STRUCTURE DIAGRAM 63 microHAM © 2015 All rights reserved 14 – SENSORS SMΩRF connects to RF signal by remote sensor. Sensor is a box, inserted in the transmission line (coaxial cable) from the source of power (transceiver of power amplifier) to the load (antenna) and provides attenuated sample of current (I) and voltage (U) on load, or attenuated sample of forward (FWD) and reflected (REF) power. SMΩRF supports both types of samples coming from sensors. All supported HF sensors are U/I type with current and voltage transformers inside. They have no characteristic impedance because current transformer is designed to cause minimal series impedance to load and voltage transformer maximal parallel impedance to load. Therefore reference impedance is taken from the characteristic impedance of the connected antenna feed line. All VHF/UHF sensors are FWD/REF type. They are designed as directional couplers, having main line made as a stripline, sensing line as a microstrip and have a certain characteristic impedance (50Ω, optionally 75Ω). All sensors have internal micro-controller and EEPROM memory for calibration data storage and temperature measurements. Each sensor is individually calibrated at multiple frequencies for each band, multiple power levels for each frequency, and for different operating temperatures at a plane of LOAD connector, to the plane of SMA sample connectors. These data are stored in this EEPROM memory. When sensor is attached to the SMΩRF and is powered up for the first time, SMΩRF reads out all calibration data from the sensor's memory and makes a copy of these data in its internal memory in order to avoid long waiting time on every subsequent power up cycle, when SMΩRF only checks presence of the sensor. During run time, SMΩRF takes only temperature measurements from the sensor for real time data correction. Sensor communicates to the SMΩRF over Sensor Cables, therefore it is not allowed to insert any device in between the sensor and the SMΩRF other than plain coaxial cable. Please note, all U/I sensors (HF+6m) have voltage transformer connected in parallel to the LOAD connector. For DC or low frequency AC power, transformer winding acts as a short path to ground. If you have any controller connected to the antenna feedline, which controls some RF Box by injecting DC or AC power to the antenna feedline (Ameritron RCS-4, some other antenna switch, preamplifier or antenna tuner working on this principle) always connect it after the sensor's LOAD connector, towards antenna, assuming that the radio port of such controller is DC/ low frequency AC isolated. If you are not sure, contact your vendor for details. For parameters, frequency and power ratings of each individual sensor models please refer to the Technical Specifications chapter. 64 microHAM © 2015 All rights reserved 15 – REMOTE CONTROL Last feature described in this manual is SMΩRF's Remote Control capability. For Remote Control, SMΩRF provides three ports, AUX, SERIAL and LAN. AUX port is reserved for future hardware accessories. SERIAL RS-232 port has implemented simple protocol in order to provide basic control and measurement results to another RS-232 enabled hardware device, primarily meant to be connected to uLINK DATA module of the Station Master DeLuxe, but principally can be used for connection to any monitoring our automatization hardware device supporting native RS-232 protocol of the SMΩRF. Main attention has been put to LAN connectivity. SMΩRF uses native IEEE 802.3 Ethernet port directly connected to the main CPU (not thru Ethernet to Serial convertor bootleneck) and allows to utilize high bandwidth for data exchange and low latency of 100MBit/s networks. On LAN SMΩRF uses TCP and UDP protocols and provides two internal servers for standard remote access. HTTP SERVER HTTP server is designed for basic maintenance of the SMΩRF from Internet browser. It allows to check current status, backup configuration, restore defaults, change password and update firmware. • To access SMΩRF from the browser, first make sure that the SMΩRF is connected to your local network and has assigned IP address. Go to SYSTEM MENU | LAN SETTINGS and check that LAN ENABLED: is set to YES and STATUS: is RUNNING. • Type IP ADDRESS from the second line of the LAN SETTINGS screen to the browser. Use dots between numbers. • Type User name and Password to get in. Default access is: User: admin Password: admin CONFIGURATION • • • User Sets User Name and Password. It is possible to entirely disable log-in requirement. Network Shows DATA and VNC port numbers and allows to disable VNC Server. Backup/Restore Allows to backup all SMΩRF settings and backup slots to one configuration file or restore all these settings from the configuration file back to the SMΩRF. 65 microHAM © 2015 All rights reserved FIRMWARE Serves for firmware updates. Firmware update can be downloaded from www.microham.com After download, click Choose file button and select downloaded firmware file. Click Update. During firmware upload do not disconnect SMΩRF from the power and LAN, do not turn it off, and do not touch any buttons on its front panel. Prior firmware update it is necessary to backup SMΩRF configuration because firmware update may irrecoverably corrupt data and backups in the SMΩRF memory. Proper procedure is: 1. 2. 3. 4. 5. Backup config Update firmware Restart SMΩRF Restore config Restart SMΩRF Config Backup/Restore function at Firmware page is functionally equivalent to Backup/Restore function at Configuration page. STATUS Shows very simple readout of active sensor's FWD and SWR values at the TX point. LOGOUT Disconnects from the web server and locks access. Since there is a lot of variation how different browsers work, it is possible that some function may not work correctly. In this case we recommend to use Mozilla Firefox which is always tested for full functionality. 66 microHAM © 2015 All rights reserved VNC SERVER If there is any need to change something in the SMΩRF's screen settings or menus remotely, it is a task for VNC Server. VNC server in the SMΩRF allows remote operation of the SMΩRF in a same fashion as if you operate its front panel. It transfers operator's keyboard keystrokes to the SMΩRF and sends current screen copy back to operator. VNC is slow for real time operation but perfectly suitable for remote navigation through menus or for editing screens thanks to zero learning curve. VNC server in the SMΩRF has been optimized for free TightVNC Viewer. It can be downloaded from www.tightvnc.com and is available for Windows and Android platform. Another tested free VNC viewer is RealVNC Viewer. It can be downloaded from www.realvnc.com and is available for Windows, OS-X, Linux, Raspberry Pi, Android and iOS systems. • To access SMΩRF from the viewer, first make sure that the SMΩRF is connected to your local network and has assigned IP address. Go to SYSTEM MENU | LAN SETTINGS and check if LAN ENABLED: is set to YES and STATUS: is RUNNING. • Start the TightVNC Viewer and type IP ADDRESS from the second line of the LAN SETTINGS screen to Remote Host field in the Viewer. Use dots between numbers. If you have changed default VNC port address (5900) in LAN SETTINGS, add it after IP address separated by two colons. • Click Options and set parameters according to screenshot. • Click OK and click Connect. You should get in. Keyboard mapping: Enter M LEFT Arrow RIGHT Arrow + Left Shift 1 2 3 4 PgUp PgDown Home End = EDIT button = MENU button = ← SCREEN button = → SCREEN button = KNOB turn one step CW = KNOB turn one step CCW = KNOB press = SENSOR 1 button = SENSOR 2 button = AUTO mode = DUAL mode = Value increment by 10 = value decrement by 10 = Jump to minimal value = Jump to maximal value 67 microHAM © 2015 All rights reserved REMOTE CONTROL APPLICATION SMΩRF Remote Control Application is native, touch screen friendly application for Windows and OS-X provided by microHAM, which fully exploits strengths of direct TCP connection to the SMΩRF, providing real time access to the SMΩRF measurements. Application can be downloaded from www.microham.com. After installation and first start it is necessary to click on SETUP button and set connection parameters. Set desired Session name, enter SMΩRF's IP address and DATA port, User name and Password, and MAC address. DATA port and MAC address can be found in LAN SETTINGS menu. Than move session into Sessions window clicking on < button. Make new session active, and click Save button on the bottom to save entered parameters. Click Connect and you should get in. That's the quick start but Remote Control Setup allows to set more parameters. 1 2 3 1. Sessions List Shows all sessions and their parameters. Session can be overwritten by moving same sessions name into list by < button . Highlighted session can be deleted by X button. 2. Active session Sets active session for connection. Active session can be assigned for auto-connect when Connect after start-up box is checked. 4 5 3. Options Switch to COMPACT mode after connected – Remote Control starts in COMPACT mode. Preserve window layout – remembers position of normal window as well as compact window on desktop. Stay on top – sets application to stay on top of other programs on desktop. Log communication – logs data exchange for troubleshooting. Do not check it until you're asked. Show peak hold for top bargraph where applicable – shows power peak hold segment on top bargraph. Show peak hold for bottom bargraph where applicable – shows power peak hold segment on bottom bargraph. 4. AUTO range switch to lower timeout Sets down-ranging time. This setting is equivalent to the BAR DOWNRANGING parameter from the SYSTEM MENU | MISCELANEOUS. Since Remote Control application has independent settings, this parameters is set separately. 5. Polling rate Sets polling rate. This setting allows to limit data amount transferred between the SMΩRF and the Remote Control application what can be useful if SMΩRF is located on remote site where you pay for Internet data amount. Remote Control application can work in two forms, NORMAL and COMPACT. In COMPACT mode it doesn't allow any settings and uses bar graphs settings and first two measurements from the NORMAL mode. 68 microHAM © 2015 All rights reserved 2 1 12 6 10 7 8 11 13 15 9 14 3 4 5 16 CONTROLS: TOP bar graph functions 1. SESSION NAME Shows name of active session. 2. SENSOR 3. 4. 5. 6. 7. 8. 9. 10. 11. 12. 13. 14. 15. 16. Remote Control in COMPACT mode Shows active sensor. SENSOR 1/2 Selects active sensor. AUTO Sets AUTO sensor mode. DUAL Sets DUAL sensor mode. TOP BAR GRAPH Sets function for the TOP BARG GRAPH. BOTTOM BAR GRAPH Sets function for the BOTTOM BAR GRAPH. SETUP Calls Setup window. RESET Alarm reset button. TOP BAR GRAPH RANGE Sets range for the TOP BAR GRAPH. Measurements BOTTOM BAR GRAPH RANGE Sets range for the BOTTOM BAR GRAPH. CONNECT/DISCONNECT Connects or disconnects to active session. LAT/BW Shows current latency and occupied bandwidth. Bandwidth can be limited in the Setup. SET1/2/3 Calls stored preset. When pushed and held, current settings will be stored to the preset. MEASUREMENTS Sets measurement type for each one of six measurement positions. COMPACT Sets window size to the COMPACT mode. 69 BOTTOM bar graph functions microHAM © 2015 All rights reserved 16 – TECHNICAL SPECIFICATIONS SMΩRF (Meter) CHARACTERISTIC Display Point of measurement Sensor and antenna for all measurements Power range 0.001W to 19,999W, -9.99dBm(dBW) to 72.99dBm(42.99dBW) depends on sensor, -80dBm to +23dBm in 4IN mode Power types Peak, instant, average, total peak and total average for forward, delivered and reflected power. Adjustable peak hold time, averaging time and update rate. SWR range 1.00 – 99.9 Return Loss 0 – 99.99dB Phase -180.0° to +180.0° Impedance Real and imaginary part from +/- 0.01 – 9999Ω, phase from +/- 0.01° to 89.9° Other measurements |Z|, R, X, |Y|, G, B, Γ, | Γ|, Φ, IMD, |U| and | I| (peak, p-p, rms), L, C, Loss, Gain*1 Simultaneous measurements 15 Display 256x64 graphic monochrome OLED, 3.11” diagonal size, 16 intensity levels Bar Graphs Type 2x 51 segments, 3 user assignable colors (red, green yellow), Dot or Bar mode. Point of measurement Sensor point and antenna point for all measurements Power ranges 5 range multipliers (x0.1, x1, x10, x100/1000) and 3 linear scales (10, 20, 50) for total 14 full scale ranges 1W – 20,000W. Power ranges mode AUTO, manual, 100% (level adjustable on per band, per sensor basis). Power types Peak, average for forward, delivered and reflected power. Separate (one segment) peak hold. Adjustable peak attack and decay, hold and averaging time. SWR 1.00 to >15 in 4 semi-linear scales Impedance 0 to +100Ω for R and |Z|, -100 to 100Ω/° for X and Φ Simultaneous measurements 4 Tone Generator Type DDS based, 32bit precision, 214 quarter sine wave look-up table Output level 1μV – 130mVp-p, +/-10%, step 1/100/1000μV Frequency 150Hz – 9999Hz, step 1Hz, DDS based Signal type Sine, Dual Tone (individually adjustable frequencies and levels), White/Pink noise Sweeps Amplitude, frequency in linear or logarithmic scale Mode Continuous, single shot 10 – 9900 ms Frequency accuracy 100ppm Output Flatness +/- 0.15dB THD 0.0028% D/A converter 24bit, 160ksps 70 microHAM © 2015 All rights reserved RF Characteristics RF ports IN1, IN2, IN3, IN4 4x SMA female connector Operating frequency range 1.8MHz to 500MHz Absolute maximum power +26dBm Amplitude dynamic range > 90dB Phase dynamic range > 70dB Counter dynamic range > 50dB Frequency segmentation 10kHz at 1.8-2.5MHz and 49-400MHz, 1kHz at 2.5-49MHz, 100kHz above 400MHz Ports isolation*2 Noise floor -70dBm typically Amplitude calibration range Amplitude > 50dB up to 80MHz, 46dB at 145MHz, 39dB at 435MHz, > 85dB not muxed accuracy*3 -60dBm to +23dBm, 34 selected frequencies, step 0.5dB -20dBm to +23dBm <0.04dB up to 150MHz <0.06dB at 250MHz, <0.09dB at 500MHz -60dBm to -20dBm, <0.08dB up to 150MHz <0.12dB at 250MHz, <0.16dB at 500MHz Phase calibration range -180° to +180°, 34 selected frequencies, step 0.9° Phase accuracy -30dBm to +23dBm <1% up to 60MHz, 1.5% at 150MHz, 3.5% at 450MHz -50dBm to -30dBm <2% up to 60MHz, 3.5% at 150MHz, 4.0% at 450MHz Phase range -179.9° to +180° up to 30MHz, -179.9° to +170° up to 60MHz -179.9° to +160° up to 150MHz, -179.9° to +120° up to 450MHz Power accuracy*4 0.1 0.3 0.2 0.1 – – – – 1W 3%, 3W 3%, 2W 3%, 1W 3%, 1W 3W 2W 1W – – – – 600W <2%, 600 – 3000W <2.5% from 1.8MHz to 54MHz (CHF-3) 2000W <2% at 70MHz (CVHF-2) 2000W <2% at 145MHz (CVHF-2) 400W <2%, 400 – 2000W <2.5% at 435MHz (CVHF-2) Ports DC Power 12-15V DC, 1300mA max. depends on brightness setting iLINK 2x miniDIN6 for proprietary connection to iLINK enabled microHAM devices LAN RJ45, auto MDI/MDIX, 100BaseTX, IEEE 802.3 Ethernet port AUX DIN6, Do not connect, reserved for future updates PTT/INHIBIT OUT1, OUT2 2x RCA, open collector output, max. 24VDC, 100mA PTT/IHIBIT IN1, IN2 2x RCA, optically coupled input, internal 1500ohm pullup to 5V SERIAL Native RS232, 1200-115200Bd Other Parameters A/D converter Synchronous parallel 16bit, 125ksps Measurements update rate 2000/s in single sensor modes, 100/s in dual sensor mode, 50/s in 4IN mode Dimensions W: 250mm, D: 210mm, H: 110mm Weight 2.4kg *1 Requires two sensors *2 Muxed inputs IN1-IN3, IN2-IN4 *3 Absolute accuracy to NIST traceable HP438A SN#2517U00290, HP8482A SN#2652A22248, HP8482A SN#1925A05693 for levels from -20dBm to +23dBm, and to Keysight U2004A for levels from -60dBm to -20dBm *4 RSS (Root Sum of Squares) uncertainty for complete system including sensor mismatch, sensor calibration, sensor cables, SMΩRF calibration and reference power meter uncertainties. 71 microHAM © 2015 All rights reserved SENSORS CHF-3 Operating frequency range 1.8MHz to 54MHz, U/I type Maximal Power 3000W ICAS, 1500W CCS RF ports connectors Power side 2x SO-239, meter side 2x SMA female Input Return Loss > 30dB Insertion Loss 0.02dB – 0.04dB from 1.8MHz up to 30MHz, <0.08dB at 50MHz Directivity 27dB at 1.8MHz, 33dB at 3.5MHz, >40dB from 7MHz up to 30MHz, 35dB at 50MHz Coupling ~50dB, 50Ω loaded Power and phase accuracy < +/- 0.04dB (~1%), < 2° (~0.6%) Operating temperature range -20 to +60° C (sensor) Weight 500g CVHF-2 Operating frequency range 70MHz to 500MHz, directional coupler Characteristic impedance 50Ω Maximal Power 2000W ICAS, 1000W CCS RF ports connectors Power side 2x N female, meter side 2x SMA female Input Return Loss >30dB Insertion Loss <0.02dB up to 250MHz, <0.03dB at 500MHz Directivity 35dB at 70MHz, >30dB up to 500MHz Coupling ~60dB at 70MHz, ~50dB at 250MHz, ~45dB at 500MHz, 50Ω loaded Power and phase accuracy < +/- 0.04dB (~1%), < 2° (~0.6%) Operating temperature range -20 to +60° C (sensor) Weight 500g All sensor parameters are typical 72 microHAM © 2015 All rights reserved 17 - PACKAGE CONTENTS The product includes one (1) RF VECTOR SIGNAL METER, one (1) miniDIN 6 to miniDIN 6 cable, 1.5m long, one (1) coaxial 2.1mm/5.5mm power plug, one (1) 4 pole 3.5mm audio plug, one (1) Foster 8 female plug, and Quick Start User Guide in English language. Sensor package contains one (1) Sensor and two (2) individually calibrated sensor cables, typically 3m long. If the shipment is incomplete, please contact your supplier or us at the following address: E-mail: [email protected] fax : +421 2 4594 5100 by Post: microHAM s.r.o. Nadrazna 36 90028 Ivanka pri Dunaji SLOVAKIA 18 – WARRANTY microHAM warrants RF VECTOR SIGNAL METER for two (2) years. The product must not be modified in any way, or the warranty is voided. The warranty does not cover damage caused by improper or abnormal use, failure to follow instructions, improper installation, lightning, or excessive power. The product will be either repaired or replaced, at our discretion. The only cost will be the cost of return shipping. Cables are warranted against defects in materials and workmanship for a period of 60 days. microHAM SMΩRF Remote Control (the software) is provided “as is” without guarantee of compatibility with any specific operating system, computer, hardware or accessory. microHAM assumes no liability or responsibility for damage to other devices or injuries to persons as a consequence of using our products. If the terms of the above warranty are not acceptable, return the unit, all associated documents and accessories in the original package, prepaid, to microHAM or to your supplier for refund less shipping and restocking fee. 73 microHAM © 2015 All rights reserved DECLARATION OF CONFORMITY Federal Communications Commission Statement (USA) This device complies with Part 15 of the FCC Rules. Operation is subject to the following two conditions: (1) this device may not cause harmful interference, and (2) this device must accept any interference received, including interference that may cause undesired operation. European Union Declaration of Conformity microHAM, s.r.o. declares that the products: Product Name: RF VECTOR SIGNAL METER Conforms to the following Product Specifications: EN 55022: 2010 Class B following the provisions of the Electromagnetic Compatibility Directive 89/336/EEC, 2004/108/EC 74