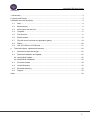
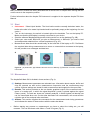
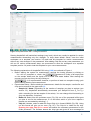
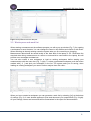
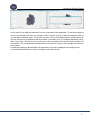
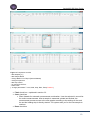
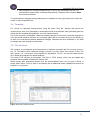
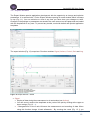
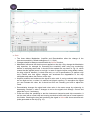
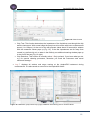
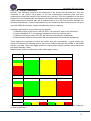
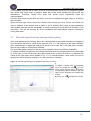
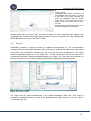
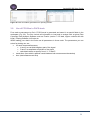
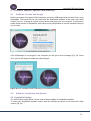
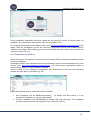
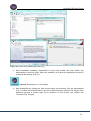
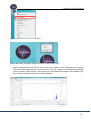
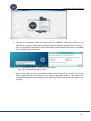
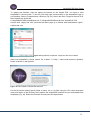
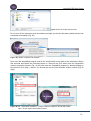
1
AMPHASYS AG s TECHNOPARK® Lucerne s Platz 4 s CH-6039 Root D4 s Switzerland s phone +41 41 541 91 20 s [email protected] s www.amphasys.com
AmphaSoft SW User Guide
Content
1 Introduction ..................................................................................................................................3
2 License and Dongle ......................................................................................................................3
3 Software structure and parts.........................................................................................................3
4
3.1
Start ..................................................................................................................................4
3.2
Measurement ....................................................................................................................4
3.3
Work space and work list...................................................................................................8
3.4
Template .........................................................................................................................11
3.5
File structure ...................................................................................................................11
3.6
Expert window .................................................................................................................12
3.7
Plot with zoom functions and population gating ...............................................................18
3.8
Report .............................................................................................................................20
3.9
Use of FCS-files in FACS-tools .......................................................................................21
Technical support, updates and warranty ...............................................................................22
4.1
Software License and dongle ..........................................................................................22
4.2
Software Installation and Update .....................................................................................22
4.2.1 AmphaSoft Update ........................................................................................................22
4.2.2 AmphaSoft Installation ...................................................................................................23
4.3
Firmware Update .............................................................................................................30
4.4
Limited Warranty .............................................................................................................33
4.5
Extended Warranty..........................................................................................................33
4.6
Support ...........................................................................................................................33
Index .............................................................................................................................................34
AMPHASYS AG s TECHNOPARK® Lucerne s Platz 4 s CH-6039 Root D4 s Switzerland s phone +41 41 541 91 20 s [email protected] s www.amphasys.com
2
AmphaSoft SW User Guide
1 Introduction
This User Guide provides detailed information about the software used with Ampha Z30
impedance flow cytometer, for controlling the instrument, data acquisition, and data analysis, which
runs on a Windows-based laptop PC (Fig. 1). Data should be saved locally at the hard disk at the
laptop/PC.
The use of the software AmphaSoft needs a license, which will be provided with a USB-dongle.
This stick has always to be plugged in the PC or laptop during measurement or analysis. For more
details see section 2.
For matters regarding the Ampha Z30 instrument, accessories, chips, etc., please refer to the
Ampha Z30 User Manual or go to http://www.amphasys.com/community.
Figure 1: The Ampha Z30 Impedance Flow Cytometer System
2 License and Dongle
The license for using AmphaSoft will be provided with an USB-dongle, which always has to be
plugged in the PC or laptop during online and offline use. USB-dongles are available with full
license. For trial or test licenses contact Amphasys. ! The dongle contains the license file, which
should never be deleted and the dongle should not be used for any other purpose. !
3 Software structure and parts
AmphaSoft Software runs in Offline or Online mode with the option to perform routine
experiments in User level with default values or in Expert Window (section 2.5) for application
development and the opportunity to change parameters.
Offline
§ Data Analysis
§ Planning of Experiments
§ Reporting
Online
§
§
§
§
Data Acquisition
Planning of Experiments
Data Analysis
Reporting
AMPHASYS AG s TECHNOPARK® Lucerne s Platz 4 s CH-6039 Root D4 s Switzerland s phone +41 41 541 91 20 s [email protected] s www.amphasys.com
3
AmphaSoft SW User Guide
Many functions or buttons are briefly described with a mouse over or hotspot when moving with the
mouse cursor to the respective position.
Further Information about the Ampha Z30 instrument is supplied in the separate Ampha Z30 User
Manual.
3.1 Start
·
·
·
·
·
Instrument: ! Check liquid bottles: The front bottle contains normally deionized water, the
bottle at the side is for waste liquid and should be preferably empty at the beginning of a test
series. !
Turn on the instrument; the switch is located right at the backside. Turn on the laptop PC.
Make sure that the USB cable is correctly connected to your device.
Start the software “AmphaSoft” by double clicking at the icon on the desktop (Fig. 2B).
Select your user mode, “Online” if you plan a measurement, or “offline”, if you want to load
and analyze data obtained from a former experiment (Fig. 2C).
Measurement data should be saved locally at the hard disk of the laptop or PC. Don’t save
the acquired date during measurement at a server or external drive connected to the laptop,
this will provide error messages and data loss.
A
B
C
Figure 2: (A) Instrument, (B) Software shortcut icon on desktop, (C) Selection of online or offline
user mode.
3.2 Measurement
The AmphaSoft Main GUI is divided in three sections (Fig. 4):
(1) Settings: Measurement parameters are selected here. Information about sample, buffer and
chip are entered, as well as the measurement frequencies and the measurement stop
criteria. All these settings are stored for each measurement and supplied in the report files.
(2) Results: This section provides on the one hand a graphical output of the measured cells in
terms of a scatter plot, in which the signal Amplitude (y-axis) is plotted against the signal
Phase (x-axis). The dots are shown as a density analysis, in which highest cell density has
red, the lowest dark blue color. On the other hand also cell concentration, cell counts and the
rejection rate of the analyzed cells are shown.
(3) Actions: This section supplies the commands for the measurement and rinsing procedures
and indicates the status of these actions with the status bar below.
·
Before starting any process or measurement you have to select the tubing set, you will
measure. This can be chosen with >Menu >Tools >Program (Fig. 3)
AMPHASYS AG s TECHNOPARK® Lucerne s Platz 4 s CH-6039 Root D4 s Switzerland s phone +41 41 541 91 20 s [email protected] s www.amphasys.com
4
AmphaSoft SW User Guide
Figure 3: AmphaSoft Main GUI – Tubing set selection
Starting AmphaSoft will load default settings (user level), which can usually be applied for routine
measurements demanding only few changes. To keep these default values, save the initial
workspace as a template (see section 3.4) and load this template for routine measurements
without any extra changes in the parameters. After adding Chip Ids and any new parameters you
will use for various measurement days, we recommend to save the workspace as a separate
template (section 3.4) and to load this template for your new measurements.
The following explanations of AmphaSoft GUI using (1/2/3) are referred to Figure 4.
· Before starting the system for measurement, execute the rinsing process by clicking on
Start Rinsing
. You will be prompted to check the
presence of a chip, of an empty tube
on the sample holder and the liquid level of water and waste bottles. After starting this
process you can stop it any time by clicking on
Stop Rinsing
. It is recommended, however, to perform at least one complete rinsing cycle
before starting with the first measurement.
· Experimental setup: Before starting a measurement, details for the sample, used buffer and
chip can be entered in the upper area (1).
o Sample Id / Name: Depending on the number of samples you plan to analyze (see
section 3.3), AmphaSoft automatically enumerates your Sample Id from S_1 to S_n
(with n standing for the last sample of the series). You can change this Id according to
your own discretion, if required.
o Buffer Id: Select from the pull-down menu (Fig. 5A) one of the proposed buffer types
you plan to use for the measurement. If it is not listed, add it to your list or replace a
present one as needed by selecting [...].
o Chip Id: Likewise, select or add the correct Chip Id in format X00000 (Fig. 5B). Using
not this format will give you an error (Fig. 5C). The Chip Id is visible on the chip.
Entering the right Chip Id is a must and selects the necessary parameters for the
fluidic processes. The software detects the chip type and gives an error message for
AMPHASYS AG s TECHNOPARK® Lucerne s Platz 4 s CH-6039 Root D4 s Switzerland s phone +41 41 541 91 20 s [email protected] s www.amphasys.com
5
AmphaSoft SW User Guide
discrepancy. Selecting the Chip Id will help tracking the usage of the chip for the
various measurements and providing comparability of the measurements.
2
6
1
3
Figure 4: AmphaSoft GUI
A
B
C
Figure 5: Pull-down menu for Buffer Id (A), for Chip Id (B) selection and format of Chip Id (C).
o
Selection of measurement frequencies: Choose the desired measurement
frequencies in the middle part (1), you can select 1, 2 or 4 frequencies. For the first
frequency a low value 0.5 MHz (0.5 to 2 MHz) is recommended to have optimal signals
for recording the measurement. For higher frequencies you have to check the signal
with the Expert window (3.6). The other frequencies you can apply in the range of 0.1
MHz up to 30 MHz. (Note: For using 4 frequencies, apply first the fourth and then the
third frequency.)
· In the lower part of section (1) you can select among three different stop criteria for your
measurement: volume, time or number of measured cells. If you enter two or all three
criteria, the measurement will be stopped as soon as one of the entered criteria is achieved.
AMPHASYS AG s TECHNOPARK® Lucerne s Platz 4 s CH-6039 Root D4 s Switzerland s phone +41 41 541 91 20 s [email protected] s www.amphasys.com
6
AmphaSoft SW User Guide
Make sure that your sample volume is in agreement with your settings. Living these fields
blank requires your manual intervention to stop the measurement. Use only realistic values!
· Flush check box (1):
§ “Flush” stands for a short rinsing cycle of the whole tubing system including the chip
using system liquid (usually deionized water). It is part of a measurement process and
cannot be performed separately.
§ It starts right after the measurement has been stopped (manually or automatically) and
prepares the instrument for the next measurement. It removes from in the lines most
cells of the just terminated measurement, but is not a thorough cleaning.
§ After this short flush cycle the device is ready for loading the next sample.
§ Check this box if you plan serial analyses, for which extensive rinsing of the system in
between the different samples is not required.
§ Note: the Flush cycle pumps water into the sample tube. Thus, if you check this box be
aware that the rest of your sample will be diluted. If you still need the residual sample,
do not check this box or exchange sample tube immediately after the measurement
was stopped.
·
·
·
By selecting [ + ] at the bottom of (1), you open a work list to plan and document your
experiments. Details are explained in 3.3 Work space.
With < > you select between samples during measurement and analysis. (1)
The bottom line informs you about actions to do or during the run. (1)
·
Results and plot are displayed in (2). Actions are displayed in (3).
·
When you want to measure, push the button, Start Measurement you will be ask to save the data
to a workspace (more details in 3.3) and to provide a chip and a sample, always continue
with a mouse click or Enter.
The continuation of the process is shown with the long bar in (3) and in the bottom line of (1).
During measurement there is first the sample with high pump speed loaded, than the pump
speed is adjusted and cells are detected.
The button is changed to Stop Measurement and you can stop the measurement any time or it
will be stopped by your given criteria.
In (2) the plot of measured cells will be updated regularly. At the bottom there are the number
of accepted cells, the percentage of rejected cells and the cell concentration per ml displayed
and regularly updated until stop.
After stop of measurement the data are calculated and the plot is updated to a density plot
with red/yellow dots showing high number and blue dots for low number of events (Fig. 6).
·
·
·
·
·
AMPHASYS AG s TECHNOPARK® Lucerne s Platz 4 s CH-6039 Root D4 s Switzerland s phone +41 41 541 91 20 s [email protected] s www.amphasys.com
7
AmphaSoft SW User Guide
Figure 6: AmphaSoft GUI with data plot
3.3 Work space and work list
When starting a measurement the software prompts you with a pop up window (Fig. 7) for creating
a workspace to save the data. You can change the name in this window and confirm it with Enter.
When selecting an already existing name the system asks you for overwriting or changing.
Measurement data should be saved locally at the hard disk of the laptop or PC. Don’t save the
acquired date during measurement at a server or external drive connected to the laptop, this will
provide error messages and data loss.
You can also create a new workspace or load an existing workspace before starting your
measurements with the menu bar (Fig. 7 right). To select a generated workspace push the button
marked with [ … ] and pick your workspace in the list. The system asks you for saving, when
loading an existing workspace you want to further analyze then click <No>.
Figure 7: Creating or loading a workspace
When you have created a workspace you can generate a work list by selecting [ + ] at the bottom
of settings (Fig. 8). A new window appears to plan and document your experiments (Fig. 8 right).
All your settings, names and comments will be summarized in the report for documentation.
AMPHASYS AG s TECHNOPARK® Lucerne s Platz 4 s CH-6039 Root D4 s Switzerland s phone +41 41 541 91 20 s [email protected] s www.amphasys.com
8
AmphaSoft SW User Guide
Figure 8: Creating a work list
In the work list the default parameters for one measurement are displayed. To add more samples
select [+] for adding each time one sample or with a number and [+] to add more samples. With [-]
you can delete samples again, if they were not done. Enter your Sample Names, edit the Buffer Id,
Chip Id, frequencies, parameters and stop criteria if necessary (Fig. 9). Change parameters (Level,
Mod., Amp., Dem., Pump) only if you know your values, otherwise use expert window (section 3.6)
and confirm. The pump speed for measurement is set with the Chip Id, any changes can influence
your results.
All adds and changed values beside chip parameters can also be adapted and changed in the
normal AmphaSoft window in section <settings> and will be saved.
AMPHASYS AG s TECHNOPARK® Lucerne s Platz 4 s CH-6039 Root D4 s Switzerland s phone +41 41 541 91 20 s [email protected] s www.amphasys.com
9
AmphaSoft SW User Guide
Figure 9: Complete a work list
- add samples [+/-]
- add Sample Name
- change Buffer Id or Chip Id (format X00000)
- change frequencies
- add stop criteria
- (un)check Flush/Cont.
- make notes
(- change parameters – Level; Mod; Amp; Dem; Pump Caution!)
· Flush check box - explained in section 3.2
· Cont. check box
§ “Cont.” stands for automatic measurement continuation. It can be selected in a work list
for routine measurements. After a sample is measured, plotted and flushed, the
measurement process moves to the next sample according to the settings in the work
list and the loading step is directly started. The system asks you for the new sample to
continue.
· Done check box
AMPHASYS AG s TECHNOPARK® Lucerne s Platz 4 s CH-6039 Root D4 s Switzerland s phone +41 41 541 91 20 s [email protected] s www.amphasys.com
10
AmphaSoft SW User Guide
§ “Done” stands for a finished measurement. It can by not selected by the user. It is
automatically checked after a finished measurement. Samples with a checked Done
box cannot be deleted.
To switch between samples during measurement or analysis use the [+][-] button at the lower left
corner in main AmphaSoft GUI.
3.4 Template
For routine or repeating measurements using the same Chip Ids, settings and names we
recommend to save your generated or measured work list as a template. Also generated gates are
saved with this template and applied to your new measurements.
Use in the menu bar >Workspace >Save as template and give a new name. Load this template for
your next measurements and save it if necessary again with a new name and you can directly go
on with your measurement without additional changes. Generate also such templates, if you want
to change any extra settings or parameters.
3.5 File structure
The creation of a workspace and measurement of samples generates the file structure shown in
Fig. 10. The data of each measured sample is stored in an own folder that includes 5 files. The
files *.amph, *.clr, *.meas and *.isf are specific for AmphaSoft. The file *.csv can be loaded as textfile in Excel-like programs for special analysis.
The folder FCS includes all generated *.fcs files in FCS3 format, which can be loaded and
analyzed with a suitable software tool (section 3.9).
When reports were generated (Section 3.8) the documentation files *.csv (to open in Excel or
similar tools) and/or *.html (to open in a browser) and an additional folder is added with pictures of
all plots in *.png format.
Figure 10: File and folder structure
AMPHASYS AG s TECHNOPARK® Lucerne s Platz 4 s CH-6039 Root D4 s Switzerland s phone +41 41 541 91 20 s [email protected] s www.amphasys.com
11
AmphaSoft SW User Guide
3.6 Expert window
The Expert Window permits application development with the opportunity to change and optimize
parameters. It is selected with >Tools >Expert Window opening an extra window which is always
on top (Fig. 11). You can minimize or close it any time you have done your changes or tests.
Changes in the settings or parameters are saved to the user account on the laptop and are loaded
with the AmphaSoft to any user. To prevent any trouble, work with default and special application
templates.
Figure 11: Starting Expert Window
The expert window (Fig. 12) comprises 5 function modules: Signal, Actions, Control, Gain and Log.
Figure 12: Expert Window - details
· Signal
§ Display of data during the measurement or in test modus (see Actions)
§ You can zoom in and out the amplitude at the y-axis of the plot by clicking at the upper or
lower number (Fig. 12 →).
§ ! Changes/Zoom of the x-axis influence the measurement and recording of data. When
using this function change it back afterwards. ! By zooming the x-axis (Fig. 13 ↑) you
AMPHASYS AG s TECHNOPARK® Lucerne s Platz 4 s CH-6039 Root D4 s Switzerland s phone +41 41 541 91 20 s [email protected] s www.amphasys.com
12
AmphaSoft SW User Guide
change the time frame, in which the signals are collected during measurement. The
default time frame is 15 x 10-4 s (Fig. 12). When changing the x-axis to a shorter time
frame (Fig. 13 left – time frame: 5 x 10⁻⁴ s), signals from slow running particles are not
counted or rejected due to imperfect signals. When zooming out the x-axis (Fig. 13 right –
time frame: 30 x 10-3 s), signal processing becomes worse and inaccurate.
Figure 13: Expert Window – change of time frame in signal plot
· Actions
§ Test modus of measurement with Stop n, All and Trig function.
§ X-part is blue, Y-part is green.
§ All – shows the continuous output of the instrument in the Signal area like an oscilloscope
before data processing with selection. When you want to check a sample for signals,
noise or any other tests activate this box. To stop it - press n.
§ Trig – displays the signals of a possible measurement, based on the given parameters. It
allows you to test for the real signal and to verify changes of the parameters and settings
before starting the real measurement. To stop it press n.
§ Stop n – ends the selected action. Do not press this button during active measurement;
only stop your measurement in the main window.
· Control – manipulation of the recording and control of pump and valves
§ Level: This is the trigger value set to record the signals. When using in Actions [All] or
[Trig], it is visible in the Signal area as a red dotted line above and below x-axis. The level
should be adjusted to a value about double the signal noise and lower than the signals
you want to record.
§ pos/neg (drop down function): Selects the direction of the signal curve from the signal for
recording. It can be verified by using the Actions function. The normal signal with X
positive or Y negative is seen in Fig. 12.
§ Pump: Here you can manually control the pump with check/uncheck, a given value
between 0 and 400rpm and the direction of rotation. The rotation is counter-clockwise
from sample tube to the chip with unchecked valves (normally used) and clockwise from
water bottle to the sample tube or chip. ! You have to use it with the right valve positions.
Be carefully with the direction and speed, it is dependent from the fluidic set and chip and
can mix your sample or pollute your water. To adjust the speed of the pump for optimal
measurement check the signals with the Trig function in Actions. For ideal speed most
signals are in the range of 1 to 4 x10⁻⁴ seconds (Fig. 12 ↔) in the given time frame. Avoid
speeds below 1 x10⁻⁴ seconds, which could cause false counts. Optimal speed for each
tubing set and AmphaChip are in the AmphaZ30 user manual in section 3.1.4 table 3.
AMPHASYS AG s TECHNOPARK® Lucerne s Platz 4 s CH-6039 Root D4 s Switzerland s phone +41 41 541 91 20 s [email protected] s www.amphasys.com
13
AmphaSoft SW User Guide
§ Valve: The valves are in standard position unchecked. Be carefully when changing this
function.
§ X Y: Selects the real (X) or imaginary (Y) part of the signal for recording. It can be verified
by using the Actions function. The normal signal with X positive or Y negative is shown in
Fig. 12.
§ Load: This function affects the measurement function in the main window. With the
unchecked box it is possible to measure a sample which is already loaded in the
instrument by a previous measurement or a manually loaded sample.
§ Rinse: This action influences the initial Rinsing process when starting the instrument and
software. The first Rinsing has to be performed before measurement. Only uncheck this
box, if you have to restart the software for special reasons and if you have a sample
already loaded.
§ More details about the fluidic and the manual use of the pump and valves are explained in
the Ampha Z30 user manual.
Default settings and parameters are
- Level: 0.1
- X positive or Y negative
- Pump unchecked, counter-clockwise
- Pump speed – dependent from selected tubing set and chip type (set S 20rpm Achip; set M 40rpm B-chip/80rpm C-chip; set L 60rpm D-chip/300rpm E-chip)
- Valves unchecked
- Load and Rinse function checked
- Signal plot – Amplitude at 10 V and time frame 15x10-4 s
- Gain – 3 Modulation / 6 Amplifier / 2 Demodulation.
These settings are loaded by starting AmphaSoft. Any changes are saved to the user account on
the laptop and are loaded with the AmphaSoft to any user. To prevent any trouble - work with
default and special application templates.
AMPHASYS AG s TECHNOPARK® Lucerne s Platz 4 s CH-6039 Root D4 s Switzerland s phone +41 41 541 91 20 s [email protected] s www.amphasys.com
14
AmphaSoft SW User Guide
Figure 14: Expert Window specials
· Gain
§ The three sliders Modulation, Amplifier and Demodulation allow the change of the
instrument sensitivity. Default settings are 3 / 6 / 2(x4).
§ Changes should be always controlled with the Actions function.
§ Modulation influences the electric power applied on the chip. Only change the Modulation
with expertise, for example for increasing the sensitivity while using low conductivity
buffers or analyzing small cells. It should not be marked red, as shown in Fig. 14, which
means that the applied power is too high. In case of signal overflow using default values,
the chip might be blocked (à check flow rate), or out of specifications (à perform chip
test). Please note that higher voltages can accelerate the degradation of the chip
electrodes and reduce the life-time of the chip.
§ Amplifier modifies and enhances the signal to noise ratio. It can be reduced when signals
are too high and cut, or when it is marked red (signal overflow). To strengthen the signal
you can increase the value, but it should not turn red. Possibly you have to adjust the
Level.
§ Demodulation changes the signal and noise value in the same range by enhancing or
decreasing. Reduce it, when it changes to red or the signals look strange. Control and
adjust the Level, if necessary.
§ Pulse test offers the possibility to test the instrument electronics and chip connection. It
can be used with a normal chip and running conductive buffer with low to normal speed in
the fluidics. Checking the box and monitoring the signal in Actions/All shows an electronic
pulse generated on the chip (Fig. 15).
AMPHASYS AG s TECHNOPARK® Lucerne s Platz 4 s CH-6039 Root D4 s Switzerland s phone +41 41 541 91 20 s [email protected] s www.amphasys.com
15
AmphaSoft SW User Guide
Figure 15: Pulse function
§ Chip Test: This function determines the impedance of the liquid that runs through the chip
and the instrument. With normal chips the pump has to be active with low or measurement
speed (1 to 100rpm). At the end of the test process (takes about 20 seconds) a window
with the measured values pops up (Fig. 16). If the test impedances are far away from
normal (e.g. defect chip, air or water in the fluidics), an additional warning window pops up
in the end of the test (Fig. 16 right).
§ Chip Detection: This function is normally active. ! Only uncheck, if you know what you do,
e.g. for special cleaning processes, otherwise you flood the instrument and cause
electronic damage !
·
Log – displays all actions and steps running at the AmphaZ30 instrument during
measurement. It is also saved as a text file in the AmphaSoft folder.
Figure 16: Calibration; (left) normal chip, (right) calibration with warning due to unusual values.
AMPHASYS AG s TECHNOPARK® Lucerne s Platz 4 s CH-6039 Root D4 s Switzerland s phone +41 41 541 91 20 s [email protected] s www.amphasys.com
16
AmphaSoft SW User Guide
Chip Test – detailed explanations
Process: Two calibration resistors in the electronics of the device are first measured. They are
connected to the electric circuit paths of the two measurement electrode pairs and their
measurement checks the integrity of the electric line to the chip. Then, the impedance of the liquid
between the two electrode pairs is measured, first between the sensor electrode pair (which is also
called measurement electrode pair and is situated closer to the chip inlet and then between the
reference electrode pair. These measurements can be compared to ideal measurements of a good
chip with PBS buffer as liquid. Large inconsistencies result in a warning.
Calibration generates for every frequency four outputs:
1.) Reference Angle of the device: with PR, PM, P: the reference angle of the instrument.
2.) Liquid impedance: R, P: the average impedances of the two electrode pairs.
3.) Reference electrode values: RR, PR: the reference electrode pair impedances.
4.) Measurement electrode values: RM, PM: the measurement electrode pair impedances.
These outputs are important to check chip quality and chip comparability. A good quality chip
should lie between the following optimal values at 0.5 MHz measured with 1xPBS or 0.9%NaCl
solution, see table. Chips with bigger channels (>50µm) have normally smaller values than these
with small channels (15µm).
Measurements with low conductivity buffers show higher values.
Chip
Impedance R at 0.5MHz 1x PBS
optimal
acceptable
bad broken
15µm
15-25kOhm
25-40 kOhm
>40 kOhm
30µm
8-22 kOhm
22-40 kOhm
>40 kOhm
50µm
6-20 kOhm
20-30 kOhm
>30 kOhm
120µm
6-15 kOhm
15-20kOhm
>20 kOhm
250µm
4-8 kOhm
8-20kOhm
>20 kOhm
Impedance R at 0.5MHz 0.5x PBS (AmphaCalib)
optimal
acceptable
bad broken
15µm
30-50kOhm
50-80 kOhm
>80 kOhm
30µm
20-40 kOhm
40-60 kOhm
>60 kOhm
50µm
15-35 kOhm
35-50 kOhm
>50 kOhm
120µm
10-25 kOhm
25-40kOhm
>40 kOhm
250µm
5-15 kOhm
15-25kOhm
>25 kOhm
Asymmetry (between electrodes)
R
all chip types
< 15%
15-30%
P
> 30%
< 5°
5°–10°
> 10°
Table: Classification for chips with various channel sizes, impedance measured at 0.5 MHz with 1xPBS and
0.5xPBS (AmphaCalib).
AMPHASYS AG s TECHNOPARK® Lucerne s Platz 4 s CH-6039 Root D4 s Switzerland s phone +41 41 541 91 20 s [email protected] s www.amphasys.com
17
AmphaSoft SW User Guide
An acceptable chip can still be used, as far as its measurement results are not analyzed together
with results from other chips. In general, chips with similar liquid impedances give similar cell
impedances. Therefore, results from chips with similar liquid impedances might be
interchangeable.
A broken chip should not be used any more, as it will not separate cell types nicely or is leaky in
the instrument.
When you have high values, check first if there is flow through your chip, if there is the liquid you
want to measure in the channel and no water or no air bubbles. One cause of high impedances
(what makes chips get into the acceptable or broken category) is the formation of a biofilm on the
electrodes. This can be removed by 10 min incubation with AmphaClean solution, followed by
rinsing with water.
3.7
Plot with zoom functions and population gating
After each measurement a density plot of the collected data is generated with adjunct histograms
for x-axis at the top and for y-axis at the right side (Fig. 17). The progress of the data calculation
after measurement to display the final plot is shown in the lower bar. It can take some seconds,
when a high number of events were collected.
The zoom and gating functions of the plot can be used with Online and Offline-AmphaSoft.
To optimal visualize the data you can change the display with the corresponding icon in the toolbar
or in the menu >View >Zoom and using right mouse button to select a frame or by adjusting the
values in the right upper corner (details in Fig. 17). To change between >View mode you have to
deselect the active mode by clicking on it in the menu bar or >escape.
Figure 17: Density plot and adjunct histograms with zoom functions
A:
To adjust X (Phase) and Y (Amplitude)
use in the toolbar the icon
or in the
menu >Zoom mode or type in numbers in
corresponding field for the axis in the right
upper corner. Separate the numbers with
a space.
By using <R> or
the selection is reset.
AMPHASYS AG s TECHNOPARK® Lucerne s Platz 4 s CH-6039 Root D4 s Switzerland s phone +41 41 541 91 20 s [email protected] s www.amphasys.com
18
AmphaSoft SW User Guide
B:
Due to electronic settings in the
instrument the displayed data look like
cut.
To shift the X axis you have to select
>View >Phase Correction and adjust the
value in the field P.
C:
When you want to adjust the Zoom or
Phase correction to all samples you have
to be in the corresponding active mode
and by clicking with the right mouse
button on the plot you can select >Apply
to all.
AmphaSoft gives you the opportunity to select for subpopulations with percentage numbers in a
line or polygon gating function. Both gating function cannot by applied to a sample. Gates and
subpopulations are listed and displayed in the reports.
The gating function is selected with >View >Line or >Polygon gating (Fig. 18). The gate can be
removed or applied to all samples in the corresponding active mode with the right mouse button.
Figure 18: Line and Polygon gating
A:
Line gating
The line gating is a partition in 4
quadrants. By adjusting the cross to the
top or bottom of the plot you can use it as
bifurcated gate in a histogram.
AMPHASYS AG s TECHNOPARK® Lucerne s Platz 4 s CH-6039 Root D4 s Switzerland s phone +41 41 541 91 20 s [email protected] s www.amphasys.com
19
AmphaSoft SW User Guide
B:
Polygon gating
The polygon gate allows a selection of a
subpopulation with own naming. To select
a gate start at the upper left side and
circle the population with left mouse
button clicks. To close the gate, make a
double mouse click. Now you can name
the gate.
With the right mouse button gates can be
removed or applied to all samples.
Polygon gates can be moved, when you want to adjust it to other measurements, signals, new
workspaces etc. Activate the polygon gating function in the menu bar and use >Ctrl together with
“I”, “J”, “K”, “L” for moving up, left, down or right.
3.8
Report
AmphaSoft contains a reporting function for detailed documentation of your measurements
including plots and all gating information. After finishing your analysis the report can be generated
in the menu with >Workspace >Report (Fig. 19). You have the option to generate a *.csv report
(delimiter separated values) or a *.htm report. The *.csv file can be open in Excel like tools and it
contains all information, settings and gating details, but no plots. The *.htm files can be started in a
browser installed on your PC and contains all information and details including the plots.
Figure 19: Creating reports
The report files are saved automatically in the loaded workspace. When the *.htm report is
generated an additional folder is saved in the workspace with single pictures of all your plots in
*.png format (Fig. 20).
AMPHASYS AG s TECHNOPARK® Lucerne s Platz 4 s CH-6039 Root D4 s Switzerland s phone +41 41 541 91 20 s [email protected] s www.amphasys.com
20
AmphaSoft SW User Guide
Figure 20: Files and folders generated from reporting function.
3.9
Use of FCS-files in FACS-tools
From each measurement a file in FCS3 format is generated and saved in a special folder in the
workspace (Fig. 20). The files include all information to load and to analyze with a typical Flow
Cytometry Data Analysis Software such as FlowJo (version 7.6.5 ideal, higher versions still with
bugs), Flowing Software, Infinicyte etc.
When loading your data in the tools use all parameters in linear scale. The parameters you can
select for plotting etc. are:
· for each measured frequency
§ X and Y as real and imaginary part of the signal
§ R and P as amplitude and phase of the signal
§ calculated values as opacity from X, Y, R and P
·
transit time (time which a particle needs between both measurement electrodes)
·
time (total measurement time)
AMPHASYS AG s TECHNOPARK® Lucerne s Platz 4 s CH-6039 Root D4 s Switzerland s phone +41 41 541 91 20 s [email protected] s www.amphasys.com
21
AmphaSoft SW User Guide
4 Technical support, updates and warranty
4.1
Software License and dongle
With the purchase of the Ampha Z30 instrument you get an USB-dongle with a license file for using
AmphaSoft. The license ID you can check with the AmphaSoft software in the menu with >Help
>About (Fig. 21). A dongle is a small security device that plugs into your computer. It works like a
mobile serial number for AmphaSoft, which allow running AmphaSoft on several computers but just
one at a time.
Figure 21: AmphaSoft software version, license ID.
If the USB-dongle is not plugged in the computer you will get an error message (Fig. 22). Press
>Esc, plug in the dongle and start the software again.
Figure 22: Error messages without USB-dongle for AmphaSoft license ID.
4.2
Software Installation and Update
4.2.1 AmphaSoft Update
You will be informed per Email, if there is any software update of AmphaSoft available.
To check your AmphaSoft software version, start the software and check in the menu with >Help
>About (Fig. 23).
AMPHASYS AG s TECHNOPARK® Lucerne s Platz 4 s CH-6039 Root D4 s Switzerland s phone +41 41 541 91 20 s [email protected] s www.amphasys.com
22
AmphaSoft SW User Guide
Figure 23: AmphaSoft software version.
During Installation AmphaSoft should be closed and not running in Online or Offline mode. For
installation you should have administrator rights for your laptop or PC.
For updating download the new software version from http://www.amphasys.com/community to the
laptop. Start the AmphaSoft-x.y.z.msi file, follow the instructions and the new software will be
installed at the laptop. After finishing you can use AmphaSoft with the normal icon and check the
software version (Fig. 23).
4.2.2 AmphaSoft Installation
When setting up a new laptop for measurement with Ampha Z30 the following installation process
has to be completed.
AmphaSoft software and associated drivers and installation tools can be downloaded with a user
account from http://www.amphasys.com/community. You should have administrator rights or
account at the laptop you like to install the software.
Create a folder on your desktop or somewhere else. Download the files from the Amphasys
website and save them in the folder (Fig. 24).
Figure 24: Download folder for AmphaSoft software installation.
1. Start installation with file AMD64-all-rootsupd_.... by double click and confirm it, if any
windows for installation or security rights appear.
2. Continue installation with MCRInstaller by double click and confirming. The installation
process needs some time and requests for your input (Fig. 25A-C).
AMPHASYS AG s TECHNOPARK® Lucerne s Platz 4 s CH-6039 Root D4 s Switzerland s phone +41 41 541 91 20 s [email protected] s www.amphasys.com
23
AmphaSoft SW User Guide
A
C
B
Figure 25: Process during MCRInstaller setting up.
3. Start AmphaSoft installation (AmphaSoft-1.2.2.msi) with double click and confirm any
administrator or security rights. When the installation is finished the AmphaSoft shortcut is
created at the desktop (Fig. 26).
Figure 26: AmphaSoft icon on the desktop.
4. Start AmphaSoft by clicking the right mouse button and selecting >Run as administrator
(Fig. 27). When the software starts, a picture is visible during the process (Fig. 28 left). With
advanced process a window pops up for selection of user modus, use >Offline and
>Continue (Fig. 28 right).
AMPHASYS AG s TECHNOPARK® Lucerne s Platz 4 s CH-6039 Root D4 s Switzerland s phone +41 41 541 91 20 s [email protected] s www.amphasys.com
24
AmphaSoft SW User Guide
Figure 27: Start AmphaSoft as administrator
Figure 28: Starting AmphaSoft (left) and selection of Offline mode (right).
5. When the AmphaSoft main GUI is open, select in the menu >Tools >Chip gram your Ampha
Z30 fluidic setup appropriate to your chip sizes (Fig. 29). Check for the AmphaSoft software
version in Menu >Help >About. You will get a pop up Window with details to the software (Fig.
30). Close the program without saving the workspace.
Figure 29: AmphaSoft main GUI - selection of Fluidic Setup and close program
AMPHASYS AG s TECHNOPARK® Lucerne s Platz 4 s CH-6039 Root D4 s Switzerland s phone +41 41 541 91 20 s [email protected] s www.amphasys.com
25
AmphaSoft SW User Guide
Figure 30: Check AmphaSoft software version
6. Connect the instrument with the laptop with the USB-Mini cable and switch on the
instrument – a pop up window at the desktop right at the bottom appears, click on it (Fig. 31
left). You will get the information in an extra window, that the device driver was not installed
(Fig. 31 right). Close the window.
Figure 31: left - AmphaSoft properties – change of Shortcut Target
right – Check AmphaSoft software version
7. Open in the >Start menu of your laptop >Devices and Printers (Fig. 32 left). The Control
Panel window opens and shows to your laptop connected devices. The bottom line
>Unspecified displays an Unknown Device. Open with right mouse button >Properties (Fig.
32 right).
AMPHASYS AG s TECHNOPARK® Lucerne s Platz 4 s CH-6039 Root D4 s Switzerland s phone +41 41 541 91 20 s [email protected] s www.amphasys.com
26
AmphaSoft SW User Guide
Figure 32: left – Start menu – open Devices and Printers
right – Control Panel Devices and Printers – Unspecified Device >Properties
8. The window for Unknown Device Properties appears, select the tab >Hardware and click
on >Properties right at the bottom (Fig. 33).
Figure 33: Unknown Device >Properties, Tab >Hardware
9. A second window pops up, select in the tab >General >Change settings left at the bottom
(Fig 34 left). The window changes, possibly you have to confirm administrator rights, select
then >Update Driver… (Fig. 34 right).
AMPHASYS AG s TECHNOPARK® Lucerne s Platz 4 s CH-6039 Root D4 s Switzerland s phone +41 41 541 91 20 s [email protected] s www.amphasys.com
27
AmphaSoft SW User Guide
Figure 34: left – second window of Unknown Device Properties, use tab >General >Change settings
right – Unknown Device Properties, select >Update Driver…
10. In a further window Update Driver Software – Unknown Device you can select the driver
software with >Browse my computer for driver software (Fig. 35).
Figure 35: Update Driver Software – Unknown Device
11. Select with bottom >Browse the folder C:/AmphaSoft/AmphaZ30Driver (Fig. 36).
Figure 36: Update Driver Software – Unknown Device, Browse for Folder C:/AmphaSoft/AmphaZ30Driver
AMPHASYS AG s TECHNOPARK® Lucerne s Platz 4 s CH-6039 Root D4 s Switzerland s phone +41 41 541 91 20 s [email protected] s www.amphasys.com
28
AmphaSoft SW User Guide
12. The selection should look like Fig. 37, also check >Include subfolders and go to >Next.
Figure 37: Update Driver Software – Unknown Device, driver location
13. A Windows Security message asks for installation, check >Always trust Software from
“Triamec Motion AG” and select >Install (Fig. 38).
Figure 38: Windows Security message and installation of driver
14. After finishing installation process close the window Update Driver Software – Ampha Z30
(Fig. 39 left). Check if in the Control Panel window the Unspecified device is identified as
Ampha Z30 (Fig. 39 right).
AMPHASYS AG s TECHNOPARK® Lucerne s Platz 4 s CH-6039 Root D4 s Switzerland s phone +41 41 541 91 20 s [email protected] s www.amphasys.com
29
AmphaSoft SW User Guide
Figure 39: left – window Update Driver Software – Ampha Z30, close the window
right – Control Panel window, device identification Ampha Z30
15. Start AmphaSoft in Online modus (Fig. 40 left) and select in the menu >Help >About.
Figure 40: left – AmphaSoft Online modus
right – menu >Help >About, recognition of instrument by showing a firmware version
4.3
Firmware Update
You will be informed per Email, if there is any firmware update of the Ampha Z30 instrument
necessary.
You can check the firmware version in the AmphaSoft software in the menu with >Help >About
(Fig. 41). The information you get in a pop up window:
Figure 41: Check for the firmware version of Ampha Z30.
AMPHASYS AG s TECHNOPARK® Lucerne s Platz 4 s CH-6039 Root D4 s Switzerland s phone +41 41 541 91 20 s [email protected] s www.amphasys.com
30
AmphaSoft SW User Guide
To update the firmware, start the laptop and switch on the Ampha Z30. You have to start
AmphaSoft in service mode. To do this, click with right mouse button on the AmphaSoft logo on
your desktop. Select >Properties and >Shortcut (Fig. 42). Add in the field >Target at the end /G:S,
the complete line should be:
C:\AmphaSoft\CellRecorderStarter.exe "C:\AmphaSoft\CellRecorder.exe" AmphaSoft /G:S
Confirm with >Apply and >OK (could be that there pops up a window with administrator rights –
confirm that, too).
Figure 42: AmphaSoft >Properties, Target line with Service Mode
Start now AmphaSoft in Online modus. Go to Menu –> Help –> About and press the Update…
button as shown in the figure 43.
Figure 43: Start Update of Ampha Z30 firmware
On the file section dialog specify either to show .bin or .bit files using the File name drop-down
menu and switch to the directory that contains the AmphaZ30 firmware file you downloaded from
Amphasys (Fig. 44). Select the firmware file and press the Open button.
AMPHASYS AG s TECHNOPARK® Lucerne s Platz 4 s CH-6039 Root D4 s Switzerland s phone +41 41 541 91 20 s [email protected] s www.amphasys.com
31
AmphaSoft SW User Guide
Figure 44: File of Ampha Z30 firmware
Do not turn off the instrument until the software prompts you that the firmware update process has
completed successfully (Fig. 45).
Figure 45: Update of Ampha Z30 firmware
Now close the AmphaSoft program and hit the On/Off switch at the back of the instrument. Wait a
few seconds and switch the instrument back on. Remove the /G:S switch from the AmphaSoft
shortcut properties window (Fig. 46 left) and start the AmphaSoft program by double-clicking on
the shortcut. Go to Help -> About. You should now see the new firmware version number (Fig. 46
right).
Figure 46: left - AmphaSoft properties – change of Shortcut Target to normal user modus
right – Check Ampha Z30 firmware version
AMPHASYS AG s TECHNOPARK® Lucerne s Platz 4 s CH-6039 Root D4 s Switzerland s phone +41 41 541 91 20 s [email protected] s www.amphasys.com
32
AmphaSoft SW User Guide
4.4 Limited Warranty
Limited warranty period is one (1) year from first operation of the Product by Buyer. It covers
software and firmware, and defects in material and workmanship under normal use and does not
apply to ordinary wear and tear. For detailed information, refer to the warranty information at
www.amphasys.com.
4.5 Extended Warranty
Extended warranties are available. Visit www.amphasys.com for information.
4.6 Support
For technical or software support, contact:
Amphasys AG
Technopark Lucerne
Platz 4
CH-6039 Root D4, Switzerland
Phone: +41 41 541 91 20
Email: [email protected]
AMPHASYS AG s TECHNOPARK® Lucerne s Platz 4 s CH-6039 Root D4 s Switzerland s phone +41 41 541 91 20 s [email protected] s www.amphasys.com
33
AmphaSoft SW User Guide
Index
AmphaSoft Installation ...................................23
AmphaSoft Main GUI ....................................... 4
Actions ........................................................ 5, 7
Bottom line ..................................................... 7
Plot ................................................................ 7
Results........................................................ 4, 7
Settings.......................................................... 4
AmphaSoft Update..........................................22
Buffer Id ......................................................... 6, 9
Chip Id ........................................................... 6, 9
Chip quality .....................................................17
Chip Test .........................................................17
Cont. check box ..............................................10
Data file structure ...........................................11
Done check box ..............................................10
Expert window ................................................12
Actions ..........................................................13
Amplifier........................................................15
Chip Detection ..............................................16
Chip Test ......................................................16
Control ..........................................................13
Default settings .............................................14
Demodulation................................................15
Gain ..............................................................15
Level .............................................................13
Load .............................................................14
Log ...............................................................16
Modulation ....................................................15
Pump ............................................................13
Rinse ............................................................14
Signal ...........................................................12
Signal overflow............................................. 15
Time frame................................................... 13
FCS3 .......................................................... 11, 21
Firmware Update ............................................ 30
Flush ............................................................7, 10
Frequencies...................................................6, 9
License ........................................................3, 22
Notes for measurement ................................. 10
Offline Modus ................................................... 3
Online Modus ................................................... 3
Parameters for measurement .....................9, 10
Planing and adding experiments..................... 7
Plot ..............................................................7, 18
Gating .......................................................... 18
Line gating ................................................... 19
Polygon gating ............................................. 19
Zoom ........................................................... 18
Pump speed ..................................................... 9
Report .................................................... 8, 11, 20
Excel ............................................................ 20
Htm .............................................................. 20
Rinsing process ............................................... 5
Sample Id.......................................................... 5
Sample Name ................................................... 9
Stop criteria for measurement......................7, 9
Template ......................................................5, 11
Tubing set ........................................................ 5
USB-dongle .................................................3, 22
Work list ........................................................7, 9
Workspace........................................................ 8
AMPHASYS AG s TECHNOPARK® Lucerne s Platz 4 s CH-6039 Root D4 s Switzerland s phone +41 41 541 91 20 s [email protected] s www.amphasys.com
34