1
A SERVICE ORIENTED CROP PROFITABILITY SIMULATOR [CPS]
REALIZING WITH WEB SERVICES
by
REZA NABI
Bachelor of Engineering, Department of Computer Science and Engineering,
Zhejiang University, Hangzhou, PR China 1996
A THESIS
submitted in partial fulfillment of the requirements for the degree
MASTER OF SOFTWARE ENGINEERING
Department of Computing and Information Sciences
College of Engineering
KANSAS STATE UNIVERSITY
Manhattan, Kansas
2010
Approved by:
Major Professor
Dr. Daniel Andresen
Abstract
The Service Oriented Architecture (SOA), a bleeding-edge architectural paradigm,
facilitates software development by providing modular design, scalability, robustness, loosely
coupled application integration, and software reuse. With the XML, SOAP, WSDL, and UDDI
open standards, the Service Oriented Architecture (SOA) allows interoperability between widely
disparate applications running on different platforms and implemented in different languages.
The Department of Agriculture has a legacy Crop Profitability Simulator (CPS) which is
an Excel spreadsheet that allows farmers in Kansas and surrounding states to assess market risks
by viewing income, cost, and profit, based on the Kansas Farm Management guides. Due to the
limitations of Excel, the CPS software has various shortcomings with regards to robustness,
scalability, interoperability, usability, and reuse.
This thesis examines the shortcomings of the legacy system and improves upon the CPS
Software to build an architectural infrastructure by using SOA realizing with de-facto standard
web services. To demonstrate the benefits of SOA, we developed two CPS Clients (CPS Web
application and CPS iPhone application), implemented in different languages and deployed on
different platforms. The CPS Web application developed using C# language on Microsoft’s
.NET platform deployed on Windows and the CPS iPhone application developed using ObjectivC language on Apple’s Coacoa platform running the iPhone OS. Both CPS clients communicate
with a central relational database, MS SQL Server 2008 via web services, using the same server
components (Business Logic Layer Component and Data Access Layer Component) to ensure
the highest level of modularity, maintainability, and software reuse.
Table of Contents
List of Figures ................................................................................................................................ xi
List of Tables ................................................................................................................................ xii
Acknowledgements ...................................................................................................................... xiv
CAHPTER 1 - VISION DOCUMENT …………………………………………………………...1
1 Introduction …………………………………………………………………………………….1
1.1 Motivation …………………………………………………………………………………1
1.2 Terms and Definitions …………………………………………………………………......2
1.3 Crop Profitability Simulator (CPS) ……………………………………………………......2
2 Project Overview .……………………………………………………………………...............3
2.1 Product Perspective ………………………………………………………………………..3
2.2 Project Goal …………………………………………………………………………….....4
2.3 Operating Environment …………………………………………………………………...5
2.4 Design and Implementation Constraint …………………………………………………...5
2.5 User Documentation ...………………………………………………………………….....5
3 Project Requirement ……………………………………………………………………………6
3.1 Features of CPS Web Application ..…………………………………………………….....6
3.1.1 Home (Main Home Page) .....………………………………………………………...6
3.1.2 FAQ ...……...………………………………………………………………………...6
3.1.3 Contact Us ….………………………………………………………………………...6
3.1.4 About CPS …….……………………………………………………………………..7
3.1.5 Simulator….…………………………………………………………………………..7
3.1.5.1 Plan ..…………………………………………………………………………...7
3.1.5.2 Crops .....…………………………………………………………………….....7
3.1.5.3 Summary ..………………………………………………………………….....7
3.1.5.4 Expected Variation ...……………………………………………………….....7
3.1.5.5 Summary Details .………………………………………………………….. ..7
3.1.5.6 User Interface .. .…………………………………………………………….....8
3.2 Features of CPS iPhone Application …..…...………………………………………………..8
iii
3.2.1 Simulator…...…………………………………………………………………………...8
3.2.1.1 Plan ...………………………………………………………………………….....8
3.2.1.2 Crops ……………………………………………………………………………..8
3.2.1.3 Expected Variation ……………………………………………………………….8
3.2.1.4 Summary . ………………………………………………………………………...8
3.2.1.5 User Interface .…………………………………………………………………...8
4 Non-Functional Requirements……..…………………………………………………………...9
4.1 Performance Requirement .....…………………………………………………………...9
4.2 Safety Requirement .……………..,……………………………………………………..9
4.3 Security Requirement ..…………………………………………………………………....9
4.4 Software Quality Attribute………………………………………………………………...9
5 Other Requirements …………………………………………………………………………...9
CHAPTER 2 – PROJECT PLAN………………………………………………………………..10
1 Overview .……………………………………………………………………………………..10
2 Task Breakdown……….…….………………………………………………………………..10
2.1 Inception Phase….………………………………………………………………………..10
2.1.1 Vision Document .…………………………………………………………………10
2.1.2 Project Plan.………………………………………………………………………...10
2.1.3 Software Quality Assurance Plan ………………………………………………….11
2.1.4 Simple Prototype……………………………………………………………………11
2.2 Elaboration Phase………..………………………………………………………………..11
2.2.1 Architectural Design Document .…………………………………………………11
2.2.2 Revision of Project Plan and Vision Document ....……………………………...11
2.2.3 Formal Specification …………………………………………………………… 11
2.2.4
Test Plan 1.0
……………………………………………………………………..12
2.2.5 Architecture Inspection …………………………………………………………..12
2.2.6
Demo the Prototype ……………………………………………………………...12
2.3 Production Phase ………………………………………………………………………...12
2.3.1 Project Coding and Testing………………………………………………………….12
2.3.2 Project Documentation………………………………………………………………12
2.3.3 Demo the CPS Software, the release candidate……………………………………..13
iv
3 Cost Estimate………………………………………………………………………………….13
3.1 COCOMO………………………………………………………………………………...13
4 Sprint Planning ……………………………………………………………………………….16
4.1 Phase One (Inception) Sprint Plan………………………………………………………..16
4.2 Phase Two (Elaboration) Sprint Plan……………………………………………………..17
4.3 Phase Three (Production) Sprint Plan…………………………………………………….17
CHAPTER 3 - ARCHITECTURE DESIGN…………………………………………………….18
1 Overview………………………………………………………………………………………18
1.1 Purpose……………………………………………………………………………………18
1.2 Terms and Definitions…………………………………………………………………….18
1.3 Scope……………………………………………………………………………………...18
2 Architecture of the System…………………………………………………………………….19
2.1 Component View ………………………………………………………………………...19
2.1.1 CPS Web Client Component...……………………………………………………...20
2.1.2 CPS iPhone Client Component……………………………………………………...21
2.1.3 CPS Web Service Component………………………………………………………22
2.1.4 Business Logic Layer (BLL) Component…………………………………………...23
2.1.5 Data Access Layer (DAL) Component……………………………………………...24
2.1.6 CPS Database Component…………………………………………………………..26
2.2 Deployment View….……………………………………………………………………..27
2.3 InteractionView…….……………………………………………………………………..28
2.3.1 Sequence Diagram of View Summary UseCase…………………………………….28
2.3.2 Sequence Diagram of SelectRegion UseCase...……………………………………..29
2.4 State Machine View………………………………………………………………………30
2.4.1 State Machine Diagram of Loading CPS Application………………………………30
2.4.2 State Machine Diagram of View Summary…………………………………………31
3 Formal Specification of the System……………………………………………………………32
3.1 UML Class Diagram with Role Name……………………………………………………32
3.2 USE Model………………………………………………………………………………..33
3.3 Transcripts – Outcome of CMD Script to hold/violate invariants………………………..40
CHAPTER 4 - INSPECTION LIST…...………………………………………………………...46
v
1 Introduction…………….……………………………………………………………………...46
2 Items to be inspected…………………………………………………………………………..46
2.1 UML Diagrams…………………………………………………………………………...46
2.2 Formal Specifications ……………………………………………………………………46
3 Formal Inspectors……………………………………………………………………………...46
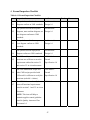
4 Formal Inspection Checklist………………………………………………………………......47
CAHPTER 5 - COMPONENT DESIGN…...…………………………………………………...48
1 Introduction …………………………………………………………………………………...48
2 Web Service Component (WSC) ……………………………………………………………...48
2.1 CPSServices Class ……………………………………………………………………….48
2.1.1 Description…………………………………………………………………………..48
2.1.2 Attributes ……………………………………………………………………………48
2.1.3 Operation Specification …………………………………………………………….49
3 Business Logic Layer Component (BLLC) …………………………………………………...51
3.1 PlanSummary Class ……………………………………………………………………...51
3.1.1 Description ………………………………………………………………………….51
3.1.2 Attributes ……………………………………………………………………………52
3.1.3 Operation Specification …………………………………………………………….52
3.2 CPSAnalysis Class ……………………………………………………………………….53
3.2.1 Description ………………………………………………………………………….53
3.3.2 Attributes ……………………………………………………………………………53
3.2.3 Operation Specification …………………………………………………………….53
4 Data Access Layer Component (DALC)……………………………………………………...54
4.1 Region Class……………………………………………………………………………...55
4.1.1 Description ………………………………………………………………………….55
4.1.2 Attributes ……………………………………………………………………………55
4.1.3 Operation Specification …………………………………………………………….55
4.2 LandType Class…………………………………………………………………………..56
4.2.1 Description ………………………………………………………………………….56
4.2.2 Attributes ……………………………………………………………………………56
4.2.3 Operation Specification …………………………………………………………….56
vi
4.3 CropDesc Class…………………………………………………………………………...57
4.3.1 Description ………………………………………………………………………….57
4.3.2 Attributes ……………………………………………………………………………57
4.3.3 Operation Specification …………………………………………………………….57
4.4 Crop Class………………………………………………………………………………...58
4.4.1 Description ………………………………………………………………………….58
4.4.2 Attributes ……………………………………………………………………………58
4.4.3 Operation Specification …………………………………………………………….59
4.5 Income Class……………………………………………………………………………...59
4.5.1 Description ………………………………………………………………………….59
4.5.2 Attributes ……………………………………………………………………………59
4.5.3 Operation Specification …………………………………………………………….60
4.6 Cost Class………………………………………………………………………………...61
4.6.1 Description ………………………………………………………………………….61
4.6.2 Attributes ……………………………………………………………………………61
4.6.3 Operation Specification …………………………………………………………….62
4.7 CropType Class…………………………………………………………………………...63
4.7.1 Description ………………………………………………………………………….63
4.7.2 Attributes ……………………………………………………………………………63
4.7.3 Operation Specification …………………………………………………………….64
CHAPTER 6 - SOFTWARE QUALITY ASSURANCE PLAN………………………………..66
1 Purpose ………………………………………………………………………………………..66
2 Management …………………………………………………………………………………..66
2.1 Organization………………………………………………………………………………66
2.2 Tasks……………………………………………………………………………………...66
2.3 Responsibilities…………………………………………………………………………...66
2.3.1 Developer……………………………………………………………………………66
2.3.2 Major Professor……………………………………………………………………...65
2.3.3 Supervisory Committee……………………………………………………………..67
2.3.4 Formal Technical Inspector…………………………………………………………67
3 Documentation...………………………………………………………………………………67
vii
3.1 Purpose …………………………………………………………………………………...67
3.2 Minimum Documentation Requirement…………………………………………….........67
4 Standards, Practices, Convention and Metrics………………………………………………...68
5 Reviews and Audits…………………………………………………………………………...68
6 Testing………………………………………………………………………………………...68
7 Problem Reporting and Corrective Actions ………………………………………………….68
8 Tools, Techniques and Methodologies ……………………………………………………….68
9 Code Control…………………………………………………………………………………..69
10 Media Control………………………………………………………………………………..69
11 Record Collection, Maintenance and Retention …………………………………………….69
12 Training ……………………………………………………………………………………...69
13 Risk Management …………………………………………………………………………...70
CHAPTER 7 - TEST PLAN……………………………..............................................................71
1 Introduction …………………………………………………………………………………...71
2 Test Items ……………………………………………………………………………………..71
3 Tested Features ……………………………………………………………………………….71
4 Features Not To Be Tested …………………………………………………………………...71
5 Approach ……………………………………………………………………………………..71
6 Item Pass/Fail Criteria ………………………………………………………………………..71
7 Suspension Criteria and Resumption Requirement ………………………………………….72
7.1 Suspension Criteria ………………………………………………………………………72
7.2 Resumption Requirement ………………………………………………………………..72
8 Test Deliverables ……………………………………………………………………………..72
9 Testing Tasks …………………………………………………………………………………72
9.1 CPS Web Application Testing Tasks ……………………………………………………72
9.2 CPS iPhone Application Testing Tasks ………………………………………………….76
10 Environmental Needs ………………………………………………………………………..78
10.1 Environmental needs of CPS Web Application ………………………………………...78
10.2 Environmental Need of CPS iPhone Application ………………………………………78
CHAPTER 8 – ASSESSMENT EVALUATION ......................................................................... 79
1 Introduction …………………………………………………………………………………...79
viii
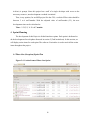
2 Test Results Summary ………………………………………………………………………..79
3 Detailed Test Results …………………………………………………………………………79
3.1 Test Results of CPS Web Application …………………………………………………...79
3.2 Test Results of CPS iPhone Application ………………………………………………...84
4 Performance Testing ………………………………………………………………………….87
4.1 Response Time Comparison of Web Services …………………………………………...87
4.2 Response Time Comparison of Major Web Pages ………………………………………88
4.3 Comparison of Response Time of 1000 users with different ramp-ups …………………90
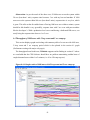
4.4 Throughput of 1000 users with 5 loop count and 5 sec ramp-up ………………………..91
5 Unit Testing …………………………………………………………………………………..92
CHAPTER 9 - USER MANUAL……………………………………………………………….94
1 Introduction …………………………………………………………………………………..94
2 Software Installation ………………………………………………………………………….95
2.1 Required Hardware ………………………………………………………………………95
2.2 Required Software………………………………………………………………………..95
2.2.1 Required Software CPS Web App………………………………………………….95
2.2.2 Required Software CPS iPhone App ………………………………………………95
2.3 Install CPS Software and Setup …………………………………………………………96
2.3.1 Load Database ……………………………………………………………………..96
2.3.2 Install CPS Web Application ………………………………………………………99
2.3.3 Install CPS Web Service ………………………………………………………….102
2.3.4 Install CPS iPhone Client …………………………………………………………105
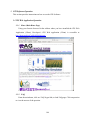
3 CPS Software Operation …………………………………………………………………….106
3.1 CPS Web Application Operation………………………………………………………..106
3.1.1 Home (Main Home Page) …………………………………………………………106
3.1.2 FAQ ……………………………………………………………………………….106
3.1.3 Contact Us …………………………………………………………………………107
3.1.4 About CPS…………………………………………………………………………108
3.1.5 Simulator …………………………………………………………………………..108
3.1.5.1 Configure a Plan ……………………………………………………………..109
3.1.5.2 View Summary ………………………………………………………………110
ix
3.1.5.3 Expected Variation …………………………………………………………..110
3.1.5.4 Comparing Multiple Plans …………………………………………………...111
3.1.5.5 Summary Details and Print …………………………………………………..113
3.2 CPS iPhone Application Operation …………………………………………………….114
3.2.1 Simulator …………………………………………………………………………..114
3.2.1.1 Configure a Plan ……………………………………………………………..116
3.2.1.2 Configure Crops, Crop System and Land Type ……………………………...116
3.2.1.3 Expected Variation …………………………………………………………...118
3.2.1.4 Plan Comparison and Summary ……………………………………………...118
4 Frequently Asked Questions (FAQ) and Troubleshooting ………………………………….120
4.1 CPS iPhone Application FAQ ………………………………………………………….120
4.2 CPS Web Application FAQ …………………………………………………………….122
CHAPTER 10 - PROJECT EVALUATION…………………………………………………...123
1 Introduction ………………………………………………………………………………….123
2 Problems Encountered……………………………………………………………………….123
2.1 Learning Objective-C, Coacoa, XCode & the world of iPhone Development………….123
2.2 Apple’s UIViewPicker, an alternate solution of Combobox, Not Usable………………123
2.3 Hiccup to performance testing using WebService (SOAP) sampler …………………...123
2.4 USE Model and OCL ...…………………………………………………………………123
3 Source Lines of Code (SLOC)……………………………………………………………….124
3.1 SLOC of CPS Web App ………………………………………………………………..124
3.2 SLOC of CPS iPhone App ……………………………………………………………...125
4 Project Duration & Burndown ………………………………………………………………125
5 Lessons Learnt and Comments ……………………………………………………………...127
6 Conclusion & Future Work ………………………………………………………………….127
References………………………………………………………………………………………128
Appendix A – Formal Inspection Letter of Suresh Pothuri.……………………………………130
Appendix B – Formal Inspection Letter of Amit Borcar….……………………………………132
x
List of Figures
Figure 1.1.1 CPS Legacy app provides default income and cost value………………………..... 3
Figure 2.4.1 Action Items of Phase One Sprint ………………………………………………... 16
Figure 2.4.2 Action Items of Phase Two Sprint ………………………………………………... 17
Figure 2.4.3 Action Items of Phase Three Sprint ………………………………………………. 17
Figure 3.1.1 Critical Use Case Diagram of CPS software ……………………………………... 19
Figure 3.2.1 Component Diagram of CPS Software …………………………………………… 20
Figure 3.2.2 Class diagram of CPS Web Service Component………………………………….. 23
Figure 3.2.3 Class diagram of BLL Component………………………………………………... 24
Figure 3.2.4 Class diagram of DAL Component……………………………………………….. 25
Figure 3.2.5 CPS Database Schema…………………………………………………………….. 26
Figure 3.2.6 Deployment Diagram of CPS Software…………………………………………... 27
Figure 3.2.7 Sequence diagram of CPS Web App……………………………………………… 29
Figure 3.2.8 Sequence diagram of CPS iPhone App…………………………………………… 30
Figure 3.2.9 State Machine Diagram of Loading CPS Application……………………………. 31
Figure 3.2.10 State Machine Diagram of View Summary……………………………………… 32
Figure 3.3.1 UML Class Diagram with Role Name for Formal Specification…………………. 33
Figure 5.2.1 Class Diagram of Web Service Component………………………………………. 49
Figure 5.3.1 Class diagram of Business Logic Layer Component……………………………... 52
Figure 5.4.1 – Class diagram of Data Access Layer Component………………………………. 55
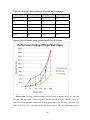
Figure 8.4.1 Performance testing graph of Major web services………………………………... 80
Figure 8.4.2 Performance testing graph of Major CPS Web Pages…………………………….. 81
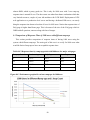
Figure 8.4.3 Performance graph with various ramp-ups for 1000 user………………………… 83
Figure 9.1.1 CPS Software Highlights………………………………………………………….. 86
Figure 10.3.1 SLOC Distribution CPS Web App………………………………………………125
Figure 10.3.2 SLOC Distribution CPS iPhone App……………………………………………126
xi
List of Tables
Table 2.3.1 COCOMO EAF Parameters ………………………………………………………. 14
Table 2.3.2 Adjusted EAF Values applied to CPS Project..……………………………………. 14
Table 3.2.1 List of View and Controller of CPS Web App ……………………………………. 21
Table 3.2.2 List of View and Controller of CPS iPhone App Component……………………... 22
Table 3.2.3 Helper Classes used in CPS iPhone App Component……………………………... 22
Table 3.2.4 Classes of BLL Component………………………………………………………... 24
Table 3.2.5 Classes of DAL Component……………………………………………………….. 26
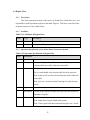
Table 4.4.1 Formal Inspection Checklist……………………………………………………….. 48
Table 5.2.1 Operation specification of CPSServices Class…………………………………….. 50
Table 5.3.1 Attributes of PlanSummary Class………………………………………………….. 53
Table 5.3.2 Operation specification of PlanSummary Class…………………………………… 53
Table 5.3.3 Attributes of CPSAnalysis Class…………………………………………………... 54
Table 5.3.4 Operation specification of CPSAnalysis Class…………………………………….. 54
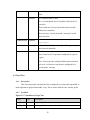
Table 5.4.1 Attributes of Region Class…………………………………………………………. 56
Table 5.4.2 Operation specification of Region Class…………………………………………... 56
Table 5.4.3 Attributes of LandType Class……………………………………………………… 57
Table 5.4.4 Operation specification of LandType Class……………………………………….. 57
Table 5.4.5 Attributes of CropDesc Class ……………………………………………………... 58
Table 5.4.6 Operation specification of CropDesc Class………………………………………... 58
Table 5.4.7 Attributes of Income Class………………………………………………………… 60
Table 5.4.8 Operation specification of Income Class…………………………………………... 60
Table 5.4.9 Attributes of Cost Class……………………………………………………………. 62
Table 5.4.10 Operation specification of Cost Class…………………………………………….. 63
Table 5.4.11 Attributes of YieldLevel Class …………………………………………………... 64
Table 5.4.12 Operation specification of YieldLevel Class……………………………………... 64
Table 6.3.1 List of documentation required for each phase…………………………………….. 65
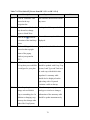
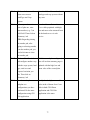
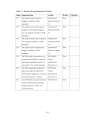
Table 7.9.1 Test Suite #1 [SR 3.1.1 Home]…………………………………………………….. 65
Table 7.9.2 Test Suite #2 [SR 3.1.2 FAQ] ………………………………………………………65
Table 7.9.3 Test Suite #3 [SR 3.1.3 Contact US] ……………………………………………….66
xii
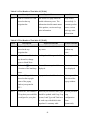
Table 7.9.4 Test Suite #4 [SR 3.1.3 About CPS]……………………………………………….. 66
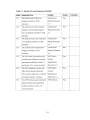
Table 7.9.5 Test Suite #5 [Covers from SR 3.1.5.1 to 3.1.5.4]…………………………………. 66
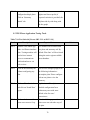
Table 7.9.6 Test Suite #6 [Covers SR 3.2.1.1 to SR 3.2.1.4]…………………………………... 68
Table 8.2.1 Test results summary………………………………………………………………. 71
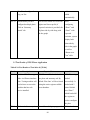
Table 8.3.1 Test Results of Test Suite #1 [TS-01]……………………………………………… 71
Table 8.3.2 Test Results of Test Suite #2 [TS-02]……………………………………………… 72
Table 8.3.3 Test Results of Test Suite #3 [TS-03]……………………………………………… 72
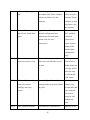
Table 8.3.4 Test Results of Test Suite #4 [TS-04]……………………………………………… 73
Table 8.3.5 Test Results of Test Suite #5 [TS-05]……………………………………………… 73
Table 8.3.6 Test Results of Test Suite #6 [TS-06]……………………………………………… 76
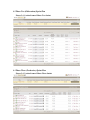
Table 8.4.1 Response times by number of user for major web services………………………... 79
Table 8.4.2 Response times by number of user for major pages……………………………….. 81
Table 8.4.3 Response times by ramp-up period with 1000 user for major web pages…………. 82
Table 10.3.1 SLOC CPS Web App……………………………………………………………..125
Table 10.3.2 SLOC CPS iPhone App…………………………………………………………..126
xiii
Acknowledgements
Before I express my special thanks and gratitude to individuals, I bear witness that all
praise is due to my Lord, who created me and to Him I shall return, for His countless blessings
and mercy upon me and my family.
I am heartily thankful to Dr. Daniel Andresen, as my Major Professor, and Dr. Hikaru
Peterson, as my committee member, for giving me a chance to work on this wonderful project,
building service oriented software realizing with web services. Without their guidance,
encouragement, and support from inception, I could not have finished this project. I am also
grateful to Dr. Neilsen, for feedback during the life-cycle of the project and kindly agreeing to be
on my committee.
My deepest gratitude goes to my family for their love and support; I could not have come
this far without them. Looking back on the last 6 years, I know I have spent many weekends
researching without spending quality time with my beautiful wife, Roxy, my daughter Samah,
and my son Tahsin. Indeed, they are so patient and supportive of me. I would like to extend my
special thanks to my 9-year old daughter Samah, and 6 year old Son Tahsin, for helping Daddy
create the Table of Contents. I am eternally grateful to Ammu, Daddy, and Mommy, for their
love, support, and constant prayers for me.
I would like to thank my manager Alan Uhl for being kind, supportive, and approving
vacations on very short notice to work on my thesis. I am truly indebted to Rosanne Haines, Sage
HR Manager, for serving as my Proctor for the past 6 years. I would like to extend my deepest
regard and appreciation to Amit Borcar and Suresh Pothuri for being my formal technical
inspectors, and spending their valuable time on this project. I would also like to thank Sophia
Lyimo and Elizabeth Dobelstein, QA Analysts, for their best wishes and willingness to test my
work.
Lastly, I offer my thanks to all of my friends for being supportive and letting me study, or
work on this project, during various social gatherings.
xiv
CHAPTER 1 - VISION DOCUMENT
1 Introduction
Kansas State University currently uses a legacy product that enables farmers in Kansas and
surrounding states to assess market risks based on the Kansas Farm Management guides. The
current product does not allow the user to compare multiple plans simultaneously, view a profit
summary, or take in to account variations in yield, price, and cost. This project addresses the
shortcomings of the legacy application and builds an architectural infrastructure suitable for
expandability by using Service Oriented Architecture (SOA) realizing with de-facto standard
web services.
1.1 Motivation
Department of Agriculture has a legacy Crop Profitability Simulator (CPS) which is an
Excel spreadsheet that allows farmers in Kansas and surrounding states to assess market risks
by viewing income, cost, and profit, based on the Kansas Farm Management guides. The
major shortcomings of the legacy system include:
•
It provides default Cost and Income values along with breakdown based on Kansas
Management Guides but it does not provide a profit summary.
•
It does not facilitate comparing multiple plans simultaneously. Since farmers need to
assess market risks, it would be useful to provide a view of multiple plans side-byside, and display high-end, low-end, and average profit summaries.
•
It does not take in account variation in entities such as yield, price, and cost.
•
Due to the limitations of Excel, the application has various shortcomings with regards
to robustness, scalability, interoperability, usability, reuse, and the power of a
relational database.
The motivation of this project is not only to address the shortcomings of the legacy
application but to build an architectural infrastructure suitable for decades to come by using
Service Oriented Architecture (SOA) realizing with de-facto standard web services.
1
The SOA, a bleeding-edge architectural paradigm, facilitates software development by
providing modular design, scalability, robustness, loosely coupled application integration,
and software reuse. With the open standards like XML, SOAP, WSDL and UDDI, the
Service Oriented Architecture (SOA) allows interoperability between widely disparate
applications running on different platforms and implemented in different languages.
To demonstrate the benefits of SOA, we developed two CPS Clients (CPS Web
application and CPS iPhone application), implemented in different languages and deployed
on different platforms. The CPS Web application was developed using C# language on
Microsoft’s .NET platform and deployed on Windows, and the CPS iPhone application was
developed using Objective-C language on Apple’s Coacoa platform running on the iPhone
OS. Both CPS clients communicate with a central relational database, MS SQL Server 2008,
via web services using same server components (Business Logic Layer Component and Data
Access Layer Component) to ensure the highest level of modularity, maintainability, and
software reuse.
1.2 Terms and Definitions
•
Plan – Combination of picking i) a crop (e.g. corn, wheat), ii) crop system (e.g. organic,
conventional), iii), land type (e.g. dry, irrigated), and iv) area of total land in acreage \
•
Expected Variation – The quantity in percent, cost and income value may vary. This
gives high-end and low-end profitability in addition to the average.
•
Return Over Cost – This is same as profit. It is measured as per acre.
•
CPS – Crop Profitability Simulator, the product we are building to help farmers assess
market risks for multiple plans by comparing profitability side by side.
•
SOA – Service Oriented Architecture, an architectural paradigm used to promote
modular design, scalability, robustness, loosely coupled application integration,
interoperation, and software reuse.
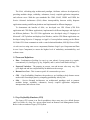
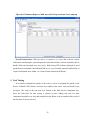
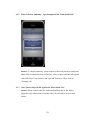
1.3 Crop Profitability Simulator (CPS)
The legacy CPS system is an Excel spreadsheet where users may view default Income
and Cost values of a crop for a given region based on Kansas Farm Management Guides.
Below is the screenshot of legacy CPS System.
2
Figure 1.1.1 CPS Legacy app provides default income and cost value
2 Project Overview
The proposed software, The Whole Farm CPS, allows farmers in Kansas and surrounding
states to assess market risks for multiple farming plans, including conventional and organic
farming methods. The goal of this project is to improve upon the legacy system and implement
new features to facilitate scalability, robustness, integration, and improved usability. The Whole
3
Farm CPS shall be accessible on two operating environments; a website accessible through
common web browsers as well as an application accessible from an iPhone or iPod Touch.
2.1 Product Perspective
The proposed software, The Whole Farm CPS, allows farmers in Kansas and surrounding
states to assess market risks for multiple farming plans, including conventional and organic
farming methods.
In addition to the default values based on Kansas Farm Management Guides, the
Simulator enables the user to customize calculations to individual situations in terms of
specific revenue and cost items and possible variability in price, yield, and cost. The whole
farm profitability for multiple plans will be summarized in a graph for easy comparison.
Detailed feature is available in section 3 of Chapter 1 (Vision Document).
2.2 Project Goal
In addition to addressing the shortcomings of legacy system stated in section 1.1 of
Chapter 1, the proposed software, CPS, will be built on top of Service Oriented Architecture
(SOA) realizing with Web Services
The SOA facilitates software development by providing modular design, scalability,
robustness, loosely coupled application integration, and software reuse. With open standards
like XML, SOAP, WSDL and UDDI, the Service Oriented Architecture (SOA) allows
interoperability between widely disparate applications running on different platforms and
implemented in different languages.
To demonstrate the benefits of SOA, we will develop two CPS Clients (CPS Web
application and CPS iPhone application), implemented in different languages and deployed
in different platforms. The CPS Web application was developed using C# language on
Microsoft’s .NET platform deployed on Windows and the CPS iPhone application was
developed using Objective-C language on Apple’s Coacoa platform running on the iPhone
OS. Both CPS clients communicate with a central relational database, MS SQL Server 2008,
via web services using the same server components (Business Logic Layer Component and
4
Data Access Layer Component) to ensure highest level of modularity, maintainability, and
software reuse.
CPS Web Application. A fully functional web application will be developed to allow
farmers to calculate return over costs based on their personalized data, such as expenses and
income. The web application will be accessible live at http://home.nabi.us/CpsWeb/. The
detailed requirements of the web application are available in section 3.1 of Chapter 1.
CPS iPhone Applicaton. The Crop Profit Simulator with at least 2 plans (so that they
can be compared by user) will be developed to run on the iPhone and the iPodTouch. The
light-weidght CPS iPhone application will assist us to demonstrate benefits of SOA having
two disparate systems using the same server components. The detailed requirements of the
iPhone application are available in section 3.2 of Chapter 1.
2.3 Operating Environment
There are two major operating environments required for the product, CPS.
•
The web services and web application will be deployed on Windows 2008 server
running .NET framework 3.5 or higher. IIS will be used on the http server. MS SQL
Server 2008 will be used for the back-end database. The website can be viewed
through common Internet browsers.
•
The iPhone CPS application will be running on IPod Touch (or iPhone) OS 3.0 or
higher. An internet connection will be required to run the CPS application as the
client will be communicating with backend server via web services.
2.4 Design and Implementation Constraint
The AJAX-enabled web application will be built using the Microsoft .NET framework
and C# (C Sharp) will be used to develop the product. The iPhone application, will be built
using Cocoa framework, and Objective-C will be used to develop the product. Both web and
iPhone application will be built on SOA and both clients will communicate with the same
server components via web services. The SOA will facilitate a modular design, scalability,
robustness, loosely coupled application integration and interoperation, and software reuse.
2.5 User Documentation
5
A user manual will be provided for both the CPS web application and the iPhone
application. The user may contact the developer of this product or Dr. Andresen regarding
any ambiguity in the documentation.
3 Project Requirement
The Whole Farm CPS product will have the following features (requirements) stated in
section 3.1 (Web application) and section 3.2 (iPhone application).
3.1 Features of CPS Web Application
3.1.1
Home (Main Home Page)
The product will have a hyper link called ‘Home’ which will be displayed when the
user accesses the CPS application URL at http://home.nabi.us/CpsWeb/. Content of the
main home page includes short description of the Whole Farm CPS product, how to
access the simulator, frequently asked questions, and hyperlinks to major sponsors of this
project.
3.1.2
FAQ
The product will have a hyperlink for frequently asked questions, 'FAQ', with
answers and screenshots where applicable. The information in the FAQ section will help
users understand the product, its uses, and troubleshoot issues without contacting support.
3.1.3
Contact Us
The product will have a hyperlink called ‘Contact us’, which will provide the user
with the contact information of resources for general questions or comments. The
information of the contact page includes name, email, phone number, and physical
address.
3.1.4
About CPS
The product will have a hyper link called ‘About CPS’ which will display the name
of the product, version, build date, and copyright information.
6
3.1.5
Simulator
The product will have a hyper link called ‘Simulator’ which will bring up the main
Crop Profitability Simulator application. The CPS application has the following features
available.
3.1.5.1
Plan
A user is able to specify up to 4 plans with different combinations of crop,
acreage, land type, and crop system.
3.1.5.2
Crops
There should be no limitation on how many crops a user may choose. The list of
crops will be based on the data stored in the database. For each crop, the user should
be able to view default costs and income values. The application should also enable
the user to enter their personalized values for cost and income. The calculation of
profit (return over cost) should be entirely based on what the user has entered in the
“Cost” and “Income” fields.
3.1.5.3
Summary
When observing or modifying a plan, a summary table will be displayed and
updated automatically. The information in Summary table will include crop, acre,
cost, income, and profit for each crop. At the bottom of the summary table, “Farm
per Acre” and “Farm Total” will be displayed for the given plan.
3.1.5.4
Expected Variation
For each plan, there will be an “Expected Variation” table where the user can
enter “Yield”, “Cost” and “Price” that can vary at the user’s farm. The expected
variation data shows the user the best, worst, and average estimates of the profit.
3.1.5.5
Summary Details
The summary, along with its breakdown, will be available for each plan in the
“Summary Details” tab. The whole farm profitability (return over cost) for multiple
plans will also be summarized in a graph for easy comparison with best/worst
estimates when an expected variation value is entered.
7
3.1.5.6
User Interface
The User Interface is dynamic, clean, and suitable for the target audience – mildly
technical farmers exploring their options.
3.2 Features of CPS iPhone Application
3.2.1
Simulator
To demonstrate the benefit of SOA, a mini version of the CPS iPhone application will
be developed with the following features.
3.2.1.1
Plan
Users should be able to specify at least 2 plans with different combinations of
crop, acreages, land type and crop system.
3.2.1.2
Crops
There are no limitations placed on how many crops a user can choose. The list of
crops will be based on the data available in the database and should be identical to the
web client’s Crop drop down list. With the iPhone version of the simulator,
personalized cost and income value will not be entertained.
3.2.1.3
Expected Variation
For each plan, there will be an “Expected Variation” table where the user can
enter “Yield”, “Cost” and “Price” that can vary at the user’s farm. The expected
variation data shows the user the best, worst, and average estimates of the profit.
3.2.1.4
Summary
There will be a summary tab in iPhone version of simulator. In this tab, a
summary table along with expected variation and « High », « Mean » and « Low »
values will be displayed. A break down of costs and income is not provided.
3.2.1.5
User Interface
The user interface has been developed as per Apple’s UI guidelines.
8
4 Non-Functional Requirements
4.1 Performance Requirement
Performance may vary depending on the hardware used to host the application. However,
maintaining a response time of less than 7 seconds for any page is expected.
4.2 Safety Requirement
If deployed at KSU Campus, the KSU IT team shall be responsible for the daily backup
of the data. If deployed on the developer’s LAN, the developer shall be responsible for the
daily backup.
4.3 Security Requirement
The product must be physically located behind a firewall with a private IP so that the
system is not publicly accessible. Only port 80 will be open to access the CPS web
application and CPS web services.
4.4 Software Quality Attribute
Service Oriented Architecture, MVC design pattern along with an object oriented
programming approach should be used while developing this product, which will help to
boost the metrics when it comes to flexibility, reusability, maintainability, scalability, and
interoperability.
5 Other Requirements
None
9
CHAPTER 2 - PROJECT PLAN
1 Overview
This project plan document provides a task break down, completion criteria of tasks, and
cost estimation of the project using COCOMO model. As per the MSE portfolio guide line, the
project is broken down into three major phases. After each phase, certain artifacts (refer to
section 2) need to be produced, followed by a presentation to the committee.
2 Task Breakdown
2.1 Inception Phase
The inception phase will concentrate on the project’s overview and requirements. This
phase will include the production of a Vision Document 1.0, a Project Plan 1.0, a Software
Quality Assurance Plan 1.0, and a simple prototype of the software.
2.1.1
Vision Document
This document will include the project’s critical requirements. It gives a listing of
features / requirements and labels each requirement as functional and non-functional, or
Future. Requirements include validation rules and should be associated with unique
section ids so that each requirement can be easily traceable. The introduction to this
project includes its goals and motivation of the proposed product.
2.1.2
Project Plan
This document will include a timeline for the project and a cost estimate for
completing this project. Cost estimates will be developed using the COCOMO estimating
methodology. All activities involved with this project will be associated with milestones
outlined within this document according to the modern software process. This process
includes: Inception Phase, Elaboration Phase, Production Phase, and the Transition
Phase.
10
2.1.3
Software Quality Assurance Plan
This document will include an outline of required documents. To ensure software
quality, practiced standards and conventions will be monitored and followed. This
document will outline project reviews and the responsibilities of those associated with the
proposed software, Crop Profitability Simulator (CPS).
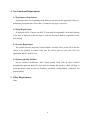
2.1.4
Simple Prototype
A simple prototype will be developed to demonstrate at least one aspect of the
software. It will demonstrate some of the critical requirements outlined in the Vision
Document, such as implementation of critical validation rules. This is completed to
demonstrate feasibility or to illuminate risky project requirements.
Completion Criteria: The phase will be complete once supervisory committee has
approved 2.1.1 to 2.1.4.
2.2 Elaboration Phase
The elaboration phase will concentrate on the project’s architecture. This phase will
include the production of an Architectural Design document, revisions to the Project Plan and
the Vision Document, a formal specification, Test Plan, and two architecture inspections.
2.2.1
Architectural Design Document
The Architecture Design plan will include appropriate UML diagrams such as
class diagrams, use-case diagrams, and sequence diagrams as per the IEEE Std. 14712000, IEEE recommended practice for Architectural Description.
2.2.2
Revision of Project Plan and Vision Document
Appropriate changes will be made to project plan 1.0 and vision 1.0 document as
per the recommendation of the committee.
2.2.3
Formal Specification
CPS software will be formally specified using core UML and OCL. The USE
model along with testing scripts to hold specified constraint and to violate constraint will
11
be produced. A transcript document holding results of all test script along with
explanation (if needed) will also be produced.
2.2.4
Test Plan 1.0
The test plan will include a complete testing procedure for the project. This will
include all test suites required to test all the functional requirements and appropriate
procedures for reporting and correcting failed test.
2.2.5
Architecture Inspection
Two professional Software Engineers will perform formal technical inspections
and send their report to major Professor, Dr. Andresen.
2.2.6
Demo the Prototype
Most of the functional requirements should be demonstrated end of the
elaboration phase. If there is any architectural challenge is encountered and failed to
demo most of the functional requirements, committee must be notified at least a week
before the 2nd presentation.
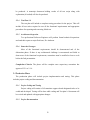
Completion Criteria: The phase will be complete once supervisory committee has
approved 2.2.1 to 2.1.6.
2.3 Production Phase
The production phase will include project implementation and testing. This phase
includes project coding and documentation.
2.3.1
Project Coding and Testing
Project coding will consist of all committee approved and designated tasks to be
coded and developed. Testing will be done while coding and Test plan 1.0 document will
be revised and updated with appropriate changes.
2.3.2
Project Documentation
12
A complete User Manual document of the CPS software will be produced. In
addition to the final report of the project, Component Design document and project
evaluation document will also be produced.
2.3.3
Demo the CPS Software, the release candidate
All functional features outlined in the vision document in section 3.1 and 3.2
should be demonstrated.
Completion Criteria: The phase will be complete once supervisory committee has
approved 2.3.1 to 2.3.3.
3 Cost Estimate
3.1 COCOMO
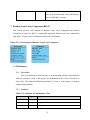
The COnstructive COst MOdel (COCOMO) developed by Barry Boehm will be used to
estimate project effort and time. There are three modes, based on software domains, to
estimate project effort and time in COCOMO. These modes are organic, semidetached, and
embedded. Organic mode projects are less complex developments and have fair flexibility.
Embedded mode projects are usually similar to defense projects. Complexity, reliability, and
real-time issues play a bigger role in embedded mode projects. Semidetached mode projects
represent a hybrid between organic and embedded mode projects. The CPS Software based
on SOA with Web and iPhone client have average complexity and fair flexibility. Thus, I
would consider CPS in an organic mode project. COCOMO cost estimation for organic mode
projects follow the following formula:
Effort = 3.2*EAF*(Size) ^1.05
Time = 2.5*(Effort) ^0.38
Where:
Effort = number of staff months
EAF = Effort Adjustment Factor
13
Size = number of lines of code for completed product. It is measured in KLOC
Time = total number of months
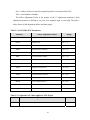
The Effort Adjustment Factor is the product of the 15 adjustment parameters. Each
adjustment parameter is defined as very low, low, nominal, high, or very high. The table 1
below shows all the adjustment factors and their ranges.
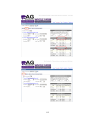
Table 2.3.1 COCOMO EAF Parameters
Identifier
Effort Adjustment Factor
Range
RELY
Required reliability
0.75 - 1.40
DATA
Database size
0.94 – 1.16
CPLX
Product complexity
0.70 – 1.65
TIME
Execution time constraint
1.00 – 1.66
STOR
Main storage constraint
1.00 – 1.56
VIRT
Virtual machine volatility
0.87 – 1.30
TURN
Computer turnaround time
0.87 – 1.15
ACAP
Analyst capability
1.46 – 0.71
AEXP
Applications experience
1.29 – 0.82
PCAP
Programmer capability
1.42 – 0.70
VEXP
Virtual machine experience
1.21 – 0.90
LEXP
Language experience
1.14 – 0.95
MODP
Use of modern practices
1.24 – 0.82
TOOL
Use of software tools
1.24 – 0.83
SCED
Required development schedule
1.23 – 1.10
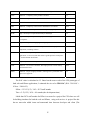
Table 2.3.2 Adjusted EAF Values applied to CPS Project
Identifier
RELY
Level / Reasoning
My Value
Low – Project is not safety critical
0.76
14
DATA
Low – Current size of the database is low. But i twill grow in future
0.98
CPLX
Moderate – Complexity of the product is medium
1.1
TIME
Moderate – Project need to respond to client (The Committee)
1.15
STOR
Low – No store constraint
1.0
VIRT
Moderate - Complexity of the software and hardware is moderate
0.95
TURN
Very Low – Results are reported to the developer very quickly
0.88
ACAP
High – Developer is experienced in analysis and design
1.3
AEXP
High – Developer is experienced in project oriented application
1.1
development.
PCAP
High – Developer has enough programming experience.
1.2
VEXP
Moderate – Developer has moderate experience with other project
1.1
components, excluding software.
LEXP
Moderate – Developer is experienced in C# (used to develop web
1.0
application / web service) but does not have good experience in Objective
C, used for iPhone develoment.
MODP
High – Project uses modern practices
1.0
TOOL
Moderate – Use of tool is moderate. Developer preferes to write code by
0.92
hand instead of tools.
SCED
Moderate – Project is tightly schedule ; allowing time is permissible with
1.1
Supervisor’s approval.
The EAF value is calculated to 1.5. Based on the source code of the CPS prototypes of
both web and iPhone applications, I estimated the size to be 5500 LOC (Web: 2500 LOC +
iPhone : 2000 LOC).
Effort = 3.2*1.5*(5.5) ^1.05 = 28.74 staff months
Time = 2.5*(15.2) ^0.38 = 8.9 months (the development time)
I think that 28.74 staff months for Effort is accurate for a project like CPS where we will
be building simulator for both the web and iPhone, using web services. A project like this
has no non-value added items and turnaround time between developer and client (The
15
Advisor) is prompt. Since this project has a staff of a single developer with access to the
necessary resources, non-development overhead is minimal.
Thus, in my opinion, for an MSE project like the CPS, a realistic Effort value should be
between 5 to 6 staff-months. With the adjusted value of staff-months (5.5), the new
development time can be calculated as:
Time = 2.5*(5.5) ^0.38 = 4.7 months
4 Sprint Planning
The development of this Project is divided into three sprints. Each sprint is dedicated to
do the development for each phase discussed in section 2 (Task breakdown). In this section, we
will display action items for each sprint. The software VersionOne is used to track all the action
items throughout the project.
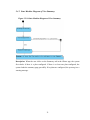
4.1 Phase One (Inception) Sprint Plan
Figure 2.4.1 Action Items of Phase One Sprint
16
4.2 Phase Two (Elaboration) Sprint Plan
Figure 2.4.1 Action Items of Phase Two Sprint
4.3 Phase Three (Production) Sprint Plan
Figure 2.4.3 Action Items of Phase Three Sprint
17
CHAPTER 3 - ARCHITECTURE DESIGN
1 Overview
The overview provides the purpose, scope, and intended user of the proposed software, the
Crop Profitability Simulator (CPS), the useful terms and definition and references used during
production of this document.
1.1 Purpose
The purpose of this document is to outline architectural design of the CPS software. This
architectural document should help to lay foundation for quality of the software and cost gain
through standardization of elements and practices using UML diagrams and notations for
architectural description.
1.2 Terms and Definitions
•
Plan – Combination of picking i) a crop (e.g. corn, wheat), ii) crop system (e.g.
organic, conventional), iii) land type (e.g. dry, irrigated) and iv) area of total land in
Acre that may apply to a farmer’s local farm.
•
Expected Variation – The quantity in percent Cost and Income value may vary. This
gives high-end and low-end profit in addition to average.
•
Return Over Cost – This is same as profit. It is measured as per Acre.
•
View – A representation of a whole system from the perspective of a related set of
concerns.
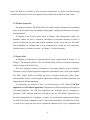
1.3 Scope
The proposed software, CPS, is used by farmers to assess market risks by comparing
profits summary side-by-side for multiple plans. The configuring plans include selecting
region, crop, crop system (e.g. organic, conventional), land type and total acres. The
following is the use case of a base CPS system. For details of the requirement, please refer to
Vision document, Chapter 1.
18
Figure 3.1.1 Critical Use Case Diagram of CPS software
2 Architecture of the System
The CPS software is built on top of Service Oriented Architecture (SOA) realizing with web
services to facilitate loosely coupled application integration among various platforms and
software reuse. In this project, two clients (CPS iPhone app and CPS Web app) running different
platform have been developed and both clients share the same Business Logic Layer (BLL)
components, Data Access Layer (DAL) components and the same backend database. Refer to
Component Diagram in section 2.1 and deployment diagram in section 2.2 for details of software
reuse and loosely coupled application integration.
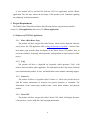
2.1 Component View
This section provides component diagram of the CPS software followed by class diagram
of each component.
19
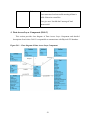
Figure 3.2.1 Component Diagram of CPS Software
Description: Both CPS iPhone app and CPS Web app component communicates with CPS
Web service component to get access to Data Access Layer (DAL) directly or via Business
Logic Layer (BLL) component (e.g. calculate and return data for CPS Analysis) to get data
from CPS database.
Note: This Architecture regardless to what client needs are: iPhone or web it use the same
BLL, DAL and CPS Database component.
2.1.1 CPS Web Client Component
The design pattern MVC (Model-View-Controller) is followed building CPS web
app/client component. This component consists of ASP.NET web form (View) and its
20
code-behind class (Controller) that communicates with CPS database (Model) via CPS
Web service.
Table 3.2.1 List of View and Controller of CPS Web App
Web Forms and its Controller
Default.aspx [View]
Purpose
To render main home page.
Default.aspx.cs [Controller]
AboutCPS.aspx [View]
Render ‘About CPS’ page
AboutCPS.apsx.cs [Controller]
ContactUs.aspx [View]
Render ‘Contact Us’ page
ContactUs.aspx.cs [Controller]
Faq.aspx [View]
Render ‘Faq’ page
Faq.aspx.cs [Controller]
Simulator.aspx [View]
Launch ‘CPS’, the main application
Simulator.aspx.cs [Controller]
2.1.2 CPS iPhone Client Component
Like CPS Web app/client component, the design pattern MVC (Model-ViewController) is also strictly followed building CPS iPhone app/client component to
facilitate clean separation and enforce code/software reuse. This component consists of
NIB files (View) along with its Controller class which communicates with CPS database
(Model) via CPS Web service component. In addition to view and controller, some other
helper classes are also added to this component to process results rendered by web
service, sharing information among the tabs (plan1, plan2, summary). Below are the
entities of the CPS iPhone app/client component.
Table 3.2.2 List of View and Controller of CPS iPhone App Component
NIB File and its Controller
Purpose
MainWindow.xib [View]
Render the main form of the application. This
CPSAppDelegate.m [Controller]
is where the CPS iPhone application launches.
21
This holds and manages the entire UI
elements for the application.
PlanOneView.xib [View]
Render plan configuration UI where user
PlanOneViewController.m [Controller]
selects crop, crop system, land type, acre, and
expected variation etc. for Plan One.
PlanTwoView.xib [View]
Render plan configuration UI where user
PlanTwoViewController.m [Controller]
selects crop, crop system, land type, acre, and
expected variation etc. for Plan Two.
SummaryView.xib [View]
Render UI for Summary tab.
SummaryViewController.m [Controller]
RegionTableView.xib [View]
Render the UI where user picks a region first
RegionTableController.m [Controller]
before configuring the plan one.
RegionTwoTableView.xib [View]
Render the UI where user picks a region first
RegionTwoTableController.m [Controller]
before configuring the Plan Two
Table 3.2.3 Helper Classes used in CPS iPhone App Component
Class files
WebServiceHelper.m
Purpose
Help to initiate and configure web service connection
properties.
XMLDataSetParser.m
Help to parse and process the XML data, response from the
web service.
DataSet.m
Custom data structure to hold the parsed data done by
XMLDataSetParser class. This helper class also helps to find
records/data with ease.
DdlCropSystem.m
These classes help to gives user a drop down experience in
DdlLandType.m
iPhone application instead of UIView picker. This is to save
DdlCrop.m
real-estate in configuring plan UI.
AppData.m
This class is designed using singleton pattern. This helps to
share data among tabs.
22
2.1.3 CPS Web Service Component
Figure 3.2.2 Class diagram of CPS Web Service Component
CPSServices class is the heart of SOA. This class implements all the required web
methods to facilitate clients (Web app or iPhone app) to have access to BLL (Business Logic
Layer) and DAL (Data Access Layer) components and return the results to the caller (client).
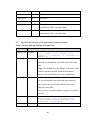
Below are the lists of web methods along with descriptions.
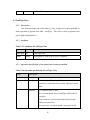
Table 3.2.4 - Web Methods for CPSServices class
Web Method Name
getCpsAnalysisData()
Description
This helps to return the calculated data which is used to display
profit (high, low, mean) for each plan side-by-side. This method
uses CpsAlanysis class from BLL component to serve the request
made by the client.
getPlanSummaryData()
This helps to return the calculated summary data for each plan in the
plan configuration screen. This method uses Plan Summary class
from BLL component to do the task.
getRegions()
This helps to return the list of regions available in the CPS database.
getCropsByRegions()
This helps to return the list of crops available for a given region.
getCropTypesRegions() This helps to return the list of CropTypes available for a given
region.
getLandTypesRegions() This helps to return the list of Land Types available for a given
region.
23
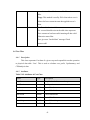
2.1.4 Business Logic Layer (BLL) Component
This section provides class diagrams and brief description of classes used in BLL
component.
Figure 3.2.3 Class diagram of BLL Component
Table 3.2.4 Classes of BLL Component
Class Name
Description
PlanSummary
This user defined data structure helps to represent plan summary data
displayed with user configure a plan. In this project, this BLL class is
used by web client only. The method GetPlanSummaryData() is used
to return dataset to display complete plan summary.
CPSAnalysisData
This helps to represent CPSAnalysis data which is used to display
overall return over costs with High, Low, Mean value (if expected
variation entered) for multiple plans side-by-side.
2.1.5 Data Access Layer (DAL) Component
This section provides class diagrams and brief description of classes which is used in
DAL component that is responsible to communicate with CPS Database component (the
physical database) via ADO.NET framework.
24
Figure 3.2.4 Class diagram of DAL Component
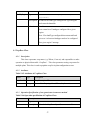
Table 3.2.5 Classes of DAL Component
Class Name
Region
Description
This class represents location of the land (e.g. North West, South West etc.)
and responsible to make operation to physical data table ‘Region’. This class
is used to list the locations (region) of crop in both clients.
LandType
This class represents type of the land (e.g. Dry, Irrigated etc) and responsible
to make operation to physical data table ‘LandType’. This class is used to
populate land type in plan configuration UI.
CropType
This class represents crop system (e.g. Organic, Conventional) and
responsible to make operation to physical data table ‘CropType’. This class is
used to populate Crop System drop down in plan configuration screen.
CropDesc
This class represents crop name (e.g. Wheat, Corn etc) and responsible to
25
make operation to physical data table ‘CropDesc’. This class promotes
reusing crop name for multiple plans. This class is used to populate crop list
in plan configuration screen.
Crop
This class represents crop that has been configured for a plan and responsible
to make operation to physical data table ‘Crop. This is used to find out cost,
income, profit.
Income
This class represents Income data of a given crop and responsible to make
operation to physical data table ‘Income’. This is used to calculate income,
profit, CpsSummary and CPSAnalysis data.
Cost
This class represents Cost data of a given crop and responsible to make
operation to physical data table ‘Cost’. This is used to calculate cost, profit,
CpsSummary, and CPSAnalysis data.
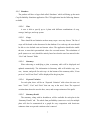
2.1.6 CPS Database Component
This component holds the physical CPS Database, the model of MVC design pattern.
Below is the CPS database schema diagram outlines tables structures and the
relationships among the tables.
Figure 3.2.5 CPS Database Schema
26
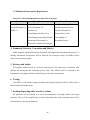
2.2 Deployment View
This section provides deployment diagram of CPS software including both clients.
Figure 3.2.6 Deployment Diagram of CPS Software
Description: CPS Client can be either an iPhone App running on the iPhone OS or a
browser loaded with the CPS Web page running using any PC. iPhone app communicates
with CPS Web service which then access to CPS Database either via BLL component or
DAL component. For web browser client, it first sends the request to a web server, then it
calls a web service via code-behind class of CPS Web App component to query data from
the CPS database.
27
2.3 Interaction View
This section provides two sequence diagrams to demonstrate two path that web service
may take query CPS database.
2.3.1 Sequence Diagram of View Summary Usecase
Figure 3.2.7 Sequence diagram of View Summary (CpsAnalysis) Usecase
Description: Web / iPhone (client) invokes CpsAanlysis Web Service which is used to
get data needed to display return over cost tables to do compare plan side-by-side. Web
service, creates a CpsAnalysis object (which is omitted in the diagram for clarity) and
call GetCpsAanalsysisData method. This method first creates income object and call
LoadByCrop method which queries the database and load the income object. Then, it
creates Cost object and call LoadByCrop method which queries the database and load
cost object. CpsAnalysis object then does required calculation, build datatable structure
and send data to CpsWebServices object. The web service then return response to the
caller, the client.
2.3.2 Sequence Diagram of Select Region UseCase
Note: The diagram below is displayed to demonstrate different path that web service
takes to query data from the database. In this case, the web service directly call object of
28
DAL to query the database and get the data, instead of using BLL object stated in 2.3.1
section above.
Figure 3.2.8 Sequence diagram of Get Regions
Description: Web / iPhone (client) invokes GetRegions Web Service to get list of
regions that user may pick from. The service creates a Region object (creation of the
object is omitted for clarity) and call findAll method which query the database and return
the datatable with list of Regions to the web service. The web service then sends response
to caller, the client with list of regions.
29
2.4 State Machine View
This section provides state machine diagram of CPS software.
2.4.1 State Machine Diagram of Loading CPS Application
Figure 3.2.9 State Machine Diagram of Loading CPS Application
Description: When the iPhone app fires up, it first does the initialize routines, then it
checks if the web service is available. If available, it gracefully loads the application. If
the web service is not available or has an error during rendering the service, it displays
the warning message.
30
2.4.2 State Machine Diagram of View Summary
Figure 3.2.10 State Machine Diagram of View Summary
Description: When the user clicks on the Summary tab in the iPhone app, the system
first checks if there is a plan configured. If there is at least one plan configured, the
system loads the summary page gracefully. If no plans are configured, the system gives a
warning message.
31
3 Formal Specification of the System
This section provides class diagram with role name used by model, USE model along with
CMD scripts which is used to hold/violate invariants stated in the model.
3.1 UML Class Diagram with Role Name
Figure 3.3.1 UML Class Diagram with Role Name for Formal Specification
32
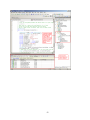
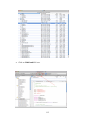
3.2 USE Model
-- *************************************************************
-- Formal Specification of CPS [Crop Profitability Simulator]
-- MSE Project, Spring 2010, Kansas State University
-- *************************************************************
-- File Name: cps.use
-- Author: Reza Nabi
-- Date: Mar 25, 2010
-model CPSSystem
--- E N U M E R A T I O N S
-enum YieldLevel {Average, High, Low}
--- C L A S S E S
--- Region is used to identify location of the land.
-- e.g. South West, North West, North Central etc.
-- Each Region will have a name and Active flag
-- When we don't want to support any entered region, we can just set
-- the active flag to false.
class Region
attributes
id
: Integer
name : String
end
33
-- CropDesc is used to hold the description of the crop
-- e.g. Corn, Wheat etc.
class CropDesc
attributes
id
: Integer
name : String
end
-- CropType is to hold the type of the crop also known as crop system
-- e.g. Organic, Conventional
class CropType
attributes
id : Integer
name : String
end
-- LandType is to hold the type of the land
-- e.g. Dry, Irrigated
class LandType
attributes
id
: Integer
name : String
end
-- Crop is to hold details information of the crops
-- location of the land (region), type of land, crop type
-- description of the crop and an unique cropId.
-- The unique cropId is used to map with income and cost data
34
class Crop
attributes
cropId
: Integer
landTypeId : Integer
cropDescId : Integer
cropTypeId : Integer
regionId : Integer
--- O P E R A T I O N S
-operations
-- Get the costs for a given crop
getCostsByYieldLevel(yl : YieldLevel) : Set(Cost) =
self.costData->select(cst | cst.yieldLevel = yl)
-- Get the Incomes for a given crop
getIncomesByYieldLevel(yl : YieldLevel) : Set(Income) =
self.incomeData->select(incm | incm.yieldLevel = yl)
end
class Income
attributes
cropId
yieldPerAcre
: Integer
: Real
pricePerBushel : Real
govtPayment
: Real
indemnityPayment : Real
miscIncome
yieldLevel
: Real
: YieldLevel
end
35
class Cost
attributes
cropId
seed
: Integer
: Real
herbicide
: Real
insecticide
: Real
fertilizer
: Real
consulting
: Real
insurance
: Real
drying
: Real
miscellaneous
: Real
machineryExpense
: Real
nonMachineryLabor
irrigationLabor
irrigationFuel
irrigationRepair
: Real
: Real
: Real
: Real
depreciationOnEquipment : Real
interestOnEquipment
landCharge
: Real
: Real
interestOnNonLandCost : Real
yieldLevel
: YieldLevel
end
--- A S S O C I A T I O N S
--- Assocation between Region (e.g. North West, South West) and Crop
association LocationOfCrop between
Region[1] role locatedAt
Crop[0..*] role cropsByRegion
end
36
-- Assocation between CropType (e.g. Organic, Conventional) and Crop
association TypeOfCrop between
CropType[1] role cropSystem
Crop[0..*] role cropsByType
end
-- Assocation between LandType (e.g. Dry, Irrigate) and Crop
association LandTypeOfCrop between
LandType[1] role typeOfLand
Crop[0..*] role cropsByLandType
end
-- Association between Crop Description and Crop
association DescriptionOfCrop between
CropDesc[1] role cropName
Crop[0..*] role cropsByCropDesc
end
-- For each crop system should have at least one Income
-- It also makes sure Income does not have more than 3.
-- One for each yield level (e.g. Average, High, Low)
association CropIncomeMap between
Crop[1] role cropPointsTo
Income[1..3] role incomeData
end
-- For each crop system should have at least one cost
-- It also makes sure Cost does not have more than 3.
-- One for each yield level (e.g. Average, High, Low)
association CropCostMap between
Crop[1] role cropPointsTo
Cost[1..3] role costData
end
37
--- C O N S T R A I N T S
-constraints
-- cropId in Crop must be unique
-- Constraints No: 1
context crp1:Crop inv CropIdIsUnique:
Crop.allInstances->forAll(crp2|crp1.cropId=crp2.cropId
implies crp1=crp2)
-- System must have at least one Crop configured
-- At least one or more cost and income data is forced by
-- association CropCostMap and CropIncomeMap by multiplicity 1..3
-- Constraints No: 2
context Region inv HaveAtLeastOneCropCofigured:
self.cropsByRegion->size >= 1
and Region.allInstances->asSequence->size >= 1
-- For each Yield Level, make sure number of
-- Costs and Incomes are equal. This will help to make
-- sure the data is in sync.
-- NOTE: For fun... I made these functional and using them here :-)
-- Constraints No: 3
context crp:Crop inv CostAndIncomeDataMustBeInSync:
crp.getCostsByYieldLevel(#Average)->size = crp.getIncomesByYieldLevel(#Average)>size
and crp.getCostsByYieldLevel(#High)->size = crp.getIncomesByYieldLevel(#High)>size
and crp.getCostsByYieldLevel(#Low)->size = crp.getIncomesByYieldLevel(#Low)>size
38
-- In Income, make sure cropId is unique for a given yieldLevel
-- Constraints No: 4
context incm1:Income inv NoDuplicateCropIdInIncomePerYieldLevel:
Income.allInstances->forAll(incm2|incm1.cropId=incm2.cropId
and incm1.yieldLevel=incm2.yieldLevel
implies incm1=incm2)
-- In Cost, make sure cropId is unique for a given yieldLevel
-- Constraints No: 5
context cst1:Cost inv NoDuplicateCropIdInCostPerYieldLevel:
Cost.allInstances->forAll(cst2|cst1.cropId=cst2.cropId
and cst1.yieldLevel=cst2.yieldLevel implies cst1=cst2)
-- Make sure system at least has one region
-- Constraints No: 6
context Region inv AtleastHaveOneRegion:
Region.allInstances->asSequence->size >= 1
-- Make sure system at least has one Crop Type (e.g. Organic, Conventional)
-- Constraints No: 7
context CropType inv AtleastHaveOneCropType:
CropType.allInstances->asSequence->size >= 1
-- Make sure system at least has one Land Type (e.g. Dry, Irrigate)
-- Constraints No: 8
context LandType inv AtleastHaveOneLandType:
LandType.allInstances->asSequence->size >= 1
39
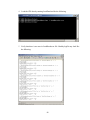
3.3 Transcripts – Outcome of CMD Script to hold/violate invariants
Following are the outcome along with explanation of USE cmd scripts [refer to section 4
in formal specification document] which is used to instantiate the USE model and to
hold/violate the invariants.
*************************************************************
* CPS - MSE Project
* Transcripts - The results of various runs CMD Scripts
* Author : Reza Nabi, Email: [email protected]
*************************************************************
=============================================================
All Constraints Holds
Confirm basic instantiation satisfies all basic structure requirements
=============================================================
SCRIPTS RAN:
use> read A-basic-init.cmd
------------------------------------------------------------cps-basic-init.cmd>
use> check
checking structure...
checking invariants...
checking invariant (1) `Cost::NoDuplicateCropIdInCostPerYieldLevel': OK.
checking invariant (2) `Crop::CostAndIncomeDataMustBeInSync': OK.
checking invariant (3) `Crop::CropIdIsUnique': OK.
checking invariant (4) `Income::NoDuplicateCropIdInIncomePerYieldLevel': OK.
checking invariant (5) `Region::HaveAtLeastOneCropCofigured': OK.
checked 5 invariants in 0.020s, 0 failures.
use>
40
=============================================================
Constraint No : 1 [CropIdIsUnique] Fails
Explanation: In crp3 object created with a cropId 1 which is used in crp1.
Hence, CropIdIsUnique constraint failed.
=============================================================
SCRIPTS RAN:
use> read constraint-1-fails.cmd
------------------------------------------------------------constraint-1-fails.cmd> check
checking structure...
checking invariants...
checking invariant (1) `Cost::NoDuplicateCropIdInCostPerYieldLevel': OK.
checking invariant (2) `Crop::CostAndIncomeDataMustBeInSync': OK.
checking invariant (3) `Crop::CropIdIsUnique': FAILED.
-> false : Boolean
checking invariant (4) `Income::NoDuplicateCropIdInIncomePerYieldLevel': OK.
checking invariant (5) `Region::HaveAtLeastOneCropCofigured': OK.
checked 5 invariants in 0.010s, 1 failure.
constraint-1-fails.cmd>
use>
=============================================================
Constraint No : 2 [HaveAtLeastOneCropCofigured] Fails
Explanation: There is no Crop configured. System requires that at least one
must be configured. Hence, constraint 2 failed.
=============================================================
SCRIPTS RAN:
use> read constraint-2-fails.cmd
------------------------------------------------------------constraint-2-fails.cmd> check
checking structure...
41
checking invariants...
checking invariant (1) `Cost::NoDuplicateCropIdInCostPerYieldLevel': OK.
checking invariant (2) `Crop::CostAndIncomeDataMustBeInSync': OK.
checking invariant (3) `Crop::CropIdIsUnique': OK.
checking invariant (4) `Income::NoDuplicateCropIdInIncomePerYieldLevel': OK.
checking invariant (5) `Region::HaveAtLeastOneCropCofigured': FAILED.
-> false : Boolean
checked 5 invariants in 0.020s, 1 failure.
constraint-2-fails.cmd>
use>
=============================================================
Constraint No : 3 [CostAndIncomeDataMustBeInSync] Fails
Explanation: As per the system requirement, for a given yield level, if a row
exists in Income, there must be another row exists in Cost as well
for the same yield level.
Here, for the crp3 (cropId 3), Income object is created with 'Average'
yield level but Cost object is created with 'High' yield level.
Hence, constraint 3 failed.
=============================================================
SCRIPTS RAN:
use> read constraint-3-fails.cmd
------------------------------------------------------------constraint-3-fails.cmd> check
checking structure...
checking invariants...
checking invariant (1) `Cost::NoDuplicateCropIdInCostPerYieldLevel': OK.
checking invariant (2) `Crop::CostAndIncomeDataMustBeInSync': FAILED.
-> false : Boolean
checking invariant (3) `Crop::CropIdIsUnique': OK.
checking invariant (4) `Income::NoDuplicateCropIdInIncomePerYieldLevel': OK.
checking invariant (5) `Region::HaveAtLeastOneCropCofigured': OK.
42
checked 5 invariants in 0.010s, 1 failure.
constraint-3-fails.cmd>
use>
=============================================================
Constraint No : 3 [CostAndIncomeDataMustBeInSync] Fails
Explanation: As per the system requirement, for a given yield level, if a row
exists in Income, there must be another row exists in Cost as well
for the same yield level.
Here, for the crp3 (cropId 3), Income object is created with 'Average'
yield level but Cost object is created with 'High' yield level.
Hence, constraint 3 failed.
=============================================================
SCRIPTS RAN:
use> read constraint-3-fails.cmd
------------------------------------------------------------constraint-3-fails.cmd> check
checking structure...
checking invariants...
checking invariant (1) `Cost::NoDuplicateCropIdInCostPerYieldLevel': OK.
checking invariant (2) `Crop::CostAndIncomeDataMustBeInSync': FAILED.
-> false : Boolean
checking invariant (3) `Crop::CropIdIsUnique': OK.
checking invariant (4) `Income::NoDuplicateCropIdInIncomePerYieldLevel': OK.
checking invariant (5) `Region::HaveAtLeastOneCropCofigured': OK.
checked 5 invariants in 0.010s, 1 failure.
constraint-3-fails.cmd>
use>
43
=============================================================
Constraint No : 4 [NoDuplicateCropIdInIncomePerYieldLevel] Fails
Explanation: In incm3, cropId 2 and yield level 'Average' is used intentionally
to break the constraint. As per the requirement for a given yield
level, Income cannot have duplicate cropId. In this case,
cropId 2 is used in incm2 object. Hence, constraint 4 will not hold.
=============================================================
SCRIPTS RAN:
use> read constraint-4-fails.cmd
------------------------------------------------------------constraint-4-fails.cmd> check
checking structure...
checking invariants...
checking invariant (1) `Cost::NoDuplicateCropIdInCostPerYieldLevel': OK.
checking invariant (2) `Crop::CostAndIncomeDataMustBeInSync': OK.
checking invariant (3) `Crop::CropIdIsUnique': OK.
checking invariant (4) `Income::NoDuplicateCropIdInIncomePerYieldLevel': FAILED.
-> false : Boolean
checking invariant (5) `Region::HaveAtLeastOneCropCofigured': OK.
checked 5 invariants in 0.010s, 1 failure.
constraint-4-fails.cmd>
use>
=============================================================
Constraint No : 5 [NoDuplicateCropIdInCostPerYieldLevel] Fails
Explanation: In cst3, cropId 2 and yield level 'Average' is used intentionally
to break the constraint. As per the requirement for a given yield
level, Cost cannot have duplicate cropId. In this case,
cropId 2 is used in cst2 object. Hence, constraint 5 will not hold.
=============================================================
44
SCRIPTS RAN:
use> read constraint-5-fails.cmd
------------------------------------------------------------constraint-5-fails.cmd> check
checking structure...
checking invariants...
checking invariant (1) `Cost::NoDuplicateCropIdInCostPerYieldLevel': FAILED.
-> false : Boolean
checking invariant (2) `Crop::CostAndIncomeDataMustBeInSync': OK.
checking invariant (3) `Crop::CropIdIsUnique': OK.
checking invariant (4) `Income::NoDuplicateCropIdInIncomePerYieldLevel': OK.
checking invariant (5) `Region::HaveAtLeastOneCropCofigured': OK.
checked 5 invariants in 0.030s, 1 failure.
constraint-5-fails.cmd>
use>
45
CHAPTER 4 - INSPECTION LIST
1 Introduction
This chapter provides a checklist that is used to perform a technical inspection of the MSE
Project developing CPS Software. It provides a guideline that is to be followed while inspectors
check the integrity of artifacts associated with this project. The inspectors will use this document
as an aid while inspecting the Architectural Design Document 1.0 and USE Model.
2 Items to be inspected
Following are items that need to be inspected by the technical reviewer.
2.1 UML Diagrams
•
Class Diagram
•
Sequence Diagram
•
Component Diagram
•
Deployment Diagram
•
State Machine Diagram
•
Use Case Diagrams
2.2 Formal Specifications
•
USE Model
•
Scripts to test Model
3 Formal Inspectors
1
Amit Borcar, Software Engineer, Sage Software
Email: [email protected]
2
Suresh Pothuri, Software Engineer, Sage Software
Email: [email protected]
46
4 Formal Inspection Checklist
Table 4.4.1 Formal Inspection Checklist
I.1
I.2
Inspection Item
Artifact
The symbols used in the class
Architectural
diagrams conform to UML standards.
Design 1.0
The symbols used in the sequence
Architectural
diagrams, state machine diagram, use
Design 1.0
case diagram conforms to UML
standards.
I.3
The symbols used in the component
Architectural
view diagram conform to UML
Design 1.0
standards.
I.4
I.5
The symbols used in deployment
Architectural
diagram conform to UML standards.
Design 1.0
The USE model, associations, and
USE Model -
invariants are sufficient to meet the
Formal
requirement outlined in section 3.1
Specification 1.0
and section 3.2 in vision document.
I.6
The USE instantiation scripts and
USE Model -
other CMD scripts provided with
Formal
USE model is sufficient to verify the
Specification 1.0
invariants (to holds / violates).
Test CPS Software and verify that it
I.7
CPS Software
meets all functional requirements
stated in section 3.1 and 3.2 in vision
document.
NOTE: This item will help to
maintain supplier control guideline
stated in Quality Assurance Plan
Document 1.0.
47
Results
Comments
CHAPTER 5 - COMPONENT DESIGN
1 Introduction
The purpose of this chapter is to outline the internal design of server side components such as
Web Service Component, Data Access Layer Component (DALC) and Business Logic Layer
Component (BLLC) that we discussed briefly (high level) in section 2 of Chapter 3, Architecture
Design. For a component diagram of the whole CPS Software, please refer to Figure 3.2.1
Component Diagram of CPS Software in chapter 3.
2 Web Service Component (WSC)
This section provides class diagram of Web Service Component and detailed description of
each class. WSC is responsible serves the client’s (Web Client or iPhone Clinet) request
using BLLC or DALC based on the type of the request.
Figure 5.2.1 Class Diagram of Web Service Component
2.1 CPSServices Class
2.1.1
Description
CPSServices class is the heart of SOA. This class implements all the required web
methods (web service) to facilitate clients (Web app or iPhone app) to have access to
BLL (Business Logic Layer), (Data Access Layer) components and Database Component
and return the results to the caller (client).
2.1.2
Attributes
No attribute is required for this web service class as this class is designed to have only
web methods.
48
2.1.3
Operation Specification of non getter/setter/constructor method
Table 5.2.1 Operation specification of CPSServices Class
Method Name
GetRegions
Description
Signature
public DataTable GetRegions()
Description
This method returns list of Regions found in
the database.
Behavior
Pre: None
Post: return datatable of regions found in the
database.
Post: if no regions found, return null and give
user “at least one region must be configured”
message.
GetCropsByRegion
Signature
public DataTable
GetCropsByRegion(string regionName)
Description
This method returns list of Crops found in the
database for a given region.
Behavior
Pre: passed in data is valid
Post: return datatable of Crops if records found
in the database.
Post: if no crops are found for a given region,
return null and give user “At least one crop
needs to be configured for a given region”
message.
GetCropTypesByRegion Signature
Description
public DataTable GetCropTypesByRegion
(string regionName)
This method returns list of CropTypes
configured in the database for a given region.
Behavior
Pre: passed in data is valid
Post: return datatable of CropType if records
found in the database.
Post: if no CropTypes are found for a given
49
region, return null and give user “At least one
CropType needs to be configured for a given
region” message.
GetLandTypesByRegion Signature
Description
public DataTable GetLandTypesByRegion
(string regionName)
This method returns list of LandTypes
configured in the database for a given region.
Behavior
Pre: passed in data is valid
Post: return datatable of LandType if records
found in the database.
Post: if no LandTypes are found for a given
region, return null and give user “At least one
LandTypes needs to be configured for a given
region” message.
GetPlanSummaryData
Signature
public DataTable
GetPlanSummaryData(string regionName,
string cropName, string landType,
string cropType, string sYieldChange,
string sPriceChange, string
sCostChange, string landArea)
Description
This method returns the plan summary
datatable.
Behavior
Pre: Passed in data is valid
Post: return datatable with PlanSummary data
Post: if invalid data found, return null and give
user “invalid data” message.
GetCpsAnalysisData
Signature
public DataTable
GetCpsAnalysisData(string regionName,
string cropName, string landType,
string cropType, string sYieldChange,
string sPriceChange, string
sCostChange, string planName)
Description
This method returns the datatable of
CpsSummary data which is used to draw graph
and retune over cost tables for all plans side by
side.
Behavior
Pre: Passed in data is valid
50
Post: return datatable with CpsSummary data
Post: if invalid data found, return null and give
user “invalid data” message.
3 Business Logic Layer Component (BLLC)
This section provides class diagram of Business Logic Layer Component and detailed
description of each class. BLLC is responsible implement business rules and communicate
with DALC to query or save information to Physical CPS database.
Figure 5.3.1 Class diagram of Business Logic Layer Component
3.1 PlanSummary
3.1.1
Description
This user defined data structure helps to represent plan summary data displayed
with user configure a plan. In this project, the PlanSummary BLL class is used by web
client only. The method GetPlanSummaryData() is used to return dataset to display
complete plan summary.
3.1.2
Attributes
Table 5.3.1 Attributes of PlanSummary Class
Name
Type
Description
planName
string
Plan Description
cropName
string
Crop Name
acreAmount
int
Crop Acre
51
incomeAmount double
Income Amount
costAmount
Cost Amount
double
returnOverCost double
3.1.3
Profit, the return over cost
Operation Specification of non getter/setter/constructor method
Table 5.3.2 Operation specification of PlanSummary Class
Method Name
Description
GetPlanSummary Signature
Description
public DataTable GetPlanSummaryData(Crop
crp, int landArea, Cost c, Income i)
It takes Crop, landArea, Cost and Income object and
it calculates as per the business rule and return
PlanSummary datatable.
Behavior
Pre: Passed in data is valid
Post: return plan summary datatable.
Post: if invalid data found, return null and give user
“invalid data” message.
Load
Signature
public bool Load(Cost c, Income i, string
planName)
Description
It loads the PlanSummary object. Returns to true if all
data passed in is valid and load successful. Otherwise
return false.
Behavior
Pre: Passed in data is valid
Post: return true load successful meaning all data is
valid. Otherwise return false
Post: give user “Invalid data” message if load
unsuccessful.
52
3.2 CPSAnalysis
3.2.1
Description
This helps to represent CPSAnalysis data which is used to draw graph and display
overall return over costs with High, Low, Mean value (if expected variation entered) for
multiple plans side-by-side.
3.2.2
Attributes
Table 5.3.3 Attributes of CPSAnalysis Class
Name
Type
Description
planName
string
Plan Description
expectedVariation string
Expected variation applied to user’s estimate
High
double
Highest profit user may have
Mean
double
Average profit
Low
double
Lowest profit user may have
3.2.3
Operation Specification of non getter/setter/constructor method
Table 5.3.4 Operation specification of CPSAnalysis Class
Method Name
Description
GetAnalysisData Signature
Description
public DataTable GetAnalysisData(Cost c,
Income i, string planName)
It takes Cost, Income and planName and it calculates
as per the business rule and return CPSAnalysis
datatable.
Behavior
Pre: Passed in data is valid
Post: return datatable with CPSAnalysis data
Post: if invalid data found, return null and give user
“invalid data” message.
Load
Signature
public bool Load(Cost c, Income i, string
planName)
Description
It loads the CPSAnalysis object. Returns to true if all
data passed in is valid and load successful. Otherwise
return false.
53
Behavior
Pre: Passed in data is valid
Post: return true load successful meaning all data is
valid. Otherwise return false
Post: give user “Invalid data” message if load
unsuccessful.
4 Data Access Layer Component (DALC)
This section provides class diagram of Data Access Layer Component and detailed
description of each class. DALC is responsible to communicate with Physical CPS database.
Figure 5.4.1 – Class diagram of Data Access Layer Component
54
4.1 Region Class
4.1.1
Description
This class represents location of the land (e.g. North West, South West etc.) and
responsible to make operation to physical data table ‘Region’. This class is used to list the
locations (region) of crop in both clients.
4.1.2
Attributes
Table 5.4.1 Attributes of Region Class
Name
Type
Description
regionId Int
Region’s ID
name
Description of Region (e.g. North West)
4.1.3
String
Operation Specification of non Getter/Setter/Constructor method
Table 5.4.2 Operation specification of Region Class
Name
Description
Load
Signature
public bool Load(int id)
Description
It loads the Region object. Returns to true if data passed in is
valid and load successful. Otherwise return false.
Behavior
Pre: Passed in data is valid
Pre: a record should exist in region table by the id passed in.
Post: return true if record exists and load successful. Otherwise
return false
Post: give user “record not found” message if record does not
exists.
FindAll Signature
Description
public DataTable FindAll()
It finds all the regions available in Region table and returns the
datatable of regions.
Behavior
Pre: None
Post: return list of regions found in the system.
Post: If no region exists then return null and give user “record
55
not found” message
4.2 LandType Class
4.2.1
Description
This class represents type of the land (e.g. Dry, Irrigated etc) and responsible to
make operation to physical data table ‘LandType’. This class is used to populate land
type in plan configuration UI.
4.2.2
Attributes
Table 5.4.3 Attributes of LandType Class
Name
Type
Description
landTypId Int
Land Type’s ID
Name
Description of Land Type (e.g. Dry, Irrigated)
4.2.3
String
Operation Specification of non getter/setter/constructor method
Table 5.4.4 Operation specification of LandType Class
Name
Description
Load
Signature
public bool Load(int id)
Description
It loads the LandType object. Returns to true if data
passed in is valid and load successful. Otherwise return
false.
Behavior
Pre: Passed in data is valid
Pre: a record should exist in LandType table by the id
passed in.
Post: return true if record exists and load successful.
Otherwise return false
Post: give user “record not found” message if record
56
does not exists.
FindByRegion Signature
public DataTable FindByRegion(string
regionName)
Description
It finds all the landTypes configure for a given region
and retuns the datatable.
Behavior
Pre: None
Post: return list of landtypes configured for a given
region.
Post: If no landType configured then returns null and
give user “at least one landtype needs to be configured
for a given region” message
4.3 CropDesc Class
4.3.1
Description
This class represents crop name (e.g. Wheat, Corn etc) and responsible to make
operation to physical data table ‘CropDesc’. This class promotes reusing crop name for
multiple plans. This class is used to populate crop list in plan configuration screen.
4.3.2
Attributes
Table 5.4.5 Attributes of CropDesc Class
Name
Type
Description
cropDescId Int
Crop Description ID
Name
Name of the Crop (e.g. Corn, Wheat, Soybean etc)
4.3.3
String
Operation Specification of non getter/setter/constructor method
Table 5.4.6 Operation specification of CropDesc Class
Name
Description
Load
Signature
public bool Load(int id)
Description
It loads the CropDesc object. Returns to true if data
57
passed in is valid and load successful. Otherwise return
false.
Behavior
Pre: Passed in data is valid
Pre: a record should exist in CropDesc table by the id
passed in.
Post: return true if record exists and load successful.
Otherwise return false
Post: give user “record not found” message if record
does not exists.
FindByRegion Signature
public DataTable FindByRegion(string
regionName)
Description
It finds all the CropNames configured for a given region
and retuns the datatable.
Behavior
Pre: None
Post: return list of Crop names configured for a given
region.
Post: If no crop name configured then returns null and
give user “at least one crop must be configured for a
given region” message
4.4 Crop Class
4.4.1
Description
This class represents crop that has been configured for a plan and responsible to
make operation to physical data table ‘Crop. This is used to find out cost, income, profit.
4.4.2
Attributes
Figure 5.2.7 Attributes of Crop Class
Name
Type
Description
cropId
Int
Unique Crop Id
landTypeId Int
Land type that the crop associated with
58
cropTypeId Int
Crop Type that the Crop associated with
cropDescId Int
Crop Description that the Crop associated with
4.4.3
Operation Specification of non getter/setter/constructor method
Figure 5.2.6 Operation specification of Crop Class
Name Description
Load
Signature
public bool Load(int cropDesId, int cropTypeId, int
landTypeId, int regionId)
Description
It loads the crop object. Returns to true if all data passed in is
valid and load successful. Otherwise return false.
Behavior
Pre: Passed in data is valid
Pre: a record should exists in the table class represent
Post: return true if record exists and load successful. Otherwise
return false
Post: give user “record not found” message if record does not
exists.
4.5 Income Class
4.5.1
Description
This class represents Income data of a given crop and responsible to make
operation to physical data table ‘Income’. This is used to calculate income, profit,
CpsSummary and CPSAnalysis data.
4.5.2
Attributes
Table 5.4.7 Attributes of Income Class
Name
Type
Description
cropId
int
Crop Id that the income records map to
yieldPerAcre
int
Yield per Acre
pricePerBushel
double
Price per bushel
govtPayment
double
Government payment
59
indemnityPayment double
Indemnity Payment
miscIncome
double
Miscellaneous income
yieldLevelId
int
Yield level
returnPerAcre
double
Default (average) return per acre
highEndReturn
double
The highest return user may have based on the expected
variation data. This is calculated field.
lowEndReturn
double
The lowest return user may have based on the expected
variation data. This is calculated field.
4.5.3
Operation Specification of non getter/setter/constructor method
Table 5.4.8 Operation specification of Income Class
Name
Description
LoadByCrop Signature
Description
public bool LoadByCrop(string regionName,
string cropName, string landType, string
cropType, int yieldChange, int priceChange, int
yiedLevelId)
It loads the Income object. Returns to true if all data
passed in is valid and load successful. Otherwise return
false.
Usage: This method is used by iPhone client where it only
needed to return the default (found in the database)
income value based on the given crop configuration.
Behavior
Pre: Passed in data is valid
Pre: a record should exists in the table class represent
Post: return true if record exists and load successful.
Otherwise return false
Post: give user “record not found” message if record does
not exists.
Load
Signature
public bool Load(double yieldPerAcre, double
pricePerBushel, double govtPayment, double
indemnityPayment, double miscPayment, int
yieldChange, int priceChange)
Description
It loads the Income object. Returns to true if all data
60
passed in is valid and load successful. Otherwise return
false.
Usage: This method is used by Web client where user is
allowed to have custom income data applied to user’s
farm.
Behavior
Pre: Passed in data is valid
Pre: a record should exists in the table class represent
Post: return true load successful meaning all data valid.
Otherwise return false
Post: give user “Invalid data” message if load
unsuccessful.
4.6 Cost Class
4.6.1
Description
This class represents Cost data of a given crop and responsible to make operation
to physical data table ‘Cost’. This is used to calculate cost, profit, CpsSummary, and
CPSAnalysis data.
4.6.2
Attributes
Table 5.4.9 Attributes of Cost Class
Name
Type
Description
cropId
int
Crop Id that the Cost record map to
yieldPerAcre
int
Yield per Acre
Seed
double
Cost of Seed
herbicide
double
Cost of Herbicide
insecticide
double
Cost of Insecticide
fertilizer
double
Cost of Fertilizer
consulting
double
Cost of Consulting
insurance
double
Cost of Insurance
61
Drying
double
Cost of drying
miscellaneous
double
Miscellaneous Cost
machineryExpense
double
Machinery Expense
nonMachineryLabor
double
Non Machinery Labor
irrigationLabor
double
Irrigation Labor
irrigationFuel
double
Cost of Irrigation Fuel
irrigationRepair
double
Cost of Irrigation Repair
depreciationOnEquipment double
Depreciation On Equipment Cost
interestOnEquipment
double
Interest paid on Equipment
landCharge
double
Land Charge
interestOnNonLandCost
double
Interest paid on Non Land Cost
subTotalCostPerAcre
double
Calculated field
totalCostPerAcre
double
Calculated average cost
highEndCost
double
Calculated highest cost
lowEndCost
double
Calculated lowest cost
4.6.3
Operation Specification of non getter/setter method
Table 5.4.10 Operation specification of Cost Class
Name
Description
LoadByCrop Signature
Description
public bool LoadByCrop(string regionName,
string cropName, string landType, string
cropType, int costChange, int yiedLevelId)
It loads the Cost object. Returns to true if all data passed
in is valid and load successful. Otherwise return false.
Usage: This method is used by iPhone client where it only
needed to return the default (found in the database)
income value based on the given crop configuration.
Behavior
Pre: Passed in data is valid
Pre: a record should exists in the table class represent
Post: return true if record exists and load successful.
Otherwise return false
62
Post: give user “record not found” message if record does
not exists.
Load
Signature
public bool Load(double seed, double herbicide,
double insecticide, double fertilizer, double
consulting, double insurance, double drying,
double miscellaneous, double machineryExpense,
double nonMachineryLabor, double
irrigationLabor, double irrigationFuel, double
irrigationRepair, double
depreciationOnEquipment,double
interestOnEquipment, double landCharge, double
interestOnNonLandCost, double costChange)
Description
It loads the Cost object. Returns to true if all data passed
in is valid and load successful. Otherwise return false.
Usage: This method is used by Web client where user is
allowed to have custom income data applied to user’s
farm.
Behavior
Pre: Passed in data is valid
Pre: a record should exists in the table class represent
Post: return true load successful meaning all data valid.
Otherwise return false
Post: give user “Invalid data” message if load
unsuccessful.
4.7 CropType Class
4.7.1
Description
This class represents Crop type (e.g. Conventional, organice) and responsible to
make operation to physical data table ‘CropType. This class is used to populate Crop type
in plan configuration UI.
4.7.2
Attributes
Table 5.4.11 Attributes of CropType Class
Name
Type
Description
cropTypId Int
CropTypes’ ID
Name
Description of CropType (e.g. Conventional, Organic)
String
63
4.7.3
Operation Specification of non getter/setter/constructor method
Table 5.4.12 Operation specification of CropType Class
Name
Description
Load
Signature
public bool Load(int id)
Description
It loads the CropType object. Returns to true if data
passed in is valid and load successful. Otherwise return
false.
Behavior
Pre: Passed in data is valid
Pre: a record should exist in CropType table by the id
passed in.
Post: return true if record exists and load successful.
Otherwise return false
Post: give user “record not found” message if record
does not exists.
FindByRegion Signature
public DataTable FindByRegion(string
regionName)
Description
It finds all the CropTypes configure for a given region
and retuns the datatable.
Behavior
Pre: None
Post: return list of CropType configured for a given
region.
Post: If no CropType configured then returns null and
give user “at least one CropType needs to be configured
for a given region” message
64
4.8 YieldLevel Class
4.8.1
Description
This class represents level of Yield a farm produce (e.g. Average, High and Low).
This class is responsible to make operation to physical data table ‘YieldLevel’. Currently,
our database only have data that belongs to ‘Average’ yield level. In future, we have plan
to store Farm management guide data for other yield level as well.
4.8.2
Attributes
Table 5.4.13 Attributes of YieldLevel Class
Name
Type
Description
yieldLevelId Int
Yield Level ID
Name
Description of Yield Level (e.g. Average, High, Low)
4.8.3
String
Operation Specification of non getter/setter/constructor method
Table 5.4.14 Operation specification of YieldLevel Class
Name Description
Load
Signature
public bool Load(int id)
Description
It loads the YieldLevel object. Returns to true if data passed in is
valid and load successful. Otherwise return false.
Behavior
Pre: Passed in data is valid
Pre: a record should exist in YieldLevel table by the id passed in.
Post: return true if record exists and load successful. Otherwise
return false
Post: give user “record not found” message if record does not
exists.
65
CHAPTER 6 - SOFTWARE QUALITY ASSURANCE PLAN
1 Purpose
This document is produced to outline the necessary steps to ensure the project has an
acceptable level of quality. It will describe the necessary steps taken to ensure quality throughout
the entire life-cycle process for this project.
2 Management
2.1 Organization
Below is a listing of the organization and their roles with the MSE project for developing
CPS Software.
Developer:
Mr. Reza Nabi
Major Professor:
Dr. Daniel Andresen
Supervisory Committee:
Dr. Daniel Andresen
Dr. Mitchell Neilsen
Dr. Hikaru Peterson
Formal Technical Inspectors: Mr. Amit Borcar, Software Engineer, Sage Software
Mr. Suresh Pothuri, Software Engineer, Sage Software
2.2 Tasks
All project tasks are outlined in Project Plan document in Chapter 2.
2.3 Responsibilities
2.3.1
Developer
The developer is responsible for documentation, implementation, and testing of
this project. Three presentations will be given detailing project progress. Bi-weekly
66
meetings with the major professor are required; these meeting are also open to all
member of the committee.
2.3.2
Major Professor
The major professor is responsible for overseeing the work done by the developer.
S/he must approve all artifacts of the project and is considered the end-user for agent
Tool III’s validation. S/he will also provide guidance and advice to the developer
throughout the project’s lifetime.
2.3.3
Supervisory Committee
The supervisory committee is responsible for preparing for and attending each of
the three presentations. The committee will provide comments on the artifacts presented
during the presentation and feedback is expected at these times.
2.3.4
Formal Technical Inspector
The formal technical inspectors are responsible for completing a formal
inspection of the project framework. They will also conduct a preliminary functional
walkthrough of the project.
3 Documentation
All documentation will be available at http://cis895.nabi.us/ .
3.1 Purpose
The purpose of the project documentation is to provide a reference and timeline for this
project. Other project documentation may be required; this is at the discretion of the project
developer and major professor. The current state of the documentation will be evaluated by
the major professor within each phase of the development and must be approved by all
committee members at the conclusion of each phase.
67
3.2 Minimum Documentation Requirements
Table 6.3.1 List of documentation required for each phase
Phase I
Phase II
Phase III
Project Plan 1.0
Project Plan 2.0
Component Design 1.0
Vision Document 1.0
Vision Document 2.0
Formal Inspection Letters
SQAP 1.0
Test Plan 1.0
Project Evaluation 1.0
Formal Inspection Check List
Project Source Code
Formal Requirement Specification
User Manual 1.0
Architectural Document 1.0
Executable Project
Executable Architecture Prototype
4 Standards, Practices, Convention and Metrics
IEEE standards will be followed for documents when applicable throughout this project. C#
naming conventions and practices will be followed for all project coding. COCOMO will be
used as a cost estimate metric.
5 Reviews and Audits
All artifacts produced will be reviewed and assess by the supervisory committee. This
includes all documents and executable project code. The artifacts will be evaluated at the
conclusion of each phase, which is marked by one of the three presentations.
6 Testing
Test Plan 1.0 will out-line testing procedures and expected results of all test. Please refer to
this document for further detail.
7 Problem Reporting and Corrective Actions
All problems will be reported as a result of presentations or brought about by the major
professor. They will be compiled into an action document after each presentation and will be
resolved prior to the next presentation.
68
8 Tools, Techniques and Methodologies
Following tools will be used during the proposed CPS Software development.
• Microsoft Visual Studio .NET 2008 IDE – for coding web app and web services
• XCode – IDE for iPhone application development
• C# - for coding web app and web services
• SQL – for web app, web service and database development
• Objective C – for coding iPhone application
• Cocoa – Framework for iPhone application development
• .NET Framework 3.5 – for web app and web service development
• .MVC – design pattern to develop iPhone application and web application
• JavaScript – for coding web app
• HTML – for coding web app
• XML – for coding web app, iPhone app, web services
• CSS – for coding web app
• IIS – for web server to serve web application and web service
• MS SQL SERVER 2008 – for database server
• MS Word 2007 – for documentation
• VersionOne – for Project Planning / Tracking / Burndown chart
• USE 2.3.1 and OCL – for formal specification and verification
9 Code Control
No version control system is used for the project yet. Developer takes manual effort to
maintain different version of the source code.
10 Media Control
No formal process has been adopted to control the media for this project.
11 Record Collection, Maintenance and Retention
Two copies of all deliverables will be produced. One will be with the Major Professor, and
one will be with the developer. In addition, the entire source code, documentation, and web
pages for the project website will also be burned into CD and will be kept with the developer.
69
12 Training
If Major Professor wishes, developer will be conducting the training to the farmers/users.
13 Risk Management
Both the developer and Major Professor have primary responsibility for identifying and
mitigating risks during the project. Any risks identified during the development will be reported
at each weekly meeting/report.
70
CHAPTER 7 - TEST PLAN
1 Introduction
This document provides the plan for testing all the features (outlined in section 3.1 and
section 3.2 in vision document, Chapter 1) of Crop Profitability Simulator (CPS) software. The
document will also describe the activities and environment related to testing the software.
2 Test Items
•
CPS Web application features stated in section 3.1 in vision document, Chapter 1.
•
CPS iPhone application features stated in section 3.2 in vision document, Chapter 1.
3 Tested Features
All features of CPS Web application and CPS iPhone application will be tested. The features
are outlined in section 3.1 (Web application) and section 3.2 (iPhone application) in CPS Vision
Document, Chapter 1.
4 Features Not To Be Tested
Non functional requirements outlined in section 4 in vision document, chapter 1, will not be
tested.
5 Approach
To test the CPS Software, the user will perform a set of actions or “Test Scenarios”. The
scenarios will be evaluated by the visual results of the action performed. The user will verify the
result of each scenario with the “Expected Outcome” provided in section 10, Testing Task.
6 Item Pass/Fail Criteria
For reach requirement, a test suite is provided in section 10, Testing Task. Each test suite will
be considered successful if the outcome met the requirement stated in vision document and the
result matches the expected outcome stated in test suite.
71
7 Suspension Criteria and Resumption Requirement
7.1 Suspension Criteria
If a test case fails, all further testing will be suspended and failure will be logged into the
testing log document, a deliverable for the tester.
7.2 Resumption Requirement
For post test case failure, testing will resume only after the failure has been logged in test
log document and the solution of the failure is found and the fix is included in the source
code as well as in the build.
8 Test Deliverables
The deliverables that will be produced by the tester upon completing test of CPS Software
are: (i) Test Log (ii) Test Plan
Each test must be recorded as either as “pass” or “fail”. All failed test will contain detailed
description of the failure, date, time along with comments, if any.
9 Testing Tasks
9.1 CPS Web Application Testing Tasks
Table 7.9.1 Test Suite #1 [SR 3.1.1 Home]
Test #
Description
Expected Outcome
TS1.1
Using your favorite browser
The main home page should be
hit the CPS web app at
loaded successfully without any
http://home.nabi.us/CpsWeb/ error.
TS1.2
Click on each hyper links
All links should render page
located on top navigation bar without any errors.
of the main Home page
TS 1.3
Click on Crop Profitability
It will bring up Simulator
Simulator image.
application without any error.
72
Actual Outcome
Table 7.9.1 Test Suite #2 [SR 3.1.2 FAQ]
Test #
Description
Expected Outcome
TS2.1
Clink on ‘FAQ’ link
FAQ page should be loaded
located on the top
without any error.
Actual Outcome
navigation bar.
TS2.2
Click on each questions of
It should render the answer of the
FAQ page.
question you have just clicked.
Table 7.9.3 Test Suite #3 [SR 3.1.3 Contact Us]
Test #
Description
Expected Outcome
TS3.1
Clink on ‘Contact Us’ link
The Contact Us page should be
located on the top
loaded with contact information
navigation bar.
which should include phone,
Actual Outcome
email, name and physical address.
TS3.2
Click on the email link
It should automatically load your
given in the contact us
default email client populated
page.
email address in « To » field.
Table 7.9.4 Test Suite #4 [SR 3.1.4 About CPS]
Test #
Description
Expected Outcome
TS4.1
Clink on ‘About CPS’ link
The About CPS page should be
located on the top
loaded without any error. The
navigation bar.
information should contain name
of the product, version and copy
write information.
73
Actual Outcome
Table 7.9.5 Test Suite #5 [Covers from SR 3.1.5.1 to SR 3.1.5.4]
Test #
TS5.1
Description
Expected Outcome
Click on ‘Simulator’ link
The simulator should load without
located at the top
any errors.
navigation bar.
TS5.2
In the location of the land
Nothing should change at the UI
drop down list, change
region to North West.
TS5.3
Click on the
icon next
to location of the land drop
Greater Kansas map should be
displayed.
drown.
TS5.4
Click on ‘X’ hyperlink
Popup window should be closed.
located on the top right
corner of the popup
window just opened in
TS5.3
TS5.5
In Plan1 tab, select number
Based on your selected value, page
of Crop that you would like should be updated with Crop, Crop
to configure for your plan.
System, Land Type and Total area
for each crop with default value
populated. A summary table
should also be displayed on the
right along with « Expected
Variation » table on the top.
TS5.6
In the Crop drop down,
When the crop or crop system or
change selected default
land type or total acres changes,
Crop to something else. In
information of the summary table
addition to changing crop,
should be update instantaneously.
you may also change other
values like Crop System,
74
Actual Outcome
Land Type and Total
Acres, if you like.
TS 5.7
Click on
icon and
Clicking on
change values of either
icon will display
default values of Income and Cost
Income or Cost that may be in details. Changing any value
appropriate for your farm.
should automatically update the
summary table instantaneously as
well.
TS5.8
TS5.9
In the « Expected
With the expected variation value
Variation » form, enter any
given in yield field, you will see
number (e.g. 5) in the yield
graph with highest and lowest
field and press ‘Tab’ in
points. The return over cost table
your keyboard. Now, click
should have value represented in
on ‘Summary Details’ tab.
the graph.
Click on ‘Plan1’ tab, clear
Without any value in the expected
the yield value you have
variation, you should see a
entered in TS5.8 and hit
horizontal line in the graph. The
‘Tab’ key in your
value of High, Mean and Low
keyboard. Now, click on
should be the same in « Return
‘Summary Details’ tab.
Over Cost » table.
TS5.10 In the « Summary Details » It will bring up your print dialogue
tab, click on the
icon.
TS5.11 To compare multiple plans
and you should be able to print.
As you configure multiple plans,
side by side, click on
you will see that summary table is
‘Plan1’ tab, configure your
added/updated all the plans you
plan. Enter the appropriate
have configured.
expected variation values
may be applicable to your
estimate. Then, Click on
‘Plan2’ and configure the
way you like.
75
TS5.12 Assumed that you have
You will see return over cost with
configured multiple plans.
highest and lowest profit (if
Click on ‘Summary
expected variation is provided) for
Details’ tab.
all plans side by side along with
the bar graph.
9.2 CPS iPhone Application Testing Tasks
Table 7.9.6 Test Suite #6 [Covers SR 3.2.1.1 to SR 3.2.14]
Test #
TS6.1
Description
Load the CPS iPhone app
Expected Outcome
CPS iPhone will be loaded with
either via iPhone simulator. two plans and summary tab. By
Note: Testing machine will
default ‘Plan One’ will be selected
need to have internet
listing the entire region available
access to communicate
in our database.
with backend server via
web services.
TS6.2
Click on the Summary tab
You will see dialogue popup with
without configuring any
the following information :
plan.
Incomplete plan. Please configure
at least one plan to view the
summary.
TS6.3
Click on ‘Plan One’ tab
Application will load plan one
and click on ‘North West’
detailed configuration form
region.
without any error with some
default value for users’
convenience.
TS6.4
Click on the button with
This should bring up a window
down arrow next to Crop.
where user can select the crop of
his plan.
76
Actual Outcome
TS6.5
Click on the button with
User should be able to select the
down arrow next to
land type and crop system without
LandType and Crop
any error.
System.
TS6.6
In the expected variation
You should see « Return Over
form of plan one, enter
Cost » table populated with high,
some number (e.g. 5) in
low and mean value returned from
yield field. Then click on
the backend server via web
‘Summary’ tab.
service.
TIPS: Regarding closing
the number pad, after
typing or selecting number
from the number pad, you
need to hit enter to close
the number pad.
TS 6.7
Click on ‘Plan Two’ tab
With the second plan configured,
and configure another crop
you will see that summary page is
with the crops system, land
updated with the high, low and
type, total acre and
mean value of the second plan.
expected variation you
like. Then click on
‘Summary’ tab
TS6.8
Note down the plan one
Verify that the high, mean and low
and plan two
value in the « Return Over Cost »
configurations you have
table in both CPS iPhone
performed. Do the same
application and CPS Web
configuration using CPS
application is the same.
Web application.
77
10 Environmental Needs
10.1
Environmental needs of CPS Web Application
To test the CPS Web application, the web application and the web service need to be
deployed on a Windows 2008 server running IIS. If a Windows 2008 server is not available,
any other operating system with IIS and .NET frame work 3.5 installed should be fine. Also a
database, SQL Server 2008 or SQL Server 2005, is required.
10.2
Environmental Need of CPS iPhone Application
To officially package the iPhone application, we need to pay an IDP (iPhone Developer
Program) membership fee $99 to Apple. Since we don’t have the IDP membership, the only
official way we can test is by using an iPhone simulator built-in within XCode, the IDE to
develop iPhone application. Hence, to test the CPS iPhone application, Leopard (OSX 10.5)
or higher is needed with Coacoa framework and Xcode installed. The machine where the
iPhone app is deployed, needs to have access to the Windows box where the web service is
deployed.
78
CHAPTER 8 - ASSESMENT EVALUATION
1 Introduction
This chapter provides the results of functional testing of CPS Software and performance
testing. The test cases are based on the Test Plan 1.0 document produced in Phase II.
2 Test Results Summary
Table 8.2.1 Test results summary
Software Component
Test Case
Requirements Tested
Results/Comments
CPS Web App
TS-01
SR 3.1.1
Pass
TS-02
SR 3.1.2
Pass
TS-03
SR 3.1.3
Pass
TS-04
SR 3.1.4
Pass
TS-05
SR 3.1.5.1, SR 3.1.5.2, SR
Pass
3.1.5.3, SR 3.1.5.4
CPS iPhone App
TS-06
SR 3.2.1.1, SR 3.2.1.2, SR
Pass
3.2.1.3, SR 3.2.1.4
3 Detailed Test Results
3.1 Test Results of CPS Web Application
Table 8.3.1 Test Results of Test Suite #1 [TS-01]
Test #
Description
Expected Outcome
Actual Outcome
TS1.1
Using your favorite browser
The main home page should be
Loaded
hit the CPS web app at
loaded successfully without any
successfully.
http://home.nabi.us/CpsWeb/ error.
TS1.2
Click on each hyper links
All links should render page
All links were
located on top navigation bar without any errors.
clicked and
of the main Home page
loaded
successfully
79
TS 1.3
Click on Crop Profitability
It will bring up Simulator
Simulator
Simulator image.
application without any error.
application
loaded
successfully.
Table 8.3.2 Test Results of Test Suite #2 [TS-02]
Test #
Description
Expected Outcome
TS2.1
Clink on ‘FAQ’ link
FAQ page should be loaded
FAQ page is
located on the top
without any error.
loaded
navigation bar.
TS2.2
Actual Outcome
successfully.
Click on each questions of
It should render the answer of the
Clicking on the
FAQ page.
question you have just clicked.
question
rendered the
answer.
Table 8.3.3 Test Results of Test Suite #3 [TS-03]
Test #
Description
Expected Outcome
Actual Outcome
TS3.1
Clink on ‘Contact Us’ link
The Contact Us page should be
‘Contact Us’
located on the top
loaded with contact information
page loaded
navigation bar.
which should include phone,
successfully. It
email, name and physical address.
also displayed
email, phone and
physical address.
TS3.2
Click on the email link
It should automatically load your
It fired up the
given in the contact us
default email client populated
email client with
page.
email address in « To » field.
email address
populated on
recipient list.
80
Table 8.3.4 Test Results of Test Suite #4 [TS-04]
Test #
Description
Expected Outcome
Actual Outcome
TS4.1
Clink on ‘About CPS’ link
The About CPS page should be
Page loaded
located on the top
loaded without any error. The
successfully. It
navigation bar.
information should contain name
contains product
of the product, version and copy
name, version
write information.
and copy write
information.
Table 8.3.5 Test Results of Test Suite #5 [TS-05]
Test #
TS5.1
Description
Expected Outcome
Actual Outcome
Click on ‘Simulator’ link
The simulator should load without
Simulator loaded
located at the top
any errors.
without any
navigation bar.
TS5.2
error.
In the location of the land
Nothing should change at the UI
No change on UI
Greater Kansas map should be
Kansas state map
displayed.
was displayed.
Popup window should be closed.
Clicking on ‘X’
drop down list, change
region to North West.
TS5.3
Click on the
icon next
to location of the land drop
drown.
TS5.4
Click on ‘X’ hyperlink
located on the top right
link closed the
corner of the popup
popup window.
window just opened in
TS5.3
TS5.5
In Plan1 tab, select number
Based on your selected value, page System provided
of Crop that you would like should be updated with Crop, Crop crop
to configure for your plan.
System, Land Type and Total area
configuration
for each crop with default value
form
populated. A summary table
dynamically
81
should also be displayed on the
based on the
right along with « Expected
number of crop
Variation » table on the top.
is picked. It also
displayed the
summary table as
well with default
cost and income
data.
TS5.6
In the Crop drop down,
When the crop or crop system or
Changed crop,
change selected default
land type or total acres changes,
total acres of
Crop to something else. In
information of the summary table
land, crop
addition to changing crop,
should be update instantaneously.
system and land
you may also change other
type. Summary
values like Crop System,
table was
Land Type and Total
updated
Acres, if you like.
instantaneously
when values
were changed.
TS 5.7
Click on
icon and
change values of either
Clicking on
icon will display
default values of Income and Cost
When plus icon
is clicked, it pull
Income or Cost that may be in details. Changing any value
down editable
appropriate for your farm.
should automatically update the
costs and income
summary table instantaneously as
values. Upon
well.
changing costs
and income
values, it
updated the
summary table
instantaneously.
TS5.8
In the « Expected
With the expected variation value
Entered 5 in
Variation » form, enter any
given in yield field, you will see
expected
82
number (e.g. 5) in the yield
graph with highest and lowest
variation form
field and press ‘Tab’ in
points. The return over cost table
and clicked on
your keyboard. Now, click
should have value represented in
‘Summary
on ‘Summary Details’ tab.
the graph.
Details’ tab.
Noticed that
graph had
highest and
lowest point.
TS5.9
Click on ‘Plan1’ tab, clear
Without any value in the expected
Cleared entered
the yield value you have
variation, you should see a
value in TS5.8
entered in TS5.8 and hit
horizontal line in the graph. The
for “Plan 1”.
‘Tab’ key in your
value of High, Mean and Low
Clicked on
keyboard. Now, click on
should be the same in « Return
‘Summary
‘Summary Details’ tab.
Over Cost » table.
Details’ and
verified that
graph shows
horizontal line
without any
highest and
lowest point.
TS5.10 In the « Summary Details » It will bring up your print dialogue
tab, click on the
icon.
and you should be able to print.
It fired up print
dialogue and
able to print
successfully.
TS5.11 To compare multiple plans
As you configure multiple plans,
Configured both
side by side, click on
you will see that summary table is
“Plan 1” and
‘Plan1’ tab, configure your
added/updated all the plans you
“Plan 2”.
plan. Enter the appropriate
have configured.
Noticed that
expected variation values
while
may be applicable to your
configuring
estimate. Then, Click on
plans, summary
83
‘Plan2’ and configure the
tables were
way you like.
added
automatically.
TS5.12 Assumed that you have
You will see return over cost with
After
configured multiple plans.
highest and lowest profit (if
configuring
Click on ‘Summary
expected variation is provided) for
“Plan 1” and
Details’ tab.
all plans side by side along with
“Plan 2” with
the bar graph.
expected
variation, system
display both
plans side by
side in the graph
as well as
“Return over
Cost” table.
3.2 Test Results of CPS iPhone Application
Table 8.3.6 Test Results of Test Suite #6 [TS-06]
Test #
TS6.1
Description
Load the CPS iPhone app
Expected Outcome
CPS iPhone will be loaded with
Actual Outcome
CPS iPhone App
either via iPhone simulator. two plans and summary tab. By
loaded
Note: Testing machine will
default ‘Plan One’ will be selected
successfully. It
need to have access to the
listing the entire region available
loaded with 2
machine that has web
in our database.
plans. Default
service installed.
was “Plan 1”
which loaded all
the regions to
pick to configure
the plan.
TS6.2
Click on the Summary tab
You will see dialogue popup with
84
Clicked on the
without configuring any
the following information :
‘Summary’ tab
plan.
Incomplete plan. Please configure
and system gave
at least one plan to view the
warning “Please
summary.
configure at least
one plan to view
the summary”.
TS6.3
Click on ‘Plan One’ tab
Application will load plan one
Clicked on ‘Plan
and click on ‘North West’
detailed configuration form
One’ and then
region.
without any error with some
clicked on
default value for users’
‘North West’
convenience.
region. System
displayed the
detailed plan
configuration
page.
TS6.4
Click on the button with
This should bring up a window
Clicking on
down arrow next to Crop.
where user can select the crop of
‘Down Arrow’
his plan.
displayed the list
of crops. Able to
select the crop
by clicking the
‘OK’ button.
TS6.5
Click on the button with
User should be able to select the
Able to select or
down arrow next to
land type and crop system without
change Crop
LandType and Crop
any error.
System and Land
System.
Type using the
down arrow
button as well
without any
error.
TS6.6
In the expected variation
You should see « Return Over
85
Entered 5 in the
TS 6.7
form of plan one, enter
Cost » table populated with high,
yield field and
some number (e.g. 5) in
low and mean value returned from
click on the
yield field. Then click on
the backend server via web
summary.
‘Summary’ tab.
service.
Noticed that it
TIPS: Regarding closing
displayed the
the number pad, after
High and Low
typing or selecting number
value in the
from the number pad, you
“Return Over
need to hit enter to close
Cost” table in
the number pad.
Summary tab.
Click on ‘Plan Two’ tab
With the second plan configured,
Plan Two
and configure another crop
you will see that summary page is
configured.
with the crops system, land
updated with the high, low and
Clicked on the
type, total acre and
mean value of the second plan.
Summary and
expected variation you
verified that
like. Then click on
“Return Over
‘Summary’ tab
Cost” was
updated
automatically for
newly
configured Plan
Two.
TS6.8
Note down the plan one
Verify that the high, mean and low
Verified that data
and plan two
value in the « Return Over Cost »
in the “Return
configurations you have
table in both CPS iPhone
Over Cost” is
performed. Do the same
application and CPS Web
identical for both
configuration using CPS
application is the same.
web and iPhone
Web application.
app.
86
4 Performance Testing
To produce a quality product, it is imperative to execute performance testing in order to
determine speed, scalability, and/or stability characteristic of the system. In performance testing
we mostly concentrate on response times, throughput, and resource level utilization. The
performance testing helps to identify bottlenecks in the system, establish a baseline for future
testing, support performance tuning efforts, and determine compliance with performance goals
and requirements. In this scenario, the tool “Jakarta Jmeter” is used to do the performance
testing, especially the load testing of the system for two components – web services and web
pages and compare the response time.
4.1 Response Time Comparison of Web Services
The service oriented CPS Software communicates with database via DALC and BLLC
via web services. Below is the comparison of three major web services along with
observation notes.
Table 8.4.1 Response times by number of user for major web services
Number of Users
GetPlanSummary
GetCPSAnalysis
CropsByRegion
100
347
327
264
500
1042
986
791
1000
2866
2252
6093
3000
9018
6093
4828
87
Figure 8.4.1 Performance testing graph of CPS Web Services
Observation: We have captured response times of major web services for 100, 500, 1000
and 3000 users with 1 loop count and 5 ramp-up periods. Since GetCpsPlanSummary web
service does some extra computation to display calculated summary, hence, it takes little
more time which makes sense. With 1 loop count (more loop count will bring the response
time even lower due to caching) and 3000 users, the highest response time is less than 1 sec
which is very much acceptable. I wanted to take some more sample with users like 6000,
10000 etc, but due to the limitation of Jmeter, anytime I picked more than 3000 user, Jmeter
was throwing java exception. The above stats was taken from home workstation which has
very limited resources, couple of years old machine with 2 GB RAM. Deployment of web
service to a production level server, response time will decrease significantly.
4.2 Response Time Comparison of Major Web Pages
This section compares response times of main CPS Web app (Simulator.aspx) and two
other major web pages which are FAQ and Home followed by observation note. All test
cases used 5 loop count and 5 second ramp-up period.
88
Table 8.4.2 Response times by number of user for major web pages
Number of Users
Simulator App
FAQ Page
Home Page
20
45
18
3
50
3958
499
265
100
5070
1197
678
200
6617
3058
1215
500
10766
8544
3265
1000
1893
18823
6179
Figure 8.4.2 Performance testing graph of major CPS Web Pages
Observation: We have captured response times of major web pages for 20, 50, 100, 200,
500 and 1000 users with 5 loop count and 5 second ramp-up periods. Simulator app is the
main CPS web application which loads all the required data when first time page loads. This
helps to do client side computing for the subsequent request. The size of Simulator page is
89
almost 49KB, which is pretty good size. This is why for 1000 users with 5 secs ramp-up,
response time is around 18 secs. The above stats was taken from home workstation which has
very limited resources, couple of years old machine with 2 GB RAM. Deployment of CPS
web application to a production level server and having a dedicated DB server, can surely
bring the response time down to less than 10 secs for 1000 users. Notice that response time of
FAQ page is higher than Home page. This is because of the size of the FAQ page which is
28KB with all questions, answers along with lots of images.
4.3 Comparison of Response Time of 1000 users with different ramp-ups
This section provides comparison of response times of having 1000 users using the
system with different ramp-ups. The main goal of this test is to verify for 1000 users what
would be limit of ramp-ups to have an acceptable response time.
Table 8.4.3 Response times by ramp-up period with 1000 user for major web pages
Ramp-up Periods
Simulator App
FAQ Page
Home Page
5
31371
19173
5043
25
22602
19107
5913
50
10653
7083
5360
100
47
18
2
Figure 8.4.3 Performance graph with various ramp-ups for 1000 user
90
Observation: As per the result of the above test, if 1000 users access the system within
50 secs (less than 1 min), response time becomes 5 sec with my low-end machine. If 1000
users access the system within 100 secs (less than 2 mins), response time is very low, which
is great. This tells us that for sudden burst of having 1000 new user within a minute, system
should be able handle it very gracefully, response time with 5 sec even with poor machine
like the developer’s. With a production level server and having a dedicated DB server, can
surely bring the response time down to 1 or 2 secs.
4.4 Throughput of 1000 users with 5 loop count and 5 sec ramp-up
This section displays graph result along with summary table of a test ran with 1000 user,
5 loop count and 5 sec ramp-up period which is also plotted in the section 4.1 graph
(Performance testing with major web pages).
The throughput found in this test, 3996/min supports earlier finding in section 4.3 where
we concluded that the CPS Software should have no problem entertaining sudden burst of
couple thousand users within 1 to 2 minutes (i.e. 60 to 120 ramp-up secs).
Figure 8.4.4 Graph results of 1000 users with 5 loop count and 5 secs ramp-up
91
Figure 8.4.5 Summary Report of 1000 users with 5 loop count and 5 secs ramp-up
Overall Observation: With the above 4 scenarios, it is clear that with the current
architecture and having the system deployed in mid-end machine, software should be able to
handle 1000 (one thousand) users very easily. With having CPS Software deployed in good
production level machine with dedicated DB server, it can certainly entertain sudden burst of
couple of thousands users within 1 to 2 mins of time without any difficulty.
5 Unit Testing
In an effort to maintain the quality of the code as well as to maintain the quality of the
Service Oriented CPS Software, unit tests were added to the source code and tested by the
developer. The scope of the unit tests were limited to the Web Service Component only.
Since the framework for unit testing is already in place adding unit tests for other
components should be very easy and straight forward. Below is the screenshot of the result of
the unit tests of all web services.
92
93
CHAPTER 9 - USER MANUAL
1 Introduction
The Whole Farm CPS Software allows farmers in Kansas and surrounding states to assess
market risks for multiple farming plans, including conventional and organic farming methods.
In addition to the default values based on Kansas Farm Management Guides, the Simulator
allows you to customize your calculations to your individual situations in terms of specific
revenue and cost items and possible variability in price, yield, and cost. The whole farm
profitability for multiple plans will be summarized in tabular format (and Graph for web client)
for easy comparison. Detailed feature is available in section 3, Software Operation.
Figure 9.1.1 CPS Software Highlights
94
2 Software Installation
This section provides required hardware, software and installation process of CPS Software.
2.1 Required Hardware
•
DB Server: Server should be equipped with at least 2.4 GHz CPU clock speed, 2 GB
RAM and 120 GB Hard drive.
•
Web Server: Server should be equipped with at least 2.4 GHz CPU clock speed, 2
GB RAM and 120 GB Hard drive.
•
iPhone Simulator: Since iPhone client needs to be packaged by Apple Developer
Program and we don’t have the subscription yet, for now, we need Mac pc or
Macbook, to test CPS iPhone client using built-in iPhone simulator in XCode.
NOTE: If client have limited resources, one physical machine with 4GB RAM and 250
GB hard drive playing both DB server and web server role should be sufficient as well.
2.2 Required Software
2.2.1
Required Software CPS Web App
•
Microsoft Windows 2008 Server with Web Server role
•
MS SQL Server 2008 or MS SQL Server 2005
•
CPS Web Client MSI Package, Available online at
http://home.nabi.us/CpsWeb/docs/PhaseIII/Setup/CpsWebClientSetup.msi
•
CPS Web Service MSI Package, Available online at
http://home.nabi.us/CpsWeb/docs/PhaseIII/Setup/CpsWebServiceSetup.msi
•
CPS Database Installation Scripts, available online at
http://home.nabi.us/CpsWeb/docs/PhaseIII/Setup/DatabaseSetup.zip
2.2.2
Required Software CPS iPhone App
•
Mac OS 10.5 or Higher
•
Apple iPhone Development Kit 3.0 or Higher
•
XCode (IDE)
•
CPS iPhone Client, Available online at
http://home.nabi.us/CpsWeb/docs/PhaseIII/Setup/iPhoneClient.zip
95
NOTE: When iPhone application will be packaged by Apple, none of the above software
is required. All we need is iPhone or iPod Touch with deployable CPS iPhone
Application package.
2.3 Install CPS Software and Setup
This section provides steps to load the database, setup web client, web service and iPhone
application.
2.3.1
1
Load Database
Download and unzip the Database Installation scripts available online at
http://home.nabi.us/CpsWeb/docs/PhaseIII/Setup/DatabaseSetup.zip
2
Load SQL Server Management Studio and create a database called ‘CPS’.
96
3
Load the CPS Schema by executing CreateSchema.sql which is available under
DatabaseSetup folder.
97
4
Load the CPS data by running LoadData.bat like the following.
5
Verify that there is no error in LoadResults.txt file. Healthy logfile may look like
the following.
98
2.3.2
1
Install CPS Web Application
Download the CPS Web Client MSI Package, Available online at
http://home.nabi.us/CpsWeb/docs/PhaseIII/Setup/CpsWebClientSetup.msi
2
Double-click the CpsWebClientSetup.msi file and load the CPS Web Client 1.0
setup wizard
3
Click on ‘Next’ button to continue
4
Provide the installation address you like and click ‘Next’ to continue. By default,
CPSWebClient is set as virtual directory for the web application. You may
change it to any meaningful name you like (e.g. CPSWeb).
99
5
Click ‘Next’ to begin installation.
100
6
CPS Web Application (Client) installation complete. Click on ‘Close’ to exit the
setup wizard.
101
2.3.3
1
Install CPS Web Service
Download the CPS Web Service MSI Package, Available online at
http://home.nabi.us/CpsWeb/docs/PhaseIII/Setup/CpsWebService.msi
2
Double-click the CpsWebServiceSetup.msi file and load the CPS Web Service
1.0 setup wizard
3
Click on ‘Next’ button to continue
4
Provide the installation address you like and click ‘Next’ to continue.
102
5
Click ‘Next’ to begin installation.
103
6
CPS Web Service installation is complete. Click on ‘Close’ to exit the setup
wizard.
104
2.3.4
1
Install CPS iPhone Client
Download CPS iPhone Application Source Code, Available online at
http://home.nabi.us/CpsWeb/docs/PhaseIII/Setup/iPhoneClient.zip, to MacBook or
Mac PC where iPhoneSDK 3.0 (or higher) and XCode is installed.
2
Open up CPS-Info.plist file and make sure SeriveURL is pointed to the correct
address where you have installed in section 2.3.3.
3
Double click on CPS project file (CPS.xcodeproj) and load the iPhone
application on XCode IDE.
4
Click on “Build and Go” to load the CPS iPhone Application using iPhone
Simulator.
105
3 CPS Software Operation
This section provides instructions on how to use the CPS Software.
3.1 CPS Web Application Operation
3.1.1
Home (Main Home Page)
Using your favorite browser hit the address where you have installed the CPS Web
Application (Client). Developer’s CPS Web application (Client) is accessible at
http://home.nabi.us/CpsWeb/Default.aspx
3.1.2
FAQ
From the main home, click on ‘FAQ’ hyper link, to load FAQ page. Click on question
to view the answer of the question.
106
3.1.3
Contact Us
Click on ‘Contact us’, link view the contacts of general questions or comments.
107
3.1.4
About CPS
Click on ‘About CPS’ link to view the name of the product, version and copyright
information.
3.1.5
Simulator
Click on ‘Simulator’ link to bring up the main Crop Profitability Simulator [CPS]
application.
108
3.1.5.1
Configure a Plan
Configuring a plan is a 4 step process:
o Select location of the land.
o Select how many crops you would like to include in this plan
o Enter Crop, Crop System, Land Type and Crop Acre for each crop
o Enter Expected Variation if you would like to see best and worst scenario of
your profit (return over cost).
109
3.1.5.2
View Summary
As user configures a plan, Summary is updated automatically.
3.1.5.3
Expected Variation
For each plan, there will be an “Expected Variation” table where user can enter
“Yield”, “Cost” and “Price” that can vary at user’s farm. The expected variation data
helps to the best and worst estimate of profit along with the average.
110
3.1.5.4
Comparing Multiple Plans
Configure multiple plan and then click on ‘Summary Details’ tab. This will
display comparison of plans you have configured side-by-side.
111
112
3.1.5.5
Summary Details and Print
The summary along with its breakdown will be available for each plan in the
“Summary Details” tab. The whole farm profitability (return over cost) for multiple
plans will also be summarized in a graph for easy comparison with best/worst
estimates when expected variation value is entered. User may print the detailed report
by clicking on ‘Print’
icon.
113
3.2 CPS iPhone Application Operation
3.2.1
Simulator
Since the iPhone application is not packaged by Apple yet (which requires
membership with Apple), the only way we can operate the iPhone application is via
simulator built-in XCode, an IDE for iPhone development. To launch the CPS iPhone
application, do the following:
•
Configure the Web Service URL for the iPhone Application. To do this, open CPSInfo.plist file and change the value of ServiceURL parameter that applies to your
installation.
•
Load the project by double clicking CPS.codeproj file
114
•
Click on ‘Build and Go’ icon.
115
3.2.1.1
Configure a Plan
Configuring a plan is a two step process.
o Select a region (e.g. North Central)
o For convenience all fields are populated except “Expected Variation”. Change
the value of Crop, Land Type, Crop System and Crop Acre that apply to your
farm.
3.2.1.2
Configure Crops, Crop System and Land Type
To change Crop, Crop System and Land Type, tap the down arrow button. This
will invoke a selection list. Select the desired value and tap the ‘OK’ button. Below
are few screenshots.
116
117
3.2.1.3
Expected Variation
For each plan, there will be an “Expected Variation” table where the user can
enter “Yield”, “Cost” and “Price” that can vary at the user’s farm. The expected
variation data helps estimate the best and worst of potential profit along with the
average. To enter expected variation data, type a number and tap ‘Done’. Selecting
‘Done’ will cause the number pad to disappear.
3.2.1.4
Plan Comparison and Summary
To view a plan comparison side by side, configure both Plan 1 and Plan 2. Then
select the ‘Summary’ tab. The system should display a “Return Over Cost” summary
table, if an expected variation value is entered a the system will also display best and
worst scenarios.
118
119
4 FAQ and Troubleshooting
This section provides information on frequently asked problems and how to troubleshoot the
reported problem.
4.1 CPS iPhone Frequently Asked Question (FAQ)
4.1.1
When launching the iPhone application, I get service not available error.
What should I do?
Answer: Open CPS-Info.plist file and make sure the ServiceURL and Service
Namespace is configured correctly as per your installation.
120
4.1.2
When I click on ‘Summary’, I get Incomplete Plan. What should I do?
Answer: To display summary, system requires at least one plan to be configured.
Please click on either Plan One or Plan Two, select a region, and enter all required
values like Crop, Crop System, Land Type and Total Acre. Then, click on
‘Summary’ tab.
4.1.3
I have found a bug with the Application. What should I do?
Answer: Please contact either Dr. Andresen [[email protected]] or Dr. Hikaru
[[email protected]] or Reza Nabi [[email protected]]. We will address it in our next
release.
121
4.1.4
I have an enhancement request. Who should I contact?
Answer: Please contact either Dr. Andresen [[email protected]]
or Dr. Hikaru
[[email protected]] or Reza Nabi [[email protected]]. We will address it in our next
release.
4.1.5
I am having problem Installing CPS iPhone application. What should I do?
Answer: Please contact Reza Nabi [[email protected]]. We will help you to resolve
the problem you are encountering.
4.1.6
I want to install this CPS iPhone application to real iPhone device. How can I
do that?
Answer: As soon as we package CPS iPhone application via apple, you should be
able to download and install the application to either iPhone or IPod touch from
Apple store. We have plan to do this over the summer. Stay tuned!
4.2 CPS Web Application FAQ
A detailed version of the Fequently Asked Questions (FAQ) section is available for the
Web application. To access the FAQ page, load the CPS web application and click on ‘FAQ’
link.
122
CHAPTER 10 - PROJECT EVALUATION
1 Introduction
This chapter presents the summary of experiences gained during the entire life cycle of the
MSE project.
2 Problems Encountered
2.1 Learning Objective-C, Coacoa, XCode & the world of iPhone Development
I have never owned a Mac, and I have never used a Mac until this project. I had to start
from scratch, learning the basic OS functionality through development of applications. In
addition, I had to learn Objective-C. The language has different styles and flavor, nothing
like Java or C#. I always enjoy learning new things and I enjoyed learning Objective-C as
well.
2.2 Apple’s UIViewPicker, an alternate solution of Combobox, Not Usable
To select an item from a list, Apple has a control called UIViewPicker. This is very bulky
and not good looking at all. For CPS application, I had to come up with a custom control like
ComboBox to save real-estate.
2.3 Hiccup to performance testing using WebService (SOAP) sampler
While executing my performance testing, I was able to run the load tests for web pages
with no issues. However when I attempted performance test on accessing the web service
only, it didn’t work. After couple of hours of trial and error, found that there was a bug in the
version I was using. After downloading the latest version from the Sun website it worked
great.
2.4 USE Model and OCL
I learned USE and OCL in CIS771, Software Specification course. I had to brush-up on
my USE and OCL skills.
123
3 Source Lines of Code (SLOC)
My initial estimate of source line of code in Phase II was 5500 LOC (Web: 2500 + iPhone:
2000). After finishing the project, I used the LocMeter tool to count SLOC. It turned out that my
estimate was off. Section 3.1 and 3.2 provides the SLOC of Web app and iPhone app given by
LocMeter Tool.
3.1 SLOC of CPS Web App
Total SOLC reported by LocMeter: 5185
Table 10.3.1 SLOC of CPS Web app
Figure 10.3.1 SLOC Distribution of CPS Web App
124
3.2 SLOC of CPS iPhone App
Total SOLC reported by LocMeter: 3678
Table 10.3.2 SLOC of CPS iPhone App
Figure 10.3.2 SLOC Distribution of CPS iPhone App
4 Project Duration & Burndown
This project was planned to finish by the end of the spring semester. The project proceeded
smoothly, without any major hiccups. Below is the duration of the project along with the
burndown chart which clearly shows that in Phase II and III, project was ahead of schedule.
125
Table 10.4.1 Project Duration and Burndown
Phase
Start Date
Finish Date
Phase I
01/15/2010
02/15/2010
Phase II
2/16/2010
04/06/2010
Phase III 04/07/2010
How well did it go? [Burndown Chart]
05/04/2010
126
5 Lessons Learned
•
Working and understanding USE, OCL and core UML notations used to draw
architectural diagrams.
•
Being that person responsible for everything, this project gave me great experience of
playing every role required to develop and release software.
•
Learned IEEE standard of various documents which were required to produce in each
phase. I learned a lot while producing various deliverables using IEEE standards.
•
This project gave me a chance to learn Service Oriented Architecture and implement a
model solution ensuring the highest level of software reuse and Interoperability.
•
From not knowing anything about the Mac operating system, this project gave me great
opportunity to learn and develop a full-fledge application integrated with various
platforms.
•
This project also gave me a great knowledge and experience to integrate software
between rival technologies like Microsoft and Apple.
6 Conclusion & Future Work
In this project, we developed fully functional CPS Software based on core Service Oriented
Architecture. The CPS Software is deployable on multiple platforms and accessible via both web
browser (universal client) and iPhone (or iPodTouch) reusing the same server components, as
well as leveraging open standards like XML, SOAP, WSDL and UDDI. In this project, we
proved that SOA is not a buzzword; it is real when it comes to achieving the highest level of
interoperability, loosely coupled integration, modularity, and software reuse.
Future works of this project are comprised of two parts: first, get an Apple Developer
Membership and package the iPhone client code so that it can be deployed on an actual iPhone
device with ease; second, I would add more features to the iPhone client, allowing users to enter
their custom data and view summary details.
127
References
[1] Stephen G. Kochan. Programming in Objective-C 2.0 A complete introduction to the
Objective-C language for Mac OS X and iPhone development. Addision-Wesley 2009
[2] Aaron Hillegass. Cocoa Programming for Mac OS X. Addision-Wesley 2008
[3] Apple. iPhone Development Center [Online]. Available: http://developer.apple.com/iPhone
[Accessed: January 2010]
[4] Apple. iPhone human interface guidelines [Online]. Available:
http://developer.apple.com/iPhone/library/documentation/UserExperience/Conceptual/MobileHIG/Introdu
ction/Introduction.html [Accessed: January 2010]
[5] Parichat Pasatcha, Komrhon Sunat. A Distributed e-Education System Based on the Service
Oriented Architecture. IEEE Computer Society, 2008.
[6] Guillermo Licea, Leocundo Aguilar, Reyes Juárez-Ramírez, Luis G. Martínez. iPECH: a
framework for generating views in iPhone/iPod touch applications. IEEE Computer Society,
2009
[7] Hongqi Li, Zhuang Wu. Research on Distributed Architecture Based on SOA. IEEE
Computer Society, 2009
[8] Ketil Lund, Anders Eggen, Dinko Hadzic, Trude Hafsoe, Frank T. Johnsen. Using Web
Services to Realize Service Oriented Architecture in Military Communication Networks. IEEE
Communication Magazine, October 2007
[9] Harry M. Sneed. “Integrating legacy Software into a Service oriented Architecture” in
proceedings of the Conference on Software Maintenance and Reengineering, 2006.
128
[10] Roger S. Pressman. Software Engineering A practitioner’s approach. McGraw Hill, 2005
[11] James Rumbaugh, Ivar Jacobson, Grady Booch. The Unified Modeling Language Reference
Manual Covers UML 2.0. Addison-Wesley 2005
[12] Gustavo Alonso, Fabio Casati, Harumi Kuno, Vijay Machiraju. Web Services – Concepts,
architectures and applications. Springer Verlag, 2004
[13] James Rumbaugh, Ivar Jacobson, Grady Booch. Software Project Management A Unified
Framework. Addison-Wesley 1998
[14] Apache. JMeter User Manual [Online]. Available: http://jakarta.apache.org/jmeter/
[Accessed: April 2010]
[15] Reza Nabi. CIS895 Deliverables [Online]. Available: http://cis895.nabi.us/
[Accessed: April 2010]
[16] Version One. Agile Tool to Manage Software Development Project. [Online] Available:
http://www.versionone.com/ [Accessed: January 2010]
[17] Microsoft. Patterns and Pratices [Online]. Available: http://msdn.microsoft.com/enus/practices/default.aspx [Accessed: January 2010]
129
Appendix A - Formal Inspection Letter of Suresh Pothuri
130
131
Appendix B - Formal Inspection Letter of Amit Borcar
132
133