1
US008099264B2
(12) United States Patent
(10) Patent N0.:
(45) Date of Patent:
Kelley et al.
(54)
GEOSPATIAL MODELING SYSTEM
(Pontypridd, Wales, UK, 2005), C. Gold, Ed., ISPRS, pp. 42-46.
Grohman et al., Filling SRTM Voids.‘ The Delta Surface Fill Model,
Photogrammetric Engineering and Remote Sensing, Mar. 2006, pp.
213 -216.
(75) Inventors: Patrick Kelley, Palm Bay, FL (US);
Mark Rahmes, Melbourne, FL (US);
Criminisi et al, Region Filling Object Removal by Exemplar-Based
Stephen Connetti, Melbourne, FL (US);
Harlan Yates, Melbourne, FL (US)
(73) Assignee: Harris Corporation, Melbourne, FL
(Us)
Notice:
Subject to any disclaimer, the term of this
patent is extended or adjusted under 35
U.S.C. 154(b) by 950 days.
Sep. 28, 2007
(65)
Prior Publication Data
US 2009/0089017 A1
Image Inpainting, IEEE Transactions on Image Processing, vol. 13,
No.9, Sep. 2004.
Gooch et al., Failure Prediction in Automatically Generated Digital
Elevation Models, Special issue on GeoComp 99- GeoComputation
and the Geosciences, vol. 27, Issue 8, Oct. 2001, pp. 913-920.
LiteSite User’s Manual Version 7.0: AssuredCommunictions; Aug.
2007.
LiteSite User’s Manual Version 3.0: AssuredCommunictions; Jul.
2004.
Allen et al. “Topography-Preserving, Non-linear lnpainting for
Autonomous Bare Earth Digital Elevation Model (DEA/I) Recon
structions” MAPPS/ASPRS 2006 Fall Conference, San Antonio, TX
Nov. 6-Nov. 10, 2006.
Rahmes et al. “Production System for Autonomous 3-Dimensional
Modeling with LIDAR, IFSAR, and Photogrammetric DSM Dats”
ASPRS 2007 Annual Conference; Tampa, FL May 7-May 11, 2007.
Harris GeoVRML brochure: Washington DC; Jan. 25, 2005.
(21) Appl.No.: 11/863,377
(22) Filed:
Jan. 17, 2012
Gousie, M. B. Digital Elevation Model Error Detection and I/lsual
ization, The 4th Workshop on Dynamic & Multi-dimensional GIS
PROVIDING INPAINTING AND ERROR
CALCULATION FEATURES AND RELATED
METHODS
(*)
US 8,099,264 B2
Apr. 2, 2009
* cited by examiner
(51)
Int. Cl.
G06G 7/48
(52)
US. Cl. .............................................. .. 703/6; 703/2
(58)
Field of Classi?cation Search ................ .. 703/1, 2,
(2006.01)
703/6
See application ?le for complete search history.
Primary Examiner * Kamini S Shah
Assistant Examiner * Hemg-Der Day
(74) Attorney, Agent, or Firm * Allen, Dyer, Doppelt,
Milbrath & Gilchrist, PA.
References Cited
(57)
ABSTRACT
A geospatial modeling system may include a geospatial
U.S. PATENT DOCUMENTS
model data storage device and a processor. The processor may
(56)
6,654,690 B2
11/2003
6,748,121 B2
6/2004
6,987,520 B2
l/2006 Criminisi et al.
2009/0083008 A1 *
3/2009
Rahmes et al. ................. .. 705/5
Kim et al. .......... ..
.. 382/300
.. 345/629
Allen et a1. ..................... .. 703/2
OTHER PUBLICATIONS
cooperate With the geospatial model data storage device for
identifying a plurality of localized error regions Within a
geospatial model data set, calculating an overall error value
for the geospatial model data set, and inpainting at least one of
the localized error regions and re-calculating the overall error
value, and stopping inpainting When the overall error value is
Bertalmio et al., “Image Inpainting”, Proceedings of the 27th annual
conference on Computer graphics and interactive techniques, 2000,
beloW an error threshold.
15 Claims, 15 Drawing Sheets
pp. 417-424.*
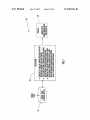
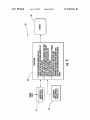
32
MODEL
DATA
31
PROCESSOR
' IDENTIFY LOCALIZED ERROR REGIONS WITHIN
MODEL DATA
STORAGE DEVICE
GEOSPATIAL MODEL DATA SET (GMDS)
' CALCULATE OVERALL ERROR VALUE FOR GMDS
BASED UPON LOCALIZED ERROR REGIONS
Q INPAINT LOCALIZED ERROR REGIONS) AND
RECALCULATE OVERALL ERROR VALUE, AND
STOP INPAINTING WHEN OVERALL ERROR
VALUE 1S BELOW ERROR THRESHOLD
A
———-1'
(GMDS WITH
i
1 ERROR INDKATING I
|
11011111111115)
‘
US. Patent
Jan. 17, 2012
Sheet 2 0f 15
US 8,099,264 B2
U S. Patent
Jan. 17, 2012
Sheet 4 0f 15
US 8,099,264 B2
40A
45
FIG. 5A
408
45
46
HG. 5B
U S. Patent
Jan. 17, 2012
,
a
i,
Sheet 5 0f 15
US 8,099,264 B2
US. Patent
Jan. 17, 2012
Sheet 6 0f 15
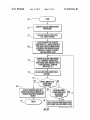
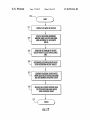
70
IDENTIFY LOCALIZEO ERROR REGIONS
WITHIN GMDS
m
l
CALCULATE OVERALL ERROR VALUE FOR
OMOS
INPAINT LOCALIZEO ERROR REGIONLSL
L
RE-(ALEULATE OVERALL ERROR VALUE
FOR GMOS
OVERALL ERROR VALUE
BELOW ERROR
THRESHOLD?
US 8,099,264 B2
US. Patent
Jan. 17, 2012
US 8,099,264 B2
Sheet 7 0f 15
70’
START
IDENTIFY LOCALIZED ERROR REGIONS
WITHIN GMDS
I
CALCULATE OVERALL ERROR VALUE
(E.G., RMSE) TOR GMDS
II
CALCULATE RESPECTIVE LOCALIZED
ERROR VALUES (5.0., RMSE) ASSOCIATED
80
WITH EACH LOCALIZED ERROR REGION
& PRIDRITIZE FOR mmmms BASED
I
THEREON (as. HIGHEST w LOWEST
LOCALIZED ERROR VALUE)
INPAINT LOEALIZED ERROR REGION
(E.G. PROPAGATE CONTOUR DATA
INTO REGION USING TURBULENT FLUID
FLOW EOUATIDNISI, EXEMPLAR
INPAINTING, ETC.)
I
RE-EALCULATE OVERALL ERROR VALUE
FOR GMDS
75'
83
OVE RALL ERROR VALUE
BELOW ERROR
THRESHOLD?
I
N
DISPLAY INPAINTED GMDS WITH
ERROR INDICATING BOUNDARIES IE.G.,
COLORED TRANSPARENT GEOMETRIC
LOEALIZED ERROR
REGION ERROR VALUE
BELOW ERROR
SHAPES)
THRESHOLD?
SELECT LOCALIZED ERROR REGION WITH
NEXT HIGHEST LOCALIZED ERROR VALUE
H6. 8
US. Patent
Jan. 17, 2012
Sheet 9 0f 15
(Q
c/II
an: ll'
asQ252
25 3
US 8,099,264 B2
5525%5.: 2w:
523 5a2
US. Patent
Jan. 17, 2012
I TO
US 8,099,264 B2
Sheet 10 0f 15
I TO
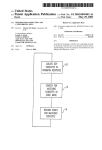
I
START
)
START
TI
DISPLAY GMDS ON DISPLAY
INCLUDING GROUPTS) OF BUILDING
DATA POINTS
I 20'
CALCULATE ERROR VALUES (E.G.,
RMSE, 2D, 3D CALCULATION ETC.)
FOR GROUPS OF BUILDING POINTS AND
SELECT GROUP FOR DISPLAY BASED
THEREON
T
TI
DISPLAY USER-SELECTABLE DIFFERENT
BUILDING SHAPES (WITH DIFFERENT
RESPECTIVE FEATURE DETAIL LEVELS)
BASED UPON GROUPTS) OF BUILDING
DATA POINTS
DISPLAY GMDS ON DISPLAY
INCLUDING SELECTED GROUP OF
BUILDING DATA POINTS
V
V
DISPLAY USER-SELECTABLE DIFFERENT
BUILDING SHAPES (WITH DIFFERENT
RESPECTIVE FEATURE DETAIL LEVELS)
BASED UPON GROUPIS) OF BUILDING
DATA POINTS
REPLACE GROUPTS) OF BUILDING
DATA POINTS WITH GIVEN ONE OF
USER~SELECIABLE DIFFERENT BUILDING
SHAPES BASED UPON USER
SELECTION THERIETEIVFITgEITH USER INPUT
1T4
\ /{
IT
REPLACE GROUPTS) OF BUILDING
TT
FINISH
DATA POINTS WITH GIVEN ONE OF
USER-SELECTABLE DIFFERENT BUILDING
SHAPES BASED UPON USER
)
SELECTION THERIEg’FITéTlTEITH USER INPUT
HG. IT
1T4’
FINISH
FIG. 12
US. Patent
Jan. 17, 2012
Sheet 12 0f 15
US 8,099,264 B2
U.S. Patent
Jan. 17, 2012
Sheet 13 0f 15
US 8,099,264 B2
U S. Patent
Jan. 17, 2012
Sheet 14 0f 15
US 8,099,264 B2
US. Patent
Jan. 17, 2012
Sheet 15 or 15
I70
I7I
DISPLAY 3D GMDS DN DISPLAY
k
I
DISPLAY BUILDING BOUNDARY
AROUND USER-SELECTED BUILDING
I72
\_
AREA RESPDIgSHEI USER INPUT
I
I73
GENERATE HISTDGRAM DF HEIGHT
\ VALUES WITHIN SELECTED BUILDINGS
AREA
my DETERMINE BUILDING HEIGHT BASED
UPON HISTDGRAM HEIGHT VALUES
'75
GEHERATE BUILDING SHAPE BASED
UPON USER-SELECTED BUILDING AREA
AND DETERMINED BUILDING HEIGHT
I
‘76
REPLACE DATA POINTS WITHIN USER
\,
sEIEcTED BUILDING AREA BASED
UPON GDIIDIHG SHAPE
I77
'
FINISH
FIG. 17
US 8,099,264 B2
US 8,099,264 B2
1
2
GEOSPATIAL MODELING SYSTEM
PROVIDING INPAINTING AND ERROR
CALCULATION FEATURES AND RELATED
METHODS
In many instances there Will be voids or gaps in the data
used to generate a geospatial or other model. The voids nega
tively affect the quality of the resulting model, and thus it is
desirable to compensate for these voids While processing the
data, if possible. Various interpolation techniques are gener
ally used for ?lling in missing data in a data ?eld. One such
FIELD OF THE INVENTION
technique is sinc interpolation, Which assumes that a signal is
band-limited. While this approach is Well suited for commu
nication and audio signals, it may not be Well suited for 3D
The present invention relates to the ?eld of data modeling,
and, more particularly, to modeling systems such as geospa
tial modeling systems and related methods.
data models. Another approach is polynomial interpolation.
This approach is sometimes dif?cult to implement because
the computational overhead may become overly burdensome
for higher order polynomials, Which may be necessary to
provide desired accuracy.
BACKGROUND OF THE INVENTION
Topographical models of geographical areas may be used
One additional interpolation approach is spline interpola
for many applications. For example, topographical models
may be used in ?ight simulators and for planning military
missions. Furthermore, topographical models of man-made
structures (e.g., cities) may be extremely helpful in applica
tions such as cellular antenna placement, urban planning,
disaster preparedness and analysis, and mapping, for
20
example.
Various types and methods for making topographical mod
els are presently being used. One common topographical
model is the digital elevation map (DEM). A DEM is a
sampled matrix representation of a geographical area Which
may be generated in an automated fashion by a computer. In
topographical model.
Another approach for ?lling in regions Within an image is
25
height value. DEMs are typically used for modeling terrain
Where the transitions betWeen different elevations (e. g., val
material. This is done to alleviate or minimize the amount of
30
manual editing required to ?ll a destination region in an
image. Tiles of image data are “borroWed” from the proximity
of the destination region or some other source to generate neW
image data to ?ll in the region. Destination regions may be
designated by user input (e. g., selection of an image region by
are present on the terrain.
One particularly advantageous 3D site modeling product is
set forth in US. Pat. No. 6,987,520 to Criminisi et al. This
patent discloses an exemplar-based ?lling system Which iden
ti?es appropriate ?lling material to replace a destination
region in an image and ?lls the destination region using this
a DEM, coordinate points are made to correspond With a
leys, mountains, etc.) are generally smooth from one to a next.
That is, DEMs typically model terrain as a plurality of curved
surfaces and any discontinuities therebetWeen are thus
“smoothed” over. Thus, in a typical DEM no distinct objects
tion. While this approach may provide a relatively high recon
struction accuracy, this approach may be problematic to
implement in a 3D data model because of the dif?culty in
solving a global spline over the entire model, and because the
required matrices may be ill-conditioned. One further draW
back of such conventional-techniques is that they tend to blur
edge content, Which may be a signi?cant problem in a 3D
35
a user) or by other means (e.g., speci?cation of a color or
RealSite® from the presentAssignee Harris Corp. RealSite®
may be used to register overlapping images of a geographical
feature to be replaced). In addition, the order in Which the
area of interest, and extract high resolution DEMs using ste
reo and nadir vieW techniques. RealSite® provides a semi
to emphasiZe the continuity of linear structures and compos
ite textures using a type of isophote-driven image-sampling
automated process for making three-dimensional (3D) topo
graphical models of geographical areas, including cities, that
destination region is ?lled by example tiles may be con?gured
40
process.
45
With respect to geospatial models such as DEMs, various
approaches have been attempted to address error recognition
and correction due to voids, etc. One such approach is set
forth in an article by Gousie entitled “Digital Elevation Model
Error Detection and Visualization,” 4th ISPRS Workshop on
have accurate textures and structure boundaries. Moreover,
RealSite® models are geospatially accurate. That is, the loca
tion of any given point Within the model corresponds to an
actual location in the geographical area With very high accu
racy. The data used to generate RealSite® models may
Dynamic & Multi-dimensional GIS (Pontypridd, Wales, UK,
include aerial and satellite photography, electro-optical,
infrared, and light detection and ranging (LIDAR), for
2005), C. Gold, Ed., pp. 42-46. This paperpresents tWo meth
ods for visualiZing errors in a DEM. One method begins With
example.
a root mean square error (RMSE) and then highlights areas in
Another similar system from Harris Corp. is LiteSite®. 50 the DEM that contain errors beyond a threshold. A second
LiteSite® models provide automatic extraction of ground,
foliage, and urban digital elevation models (DEMs) from
method computes local curvature and displays discrepancies
LIDAR and IFSAR imagery. LiteSiteTM can be used to pro
sions and are dynamic, giving the vieWer the option of rotat
ing the surface to inspect any portion at any angle.
in the DEM. The visualiZation methods are in three dimen
duce affordable, geospatially accurate, high-resolution 3-D
models of buildings and terrain.
US. Pat. No. 6,654,690 to Rahmes et al., Which is also
Another example is set forth in an article by Grohman et al.
entitled “Filling SRTM Voids: The Delta Surface Fill
assigned to the present Assignee and is hereby incorporated
Method,” Photogrammetric Engineering & Remote Sensing,
herein in its entirety by reference, discloses an automated
60
March 2006, pp. 213-216. This article discusses a technique
for ?llings voids in SRTM digital elevation data is that is
intended to provide an improvement over traditional
approaches, such as the Fill and Feather (F&F) method. In the
F&F approach, a void is replaced With the most accurate
65
digital elevation source (“?ll”) available With the void-spe
ci?c perimeter bias removed. Then the interface is feathered
into the SRTM, smoothing the transition to mitigate any
abrupt change. It Works optimally When the tWo surfaces are
very close together and separated by only a bias With minimal
55
method for making a topographical model of an area includ
ing terrain and buildings thereon based upon randomly
spaced data of elevation versus position. The method includes
processing the randomly spaced data to generate gridded data
of elevation versus position conforming to a predetermined
position grid, processing the gridded data to distinguish
building data from terrain data, and performing polygon
extraction for the building data to make the topographical
model of the area including terrain and buildings thereon.
US 8,099,264 B2
3
4
topographic variance. The Delta Surface Fill (DSF) process
error value for the geospatial model data set based upon the
localiZed error regions. The steps may further include itera
tively inpainting at least one of the localiZed error regions and
replaces the void With ?ll source posts that are adjusted to the
SRTM values found at the void interface. This process causes
the ?ll to more closely emulate the original SRTM surface
While still retaining the useful data the ?ll contains.
re-calculating the overall error value, and stopping inpainting
When the overall error value is beloW an error threshold.
Despite the advantages such prior art approaches may pro
vide in certain applications, further advancements may be
desirable for error detection and correction in geospatial and
other model data.
BRIEF DESCRIPTION OF THE DRAWINGS
FIG. 1 is a schematic block diagram of a geospatial mod
eling system in accordance With one exemplary embodiment.
SUMMARY OF THE INVENTION
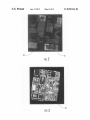
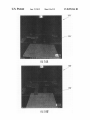
FIGS. 2 and 3 are a digital elevation model (DEM) and a
corresponding error DEM for Which the system of FIG. 1
performs error detection and correction.
In vieW of the foregoing background, it is therefore an
object of the present invention to provide a geospatial mod
eling system providing enhanced error detection and correc
FIG. 4 is a screen print ofthe error DEM of FIG. 3 and an
associated table identifying relative errors of localiZed error
tion features and related methods.
regions.
This and other objects, features, and advantages are pro
vided by a geospatial modeling system Which may include a
geospatial model data storage device and a processor. The
processor may cooperate With the geospatial model data stor
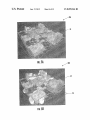
representations of the DEM of FIG. 2 Without and With error
FIGS. 5A and 5B are triangulated irregular netWork (TIN)
indicating boundaries indicating localiZed error regions,
20
age device for identifying a plurality of localiZed error
regions Within a geospatial model data set, calculating an
overall error value for the geospatial model data set, and
FIGS. 6A and 6B are more detailed vieWs of a portion of
the TINs of FIGS. 5A and 5B, respectively.
FIGS. 7 and 8 are How diagrams illustrating a geospatial
inpainting at least one of the localiZed error regions and
re-calculating the overall error value. Inpainting may be
modeling method for identifying and inpainting localiZed
25
stopped When the overall error value is beloW an error thresh
old.
More particularly, the processor may further determine
respective localiZed error values associated With each local
iZed error region, and prioritiZe the localiZed error regions for
respectively.
error regions in geospatial model data.
FIG. 9 is a schematic block diagram of an alternative
embodiment of the system of FIG. 1 providing user-select
able building shape options.
FIG. 10 is a series of building shapes displayed by the
30
system of FIG. 9.
FIGS. 11 and 12 are How diagrams illustrating an altema
inpainting based upon their respective localiZed error regions.
By Way of example, the processor may prioritize the localized
tive geospatial modeling method for providing the user-se
error regions from highest to loWest localiZed error values.
lectable building shape options.
Furthermore, the processor may iteratively inpaint the local
iZed region With the highest localiZed error value until the
localiZed error value is beloW the error threshold, and, if the
35
determined height values.
overall error value is not beloW the error threshold, then the
processor may iteratively inpaint the localiZed error region
FIG. 14 is a screen print of a DEM With a building bound
With the next highest localiZed error value.
The geospatial modeling system may further comprise a
display. As such, the processor may cooperate With the
geospatial model data storage device and the display to dis
play the geospatial model data set along With error indicating
boundaries indicating the localiZed error regions. By Way of
example, the error indicating boundaries may comprise col
FIG. 13 is a schematic block diagram of yet another alter
native embodiment of the system of FIG. 1 for generating
building shapes based upon user-selected building areas and
40
ary area to be replaced With a generated building shape.
FIG. 15 is a comparison of screen prints for the DEM of
FIG. 14 after fully automatic generation, and after being
touched up through a manual/automated approach by the
system of FIG. 13.
FIGS. 16A and 16B are 3D display vieWs of the DEMs of
45
FIG. 15 for the fully automatic and the touched-up versions,
respectively.
ored transparent geometric shapes. In addition, each localiZed
error value may comprise a localiZed root mean square error
FIG. 17 is a How diagram of another alternative embodi
(RMSE) value, and the overall error value may comprise an
ment of a geospatial modeling method for generating build
ing shapes based upon user-selected building areas and deter
overall root mean square error (RMSE) value.
The inpainting may comprise iteratively propagating con
50
tour data from outside the at least one localiZed error region
into the at least one localiZed error region. By Way of
example, this may be done based upon at least one turbulent
mined height values.
DETAILED DESCRIPTION OF THE PREFERRED
EMBODIMENTS
?uid ?oW modeling equation, as Well as based upon exemplar
inpainting.
55
A geospatial modeling method aspect may include identi
fying a plurality of localiZed error regions Within a geospatial
model data set, and calculating an overall error value for the
geospatial model data set based upon the localiZed error
regions. The method may further include iteratively inpaint
Which preferred embodiments of the invention are shoWn.
This invention may, hoWever, be embodied in many different
60
forms and should not be construed as limited to the embodi
ments set forth herein. Rather, these embodiments are pro
65
vided so that this disclosure Will be thorough and complete,
and Will fully convey the scope of the invention to those
skilled in the art. Like numbers refer to like elements through
out, and prime notation is used to indicate similar elements in
alternate embodiments.
ing at least one of the localiZed error regions and re-calculat
ing the overall error value, and stopping inpainting When the
overall error value is beloW an error threshold.
A computer-readable medium may have computer-execut
able instructions for causing a computer to perform steps
comprising identifying a plurality of localiZed error regions
Within a geospatial model data set, and calculating an overall
The present invention Will noW be described more fully
hereinafter With reference to the accompanying draWings, in
Referring initially to FIGS. 1-7, a geospatial modeling
system 30 illustratively includes a geospatial model data stor
US 8,099,264 B2
6
5
age device 31, a processor 32, and (optionally) a display 33.
The geospatial model data storage device 31 stores geospatial
i1 (6; — 6102
model data, such as digital elevation model (DEM), digital
surface model (DSM), and/ or triangulated irregular netWork
MSE: ":1
(TTIN) data, for example. Generally speaking, such model
RMSE = \/ MSE
data is generated from “raW” data captures, such as LIDAR,
synthetic aperture radar (SAR), photography, electro-optical,
n
z
infrared, etc., using systems such as the above-noted Real
SiteTM and LiteSiteTM site modeling products, as Will be
appreciated by those skilled in the art. The geospatial model
data set may be generated by another source and provided to
the processor 32 for the additional processing operations to be
described beloW, or the processor may generate the geospatial
(6; — £102
i:l,ieGroup
MSEGroup =
n
RMSEFiXEd =
model data set in other embodiments.
MSEDEM —
Z
MSEGroup
GroupeFixed
By Way of background, With typical prior art approaches,
The processor 32 further inpaints one or more of the of the
localiZed error regions 41' to repair or otherWise correct miss
When automatically generating a 3D site model from a digital
elevation model (DEM), for example, there is a usually a need
for a manual (i.e., human operator) touch-up due to factors
ing, obscured, etc., portions thereof, at Block 73. More par
ticularly, this may be done by propagating contour data from
such as: noisy data; occlusion; boundary conditions (being
partially cut off, etc.), algorithm limitations, etc. HoWever,
outside a given localiZed error region 41' into the region, as
20
manual touch-up of site models, Which can be very large, may
be extremely time consuming. Moreover, locating the areas
that require editing in large models may also be tedious and
dif?cult.
25
the production process, as a modeler (i.e., the user or opera
iterative fashion in some embodiments, as Will also be appre
tor) often has to render a model in 3D, locate the problem
30
make the corrections in 2D image space. In particular, both
manual model generation and manual touch-up of automated
models typically rely upon images to produce a polygon. The
polygon’s height is obtained by calculation based upon cues
in the image or relocating the polygon to another image.
Location of the areas to be ?xed is typically done completely
by the modeler (i.e., “by eye”), and is dependent on his/her
attention to detail. In other Words, this introduces the possi
35
bility for user error.
40
little or reduced operator effort may save a signi?cant amount
45
advantageously cooperates With the geospatial model data
50
55
threshold, at Blocks 74-75. If it is, then the processor 32 stops
inpainting of the current localiZed error region 41', thus con
cluding the method illustrated in FIG. 7, at Block 76. Other
Wise, the processor 32 returns to inpainting of the same or a
different region 41' until the overall error value is brought
beloW the error threshold.
In one exemplary embodiment Where localiZed error
60
the error values of localiZed error regions 41' Within the DEM
40, as Well as the overall DEM error value, may be calculated
using various approaches, including a total error, local root
mean square error (RMSE), a maximum error, a mean square
skilled in the art.
inpainted could be selected in a different order, or more than
one region could be painted at a time.
The processor 32 re-calculates the overall error value for
41' to determine if the overall error value is beloW an error
error value from areas having a relatively loW error value to
error (MSE), MSE relative to the overall DEM, RMSE rela
tive to the overall DEM, etc., as Will be appreciated by those
one at a time from a highest to a loWest error value, as Will be
the DEM 40' after inpainting of the localiZed error region(s)
are shoWn in FIG. 4. That is, the processor 30 advantageously
separates areas Within the DEM 40 having a relatively high
determine the localiZed error regions 41'. By Way of example,
exemplary embodiment illustrated in FIG. 8, the localiZed
error regions 41' are prioritiZed for inpainting based upon
their respective error values (Block 80'). That is, upon calcu
lating the errors for the localiZed error regions 41', these
regions are prioritiZed for inpainting based thereon. For
example, the errors may be sorted by maximum error, relative
error, etc., and the regions 41' are then selected for inpainting
appreciated by those skilled in the art. HoWever, it should be
noted that in other embodiments the order of regions 41' to be
the system 30 may advantageously perform enhanced error
detection and correction operations.
More particularly, beginning at Block 70, the processor 32
calculates an overall error value for the DEM 40', at Block 72.
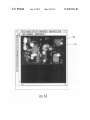
An exemplary DEM 40 With errors therein is shoWn in FIG. 2.
An alternative error vieW 40' of the DEM is shoWn in FIG. 3,
and speci?c localiZed error regions 41' Within the error DEM
and 11/858,247, Which are both assigned to the present
Assignee and are hereby incorporated herein in their entire
ties by reference.
The localiZed error region or regions 41' to be inpainted
may be selected in various Ways. In accordance With the
a relatively fast and effective approach to correct them With
storage device 31 for identifying a plurality of localiZed error
regions Within a geospatial model data set, at Block 71, and
ciated by the skilled artisan. Further details regarding exem
plary inpainting approaches Which may be used are set forth
in co-pending U.S. patent application Ser. Nos. 11/458,811
As such, in both automated and manual processes, being
able to ?nd such problem areas in the model, and then having
of time and cost. Therefore, in accordance With one aspect,
Another approach is to perform exemplar inpainting,
Which involves “cutting” and “pasting” of patches from
Within the DEM 40 (or a different data set) to provide a best
match for the corrupted or voided data, as Will be appreciated
by those skilled in the art. The inpainting may be done in an
The same issue presents itself in manual site model cre
ation. Manual editing is a relatively long and expensive step in
areas, ?nd Where these correlate to in 2D space, and then
Will be appreciated by those skilled in the art. By Way of
example, this may be done using various approaches such as
an inpainting algorithm, and, more particularly, ?uid-?ow
modeling algorithms such as Navier-Stokes equations, etc.
65
regions are inpainted one at a time from highest to loWest
error value, if upon re-calculation of the overall error value
the overall error value is not beloW the error threshold, then
the processor 32 determines Whether the error value for the
localiZed error region being inpainted is beloW an error
threshold (Which may be the same or a different threshold
than the overall threshold), at Block 81'. If it is not, then the
processor 32 returns to this same localiZed error region 41' for
US 8,099,264 B2
7
8
more inpainting operations. Otherwise, the processor 32
order they are in the queue (e.g., from highest error value to
loWest error value). The error calculations may be performed
moves to the next localized error region 41' (i.e., the one With
the next highest error value in line to be inpainted), at Block
82'.
The foregoing Will be further understood With reference to
the example illustrated in FIG. 4. Here, there are seven iden
ti?ed error regions 41' having error values ranging from
1.72018 m RMSE (highest) to 1.58867 m RMSE (loWest),
using the above-described approaches (e.g., RMSE, etc.), for
example, as discussed further above. Moreover, these error
calculations may also advantageously be performed on either
2D or 3D data sets, as Will be appreciated by those skilled in
the art. Alternatively, upon display of the error indicating
boundaries/ shapes 46, a user may manually select (With the
user input device 34') a desired group of building data points
to be corrected. Other suitable selection approaches may be
used as Well, as Will be appreciated by those skilled in the art.
and an overall error value for the error DEM 40' is 1.81043 m.
The error threshold selected for this example is 1.6 m, but it
should be noted that other error thresholds may be used in
other embodiments as appropriate. Accordingly, the proces
sor 32 Will ?rst select the localized error region 41' With the
1 .72018 m RMSE error value for inpainting, and then inpaint
this region until its error value of the DEM 41' is less than 1.6
It should be noted that, as used herein, “3D” is meant to
cover both true three-dimensional model data as Well as so
m RMSE, or until the overall error value is less than 1.6 m
RMSE. If the former occurs before the latter, the processor 32
moves along to inpaint the next error region 41' With the
1.67647 m RMSE, etc., until the overall error value of the
error DEM 40' is less than 1.6 m RMSE.
20
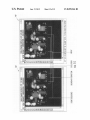
Anotherparticularly advantageous feature of the system 30
cover both cases herein.
For the selected group of building data points, the proces
sor 32' then advantageously displays a plurality of different
is that once the localized error regions 41' are selected, the
processor 32 may optionally display the geospatial model
data set along With error indicating boundaries 46 Which
identify errant buildings 45 or other objects/areas on the
display 33, at Block 83', as seen in the TIN 40A of FIG. 5A
user-selectable building shapes 100a-100d (FIG. 10), at
25
Block 112. That is, the processor 32' presents the user With a
plurality of possible building shapes, so that the user can
quickly select a shape that best ?ts the selected group of
(Without boundaries), and TIN 40B of FIG. 5B (With bound
points. In particular, the plurality of user-selectable different
building shapes 100a-100d have different respective feature
ar‘ies). This alloWs a user to better visualize exactly Which
buildings 45, etc. are problem spots Within the geospatial
model data set. In the illustrated example, the error indicating
called 21/2 or 2.5D model data. More speci?cally, many
DEMS or other geospatial model data sets are sometimes
referred to as “2.5D” because they include rendered building
Walls, etc. that are not necessarily present in the original data
capture, and thus do not provide a completely accurate 3D
image as it Would appear to the human eye upon vieWing a
scene. HoWever, for clarity of discussed “3D” is meant to
30
detail levels associated thereWith.
boundaries 46 are geometric shapes. Moreover, these shapes
Generally speaking, the user decides Which building shape
are transparent or semi-transparent to alloW the object With
Which the indicator is associated to still be seen therethrough.
100a-100d to select based upon a tradeoff betWeen visual
In the illustrated example, the geometric shapes are cylinders
or semi-cylindrical shapes (i.e., partial cylinders), Which pro
35
vides a desirable visual contrast to generally rectangular
buildings. HoWever, other shapes/indicators may also be
used. The indicators 46 may also be colored in certain
embodiments to indicate the severity of the error (e.g., red
orange-yelloW-White to indicate highest to loWest error val
processor 32' may then advantageously replace the given
group of building data points With the selected building shape,
40
ues).
Certain advantages of the above-described system 30 and
method are that they provide automated model problem area
location and prioritization. In some implementations, this
approach may be fully automated With no manual (i.e., user)
searching required for problem areas Within a geospatial
model data set. Moreover, the results may helpfully be pri
or‘itized by Which areas should-be addressed ?rst.
In accordance With another aspect noW described With
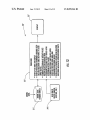
reference to FIGS. 9-12, a system 30' and associated method
for helping a user to more easily replace buildings 45 Within
localized error regions 41' of a geospatial model data set is
noW described. Beginning at Block 110, the processor 32'
at Block 113, and may update the data set according (i.e., save
the change in the model data storage device 31') thus con
cluding the method illustrated in FIG. 11 (Block 114).
45
In the illustrated example, the shape With the least or loWest
feature detail level (and, correspondingly, the highest error
value associated thereWith) is the generally rectangular build
ing or “bounding” box 10011. On the other hand, the shape
100d has the highest feature detail level (i.e., the loWest error
value), because it is a one-to-one match of the group of
50
building data points. That is, the shape 100d includes all of the
detail present in the original data set. The shapes 10019 and
1000 have varying levels of detail betWeen the highest and
loWest levels of the shapes 100a and 100d, respectively, as
seen in FIG. 10.
The plurality of user-selectable building shapes 100a-100d
cooperates With the model data storage device 31' and display
33' to display geospatial model data including one or more
resemblance and acceptable error for each building 45, Which
Will depend upon the particular error parameters for a given
geospatial model data set, as Will be appreciated by those
skilled in the art. Once a desired building shape has been
selected by the user (i.e., With the user input device 34'), the
55
groups of data points corresponding to a respective building
45, at Block 111. A given group of building data points may
be selected for processing, such as by automatic selection of
may conceptually be considered as a “toolbox” of possible
building shapes from Which the user can quickly select a
given shape to more accurately re?ect the true or “real-life”
shape of the actual building 45 being rendered in the model.
This toolbox of shapes 100a-100d may be used in lieu of
a group of points by the processor 32' or manual selection by
a user With a user input device 34', Which may be a mouse, 60
inpainting the building as described above. That is, using the
joystick, keyboard, etc., as Will be appreciated by those
above described approach, the processor 32' may select
groups of building data points to be corrected in order based
upon error values associated thereWith, and then present the
skilled in the art.
In one exemplary automated embodiment, a queue may be
user With respective building shapes for each building to
constructed using the above-described localized error region
41' error value prioritization (i.e., based upon error calcula
tion) to create a queue for buildings that need to be corrected,
at Block 120', and the processor 32' may take these in the
65
replace the errant groups of data points until the overall error
of the geospatial model data set falls beloW the error threshold
(or the localized error threshold falls beloW the error thresh