1
United States Patent [19]
[11]
Patent Number:
Kelson et al.
[45]
Date of Patent:
[54] GOLF GAME DATA RECORDER,
ANALYZER, AND GAME IMPROVER USING
DISPLAY SIMULATIONS WITH PLURAL
RESOLUTIONS
Kelson, 2409 Knights Bridge Dr.,
[52]
The system uses a microcomputer (81) to provide a practical
and useable graphic representation of the fairways (12) and
locations (14) and measure playing performance during an
actual round of golf as contrasted to a simulation of a golf
[21] Appl. No.: 158,759
game. A player will interact with the diagrams produced by
the system’s software and illustrated on a display or monitor
N0v.30, 1993
[51] Int. Cl.6
ABSTRACT
greens (11) for any golf course in order to record shot
Grand Prairie, Tex. 75050
[22] Filed:
Sep. 24, 1996
Primary Examiner-—Gail O. Hayes
Assistant Examiner——FrantZy Poinvil
Attorney, Agent, or Firm—David Pressman
[57]
[76] Inventors: Steven M. Kelson, 5412 Ranger Dr.,
Rockwall, Tex. 75087; Robert E.
5,558,333
A63B 69/36; GO6F 161/00
US. Cl. ............................. .. 473/131; 364/411; 463/1;
(80). The design of the system enables the player to accu
rately determine the locations of all shots and calculates and
displays:
473/407
[58]
Field of Search ................................... .. 364/410, 411;
(a) shot or club distances (FIG. 6 );
273/176 A, 176 R, 185 B
(b) shot or club accuracy (within 1—2 yards) to the center of
[56]
References Cited
the green from ball locations (14) ranging up to 200 yards
from the center of the green;
U.S. PATENT DOCUMENTS
3,665,494
5/1972 Baumoel ............................... .. 235/156
4,086,630
4/1978 Speiscr et a1.
4,192,510
3/1980 Miller ............ ..
273/176A
4,343,469
8/1982 Kunita et a1.
273/185 A
..... .. 364/410
.. . .. . .. . .
. . . . ..
(0) shot or club accuracy (within 1-2 feet) to the pin (cup
location) from ball locations (14) ranging up to 200 yards
from the center of the green even though the pin location
may be different each time the course is played;
4,504,055
3/1985
Wells
4,505,478
3/1985
Reithmiller .
.... .. 273/32 H
4,815,020
3/1989
Corrnier .... ..
364/709.11
4,928,973
5/1990 Perry et a1. ..
273/176 A
(d) statistical data, i.e., score, fairways hit (68), greens in
regulation (69), a correctable swing analysis (71), and a
273/185 B
364/410
66), sand saves (60, 61, 62), and chipping (55, 56, 57, 58,
5,056,791 10/1991 Poillon et a1.
5,095,430 3/1992 Bonito et al.
....
273/85 G
5,127,044
6/1992
Bonito et a1.
5,184,295
5,221,082
5,245,537
2/1993
6/1993
9/1993
Mann ............ ..
364/410
Curchod .... ..
273/185 A
Barber ................................... .. 364/410
. . . ..
379/88
complete short-game analysis (54) of putting (63, 64, 65,
59); and
(e) playback of golf rounds (FIGS. 3 A, 35, 3C) so that
improvement can be measured and selected courses played
in the past can be reviewed and analyzed.
OTHER PUBLICATIONS
PGA Tour Golf, Poly Games and Electronic Arts, 1992.
AV Systems, Inc, “Golf” simulated game, 1992 Jan. 25, 1
9 Claims, 9 Drawing Sheets
sheet.
GoltMaster/ZOOO programs by Focus/2000, May 1990 to
1993 Jan. 20.
Micro?che Appendix Included
(31 Micro?che, 1000 Pages)
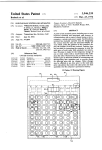
19
l
I
HOLE YARDAGE: 403
18——~HOLE NUMBER 1
SHOTNO.1
17
CLUB11IRON
SHOT DIST: 175
PULL
50mg _.____—_
____:\
moms ——
>————12
150YDS
—""'——;/
--——
ZUUYDS ----—~—\
14
—e—1——-————
2501/05 -__-_-—/
>—————10
US. Patent
Sep. 24, 1996
Sheet 2 of 9
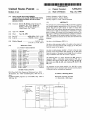
21 —-————————-—— ENTER DATA FOR A ROUND OF GOLF
CORRECT ERROR(S) ON A HOLE
23
25
RESULTS AND ANALYSIS
PLAYBACK
PATTERN FOR DRIVES
PATTERN FOR APPROACH SHOTS
80 ~—-'
22 ————————— PATTERN FOR APPROACH SHOTS TO THE PIN
24
CLUB DISTANCES
2Q ---—-—INFORMATION ON GOLF COURSES PLAYED
ENTER PRACTICE NOTES
PRINT PRACTICE NOTEBOOK
INSTRUCTIONS
EXIT TO DOS
25
33
I
81—_
82
COMPUTER WITH MEMORY AND
APPLICATION PROGRAM
KEYBOARD
FIG. 2
5,558,333
US. Patent
Sep. 24, 1996
Sheet 3 of 9
5,558,333
19
l
1>
I
HOLE YARDAGE: 403
18—-—-—HOLE NUMBER 1
0 YDS
11
SHOT NO. 1
17
CLUBI1 IRON
50 ms ___________
SHOT DIST: 175
PULL
________:\
100 YDS
//
150YDS
>___———12
200 YDS -—--—\
14
250 YDS
—o—1————
___— />——————10
m
l
16
FIG. 3A
13
US. Patent
HOLE NUMBER1
SHOT NO. 2
CLUB: 2 IRON
SHOT DIST: T23
SHOT NO. 3
CLUB: PTTCHTNG W
SHOT DIST: 108
Sep.24, 1996
Sheet 4 of 9
5,558,333
HOLE YARDAGE: 403
>_____14
>_—_10
US. Patent
PUTT '1; 30
Sep. 24, 1996
'
Sheet 5 of 9
HOLE NUMBER: 1
FIG. 3C
5,558,333
U.S. Patent
Sep. 24, 1996
Sheet 6 of 9
ACCURACY OF APPROACH SHOTS TO THE FIN
IN THE RANGE 0F100 TO 150 YARDS TO CENTER OF GREEN
40——
4IRON
42“
@ BRASSiE
g?lFwN
(D THREE WOOD
@6 IRON
® FOUR W000
G) 7 |RON
@8 IRON
OD F|(V)E WOOD
(5) OTHER WOOD
4
@ 9 IRON
14
-
0
\
JO)
6
{8)
@PNCPNNG WEOGE
42__
5,558,333
@ OTHER IRON
(9 SAND WEOGE
® PUTTER
®PENALTY STROKE
(D 1 IRON
NUMBER OF ATTEMPTS: 4
NO. ON GREEN: 4 PCT: 100%
41
FIG. 4
_
@ Z'RON
® 3 ‘RON
42 I
US. Patent
Sep. 24, 1996
5l0
Sheet 7 of 9
5
l
2
RESULTS AND
ANALYSIS
PLAYER NUMBER: 001
(AVERAGE PER ROUND)
53——ANALYs1s COVERS 16 ROUNDS
SCORE: 84.75
5,558,333
51I
PER100 COVERED: * / /
PAR OF COURSES: 71.25
54——-—-SHORT GAME
55—-———D|STANCE OF CHTP PITCH SHOTS: 22 YARDS
56—————D|STANCE OF PUTT AFTER CHIP/PITCH: 13 FEET
_61
_58
57——-—NUMBER OF CHIP/PITCHES: 9
60————NUMBER OFSAND ATTEMPTS: 2.4
NUMBER OFCHlP/PITCH SAVES: 8 32.6% ~- 59
NUMBER OF SAND SAVES:
0.1
2.6% —— 62
68~——PUTTs/R0UN0; 33
PUTf/HOLE: 1.84
65_
141 FT M76
11-15FTPUTTs
67———BALL
6% 1 PUTT 12% 16+ ETPUTTs 25% 1 PUTT
STRIKING
68————FA|RwAYs HIT: 70.98%
PARS/ROUND: 6.7
71——CORHECTABLE
_66
3%
.
GREENS IN REGULATION: 27.08%
—————~ 69
BOGlES/ROUND: 8.1
70—<1:B|HD|ES/ROUND:
0.4
DOUBLE BOGlES/ROUND:
72—-——AVE. NUMBER: 6
73—————-—SLICE: 59%
64
48% 1 PUTT 93% 5-10 FTPUTTs 20% 1 PUTT 30%]
EAGLES/ROUND: 0.0
2.4
TRIPLE BOG|ES+/ROUND: 0.3 —————70
SWINGS
PUSH: 1%
PULL: 5%
PULL HOOK: 3%
FAT: 27%
THIN: 1%
PRESS <ENTER> WHEN DONE
FIG. 5
STUB: 2%
_
I U.S. Patent
Sep. 24, 1996
CLUB
Sheet 8 of 9
5,558,333
DISTANCES
CLUB
LONGEST SHOT
AVERAGE DISTANCE
SAND WEDGE
P WEDGE
9 IRON
8 IRON
7 IRON
6 IRON
5 IRON
4 IRON
3 IRON
OTHER WOOD
THREE WOOD
BRASSIE
DRIVER
57
56
81
III
I43
I24
I6I
I46
I54
I79
226
21 0
291
44
48
69
84
99
I08
I23
I30
II5
I40
I6I
I62
203
DEPRESS <ENTER> TO OUIT
FIG. 6
NUMBER OF SHOTS
4
7
5
I5
I5
IO
I8
IO
3
39
49
I24
I82
US. Patent
Sep. 24, 1996
Sheet 9 of 9
[Q3
FIG. 7
5,558,333
11
5,558,333
2
1
U.S. Pat. No. 5,184,295 to Mann (1993) shows a com
GOLF GAME DATA RECORDER,
ANALYZER, AND GAME IMPROVER USING
DISPLAY SIMULATIONS WITH PLURAL
RESOLUTIONS
puter program and system for teaching a student how to play
a game, speci?cally golf, in a superior manner. It compares
a video of the student performing with a model compiled
from a plurality of elite performers in order to teach the
student what to do to improve play and emulate the superior
model. Consequently, this system is dependent upon the
physical ability, coordination, and aptitude of the student to
An appendix of 31 micro?che and 1000 pages is attached
to this speci?cation and is contained in the ?le wrapper of
this patent.
correctly emulate the model in order for the student to
improve.
U.S. Pat. No. 4,343,469 to Kunita et al. (1982) shows a
BACKGROUND
computerized putting simulator where the computer consid
ers the velocity and hit angle of the ball on the topography
of the green and plots a trajectory of the putted ball. This
putting practicing machine is designed merely to help a
1. Field of the Invention
The invention relates computer systems and methods for
use in the game of golf, particularly to a computer method
golfer improve putting performance, not general golf play.
for creating a universal golf course to enable accurate and
U.S. Pat. No. 4,815,020 to Cormier (1989) shows a
hand-held computer attached to a hand-held cart holding a
graphic display of shot accuracy and distance for each club
used in an actual round of golf to help players improve
golfer’s bag and clubs. The computer computes the club to
performance.
be used on the next stroke based upon previous strokes and
20
the distances achieved with such clubs. Also, the remaining
distance to the green is computed based upon the distance
traveled thus far, which is measured by a sensor attached to
a wheel of the golf cart. In most competitive college golf
2. Description of Prior Art
tournaments the players are required to carry their bags and
Golfers strive continually to improve their play, i.e., lower 25 clubs, and if not required, it’s a common practice in high
BACKGROUND
their scores. One major way they do this is to record data
school golf competitions. This fact, plus the increasing use
about actual play of a round of golf on a course and
and requirement of motorized riding carts on most golf
courses, limits the practical application of the Cormier
device. In addition, Rule 14-3 of The Rules of Golf (The U.S.
Golf Association, Jan. 1, 1992) states: “Except as provided
in the Rules, during a stipulated round the player shall not
thereafter analyze the results at home.
In order to utilize the results of a round of golf to help
improve performance, a golfer had been forced to keep
handwritten documentation of all shots played. Then the
golfer had been faced with the difficult and time-consuming
task of manually organizing the data and breaking down the
results achieved with each club.
College golf coaches also use various methods of record
ing statistical data for their student players in an attempt to
improve individual and team performance. As this normally
30
use any arti?cial device or unusual equipment: . . . b. For the
purpose of gauging or measuring distance or conditions
which might aiTect his play . . . ”. Thus, Cormier’s device
35
may be illegal in USGA tournaments.
U.S. Pat. No. 5,056,791 to Poillon et al. (1991) shows a
system for use indoors to simulate outdoor play. The player
hits the ball into a frame which has a hole of the real golf
requires considerable time and elfort on the part of the
students to complete data sheets, many of them dislike the
course projected on a screen in the rear of the frame. The
task. Generally, the student’s data sheets are sent to a data
computer senses the characteristics of the hit ball, including
processor and several days elapse before the results are
known. The results come back in the form of printouts which
trajectory, velocity, and spin, and computes the actual travel
it could take on the real course in an unimpeded environment
which may or may not simulate varying conditions such as
generally include information such as average score per
wind, rain, and temperature under actual playing conditions.
round, average number of putts per round, number of birdies
(holes played in one stroke under par), etc. However, the
results are delayed and normally not available for use during
Pictures of holes of a plurality of real courses are stored in
the computer on a CD-ROM.
a current tournament. Also, nothing is provided regarding
accuracy and distance accomplishments with each club used
in play. It is generally acknowledged that knowing proper
club selection, and knowing one’s average distance with
each club, can help to improve one’s performance at all
U.S. Pat. No. 5,221,082 to Curchod (1993) shows a
system very similar to Poillon’s, but where the player’s shots
50
player will be competitive with other players.
U.S. Pat. No. 4,086,630 to Speiser et a1. (1978) shows a
levels of playing pro?ciency.
Computer games have been o?’ered which provide enter
tainment for computer players to test their computer skills
are enhanced by a predetermined factor in order that the
computer-type golf game which works in conjunction with
a slide projector to present successive scenes of the course
55
against the hypothetical playing of famous golf courses
and hole in play, hole distances, and lays of the ball, and
completion (yards to go) to the pin. Speiser describes an
around the world. In some of these games, each hole has
unrealistic simulation whereby an out-of-bounds drive
been meticulously duplicated so the computer player can get
occurs when a ball hits a side wall of the drive range with
an insufficient impetus on the rebound to activate the net
a feel of the golf course.
U.S. Pat. No. 4,504,055 to Wells (1985) shows an elec 60 switches. This example clearly illustrates a difference
between simulated golf play and real golf play. In actual play
tronic video game adapted for use to play a simulated game
such a shot may or may not result in an out-of-bounds
of golf. Wells’s game is a competitive one where the players
compete on a ?xed course and play by selecting clubs,
directions, and strengths of shots. This machine plots suc
cessive lays of the ball. However, this type of computer
activity merely provides entertainment and does not aid in
the improvement of one’s golf playing ability.
situation. Most golfers readily agree that hitting golf balls
65
during actual play on a course, especially in competition, is
different from hitting balls on a driving range, or taking
practice swings at an imaginary or real target such as a
dandelion, or taking golf swings in a simulated environment.
5,558,333
3
4
Further, distances representing hits measured by these
simulators are not hits of golf balls during actual golf play
AV Systems, Inc. of Santa Barbara, Calif. provides a
computer game (1992) which can simulate several courses
subject to usual variances in temperature, wind, and other
atmospheric conditions. Instead, they are simulations which
are physically measured by various types of sensing devices
including sound wave detectors, and sensors measuring
with several players.
Focus/2000 and Golfmaster/ZOOO of Shawnee, Kan.
(1990,1992) provide a computer program for calculating and
retaining scores for a day or a season. It can record hole and
velocity, trajectory, and spin of the ball.
Also, these systems require simulation of play on speci?c
stroke play, golfer statistics, etc.
However, both of the latter two games suffer from most of
golf courses. Because each golf course throughout the world
is different from other courses in layout, design, and dis
tances for each hole, it is exceedingly difficult to duplicate
each layout as an instructional aid in the teaching of golf. To
the disadvantages of the devices of the above-described
patents.
meet the needs of all golfers across the country, a great deal
OBJECTS AND ADVANTAGES
of time and expense would be required to enable the system
to simulate the varied and numerous courses. The cost of
these devices practically prohibit the average, individual
golfer from owning and using or practicing with such
Accordingly several objects and advantages of the present
15
system are:
for individual golfers, most golfers prefer actual play rather
than simulations of play.
(a) to provide an appealing, relatively low cost, time
efficient, and easy—to-use system, which provides the capa
bility for analysis of a current day’s play with a complete
performance analysis of individual and team players for a
US. Pat. No. 3,665,494 to Baumoel (1972) shows a
round of golf played on any eighteen-hole course in the
devices. In addition to the relative high cost of such devices
handicap computer which takes into account the previous
world;
scores of the player and the courses where these scores were
(b) to provide a universal golf hole which facilitates the
foregoing object and which can be used to simulate any golf
hole in the world;
(c) to provide a playback capability, i.e., a record which
can be reviewed upon demand and provide a graphical
picture of each shot location in a round to aid a player’s
memory recall and visualization of each shot;
((1) to provide, as a result of the foregoing object, the
posted. This computer uses a punch card for input, which by
today’s standards, is impractical or obsolete. Handicaps are
used to equalize competition, generally among members of
25
golf clubs. For example, a scratch (zero) handicap player
will give a seven handicap player seven strokes to equalize
play in a round of golf. Other than indicating relative playing
pro?ciency compared to other golfers, this device does
nothing to improve a golfer’s playing ability.
30
means to enable any golfer, including professional golfers,
Sports Performance Research of Loveland, Colo. pro
vides a computer statistical quality control system (1992) for
golfers which presents a method of recording the distance of
a golf shot, prior to making the shot, based on a player’s
estimate of the distance from the ball location to a target. In
many cases, especially on a golf course with which a player
to recall how they played the same course a previous year;
(e) to provide reports and graphical pictures of shot
accuracy, e.g., approach shots to the green from distances
35
is unfamiliar, such an estimate could be inadequate. This
statement is veri?ed by the user’s manual which states: “If
you can’t make a good estimate of the distance, it is better
ranging from 1 to 200 yards;
(f) to provide accurate information to help a golfer learn
the average and maximum distances the golfer can hit each
club under playing conditions, and
(g) to provide a system that will operate on standard
40
to leave this column blank than to enter a poor guess.”
microcomputers widely available and easily accessible at
Another instruction states: “Make an entry in the Yards to
relatively low cost to help golfers of all handicaps improve
Target column whenever you can make a reasonable esti
performance.
mate of the distance from your ball to the pin.” In view of
Several additional objects and advantages are:
(h) to provide reports on demand to enable golfers to
the fact that pin locations are regularly moved daily, unless
a player is informed of the exact location of each pin on each
green, accurate estimates are further impaired.
In addition, the calculation of distances is further com
evaluate progress or improvement; and
(i) to provide a teaching/learning tool for a player, coach,
or teaching professional which is fun to use. ‘
plicated by the requirement: “If you are making a shot from
behind the green, enter a minus sign in front of the distance
you enter. This notation tells GolfSQC [the associated
program] your previous shot was hit too far.”
This system uses a data gathering procedure requiring the
use of speci?c, detailed Stroke Logging Charts and uses
charts and graphs to display results of individual golf play.
The system creates a pro?le of a golfer’s game so the golfer
can compare performance with a pro?le of professional
golfers and others; however, the user’s manual warns: “if
less than 50% of your holes don’t ?t the templates or the
round estimates are a lot different than your typical scores,
GolfSQC probably isn’t for you.”
Studying charts and graphs offer little appeal or interest
for most athletes or golfers, especially young people. This is
an important consideration in the design of a golf improve
ment system. Many leading golf teachers feel, that in order
to reach top levels of performance in golf, students must
develop interest and be encouraged at a relatively early age.
Further objects and advantages will become apparent
from a consideration of the ensuing description and accom
panying drawings.
DRAWING FIGURES
55
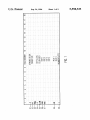
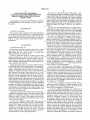
FIG. 1 is an illustration of a scorecard used by a player
during actual play of a round of golf to record information
for subsequent entry into a computer system, in accordance
with the invention.
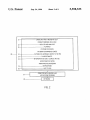
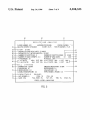
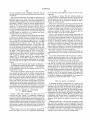
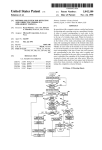
FIG. 2 is a diagram of a computer system with a display
and keyboard showing a main menu which provides options
offered by the system.
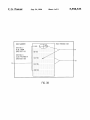
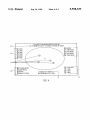
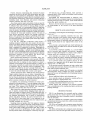
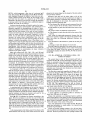
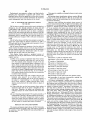
FIG. 3A is an illustration of a computer screen showing a
?rst view of a universal golf hole, in accordance with the
65 invention.
FIG. 3B is an illustration of a computer screen showing a
second view of the universal golf hole and the accuracy of
5,558,333
5
6
approach shots to the center of the green with distance
hole, etc. The system records and displays the recorded data
so that a player can analyze and improve current play and
also past games to improved future play.
measurements in yards.
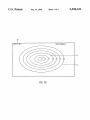
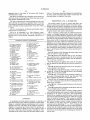
FIG. 3C is an illustration of a computer screen showing a
third view of the universal golf hole which illustrates a green
with distance measurements in feet.
DESCRIPTION-FIG. 1—SCORECARD
FIG. 4 is an illustration of a screen selected from the main
menu showing the accuracy of approach shots to the pin
from distances ranging up to 200 yards from the center of the
green, including accuracy measurement of the shots within
1-2 feet.
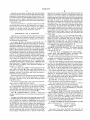
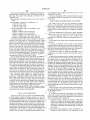
FIG. 5 is an illustration of a Results and Analysis report
selected from the main menu.
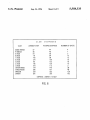
FIG. 6 is an illustration of a Club Distances report
The present system is used to record data about and
analyze a golfer’s game and then improve the golfer’s game.
10
During actual play, speci?c information is recorded during
or after the play of each hole and therafter the data is entered
into the system and it provides selective outputs which help
the golfer analyze and improve performance.
FIG. 1 illustrates a sample paper or cardboard scorecard,
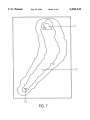
selected from the main menu. FIG. 7 is an illustration of a 15 similar to a standard scorecard (not shown), which shows
golf hole with a curved fairway, commonly referred to as a
speci?c items recorded. Pro?cient golfers develop an ability
doglcg.
to remember most of the shots and details from a round of
golf and may not necessarily require written notation of all
items shown in FIG. 1. However, the scorecard of FIG. 1 is
REFERENCE NUMERALS IN DRAWINGS
organized in the order of data entry required by the system.
01 strokes to reach green
Therefore, use of written data on a scorecard similar to that
02 problem identi?cation
03 optional notation
04 hit fairway or green
05 clubs used to reach green
illustrated in FIG. 1 will facilitate and, in most cases, lessen
06 distance to center of
O7 distance to center of
green after shot #1
08 distance of putt #1
green after shot #2
09 number of putts
l0 yardage markers
12 fairway
11 green
l3 tee box
14 golf ball
16 width of fairway
18 hole number
15 200 yard fairway
l7 shot-by-shot display
19 hole yardage
20 information on golf
21 enter data for a round
courses played
22 patterns for approach
shots to the pin
of golf
23 results and analysis
24 club distances
25 instructions
the time required for data entry into the computer system.
The scorecard has been partially completed with data of a
25
reviewed.
Row 01 (Strokes to Gr) illustrates that three strokes were
taken on hole #1 to reach the green.
Row 02 (Probs? Y/N) illustrates that yes (Y), the player
had a problem with or considered shot #1 to be less than
satisfactory and thus noted the problem with the identi?ca
tion Y1 (Y=yes; l=shot #1).
Row 03 illustrates an optional note made by the player
26 playback
30 distance of putt
40 yardage ranges
31 circumference of green
41 number of attempts to
reach the green
35
51 period covered
52 average ?gure per round
53 number of rounds
54 short game
56 distance of putt after
in analysis
55 distance of chip/pitches
57 number of chip/pitches
Wedge (W) was used for shot#3.
Row 06 (Dist 1) illustrates that the distance remaining to
59 percentage of chip/pitch
saves
saves
60 number of sand shot
61 number of sand shot saves
attempts
45
62 percentage of sand saves
63 number of putts per round
64 number of putts per hole
65 percentage of total putts
from four distance ranges
67 ball striking
66 percentage of one putts
was 30 feet.
69 percentage of greens
in regulation
71 correctable swings
Row 09 (Number Putts) illustrates that the player took one
putt to complete play of the hole.
on comparison to par
72 average number of
correctable swings
80 display monitor
82 keyboard
During play the golfer refers to existing yardage markers
73 a type of correctable
swing (slice)
81 computer with memory
83 exit to dos
the center of the green after shot #1 was 228 yards. The
player obtained this distance as explained below.
Row 07 (Dist 2) illustrates that the distance remaining to
the center of the green after shot #2 was estimated by the
player to be 106 yards.
Row 08 (Putt 1) illustrates that the distance of the ?rst putt
from each distance range
68 percentage of fairways
hit
70 hole performance based
“pull.”
tee shot landed in the fairway.
Row 05 (Club Used) illustrates that a l-Iron (1) was used
for shot #1, a 2-Iron (2) was used for shot #2, and a Pitching
chip/pitch
58 number of chip/pitch
that the problem on Row 02 with the shot was caused by a
Row 04 (Hit F/G Y/N) illustrates that yes (Y) the player’s
42 club identi?cation codes
50 player identi?cation
player’s performance on hole #1 of a course and will now be
which are provided on most courses to measure the distance
55
SUMMARY
remaining to the center of the green. This measurement
clari?es a key concept in using the system, which on each
shot until the player reaches the green is: “How far is my ball
from the center of the green?” (This concept is modi?ed
slightly on par 5 holes over 475 yards. Where necessary on
In accordance with the present invention, we provide a
par 5 holes, the player or player’s caddy will pace (measure)
golf play analysis system which is operated on a handheld,
the distance of the drive and note the distance on the
laptop, or a standard desktop microcomputer with a screen
and data entry keys. The screen of the computer provides a
diagram of a universal golf course which can portray any
scorecard with an identifying “T”, i.e. 237T, to indicate the
golf hole, regardless of shape or size. The computer’s keys
are used to enter data about the game, including the mea
surements of the course, clubs used, and shots made on each
shot was measured 237 yards from the tee. When the data is
entered into the computer system, on holes over 475 yards,
65
the system will provide a graphic reference line of 200 yards
from the tee for the player to use in placing the location of
the tee shot.)
5,558,333
7
8
Normally on most holes, the golfer will note the location
of each shot relative to the nearest yardage marker by either
stepping off or estimating the variance from the marker. This
is a common practice by most pro?cient golfers anyway, and
played, such as name of the course plus distance and par for
each hole, is normally printed on a standard scorecard (not
shown) for the course. Taking the information from this
standard scorecard, the player enters into the system through
keyboard 82 the name of the course, plus the distance and
par score for each of the eighteen holes. Normally, this
thus does not alter a golfer’s traditional habits and concen
tration which is so important and vital to good performance
information is entered only once for each set of tee boxes for
each golf course. Then it is retained by the system and is
available for future use. However, the distance for each hole
can optionally be entered after each round to allow for
normal, minor changes of tee box markers. The system can
in competitive golf.
The scorecard of FIG. 1 is specially printed for use with
the present system; however, this scorecard is not a require
ment of the system. A standard scorecard (not shown),
available at any golf course, can easily be modi?ed or
accommodate course measurements from several tee boxes,
as is common to most golf courses, i.e., Championship Tees,
adapted for recording the data illustrated in FIG. 1.
Regular Men’s Tees, Ladies’ Tees, etc. For each round the
player enters an identi?cation number, date, comments, and
DESCRIPTION—FIG. 2-—COMPUTER
course name.
Normally, at a convenient time following the actual round
of golf, the data on the sample scorecard is entered into a
The player next selects item 21 (“ENTER DATA FOR A
ROUND OF GOLF”) from the main menu. The system then
computer system which has been programmed to perform
guides the player sequentially, hole by hole, through an
the functions discussed below.
A computer 81 (FIG. 2) having a keyboard 82 and a
eighteen-hole round of golf. To facilitate data entry, the
20
display monitor 80 is programmed with thirty-one mutually
as illustrated in the sample scorecard (FIG. 1):
l. ENTER NUMBER OF STROKES (incl. PENALTY
STROKES) TO REACH GREEN #1. For example, Row 01
interrelated programs and units which perform all of the
functions described and are included in the appendix of this
application in the form of micro?che. The complete object
codes of these programs appear in the micro?che appendix.
system asks the player on each hole to respond to the
following requests presented sequentially in the same order,
25
(FIG. 1) illustrates that “3” should be entered through
These programs and units are written in the Pascal program
keyboard 82 (FIG. 2).
ming language, compiled on the Borland Pascal Compiler,
version 7.0, including the Borland Graphics Interface, and
SAND, BAD LIE, OBSTRUCTION, HAZARD, PEN
2. IF YOU HAD A PROBLEM ON THIS HOLE—
ALTY, OR POOR SWING, SELECT YES or NO.
If YES is selected, the system brings-up a screen in which
may be run on a personal computer with hard disk storage,
having an MS-DOS operating system, version 3.2 or greater,
with a mouse or trackball and VGA display capabilities.
To initiate or start the system, at the “C:\” prompt of the
MS-DOS operating system, a player types: “cd\GOLF.” This
instruction means: “Change the directory on disk drive “C”
(The hard drive) to GOLF.” This instruction changes the
prompt to “C:\GOLF>.”
the player must identify the number(s) of the stroke(s) with
a problem, i.e., 1st Stroke, 2nd Stroke, etc.
35
The player again types “GOLF” which will bring up the
main menu on Screen 80. Main menu 80 illustrates the
functions of the master program which controls all of the
programs and units in the system and allows the player to
selectively choose operations.
When an operation is completed the system automatically
Then the system brings up a screen which asks the player
to select the most applicable description for each problem
shot from the following selection menu: Correctable swing,
Sand/bunker shot, Behind tree/obstruction, Hit tree/obstruc
tion, Bad lie or heavy grass/rough, Out-of-bounds or lost
ball, Lateral or water hazard, Uneven lie, Penalty stroke.
For example, Row 02 (FIG. 1) indicates a problem with
the ?rst shot and that a selection should be made. Optional
selection of “Correctable swing” will bring up a screen
which asks the player to select the most applicable descrip
returns to The main menu to allow the player to continue
tion of the shot pattern: Fade, Draw, Push, Pull, Slice, Hook,
(line 83 of menu ) .
Row 03 (FIG. 1) illustrates that Pull should be selected.
(This information is used for analysis purposes.)
with other selections or exit to the DOS operating system 45 Push Slice, Pull Hook, Fat, Thin, Stub, Top.
The system is programmed in two versions to accommo
date a color or a black-and-white display.
When the main menu appears on the display a highlight
bar is superimposed over the ?rst or top item on the menu.
After the foregoing information is entered, or if NO is
selected, the system moves on to the next request.
The highlight bar, indicating desired selection, may be
moved to other selection items by either moving the mouse
or using arrow keys (not shown on keyboard 82)
Item 25 (“INSTRUCTIONS”) provides a menu (not
shown) of instructions as to how to proceed and operate the
system.
A player will initially proceed by selecting menu item 20
(“INFORMATION ON GOLF COURSES PLAYED”). This
item is selected by moving the highlighting bar over this
55
penalty stroke is identi?ed on this screen and is treated the
same as a club selection. A menu of club selections is
presented to the player. Row 05 (FIG. 1) illustrates that the
l-Iron (l)should be selected ?rst followed by selections of
60
the ENTER key (not shown) is pressed, the computer will
display another menu which includesthe item (“ENTER
DATA FOR A NEW COURSE NOT IN DATA BASE”).
Selection of this item provides speci?c instructions regard
the 2-Iron (2) and the Pitching Wedge (W).
5. ENTER NUMBER OF PUTTS FOR HOLE. Row 09
(FIG. 1) illustrates that “1” should be entered.
OPERATION-FIG. 3A—SCREEN
A—UNIVERSAL HOLE
menu selection; and, when the mouse button is pressed or
ing the information that must be entered about each golf
course played. Information about a speci?c course being
3. DID TEE SHOT HIT FAIRWAY OR GREEN—SE
LECT YES or NO. For example, Row 04 (FIG. 1) illustrates
that YES (Y) should be selected.
4. ENTER, IN SEQUENCE, THE CLUB USED FOR
EACH STROKE (NOT incl. PUTTS) ON THIS HOLE. A
65
After entry of the above information for each hole, the
system will automatically display the screen illustrated in
5,558,333
9
10
FIG 3A, which represents a ?rst view of a universal golf
hole. Hole number 18 and yardage of hole 19 are automati
placed on the screen based on the length of the hole which
was previously entered.
cally displayed. Because the length of each hole was pre
viously entered, Screen A will allow for the length of any
Normally, each shot will be either right or left of the
center line of the fairway and the system uses the logic of
right triangle geometry to calculate other distances. When a
shot 14 is displayed on the screen, the system has been
golf hole from the center of a green 11 up to 700 yards
measured to the back of a tee box 13. Fairway 12 represents
a fairway width 16 of 100 yards; this is su?iciently large to
simulate the width of any fairway.
supplied with the following data:
(a) The distance 19 of the hole in yards measured from the
A player using the system will quickly realize the impor
center of green 11 to the back, center of tee box 13.
tant factor of accurate representations and calculations of
(b) The distance in yards from the ball to the center of the
green.
distances, especially in accomplishing the object of deter
mining club distance achievements. No attempts are made to
depict bad lies from contour of the land, or exact locations
of trees and sand traps, etc. Such variances are provided for
under the menu selections previously illustrated. In other
words, if a tee shot lands in a sand trap (not shown in the
fairway), the player selects Sand/Bunker Shot from the
menu for the next shot (the shot used for getting out of the
bunker) to identify the problem. Also, if the player is in a
rough which is only 25 yards from the center of the fairway
and the player had a problem with the shot, the problem can
The system makes an additional measurement:
(c) The distance in yards from the ball to the center of the
fairway.
Then, using the right-angle geometric theorem that the
hypotenuse squared is equal to the sum of the squares of the
other two sides, the following additional functions are
performed:
20
(d) A calculation of the distance in yards for the shot just
made.
be identi?ed as Bad Lie or Heavy grass/rough similar to the
(e) Storage of each shot distance by club used.
Sand/Bunker Shot described in the previous sentence.
Using the logic just described, the system knows for each
Regardless of where the shot is illustrated on the screen, the
shot when the remaining distance to the center of the green
system is designed to accommodate the many variances 25 is less than 200 yards. When this occurs the system will
common to the game of golf.
automatically replace the screen of FIG. 3A with the screen
Most golf courses have 250-, 200-, 150-, and IOO-yard
of FIG 3B.
markers 10 on each fairway indicating the distance from the
marker to the center of the green. As also indicated, during
actual play, the player records, by either stepping off or
estimating the distance from the nearest marker after each
shot, on the data card of FIG. 1, the remaining distance in
yards to the center of the green for each shot until the green
is reached. In accordance with the current rules of golf
which, for handicap purposes, limit the player to a maximum
of eleven strokes per hole, the system allows a maximum of
FIG. 3B—SCREEN B—UNIVERSAL HOLE—20O
YARDS TO GREEN
The second leg or view of the universal golf hole is
illustrated in FIG. 3B. A major advantage of Screen B is the
ability to accurately place shot locations within a human
tolerance error of l~2 yards. A fairway length 15 is magni
?ed by the system to simulate a distance of 200 yards from
the center of the green to the 200 yard marker. Therefore, the
seven shots to reach the green and a maximum of four putts.
As illustrated in FIG. 3A, a green 11 is always located
near the top of the screen. A fairway 12, between the green
and tce box 13, will adjust its length, measured in yards,
available area to pin-point shot locations has been propor
40
from the center of the green to the back of tee box 13. The
spacing between the green and the tee box adjusts itself to
accurately represent the length of each hole in accordance
with the hole data previously entered. Using a standard
computer mouse or trackball (not shown), the player sequen
tially places the ball on the screen at the point where each
shot stopped. In addition, a shot-by-shot display 17 is
illustrated on the screen, indicating shot number, club used,
distance of shot, and variables affecting the shot.
A simulated golf ball 14 appears at the location adjacent
the number of each shot on the hole. The number “1”, shown
on the fairway at 14, indicates that the ?rst shot has been
made and landed at spot 14. The screen variables represent
ing the locations are stored in memory and used for the
calculation of distances between each shot.
45
and the shot will then appear on Screen B. Note the location
of shot 2 at spot 14 in FIG. 3B. When the switch of screens
50 new screen where the ball is to be placed.
In the example shown in FIG. 3B, the ball replacement is
in exactly the same relative location as originally placed in
FIG. 3A and therefore perfectly covers the ?rst ball.
A major objective of pro?cient golfers is accuracy of
55
Row 06 (FIG. 1) indicates the distance remaining to the
shots from 200 yards to the green.
Proper club selection is an important factor in achieve
ment of this objective. The reason for this second placement
is to bene?t from the magni?ed display and thereby help the
player achieve maximum accuracy in all ball placements
475 yards, the player will reference yardage markers 10 and
with the mouse or trackball will place the ball where the ?rst
within 200 yards of the center of the green.
Thus, ball placements on the screen of FIG. 3B can be
made more accurately, i.e., easily within 1 to 2 yards for the
shot stopped which is illustrated by Row 06 (FIG. 1) to be
228 yards from the center of the green. The tee box and the
center of the green are always located at exactly the center
same distance from the top of the screen and tee box 13 is
tionately increased in size.
The ?rst shot on any hole, regardless of distance, will ?rst
be placed on Screen A (FIG. 3A). However, whenever any
shot gets within 200 yards of the center of the green, the
system will automatically switch to the screen of FIG. 3B
occurs, the system automatically relocates this shot from
Screen A to the same relative position on the fairway shown
in FIG. 3B. This replacement of the ball on Screen B
visually assists the player to quickly locate the area on the
green. With the exception of a tee shot on a par 5 hole over
line or horizontal mid-point of the display illustrated in FIG.
3A.
In the representation of all holes, green 11 is always at the
‘
purposes of golf analysis.
65
Screen A provides yardage markers 10 at 50-yard inter
vals interspersed with equidistant measuring lines at 25-yard
intervals. Screen B provides the same yardage markers 10,
5,558,333
11
12
but are interspersed with equidistant measuring lines at
For all practical purposes 60 feet is ample to allow for most
10-yard intervals to enable and facilitate more accurate ball
long putts.
placements.
For purposes of clarity, FIG. 3C includes display of
The system will calculate exact distances from and to the
locations on the screen where each ball is actually placed.
concentric circles in 10-foot intervals from 10 feet up to the
60-foot apogee of oval 31. These circles are labeled 10‘, 20‘,
However, slight human errors in the physical placement of
30', 40', 50' and 60' to aid the player in placing the ball in
exactly the correct location.
Most golfers attempt to get their ?rst putt Within three feet
the ball locations possibly may occur until experience and
pro?ciency is gained in using the system. Measurement of
drives 011 the tee do not demand an error tolerance factor as
of the cup so a target circle is also placed three feet around
critical as 1-2 yards and thus the screen of FIG. 3A is a
the cup. The distance in feet of each putt 30 is displayed in
satisfactory measuring device. However, pro?cient golfers
are very concerned with pinpoint accuracy from 200 yards
to the green. The combination of the screens of FIGS. 3A
and 3B enables the analyzer to be a complete and viable
measuring device for the game of golf.
the upper left hand comer of Screen C. Once the ball is on
a green, no further reference to the center of the green is
necessary; instead, all ball locations, directions, and dis
tances are relative to the pin or cup location.
15
Another major advantage of Screen B provides the ability
to adjust to the measurement of curved fairways, or exces
to the hole to get an accurate distance of the ?rst putt, and
note the relative direction from the pin. As illustrated at 14
sively curved fairways, commonly referred to as doglegs.
FIG. 7 illustrates a typical par 4 golf hole with a dogleg
fairway. Page 32 of the USGA HandiCap System. . and Golf
Committee Manual, effective Apr. 1, 1991 through 1994,
20
(cup location) located in the middle, the player merely
places the putt on Screen C at the spot 14, representing the
relative direction and distance from the pin where the ball
was actually located on the green during play.
the measurement should be on a straight line to the center of
the green.” Each fairway shown in FIGS. 3A and 3B is
Essentially, regardless of a pin’s location during play, the
measured on a straight line from the tee on a straight line
system allows for a putt of 60 feet in any direction from the
through the center of the fairway. Therefore, in compliance
pin.
with the above reference, we simulate a fairway with a
30
quently analyze and display the accuracy of shots to the pin,
tion of any golf hole, including a hole with curved or dogleg
On page 48 of The Rules of Golf, “stroke” is de?ned as “.
35
. . the forward movement of the club made with the intention
of fairly striking at and moving the ball . . . ” By de?nition
in this application, both shot and penalty strokes are con
sidered to be a stroke.
'
measured in feet, from shots as far out as 200 yards.
In analysis, the system will start with the distance of the
?rst putt on the green, then essentially back-up or go in
reverse to determine the club used to get to the green plus the
distance of the shot. The same technique is used to analyze
the “short-game” or those parts of the game known as
chipping, pitching, putting, and greenside sand play. These
40
The number of strokes to reach the green have previously
are major advantages of the system. In exactly the same
manner as used in the previous screens to illustrate ball
been entered; therefore, when the number representing the
most recent ball placement by the player is equal to the
locations, the putts are similarly positioned with the mouse
or trackball. Accuracy of measurements on the green are
number of strokes to reach the green, the system automati
cally brings up the green of FIG. 3C (Screen C). However,
prior to bringing up Screen C, the player is requested to
An accurate measurement of the ?rst putt on a green is
important because the system will use this ?gure to subse
fairways (FIGS. 3A and 3B) to adjust for the curve. The
result provides accurate fairway measurement for a simula
fairway.
of FIG 3C, the ball is located to the right of the pin. For
example, even though a pin (cup location) may be located
near the front of a green, and Screen C always shows the pin
regarding course measurements, states: “Usually a hole with
a bend (dogleg) should be measured on a straight line from
the tee to the center of the fairway at the bend. From there
dogleg (FIG. 7) through creation of two separate straight
When a ball reaches the green during actual play we
recommend that the player step off the distance from the ball
practically and easily provided within l—2 feet.
45
select, from a menu, the number of putts taken on the hole,
FIGS. 3A, 3B, 3C——PLAYBACK
ranging from one to four putts or the alternative selection of
“Holed out from 011C the green”indicating Zero or none putts.
A complete playback or reproduction of a round of golf
For example, if a player took only one stroke to reach the 50 for any or all of the holes played and recorded with the
green, and made the putt selection of “Holed out from off the
universal golf hole (FIGS. 3A, 3B, and 3C) is available on
green,” the result would be the prestigious Hole-in-One!
demand by the player through selection of item 26 (“PLAY
BACK”) on the main menu (FIG. 2). Golf ball 14 locations
FIG. 3C——SCREEN C-UNIVERSAL
HOLE——GREEN
(FIGS. 3A, 3B, and 3C) for each shot, including their
55
Screen C (FIG. 3C) represents the third view of the
universal golf hole. Screen C is magni?ed (enlarged) to
accurately simulate measurements on a green in feet. The
apogee of oval 31 (representing the green) simulates 60 feet
from the middle of the oval, which is the cup. Therefore, the 60
maximum distance in the system for any putt is 60 feet. This
distance provides ample distance to simulate long putts and
also provides a screen size sufficiently large to accurately
place the ball within a human, placement margin error of l—2
feet.
Golfers agree there’s not much difference between 60
and 70-foot putts, so this is not a signi?cant disadvantage.
65
associated shot-by-shot displays 17 (FIGS. 3A and 3B), are
available for viewing on monitor 80. This capability offers
a sequential, hole-by-hole replay of a complete round or an
optional individual replay of any selected hole. A menu
selection “Exit” allows the player to return to the main
menu.
Pro?cient golfers like to review their outstanding rounds
and recall their strategy of course management and club
selections on selected golf courses. For example, a replay of
a hole played a year ago in a particular tournament may offer
the reminder: “Oh yes, now I remember, the thirteenth green
is elevated and I used a 4-Iron rather than a 5-Iron on the
?nal day to get a birdie and win the championship!”
5,558,333
14
13
Professionals, top amateurs, colleges, and high schools
This report is available on demand whenever main menu
80 appears.
annually play tournaments at speci?c golf courses. The
playback feature offers the capability to review how a course
By entering player identi?cation (player number) 50 and
was played in the past to provide information for improved
demand at any time through selection of menu item 22
the date of the round 51 shown in FIG. 5, the system will
present a report for the round played on the date entered in
the format illustrated.
However, note at 53 that the analysis shown covers 16
rounds. Also note that item 51, the period covered (date), has
an asterisk (*) in the ?rst position. This example informs the
system to: “Include all the rounds recorded for this play
er.”As an example, this feature can also be used to report
(“PATTERNS FOR APPROACH SHOTS TO THE PIN”).
rounds for a month or a year. In other words, the system has
This selection will allow the player to obtain a graphical
picture of all shots reaching the green for distances up to 200
yards from the green. The player can select any two distance
parameters equal or greater than one yard and equal to or
less than 200 yards. A range of 100 to 150 yards is indicated
broad and extensive report capabilities. This fact has great
importance when considering the use of this system for
evaluating progress in the process of learning and improv~
course management and club selection in the future.
FIG. 4——PA'ITERNS FOR APPROACH SHOTS
TO THE PIN
FIG. 4 shows an analysis screen which can be initiated on 10
ing. Whether the report shown in FIG. 5 is a report on one
round or several rounds, the report calculates an average
FIG. 52 for each item so as to report the results as they would
at 40.
FIG. 4 further shows at 41 that four attempts to reach the
green were made within the distance parameters of 100 to
150 yards and that all four attempts were successful, for an
accuracy percentage of 100%.
FIG. 4 further illustrates the locations of the four balls 14
which reached the green relative to the pin (cup location),
and the number identi?cation inside each ball 14 represents
the club used for each shot. Identi?cation codes 42, repre
apply to a single round. Players want to know their average
score relative to one round of golf, not necessarily their
cumulative scores. For example, a score for one round is
reported as the actual score for the round; however if the
report included two rounds with scores of 80 and 70, the
average score of 75 would be reported. The report is
25
senting types of golf clubs, are also shown.
This display clearly presents a graphical picture of
short game, i.e., that phase of the game comprised of
chipping, pitching, putting, and sand play. For all putts and
successful shots to a green from distances up to 35 yards
from the center of the green the system will calculate and
report the:
approach shots to the pin and answers several questions for
a golfer such as:
(a) What is my accuracy of approach shots from various
distances and therefore what shots do I need to work
on?. For example, shots clustered to right of the pin
may indicate to a right-handed player a tendency to hit
categorized by three sections: The ?rst section 54 covers the
35
slices. Slices are shots which end up to the right of the
player’s target because the face of the club was moving
from right to left creating a left to right spin on the ball
at the time of impact. Depending upon the situation, the
player may elect to correct the slice, or as an altema 40
tive, continue to play the slice but allow for a correction
55
56
57
58
59
60
distance in yards of chip/pitch shots
distance in feet of the putt after chip/pitch
number of chip/pitches
number of chip/pitch saves
percentage of chip/pitch saves
number of sand shot attempts
61 number of sand shot saves
62 percentage of sand shot saves
shallow pitch which will hit a ball further, in place of
number of putts per round
number of putts per hole
percentage of total putts from four distance ranges
percentage of one putts (successfully making ?rst
putts) from each distance range
The system incorporates a unique method to determine
accuracy of shots to the pin (cup location), even though the
pin location may be different each time the hole is played.
a 6-Iron.
The information illustrated above provides a means for the
to achieve more accuracy.
(b) Are my shots short, long, left, or right of the pin and
therefore what should I do to correct this?. For
example, shots clustered short of the pin may indicate
45
the player is “underclubbing”, i.e., the player should
use a 5-Iron, which is a longer club and has a more
student to improve overall “short-game” performance, i.e.,
(c) What clubs give me the best accuracy from various
distances?. Each ball on the green is identi?ed by the
club used. Therefore, the player can e?iciently and
critically analyze the results achieved with each club
used.
(d) Am I showing improvement’). The system provides a
63
64
65
66
golf play from a distance of 35 yards to the center of the
green which includes, putting, chipping, pitching, and green
side sand shots. Many pro?cient golfers regard chips,
pitches, and putts as a “short-game”0 which is interrelated.
55
Putting performance is often dependent upon performance
of chipping and pitching i.e., the better the chip, the closer
comprehensive answer to the last question (d) because,
the ?rst putt to the hole, the better the putting performance.
The present system calculates the average distance in feet of
the ?rst putt for all successful shots to the green from 35
yards out, and the average distance of the resulting putts.
not only can the golfer compare the results of each
round, the system can also combine results of rounds
and show all shots for the last month, or last tournament
of four rounds, or overall team results if desired.
This information tells the player whether practice on putting
or chipping/pitching will be more bene?cial to future per
RESULTS AND ANALYSIS REPORT
The results and analysis report shown in FIG. 5 provides
a thorough analysis of a golfer’s play. This report is initiated
by selection of item 23 (“RESULTS AND ANALYSIS”) on
the main menu.
65
formance. Additional information is provided regarding
performance of sand play and putting performance from four
different distance ranges to pin-point putting de?ciencies
and help the player determine what length of putt should be
practiced.
5,558,333
15
16
The second section 67, which is comprised of driving and
approach shots, is referred to as the “ball striking” phase of
can provide for data storage and reporting for up to and
including 999 students.
the game. The system will calculate and report on the
The screen illustrated in FIG. 6 may be printed on paper
following items:
as a permanent record by depression of the shift and print
screen keys.
68 percentage of fairways hit from tee shots on non par-3
holes
CONCLUSION, RAMIFICATIONS, AND SCOPE
69 percentage of greens hit in regulation, i.e.,
The reader will see that we have provided a system
1 shot for a par-3 hole
2 shots for a par-4 hole
3 shots for a par-5 hole
70 hole performance based on comparison to par
Number of pars
Number of birdies (one less than par)
Number of eagles (two less than par)
Number of bogies ( one more than par )
utilizing a microcomputer, which shows any selected golf
course and a complete portrayal and analysis of data of a
round of play so that golf shots can be easily and accurately
recorded. This provides signi?cant advantages to the golfer
in that
15
it provides information on the player’s ability regarding
distance and accuracy for each club used during actual play;
it provides graphical pictures of shot accuracy from
Number of double bogies (two more than par)
Number of triple bogies (three more than par)
The third section 71 deals with an analysis of problems
caused by less than perfect or less than satisfactory swing
distances up to 200 yards within a measurement factor of l
to 2 feet;
it stores data so that results can be compared and progress
patterns; we categorize these as “correctable swings”. Most
measured;
golfers at nearly all levels of playing ability know when they
it provides a playback of golf rounds so that selected
courses played in the past can be reviewed and analyzed. A
hook a shot or hit a slice. Most golfers can properly identify
the type of shot they hit. The real key and objective for most
golfers is correcting the problem that causes the errant swing
in the ?rst place. Most often the treatment to cure the
25
problem requires teaching or instruction by a knowledgeable
coach and/or teaching professional. This report is a valuable
tool for the teaching professional because it provides a
comprehensive picture of the student’s game.
playback feature will illustrate each shot and putt for each
hole for any round recorded in the system and re-display the
information as illustrated in FIGS. 3, 4, & 5; and
it provides the coach or teaching professional with a
teaching tool to motivate students and accurately measure
progress.
Although the description above contains many speci?ci
For the student who hits the tee shot down the middle of
ties, these should not be construed as limiting the scope of
the invention but as merely providing illustrations of the
the fairway 250 yards and smartly hits the approach on the
green, there is no problem. And, for these types of shots the
system will automatically record and retain the distance for
each club used. However, when the student badly slices the
presently preferred embodiments of this invention. For
example, the system is presently programmed to run under
the Microsoft MS-DOS (Disk Operating System) operating
ball off the tee into the rough on the right for a distance of
system, but can also be programmed for newer, and other
147 yards, the student has the option of declaring the shot as
operating systems, including the Macintosh operating sys
a correctable swing and identifying the shot as a slice. If the
student elects to declare the shot a correctable swing, the
shot will not be recorded or included in the distance mea
surements for the club used, but the shot will be included as
tem and the Microsoft Windows operating system. The
screens can be projected on television and movie-type
screens in addition to the computer monitor. The system can
a shot in the slice pattern category for correctable swings.
The following swing patterns or problem shots are
also be operated on future laptop and hand-held models of
microcomputers. The system will operate on standard laptop
included in correctable swings: Fade, Draw, Push, Pull,
Slice, Hook, Push Slice, Pull Hook, Fat, Thin, Stub, Top.
microcomputers which are portable and can be ended on a
The system reports at 72 the average number of correctable
swings for each round and the percentage of each pattern as
compared to the total recorded. Only those correctable
swings selected by the player will appear on this report. As
indicated at 73, the correctable swings were slices.
The screen illustrated in FIG. 5 may be printed on paper
45
golf course. However, as stated, it is very likely that a
computer system will not be permitted under current rules.
It is very possible that scorers and other golf of?cials, not
actually playing, may use the system. If permissible, the data
can be entered on a hand-held computer (instead of the
50
scorecard) during play and thereafter transferred to a desk
top computer.
Thus the scope of the invention should be determined by
as a permanent record by depression of the shift and print
screen keys (not shown) on keyboard 82.
the appended claims and their legal equivalents, rather than
by the examples given.
FIG. 6———CLUB DISTANCES
55
Distances achieved with each club are illustrated in FIG.
6. This report is initiated through selection of item 24
(“CLUB DISTANCES”) on the main menu. This report is
available on demand whenever the main menu appears, and 60
can be produced for each round, all rounds in a month, or all
rounds for each golfer or a team of golfers. For all shots over
50 yards from the center of the green the longest and average
distances are calculated for each club used during the round.
These distances are retained for each round and available for 65
combination with previous rounds for evaluation of
progress. For the coach or teaching professional the system
We claim:
1. A system for analyzing, calculating, and displaying
results from a person’s actual, physical play of any selected
hole of a plurality of golf course, regardless of the length and
shape of said golf hole, comprising:
a computer having a display, a memory, a data entry
means, and means for providing display simulations
with plural resolutions for entering data recorded from
said person’s actual play into said memory for enabling
an accurate replication of said actual play of said golf
course hole,
said computer being arranged to show a simulation of a
fairway of a golf course hole, said simulation of said
5,558,333
18
17
fairway including a simulation of a green and a plu
5. A method for accurately and automatically adjusting for
rality of equidistant markers on said fairway that dis
different pin or cup locations on the green of any hole of a
play measurements from the center of said green, a
simulation of a tee box, and a simulation of the distance
from said center of said green to said tee box, and 5
plurality of golf courses in a replication of actual play on
display means in said computer for displaying said golf
from a person’s actual play of said golf courses, into
said memory for enabling an accurate said replication
of actual play, and
from said center of said green, said computer contain
ing means for showing a golf shot placement by a
human physical act using a pointing device within a
golf course hole placement resolution that is relatively
thereby providing a visible measurement of said golf
shot after said placement, and
a second view displaying a magni?ed simulation of that
part of said golf course hold from said center of said
green measured down a center line of said fairway to
simulate a relatively long fairway distance to accom»
modate a bend to dogleg in said fairway, said computer
containing means for enabling said person to show a
golf shot placement within a fairway placement reso
lution that is relatively small compared to the length of
said fairway as displayed on said display means in said
second view, and
providing on said display two different scales of measure
ment for allowing said person to show golf shot place
ments on a fairway on said display by a human manipu
lating a pointing device using a fairway placement
15
20
25
providing three different views displaying magni?ed
different screen coordinates, use external devices, or
modify said recording or operating procedures to com
pensate or allow for different said pin locations, regard
less of said pin locations on said green of said golf
courses.
6. The method of claim 5, further including providing on
said display a resolution for enabling said person to show a
green to enable said person to show a putt placement on
golf shot placement within said fairway placement resolu
tion that allows for simulation of a human tolerance error of
35
about two yards and to show a putt placement within said
green placement resolution that allows for simulation of said
human tolerance error of about two feet.
7. The method of claim 5 wherein said computer is
arranged to display accuracy of an approach shot to a pin on
tolerance error of about two yards and to show an accurate
putt placement in said third view within said green place
ment resolution that allows for simulation of said human
resolution that is relatively small compared to the
length of said fairway and to show putt placements on
said green on said display using a green placement
resolution that is relatively small compared to the size
of said green.
simulations of said hole, whereby accuracy from said
golf shots can be displayed in measurement of said
green placement resolution without having to enter
a third view displaying a magni?ed simulation of said
said green within a green placement resolution that is
relatively small compared to the size of said green as
displayed on said display means in said third view.
2. The system of claim 1, further including means in said
computer for allowing said person to show an accurate golf
shot placement in said second view within said fairway
placement resolution that allows for simulation of a human
providing a computer having a display, a memory, a data
entry means, and means for using display simulations
with plural resolutions to enable entering data, recorded
course hole in the following three sequential views:
a ?rst view displaying the total length of said golf course
hole, measured in predetermined measurement unit
small compared to the length of said golf course hole as
displayed on said display means in said ?rst view,
said golf courses, comprising:
40
said green of said golf course by club and by selection of
distance parameters.
computer for accurately displaying patterns of said shots
8. The method of claim 5 wherein said computer is
arranged to display a short game analysis, including accu
racy to the cup for putting chipping, pitching, and greenside
using screen locations on said computer display representing
sand play.
tolerance error of about two feet.
3. The system of claim 1, further including means in said
said person’s placements of said golf shots.
4. The system of claim 1, further including means for
calculating and displaying said view of said fairway in the
form of a rectangle and calculating and displaying said view
of said green in the form of a circle.
45
9. The method of claim 5 wherein said computer is
arranged to display said fairway in the form of a rectangle
and display said green in the form of a circle.
*
*
*
*
>l<
‘UNITED STATES PATENT AND TRADEMARK OFFICE
CERTIFICATE OF CORRECTION
PATENT NO. : 5,558,333
DATED
: Scp 24, 1996
'NVENTOR(3) I S. M. Kelson and R. E. Kelson
It is certified that error appears in the above-indenti?ed patent and that said Letters Patent is hereby
corrected as shown below:
_
On the title page, item [57] ,_Abstract, 1. 24, change “35” 10 —3B—.
Col. 6, 1. 39, change “(1)” to —-(1)—-.
Col. 9,1. 7, change “16 of 100" to —-16 of 100-.
Col. 10,1. 65, change “10” to --10—--.
C01. 12, 1.1, change “60” to —60——.
C01. 13, l. 26, change “42” to —--42—.
C01. 14,1. 23, change “80 and 70” to —80 and 70—-.
C01. 14, 1. 24, change “75” to —75—.
C01. 14,1. 54, delete “0”.
C01. 14,1. 59, change “35” to —35*--—.
C01. 15,1. 12, change “70” to —7 0-.
Col. 16, line 57, Claim-1, 1. 3, change “course” to —courses—.
Col. 17, line 9, Claim 1,1. 21, change “unit” to —units—.
Col. 17 , line 19 , Claim 1,1. 31, change “hold” to -—hole—.
C01, 17, line 22, Claim 1,1. 34, change “to” to —-or—.
Signed and Sealed this
Eighteenth Day of February, 1997
Am.-
‘
641% W
BRUCE LIZEMAN
Arresting O?icer
Commissioner of Paluu: and Trademark: