1
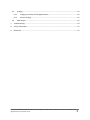
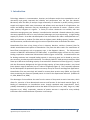
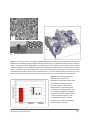
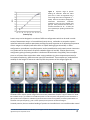
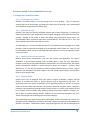
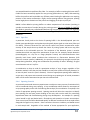
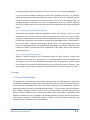
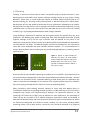
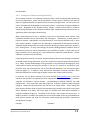
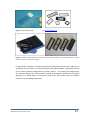
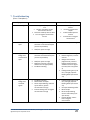
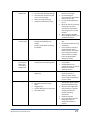
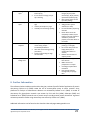
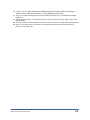
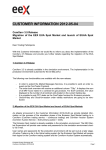
ONCYTE® Guide to Protein Microarrays June, 2012 Grace Bio-Labs 022012 ©2011 Grace Bio-Labs, Inc. All rights reserved. All the trademarks or brands in this document are registered by their respective owner. 1 Table of Contents 1. Introduction .......................................................................................................................................... 4 2. Maximizing Results With ONCYTE® Porous Nitrocellulose Film Slides………………………………………….7 3. Array Printing ........................................................................................................................................ 7 4. 3.1. General Methodology ................................................................................................................... 7 3.2. Contact Printing ............................................................................................................................ 8 3.3. Non-Contact Printing .................................................................................................................... 8 3.4. Important Considerations ............................................................................................................. 9 3.4.1. Pre-Spotting Treatment ........................................................................................................ 9 3.4.2. Film Slide Storage .................................................................................................................. 9 3.4.3. Spotting Protein Concentration ............................................................................................ 9 3.4.4. Spotting Buffer ...................................................................................................................... 9 3.4.5. Spot Size .............................................................................................................................. 10 3.4.6. Spotting Controls ................................................................................................................ 10 3.4.7. Spotting Environmental Conditions .................................................................................... 11 3.4.8. Post-Arraying Drying Time .................................................................................................. 11 Assay ................................................................................................................................................... 11 4.1. General Methodology ................................................................................................................. 11 4.2. Array Blocking ............................................................................................................................. 12 4.3. Incubation(s) .................................................................................. Error! Bookmark not defined. 4.3.1. Buffers ................................................................................................................................. 13 4.3.2. Sample Concentration......................................................................................................... 13 4.3.3. Incubation Times .................................................................... Error! Bookmark not defined. 4.3.4. Incubation Chambers and Sample Mixing .......................................................................... 14 4.3.5. Signal Amplification ............................................................................................................ 17 4.4. Washing ...................................................................................................................................... 17 5. Detection............................................................................................................................................. 17 6. Imaging and Data Analysis .................................................................................................................. 18 Grace Bio-Labs 022012 ©2011 Grace Bio-Labs, Inc. All rights reserved. All the trademarks or brands in this document are registered by their respective owner. 2 6.1. Imaging........................................................................................................................................ 18 6.1.1. Imaging Instruments and Image Resolution ....................................................................... 18 6.1.2. Scanner Settings .................................................................................................................. 19 6.2. Data Analysis ............................................................................................................................... 19 7. Troubleshooting .................................................................................................................................. 20 8. Further Information ............................................................................................................................ 22 9. References .......................................................................................................................................... 23 Grace Bio-Labs 022012 ©2011 Grace Bio-Labs, Inc. All rights reserved. All the trademarks or brands in this document are registered by their respective owner. 3 1. Introduction Technology advances in instrumentation, chemistry and software analysis have expanded the use of microarrays and greatly improved the reliability and performance over the past few decades. Microarrays offer the ability to analyze a large constituency of molecules in parallel, utilizing minimal sample and reagents. While many instruments and software tools are shared for all applications, the surface and labeling chemistries may vary depending on the molecules of interest - whether nucleic acids, proteins, inorganics or organics. A variety of surface chemistries are available, with new chemistries emerging every year. However, nitrocellulose has remained a favored substrate for protein microarray applications due to its many functional advantages and, most importantly, its high binding capacity for protein. Grace Bio-Labs developed its first nitrocellulose film slide in 1990 (McGrath et al., 1991) and continues to produce film slides with the highest protein binding capacity, lowest inherent auto-fluorescence, and best therefore signal-to-noise compared to other nitrocellulose film slides. Nitrocellulose films have a long history of use in Western, Northern, and dot- (immuno-) blots for reliable immobilization and capture of biomolecules. They have also been used in the manufacture of lateral flow immunoassays, such as pregnancy tests, in the diagnostic industry. The 3-dimensional structure of ONCYTE® Nitrocellulose Film Slides offers a considerably higher surface area for protein binding compared to conventional 2-dimensional surfaces (Figure 1A and 1B). Increased surface area for binding translates into increased binding capacity in microarray spots and is related to pore size, pore structure, pore density and film thickness. For example, ONCYTE® AVID porous nitrocellulose slides show up to 500 times the binding capacity of conventional 2-dimensional surfaces (Figure 2). Coupled with low fluorescence background, the higher binding capacity of these slides provides a very broad linear dynamic range for detection, up to 7 orders of magnitude (Figure 3). This is especially important for the development of quantitative protein microarray assays for research and diagnostic applications. Nitrocellulose films are particularly well suited for reverse phase protein arrays (RPPA, see figure 4E) where maximizing the amount of spotted protein is critical to the experimental outcome. (Paweletz et al., 2001; Balboni et al, 2006). The advantages of nitrocellulose also stem from the nature of the protein-to-matrix interaction, which allows for retention of three-dimensional structure and function of the bound material (figure 1C). Binding of biomolecules to nitrocellulose occurs through combined weak intermolecular forces, probably dominated by hydrophobic and van der Waals forces (Van Oss et al., 1987; Tang et al., 2003; Kingsmore et al., 2006). Importantly, retention of protein structure is required for many antibody interactions often used for detection of proteins in microarrays. Grace Bio-Labs 022012 ©2011 Grace Bio-Labs, Inc. All rights reserved. All the trademarks or brands in this document are registered by their respective owner. 4 A C B Figure 1. (A) Scanning electron micrograph (20,000x magnification) showing the three-dimensional structure of ONCYTE films. (B) Depiction emphasizing the advantages to spotting on a 3-dimenstional ONCYTE matrix. Scanning electron micrograph (2,000x magnification) of an ONCYTE film and a depiction of the volume a spot would fill through the thickness of the 3-D film (left) compared to a depiction of the same spot on a two-dimensional surface (right). (C) Depiction of the three-dimensional surface of an ONCYTE film which allows for the retention of the three-dimensional structure (and function) of spotted protein. In this case, DNA polymerase is depicted in a form which retains its structure, thus allowing its use in a functional assay on the solid support of an ONCYTE slide. Figure 2. Protein binding capacity for ONCYTE® AVID compared to 2dimensional nitrocellulose (Gentel PATH) and aminosilane functionalized glass slides. The ONCYTE 3-dimensional surface allows for approximately 500 times the protein binding capacity. Data are normalized, background-subtracted fluorescence intensities collected at 532 nm from spotted goat IgG-Cy3. Data presented are the mean ± standard deviation for N = 4 slides per slide type (20 spot replicates per slide). Grace Bio-Labs 022012 ©2011 Grace Bio-Labs, Inc. All rights reserved. All the trademarks or brands in this document are registered by their respective owner. 5 Figure 3. Dynamic range of protein binding for ONCYTE® AVID film slides spans over 7 orders of magnitude with a 2 linear range of 6 orders of magnitude (r = 0.999). Data are normalized, backgroundsubtracted fluorescence intensities collected at 532 nm from spotted goat IgG-Cy3. Data presented are the mean ± standard deviation for N = 4 slides (20 spot replicates per spotting concentration per slide). Protein arrays can be designed in a number of different configurations which can be used in a wide variety of downstream assays. In Forward-Phase Protein Arrays, antibodies are arrayed as capture molecules and used to perform quantitative profiling of protein expression or for detecting the presence of their antigens in complex lysates after direct or hapten labeling (Figure 4A and 4B). In other configurations, recombinant or purified proteins can be immobilized to study protein-protein interaction or to probe sera for the presence of specific antibodies (Figure 4C and 4D). Another protein array configuration gaining increasing attention is the Reverse-Phase Protein Array (RPPA), where complex tissue or cell lysates from tissues taken under varying conditions (e.g. dose-response experiment) or from patient samples (e.g. different tumor types) are immobilized. These samples are probed with an antibody for the antigen of interest in order to profile the presence of this antigen (Figure 4E). Figure 4. Design of Protein Microarrays. Depicted above are some commonly employed configurations. (A) Antibodies used to capture specific antigens which are directly labeled with a hapten or (B) for detection in ELISAlike sandwich assays. (C) Purified or recombinant proteins can be arrayed to study protein-protein interaction or (D) to probe serum samples for antibodies. (E) Reverse-Phase Protein Arrays (RPPA) are used to profile dozens or hundreds of arrayed samples (e.g. cell or tissue lysates) for the presence of selected antigens. In actual practice, the non-covalent bonding of proteins to nitrocellulose is not reversible under normal Grace Bio-Labs 022012 ©2011 Grace Bio-Labs, Inc. All rights reserved. All the trademarks or brands in this document are registered by their respective owner. 6 spotting and assay conditions used in microarray applications (Stillman et al., 2000; Oh et al., 2006). 2. Maximizing Results With ONCYTE® Porous Nitrocellulose Film Slides Results obtained with any microarray experiment can be highly variable if controls are not implemented during the various steps involved with the technology. Figure 5 summarizes the steps required to perform a microarray experiment. Variability may be introduced at any of these steps, and cumulative affects can result in variability that makes results difficult to interpret. Figure 5. General outline of a typical microarray experiment. Grace Bio-Labs offers products which, together with our premium ONCYTE® film slides, address significant steps in protein microarray analysis. Creating protein arrays on ONCYTE® film slides and using the recommendations outlined in this guide can help yield results with clear signals, good spot morphology, low background and low variability, which allows the researcher to interpret his or her data with the utmost confidence. 3. Array Printing 3.1.General Methodology ONCYTE® Film Slides are ready for printing straight from the box, and no activation steps are required to immobilize proteins. It is important not to pre-wet ONCYTE® Film Slides as printing onto a wet slide will cause the sample to spread, resulting in larger, more diffuse spots. When spotting, attention to environmental conditions is critical for optimal results, and temperature and humidity should be regulated. In general, environmental control will serve to provide more consistent results from arrays spotted during different spotting runs. Pure proteins should be arrayed using a source plate concentration of 0.05–1 mg/ml. A concentration between 50 and 1000 µg/ml is optimal for most applications. For antibodies, the upper end of this range is recommended. If using a fluorescent scanner for subsequent detection, a spot diameter of 250 µm or less is recommended, and the array pitch (distance of neighboring spots from center to center) can be as low as 300 µm. For chemiluminescent or isotopic detection, spot Grace Bio-Labs 022012 ©2011 Grace Bio-Labs, Inc. All rights reserved. All the trademarks or brands in this document are registered by their respective owner. 7 diameter can be significantly larger than for fluorescent detection. However, a pitch of 1000 µm or greater is recommended to allow for sufficient resolution. Different microarray printers come with their own control software which can vary significantly in look and feel. All robotic printers accommodate a specific format of the input source material (typically a 96- or 384-well plate), the desired arraying pattern on the slide surface, the cleaning parameters between sample wells and, depending on the spotter, control of environmental conditions during spotting. All of these parameters will vary depending on the individual applications and, in many cases, require some degree of optimization. Key parameters are discussed in more detail in the remainder of this section. 3.2.Contact Printing Contact printing utilizes pin-type arrayers that transfer a defined volume of sample by directly touching the surface of the slide. Despite the relatively soft nitrocellulose surface of ONCYTE® Film Slides, contact printing can be performed without physically damaging the coating if the arrayer settings are appropriately adjusted. It is recommended to use contact arraying systems that feature free-floating pins in their print-heads, as opposed to spring-loaded pin mechanisms. Contact printers are usually simpler in design, less expensive, and faster than non-contact printers (depending on pin configuration), and they may be the best choice when large numbers of samples or highly viscous samples will be spotted (such as with RPPAs). Split pins, quill-type pins, and solid pins have all been successfully used for printing proteins on ONCYTE® Film Slides. Some pin cleaning protocols recommended by manufacturers have been optimized for DNA printing applications and may not be best for spotting of proteins because of higher viscosity and adhesiveness of proteins compared to nucleic acids. Addition of a surfactant such as Bioterge AS-40 in a very low concentration (e.g. 0.025 %) to the wash solution has been found to be advantageous when using quill pins. Ring-and-pin printers are a variant of contact printers. Samples are taken up from the source plate with rings mounted in front of the spotting pins. The pin passes the ring to deposit sample on the slide surface. This technology has been successfully used with very viscous tissue lysates containing high concentrations of urea and detergents (Nishizuka et al., 2003). Examples of contact printers that have been successfully used for array production on ONCYTE® Film Slides include Aushon 2470, SpotBot® and NanoPrint™ (ArrayIT® Corporation), OmniGrid® and MicroGrid (Genomics Solutions Ltd.), and Q-array (Genetix, Ltd.). 3.3.Non-Contact Printing Non-contact printers can be syringe-based (solenoid) or piezo type. With these technologies, sample droplets are dispensed onto the slide, avoiding contact of the print pen with the surface. Sample volume can be varied in steps by firing multiple times on the same spot. This technique enables very high reproducibility and speed when manufacturing large numbers of limited-content arrays. As with contact deposition printers, pen cleaning protocols should be optimized for protein samples. Examples of systems which have been successfully used with ONCYTE® Film Slides are the Grace Bio-Labs 022012 ©2011 Grace Bio-Labs, Inc. All rights reserved. All the trademarks or brands in this document are registered by their respective owner. 8 NanoPlotter™(GeSiM) and sciFLEXARRAYER (Scienion AG). 3.4.Important Considerations 3.4.1. Pre-Spotting Treatment ONCYTE® film slides require no pre-processing prior to array spotting. They are ready for spotting right out of the package. Pre-wetting the slides prior to spotting is not recommended and may lead to the generation of diffuse spots. 3.4.2. Film Slide Storage ONCYTE® film slides are specially packaged in boxes with minimal off-gassing. It is advised to store the film slides at room temperature in the original packaging at all times before and after printing. Storage of film slides in other slide boxes may compromise results and is not recommended. Many researchers store their arrayed ONCYTE® film slides at 4°C or -20°C, and these conditions will not harm the slides or results. As a starting point, it is recommended that ONCYTE® Film Slides be stored overnight at 4°C after printing in order to maximize the binding of the immobilized protein before use. Note: It is not recommended to store printed or unprinted slides with desiccant as this may negatively impact microarray results. 3.4.3. Spotting Solution Concentration Optimal source plate concentrations may vary with protein and application. For capture antibodies, a concentration between 250 and 1000 µg/ml is best for most applications. However, some formats may require different concentrations. For cell/tissue lysates, the highest protein concentration possible is usually desired to detect rare antigens. Typically, serial dilutions (1:1, 1:2, 1:4, etc.) are spotted in parallel to establish that the assay is in linear range of detection. The assumption is that the target on the slide should not be limited in concentration relative to the sample probe. 3.4.4. Spotting Buffer Protein arrays may be designed with many types of targets: antibodies, antigens, purified proteins or complex cell lysates or protein mixtures may be deposited on the array. For applications where the native conformation of the deposited proteins is desired, an arraying solvent must be chosen that maintains the protein’s molecular structure and/or recognition properties. Non-denaturing spotting solutions should consist of a buffer with suitable pH and ionic strength, and may contain other stabilizing agents like protease inhibitors, chelators, etc. PBS is often a suitable spotting solution. Addition of non-denaturing detergents (e.g. 0.1% Tween-20) may help with controlling spot size and morphology. Some applications may require the presence of detergents and/or chaotropes (e.g. urea) for cell disruption and/or solubilization of proteins. Generally, substances like these are compatible with ONCYTE® Film Slides. Solubilization buffers originally designed for 1D and 2D electrophoresis Grace Bio-Labs 022012 ©2011 Grace Bio-Labs, Inc. All rights reserved. All the trademarks or brands in this document are registered by their respective owner. 9 are compatible with nitrocellulose film slides. For example, a buffer containing 6 M urea and 2% CHAPS has been successfully applied for array printing (Nishizuka et al., 2003). SDS-containing buffers also perform well and exhibit very efficient protein binding for applications not requiring proteins in their native conformation. Highly viscous spotting solutions may give poor spotting results largely due to limitations of the printers and clogging of the pins or print jets. DMSO is often added to printing buffers to reduce evaporation of the solution (resulting in variable concentration of sample) during the printing process. The use of DMSO for ONCTYE® Film Slides is generally not recommended because high concentrations of DMSO can negatively affect the nitrocellulose. If DMSO is added to the printing buffer, final concentrations should not exceed 5%. 3.4.5. Spot Size A parameter closely tied to the choice of spotting buffer is the desired/required spot size. Smaller spots provide higher analyte density and typically better signal-to-noise ratios (Ekins and Chu 2003). Technical constraints for spot size can come from protein concentration and/or viscosity of the sample that may dictate the choice of printing system and hence may place constraints on the achievable spot size. The resolution of the detection system is another consideration which may require the optimization of spot size. For example, isotopic detection (autoradiography on x-ray film or image phosphor screens) and chemiluminescence have generally much lower spatial resolution than colorimetric or fluorescence detectors (CCD camera or scanner systems). Additionally, the spot pitch should be large enough to avoid spot overlap during detection, taking into consideration the possibility of lateral “bleeding” of signal onto substrates such as X-ray film. A consideration to keep in mind for quantitative analysis of array images, regardless of the detection method, is that the pixel size should be no more than 1/10th of the spot diameter (i.e. at least 10 pixels across the spot’s diameter). Choice of appropriate spotting buffer additives, arrayer pins, and proper environmental control during array spotting are all critical parameters which can be used to attenuate the spot size to the desired level. 3.4.6. Spotting Controls As previously mentioned microarray experiments are subject to many sources of variation which can be introduced during array spotting. A key consideration which allows for assessment of array spotting quality and is also useful during data analysis (for normalization if required) is the choice of appropriate spotting controls. Spotting controls will allow the researcher to identify poor spotting runs and poor protein binding to the array and are also useful for normalizing experimental data and troubleshooting during assay development. An example of a spotting control would be IgG pre-labeled with a fluorophore and spotted at a known concentration. These control spots should be distributed equally at different coordinates of the arrayed surface alongside the regular array content. Some researchers choose to include a pre-labeled control in each sample well. Regardless of the method of choice appropriate for your application, Grace Bio-Labs 022012 ©2011 Grace Bio-Labs, Inc. All rights reserved. All the trademarks or brands in this document are registered by their respective owner. 10 including spotting controls merits attention early in the process of your assay development. It is also important to deposit replicates for each protein spotted on the array. As previously stated, microarray experiments are subject to a variety of sources of noise and include artifacts caused by speckles, precipitates or dust particles either in the air or in the spotting buffer. By including replicates, a researcher can take the representative value (e.g. median, geometric mean) from multiple spots so that one faulty spot does not significantly impact the experimental results. 3.4.7. Spotting Environmental Conditions Temperature and humidity should be regulated to control spot drying as well as to avoid evaporation of source plate solutions during the arraying process, and in the case of contact printing, to avoid evaporation of sample from spotting pins during pin travel. In general, too low humidity may cause spots to dry too quickly (causing spots with higher protein concentration on the spot perimeter – typically manifesting as “donut” spots). Too high humidity may cause larger spots and potentially spot-to-spot bleeding (depending on spot pitch). Additionally high humidity may lead to problems with water condensation in the spotter. Refer to the manual of the arraying system. 3.4.8. Post-Arraying Drying Time Stability of protein binding to the nitrocellulose matrix has been found to increase with appropriate drying time. As a starting point, it is recommended to store the spotted array overnight at 4°C prior to use to allow optimal binding of the printed proteins. As with protein concentration, this parameter should be optimized for your particular proteins and assay. Long term storage of spotted arrays should also be optimized and can be performed at 4°C or -20°C. 4. Assay 4.1.General Methodology The sequence of steps required for a microarray experiment will vary depending on the application and detection methodology utilized. Most microarray assays will first employ an array blocking step to inactivate any unbound portions of the array surface. Blocking is usually followed by a series of wash steps aimed to remove any unbound spotting material. The array is then ready for incubation with a primary antibody, cell/tissue extract, serum, or probe molecule. Multiple wash steps may follow or further incubations with a secondary antibody and/or other probes. Depending on the detection method, there may be multiple cycles of binding/washing, with the ultimate incorporation of a detection molecule or amplification system. Typically arrays are washed and dried at the completion of all incubations and prior to detection. Grace Bio-Labs 022012 ©2011 Grace Bio-Labs, Inc. All rights reserved. All the trademarks or brands in this document are registered by their respective owner. 11 4.2.Blocking ‘Blocking’ a microarray surface helps to reduce non-specific binding of probe molecules or dyes. Blocking may be performed in bulk solution utilizing a histology staining jar (e.g. Coplin, Corning, Wheaton). Place arrays in a slide cradle and immerse in blocking solution (typically 200 ml in a Wheaton staining jar). Blocking can be performed with or without shaking on an orbital shaker. Blocking time will vary and should be determined for your applications. Depending on the sample, blocking times can range from 15 min to overnight and need to be determined empirically. For long incubation times (i.e. hours) care must be taken that the slides do not dry out. The use of a humid chamber (e.g. a zip-lock bag with wetted paper towel) is highly advisable. Proper blocking is imperative for obtaining the best signal-to-noise ratio possible from any array experiment. The blocking step should be performed after slides thoroughly dried after printing (typically overnight at 4°C) and the type of blocker used will depend on the nature of the experiment. Grace Bio-Labs’ Super G Protein Array Blocking Buffer was developed and optimized for use with ONCYTE® Film Slides. This blocking reagent was primarily developed for use in fluorescent assays but is also compatible with other common detection methods. It is recommended for its superior blocking power and the resulting low non-specific binding/background , producing superior signal-to-noise. Figure 6. Effects of proper blocking on ONCYTE® film slides. (A) Slide blocked with Grace Bio-Labs Super G Protein Array Blocking Buffer for 1 hour prior to assay. (B) Slide not blocked (soaked in PBS for 1 hour) prior to assay. . A B Grace Bio-Labs has spent decades optimizing the production of our ONCYTE® nitrocellulose films to minimize the inherent background so commonly associated with nitrocellulose film slides. We have found that, for fluorescent assays, incomplete blocking of slide surface prior to hybridization will reduce or eliminate the advantages of our premium films. Optimal performance of our ONCYTE® films can only be guaranteed with use of Super G Protein Array Blocking Buffer. Many researchers utilize blocking protocols identical to those used with Western Blots on nitrocellulose membranes. A physiological buffer (1x PBS or 1x TBS) containing 1–5% non-fat milk is compatible with isotopic and chemiluminescent detection. For fluorescent detection, 1x TBS containing 0.1% Tween 20 (1x TBS-T) may be sufficient for some applications. The percentage of Tween 20 may be increased to 2% if needed. Preliminary experiments should be conducted to determine the optimal blocker and concentration for fluorescent systems. Some blockers can add to the fluorescent background and should be chosen carefully. For this reason, blocking buffers containing protein, such as BSA, casein or non-fat dry milk, should be examined on an empirical Grace Bio-Labs 022012 ©2011 Grace Bio-Labs, Inc. All rights reserved. All the trademarks or brands in this document are registered by their respective owner. 12 basis. A good starting point is 1% BSA (e.g. Sigma cat. no. A-7638, "cold alcohol precipitation fractionation, prepared from Fraction V bovine albumin") + 0.05% Tween 20, in PBS (pH 7.2-7.5). Casein-based solutions are efficient blockers due to a broad spectrum of molecules of different sizes. However, because of poor solubility, casein-based solutions carry the risk of causing speckles on the arrays due to precipitates. 4.3. Binding Assay In many applications, pure capture molecules (antibodies, recombinant proteins) are immobilized on the slide surface. Generally, this array is incubated with a complex solution to be analyzed for the presence and concentration of specific binding partners. To allow for and detect this interaction, one or more incubations will be performed after blocking and may vary from assay to assay. All conditions and parameters will require optimization to obtain the highest quality data. Key parameters which should be assessed are discussed in the remainder of this section. 4.3.1. Assay Buffer In order to define a suitable hybridization buffer for the probe, the same general considerations apply as for the printing buffer . The assay buffer must allow proteins to maintain their molecular biologically relevant structure and recognition properties. In addition to stabilizing agents, it is recommended to include a blocking agent in the assay buffer. An appropriate buffer for sample incubation can be PBS (pH 7.2-7.5) containing 0.05% Tween 20, 0.1% BSA, and including other additives such as protease inhibitors. This may also serve as a generic dilution buffer if samples are to be diluted. 4.3.2. Sample Concentration Protein concentrations in the (probe) sample will vary based on the nature of the experiment. They will be governed both by concentration of the molecules to be measured and affinity of the arrayed antibodies for them. Hence, individual assay conditions must be determined empirically. Different sample dilutions (e.g. 1:2, 1:4…) should be tested. 4.3.3. Incubation Times The incubation time needed to establish equilibrium binding will vary with the type of experiment. If probing with an antibody in an experiment analogous to a Western Blot, 1–2 hours at room temperature are usually sufficient. Other types of samples may need to be incubated overnight in order to maximize intensity of interaction. Assay incubations longer than 24 hours may provide diminishing returns, as non-specific binding will continue to increase after specific binding is saturated. Optimal conditions should be determined empirically. Depending on assay configuration, there may be 2 or more separate incubation steps, each separated by washing steps. Incubation times for the samples being tested are generally the longest step in the protocol (from one hour to overnight). Hence, care must be taken to prevent the arrays from drying out. The use of a humid chamber is highly advisable (zip-lock bag or similar). If the sample is directly labeled with a fluorophore, protection from light during incubation is also Grace Bio-Labs 022012 ©2011 Grace Bio-Labs, Inc. All rights reserved. All the trademarks or brands in this document are registered by their respective owner. 13 recommended. 4.3.4. Incubation Chambers and Sample Mixing The incubation chamber is an important parameter which is often overlooked when performing microarray experiments. Arrays may be processed in various types of chambers, the choice of which can significantly affect the quality of the microarray data generated. For many users, the choice of chamber will be dependent on one primary factor – the volume of sample available for the assay. Regardless of the chamber chosen, though, it ideally should allow for sufficient sample mixing during the assay incubation and wash steps. Adequate mixing has been shown to significantly affect assay signal and uniformity. When ample quantity of probe is available, arrays may be processed in bulk solution using incubation chambers such as slide mailers and staining jars. Alternatively, if probe protein is limited in quantity, hybridization may be performed in small-volume chambers and, in some cases, under coverslips. In general, use of a staining jar coupled with an orbital shaker allows for adequate sample mixing and is an excellent choice for blocking and wash steps where volume is not a limiting factor. In many cases though, the primary binding/reaction incubation steps of the microarray assay are volume-limited due to the availability of probe. In these cases use of larger containers such as staining jars is not feasible due to excessive sample dilution. Smaller chambers are preferred for these steps. Coverslips generally allow for the lowest sample incubation volumes and, although not ideal due to limited sample mixing by diffusion, some users are driven by limited sample volumes (Kersten et al., 2003). Another disadvantage of using coverslips is the potential for damaging the array surface when manually removing the coverslip. If the use of a coverslip is necessary for your particular assay, we recommend the use of Grace Bio-Labs HybriSlip™ over conventional glass coverslips (Figure 7). In addition, Grace Bio-Labs has developed incubation chambers which facilitate incubations for a wide range of sample volumes with various levels of mixing. In particular, the Pro-Plate® chamber from Grace Bio-labs (www.gracebio.com) is very well suited for most protein array applications when using ONCYTE® film slides. ProPlate® incubation chambers are available in various formats – corresponding to available ONCYTE® film slide configurations – from single-well to 64-wells (Figure 8). ProPlate® chambers enable thorough mixing of samples during incubations with the use of an orbital shaker. Active mixing with these devices has been shown to significantly decrease assay variation within spots, across spots within individual array slides, and across spots on multiple array slides when compared to coverslip incubations (Figure 9). The effect of this mixing is more robust microarray data. In addition, ProPlate™ chambers can simplify the microarray workflow as they are compatible with multi-channel pipettes and allow for convenient sample dispensing and buffer replacement during solution changes. HybriSlip™ HybriWell™ Grace Bio-Labs 022012 ©2011 Grace Bio-Labs, Inc. All rights reserved. All the trademarks or brands in this document are registered by their respective owner. 14 Figure 7. From Grace Bio-labs: See: www.gracebio.com Figure 8. ProPlate chambers enable active mixing of sample during hybridization. The chambers attach to slides for hybridization and are removed for imaging. If using ProPlate™ chambers, the blocking step may be performed across the entire slide prior to attachment of the chamber, or may be performed in individual chambers. Appropriate volumes for the various chamber configurations are listed in Table 1. For blocking and washing steps, the maximum volumes are recommended. Incubate at appropriate temperature with gentle agitation on an orbital shaker, ensuring that mixing occurs. (See product insert for complete instructions or visit www.gracebio.com). Grace Bio-Labs 022012 ©2011 Grace Bio-Labs, Inc. All rights reserved. All the trademarks or brands in this document are registered by their respective owner. 15 Figure 9. Effects of active mixing. Microarray slides were fitted with a ProPlate chamber during assay incubations. Coefficient of variation is compared against results obtained from an identical assay under a cover slip where mixing is limited to sample diffusion. All data obtained from spotting concentration of 1 mg/ml (within the linear dynamic range of detection). Fluorescence data are normalized and background-subtracted, collected at 532 nm from spotted goat IgG assayed with rabbit anti-goat IgG-TRITC (CoverSlip – 50 µl, 1:25,000 Dilution; 4-well ProPlate – 300 µ/well, 1:150,000 Dilution). Intra-Spot CV data are pixel variation per spot, N = 64 spot replicates (over 4 microarrays). Intra-Slide CV data are spot variation per array, N = 4 microarrays (mean of N = 16 spot replicates/array). Inter-Slide CV are for an N = 4 microarray slide replicates. Based on histology staining methods, some researchers simply cover the array with liquid kept in place by encircling the array with a hydrophobic marker pen (e.g. PAP pen, Kukar et al., 2002). This method suffers the same disadvantages as with coverslips (limited sample mixing). In addition, this, and any method utilizing an open chamber, allows evaporation and drying of the array and subsequent concentration of the hybridization solution may occur even for short incubations. We recommend the use of humidified chambers to minimize this effect. Table 1. Suitable incubation volumes for use with ProPlate™ chambers. ProPlate™ Format Well Volume (Min – Max) 1 Pad 700 – 2000 µl 2 Pad 250 – 1000 µl 4 Pad 125 – 500 µl 8 Pad 70 – 250 µl 16 Pad 70 – 125 µl 64 Pad 20 - 50 µl For users with access to automated systems, single-pad ONCYTE® Film Slides may be processed with devices designed for processing of immunohistochemistry slides (Paweletz et al., 2001) or automated hybridization chambers (e.g. GeneTAC Hybridization Station, Digilab Genomic Solutions Inc.) for processing of DNA microarrays (Madoz-Gúrpide et al., 2001). Automation can improve reproducibility of results by eliminating variability in processing times and Grace Bio-Labs 022012 ©2011 Grace Bio-Labs, Inc. All rights reserved. All the trademarks or brands in this document are registered by their respective owner. 16 temperatures. The automated system must accommodate the full coated area of the slide. 4.3.5. Signal Amplification For some applications signal amplification will be necessary when antigen levels are very low. Frequently, systems employing horseradish peroxidase (HRP) and alkaline phosphatase (AP) are used. With either HRP or AP, either chemiluminescent or chromogenic substrates can be used. If using AP-based chemiluminescent substrates, enhancers for nitrocellulose may be required, depending on the reagent system employed. 4.4.Washing A physiological buffer should be used for washing that preserves the protein-protein or proteinnucleic acid interaction, yet washes away unbound sample. A good wash buffer is generally the same as the blocking solution used minus the blocking agent. As a starting point, a typical wash protocol consists of 3 washes with PBST (5 min. each with shaking) followed by 3 washes with PBS (5 min. each with shaking) followed by a 1 min. rinse with filtered water at room temperature. Slides are then dried with a stream of dry N2 or by centrifugation prior to detection. 5. Detection ONCYTE® Film Slides are compatible with many detection methods (Figure 10). Common methods employed routinely for Western and Northern blots are compatible with porous nitrocellulose films and include fluorescent, chemiluminescent, isotopic, and chromogenic detection. The method of choice used for protein detection will depend on the application. For example, for analysis of phosphorylation, labeling with γ-32P-ATP and detection by autoradiography is still considered a very reliable method. Detection using fluorescent dyes is very convenient, has high spatial resolution as well as very high sensitivity. Commonly used fluorophores include Cy3, Cy5, corresponding Alexa-and Dyelightfluorophores, Phycoerythrin and others. Infra-red fluorophores such as IR800 have also been used with excellent results (Calvert et al., 2004, Yeretssian et al., 2005). In general it has been observed that longer wavelength fluorophores such as Cy5 (and analogs) or IR800 are often advantageous. Many biomolecules present in blocking reagents and samples have an inherent autofluorescence and will bind to the surface thus contributing to background. Blocking with Super G will significantly minimize background fluorescence but this phenomenon can be further lessened when using red and far-red wavelengths for detection. Grace Bio-Labs 022012 ©2011 Grace Bio-Labs, Inc. All rights reserved. All the trademarks or brands in this document are registered by their respective owner. 17 Figure 10. Examples of results obtained with ONCYTE® film slides with various detection methods. (A) Typical result obtained with colorimetric endpoint (courtesy of Satoshi Nishizuka, Iwate Medical University), (B) typical result obtained with fluorescent endpoint detection (courtesy of an of OEM partner), and (C) typical results obtained with IR dye fluorescent endpoint detection (courtesy of University of Nottingham). 6. Imaging and Data Analysis 6.1.Imaging For preparation of slides for chemiluminescent, colorimetric and isotopic applications, follow standard nitrocellulose membrane protocols for the specific detection reagents being used. In some instances (e.g. chemiluminescence and some staining protocols) the slide will remain wet and can be placed in plastic wrap or other material to prevent drying. For fluorescent detection using a microarray-based imager, the slide should be dried after the final wash. Excess water droplets on the edges can be removed gently with a lint-free tissue or a compressed N2 stream. Be careful not to damage the surface as this may lead to background artifacts. A simple drying method is to spin the slides briefly (using a 50 ml conical tube as a slide holder) in a suitable centrifuge (2-3 minutes at 150 x g) followed by at least 10 minutes of drying at room temperature (in a dust-free dark place) until imaging. If stored as recommended the signals remain stable over weeks and months after processing. 6.1.1. Imaging Instruments and Image Resolution ONCYTE® Film Slides can be analyzed using a variety of laser scanners or CCD imaging systems. As a general rule of thumb, spot diameter should be at least 10x pixel size in order to sample sufficient data for a quantitative analysis. For arrays printed according to the recommended settings, a resolution of 10 µm will be optimal. Imaging instruments such as gel-imagers usually work at considerably lower resolutions (pixel size 25 µm or larger). Thus, other imaging systems Grace Bio-Labs 022012 ©2011 Grace Bio-Labs, Inc. All rights reserved. All the trademarks or brands in this document are registered by their respective owner. 18 may require larger spot sizes if results are to be quantified. For optimum use of the dynamic range of the scanning system, it is recommended to save data using the maximum depth compatible with the evaluation software (e.g. 16-bit tiff-file). 6.1.2. Scanner Settings When imaging ONCYTE® Film Slides for fluorescent applications, the default imager parameters for glass slides will not be suitable for detection. Due to the higher binding capacity of ONCYTE® Film Slides, as well as the unique light scattering properties of the polymeric surface, laser power and/or PMT settings (voltage, gain) will need to be set lower than for glass slides. If the scanner has confocal optics and focal depth adjustment, the focal depth should be optimized since the nitrocellulose coating is approximately 12 µm thick. On non-confocal systems this is not necessary as the fixed focal depth of field is usually larger than the thickness of the NC layer (e.g. the Axon GenePix 4100A has 40 µm depth of field). The laser and PMT settings will also depend on the type of experiment and blocking agent used. Typical starting parameters for some popular instruments are given in Table 2. For best results, these settings should be further optimized. In order to take full advantage of the dynamic range of the scanner, signal intensities should be as high as possible without reaching or exceeding the maximum of the system (i.e. pixel intensity = 65535 on a 16-bit system). Signals exceeding this limit (i.e. saturated spots typically appear white) cannot be analyzed quantitatively. 6.2.Data Analysis Once image data is acquired and digitized, spot intensities must be measured and analyzed. There are countless methods for analyzing array data and many are customized to the experimental design employed for individual experiments. It is not the goal of this guide to teach statistical methods for analyzing array data but rather to give a brief overview of the steps required to acquire measured spot intensities for subsequent analysis. To this end, use of a spot mask corresponding to the spotting layout is employed (usually obtained from the array spotter) to overlay the image file. Spotfinding algorithms may be employed to fit each spot and to quantify the spot and local background intensities. Typically, intensities are reported in multiple ways (ex. mean and median pixel intensities per spot) and it is commonly recommended to use the median pixel intensity as this minimizes data being skewed by noisy images (ex. small speckles on image). It is also advisable to use local spot background measurements for performing background subtraction as opposed to taking global background measurements as these measurements may vary from location to location on an array. Table 2. Laser and PMT settings for common fluorescent scanners. Scanner Model Axon GenePix 4100A Axon GenePix 4200A Tecan LS200 Perkin Elmer ScanArray 4000 Laser Power Not Variable 95 Not Variable 80 PMT Gain 400 400 95 40 Grace Bio-Labs 022012 ©2011 Grace Bio-Labs, Inc. All rights reserved. All the trademarks or brands in this document are registered by their respective owner. 19 7. Troubleshooting (Fluor = fluorophore ) Symptom 1. 2. 3. Low Signal Saturated spots High background and saturated spots Cause Remedy Scanning: PMT/laser power too low Sample: no binding, sample concentration too low Detection antibody does not bind Fluor conjugate concentration too low Increase PMT/laser power of scanner Use more concentrated sample Include suitable positive controls Increase fluor conjugate concentration White coloring indicates spot saturation: avoid saturated spots (cannot be quantified) Reduce PMT/laser settings PMT/laser power too high White coloring indicates spot saturation: Avoid saturated spots (cannot be quantified) PMT/laser power too high Brightness/contrast in imaging software not set appropriately Insufficient blocking Reduce PMT/laser settings Reduce brightness, increase contrast Background cannot be judged visually: measure background with analysis software and assess signalto-noise (refer to Symptom 4) Prolong blocking time (> 30 min, overnight) optimize blocking buffer (see section 4.2) 4. High background and weak signals Insufficient blocking Matrix-effect of sample Direct sample labeling: unbound dye in solution, protein concentration too high Indirect labeling: fluor conjugate concentration too high Prolong blocking time (> 30 min, overnight) optimize blocking buffer (see section 4.2) Use Super G blocking buffer Dilute sample Direct sample labeling: remove unbound dye (use spin column) Indirect labeling: reduce fluor conjugate concentration Grace Bio-Labs 022012 ©2011 Grace Bio-Labs, Inc. All rights reserved. All the trademarks or brands in this document are registered by their respective owner. 20 5. Cloudy background Insufficient washing Dry out of slide during processing Final wash step (water rinse) left out or not long enough Post-processing slide drying Protocol not followed correctly 6. Swirls or smeary stripes Vortexes and wave pattern forming during shaking with sample Portion of pads dried out during incubations Arrayed probe does not bind sample, but shows blocking effect Black holes (spot appears darker than surrounding background) 8. Scratches Surface of slide touched with pipette tip 9. Missing spots Bent or broken pin(s) Salt/other material on tip of pin(s) Clogged pin(s) Volume difference in source plate Wet slide surface 7. Use more wash steps (minimum 3 changes) Increase detergent concentration in wash buffer (Tween 20 up to 2%) Increase wash temperature (37 °C) Never let slide dry out during processing! Use humid chamber for all incubation steps longer than just a few minutes, Work as quick as possible when changing solutions, use multichannel pipette Reduce speed of shaker to 40 rpm Use humid chamber for long incubations Cover ProPlate® with lid; if condensation of water is observed under cover: place piece of polystyrene foam under frame for insulation from heat generated by shaking instrument In many cases, this is a normal effect Change buffer for the proteins arrayed (i.e. remove additives that lead to “blocking effects”) Always take care not to touch the surface of ONCYTE® Slides; always remove/aspirate liquid from corners of pads Check integrity of pins (under microscope), adjust position, replace bent/broken pin(s) Clean pins thoroughly after each printing run, optimize washing protocol (see manual of printing instrument) Check source plate Do not use cold (out of the fridge) slides (risk of condensation water on surface) Grace Bio-Labs 022012 ©2011 Grace Bio-Labs, Inc. All rights reserved. All the trademarks or brands in this document are registered by their respective owner. 21 10. Misaligned spots 11. Donut-shaped spots If contact printing: bent or broken pin(s) If non-contact arraying: arrayer tip is misfiring Strike-force of pin on surface too high Viscosity of sample very high Humidity too low during spotting 12. Comets and Tadpoles 13. Speckled background Loosely bound capture protein moves during sample incubationhybridization Wet slide surface during printing (see above) Protein arrayed using too high concentration Particles in solution Contact printer: check integrity of pins (under microscope), adjust position, replace bent/broken pin(s) Non-contact printer: check tip status/settings Reduce strike-force Add glycerol to source solution (5 to 10%) Increase humidity of printing chamber Donut effect cannot be completely avoided; if spot finding in the data reduction software is performed properly it has little effect on the results Prolong drying time after printing (-> overnight) Do not use cold (out of the fridge) slides (risk of condensation water on surface) Reduce concentration of capture protein Replace with fresh, particlefree solvents Make sure that no precipitate is in sample Centrifuge sample before incubation Filter sample/solvents through 0.45 μm syringe filter 8. Further Information The references below include several articles that give a review of specific fields of application of protein microarrays, Espina et al. (2003) review the use of reverse-phase arrays in cancer research. Array platforms for analysis of autoimmune diseases are reviewed by Balboni et al. (2006). A review of microarrays for glycosylation research was written by Feizi and Chai (2004). Sakanyan (2005) and Schweitzer et al. (2003) review the use of protein arrays to study protein-protein interaction. A general review on proteomic studies using microarrays was written by Feilner et al. (2004). Additional information can be found on the Grace Bio-Labs web pages www.gracebio.com Grace Bio-Labs 022012 ©2011 Grace Bio-Labs, Inc. All rights reserved. All the trademarks or brands in this document are registered by their respective owner. 22 9. References 1. Balboni, I. et al. (2006). Multiplexed protein array platforms for analysis of autoimmune diseases. Annu Rev Immunol 24: 391-418 2. Calvert, V. S. et al. (2004). Development of multiplexed protein profiling and detection using near infrared detection of reverse-phase protein microarrays. Clin Proteomics 1: 81-89 3. Ekins, R. and Chu, F. (2003). Ultrasensitive microarray-based ligand assay technology. In: Protein Arrays, Biochips, and Proteomics. The next Phase of Genomic Discovery. Albala, J.S. and Humphrey-Smith, I. (Eds.), Marcel Drecker Inc. New York, Basel. PP 81-125 4. Espejo, A. et al. (2002). A protein-domain microarray identifies novel protein-protein interactions. Biochem J 367: 697-702 5. Espejo, A., Bedford, M.T. (2004). Protein-domain microarrays. Methods Mol Biol 264: 173-184 6. Feilner, T. et al. (2004). Proteomic studies using microarrays. Current Proteomics 1(4): 293-295 7. Feizi, T. and Chai, W. (2004). Oligosaccharide microarrays to decipher the glyco-code. Nature Reviews/Mol Cell Biol 5: 582-588 8. Gutjahr, C. et al. (2005). Mouse protein arrays from a Th1 cell cDNA library for antibody screening and serum profiling. Genomics 85: 285-296 9. Kim, T.-E. et al. (2002). Quantitative measurement of serum allergen-specific IgE on protein chip. Exp Mol Med 34(2): 152-158 10. Kersten, B. et al. (2003). Generation of Arabidopsis protein chips for antibody serum screening. Plant Mol Biol 52: 999-1010 11. Kukar, T. et al. (2002). Protein microarrays to detect protein-protein interactions using Red and Green Fluorescent Proteins. Anal Biochem 306: 50-54 12. Lueking, A. et al. (2005). Profiling of Alopecia areata autoantigens based on protein microarray technology. Mol Cell Proteomics 4(9): 1382-1390 13. Madoz-Gúrpide, J. et al. (2001). Protein based microarrays: a tool for probing the proteome of cancer cells and tissues. Proteomics 1: 1279-1287 14. Nishizuka, S. et al. (2003). Proteomic profiling of the NCI-60 cancer cell lines using new highdensity reverse-phase lysate microarrays. PNAS 100(24): 14229-14234 15. Paweletz, C.P. et al. (2001). Reverse phase protein microarrays which capture disease progression show activation of pro-survival pathways at the cancer invasion front. Oncogene 20: 1981-1989 16. Sakanyan, V. (2005). High-throughput and multiplexed protein array technology: protein-DNA and protein-protein interactions. J Chromatography B 815: 77-95 17. Schweitzer, B. et al. (2003). Microarrays to characterize protein interactions on a wholeproteome scale. Proteomics 3: 2190-2199 18. Spector, N. L. et al. (1994). Regulation of the 28 kDa heat shock protein by retinoic acid during differentiation of human leukemic HL-60 cells. FEBS Lett 337: 184-188 19. Yeretssian, G. et al. (2005). Competition on nitrocellulose-immobilized antibody arrays. From bacterial protein binding assay to protein profiling in breast cancer cells. Mol Cell Proteomics 4: 605-617 20. Zhou, H. et al. (2004). Two-color, rolling-circle amplification on antibody microarrays for sensitive, multiplexed serum-profile measurements. Genome Biology 5(4): R28 21. McGrath, C. et al (1991). Coherent Transfer of Receptor Proteins on Microporous Membranes. BioTechniques 11:352-361 22. Kingsmore SF. 2006. Multiplexed protein measurement: technologies and applications of protein and antibody arrays. Nat. Rev. Drug Discov. 5(4): 310-20. Grace Bio-Labs 022012 ©2011 Grace Bio-Labs, Inc. All rights reserved. All the trademarks or brands in this document are registered by their respective owner. 23 23. Van Oss, CJ et al. (1987). Mechanism of DNA (Southern) and protein (Western) blotting on cellulose nitrate and other membranes. J. Chromatography 391(1):53-65. 24. Tang Y, et al. (2003). Blood genomic expression profile for neuronal injury. J Cereb Blood Flow Metab.: 23(3):310-9. 25. Stillman BA and Tonkinson JL. (2000). FAST slides: a novel surface for microarrays. Biotechniques. 2000 Sep;29(3):630-5. 26. Oh SJ et al. (2000). Surface modification for DNA and protein microarrays. OMICS. 2006 Fall;10(3):327-43 27. Espina V, et al. (2003) Protein microarrays: molecular profiling technologies for clinical specimens. Proteomics.;3(11):2091-100. Grace Bio-Labs 022012 ©2011 Grace Bio-Labs, Inc. All rights reserved. All the trademarks or brands in this document are registered by their respective owner. 24