1
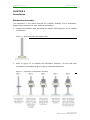
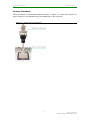
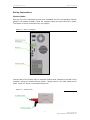
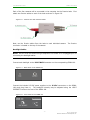
GASTROINTESTINAL MOTILITY MONITOR (GIMM) SYSTEM USER’S MANUAL SOF-570 GIMM User’s Manual DOC-103 Rev. 1.5 Copyright © 2012 All Rights Reserved Catamount Research and Development, Inc. 650 Industrial Park Road St. Albans, Vermont 05478 www.catamountresearch.com CATAMOUNT R&D GIMM SYSTEM - ii Rev 1.5 Copyright 2012 Catamount Research and Development, Inc. CATAMOUNT R&D GIMM SYSTEM TABLE OF CONTENTS Chapter 1 ............................................................................................... 1 Introduction .......................................................................................................... 1 Computer Requirements ..................................................................................... 1 System Components .......................................................................................... 1 Chapter 2 ............................................................................................... 2 Installation ........................................................................................................... 2 Workstation Assembly ........................................................................................ 2 Camera Placement ............................................................................................ 3 Wiring Instructions ............................................................................................. 4 Plumbing Instructions ......................................................................................... 6 Peristaltic Pump Calibration ................................................................................ 8 Chapter 3 ............................................................................................... 9 GIMM Software Description ................................................................................... 9 Naming Cameras ............................................................................................... 9 Setting Up Workstations ................................................................................... 10 GIMM Organizational Principles ........................................................................ 14 Getting Started with GIMM: A Simple Tutorial ..................................................... 15 Starting the Sample Project .............................................................................. 19 Data Collection ................................................................................................ 28 Data Analysis .................................................................................................. 31 Reporting/Printing ............................................................................................ 39 Appendix A .......................................................................................... 41 Citations ............................................................................................................ 41 Appendix B .......................................................................................... 42 Driver and Software Installation ............................................................................ 42 Appendix C .......................................................................................... 46 Plumbing Diagram for Single Station/Single Pump System ...................................... 46 Appendix D .......................................................................................... 47 Plumbing Diagram for Single or Multiple Station System ......................................... 47 Appendix E .......................................................................................... 48 Heating System Diagram ..................................................................................... 48 - iii Rev 1.5 Copyright 2012 Catamount Research and Development, Inc. CATAMOUNT R&D GIMM SYSTEM CHAPTER 1 Introduction Thank you for purchasing the Gastrointestinal Motility Monitor (GIMM) package from Catamount Research and Development, Inc. We are pleased to present this package, which is intended for use in gastrointestinal physiology/pharmacol ogy experimentation. GIMM is a software/hardware package that is the result of basic research and development efforts aimed at bringing scientists a powerful and easy -to-use application that allows in vitro measurements of the peristaltic reflex in isolate d segments of the gastrointestinal tract from laboratory animals. GIMM allows the researcher to accurately quantify GI motility rates in an experimental setting. GI motility rates can be determined under resting conditions, as well as in the presence of pharmacological test compounds. Computer Requirements 3.4 GHz Hyperthreaded or 2.33 Dual Core Processor Computer 1 GB RAM Windows XP SP2 or Vista Firewire Card (requires one card for every two cameras) Monitor, keyboard, and mouse System Components The GIMM system includes all of the hardware and software necessary for functioning as a stand-alone laboratory station. GIMM also offers full flexibility for incorporating into existing lab stations. Each GIMM system includes: Heating water pump set to maximum flow rate Up to two peristaltic pumps One heat exchanger per station One tissue bath per station One backlight with GIMM-100 power supply per station One camera with mount per station Up to two Firewire hubs Tubing Tubing accessories/connectors Computer package Gastrointestinal Motility Monitor (GIMM) Software -1Rev 1.5 Copyright 2012 Catamount Research and Development, Inc. CATAMOUNT R&D GIMM SYSTEM CHAPTER 2 Installation Workstation Asse mbly The instructions in this section describe the complete assembly of one workstation. Repeat these instructions for each additional workstation. 1. Locate the workstation base and attach the support shaft using four of the included thumbscrews. Figure 2.1 - Workstation Base and Support Shaft 2. Refer to Figure 2.2 to complete the workstation assembly. Be sure that each workstation is assembled using the properly numbered components. Figure 2.2 - Completion of Workstation Assembly -2Rev 1.5 Copyright 2012 Catamount Research and Development, Inc. CATAMOUNT R&D GIMM SYSTEM Camera Placement Place the camera in the camera bracket as shown in Figure 2.3. Once the camera is in place, secure it in the bracket using the thumbscrew on the right side. Figure 2.3 - Proper Camera Orientation -3Rev 1.5 Copyright 2012 Catamount Research and Development, Inc. CATAMOUNT R&D GIMM SYSTEM Wiring Instructions Firewire Cables Once all four of the workstations have been assembled and the corresponding cameras placed in the camera brackets, setup the computer using the figure below as a guide. The location of these connections may vary slightly. Figure 2.4 - Rear of Computer Connect each of the firewire hubs to separate firewire cards (located on the back of the computer) using the included firewire cables. Supply power to the hubs using the DC cable. Figure 2.5 shows a connected firewire hub. Figure 2.5 - Firewire Hub -4Rev 1.5 Copyright 2012 Catamount Research and Development, Inc. CATAMOUNT R&D GIMM SYSTEM Each of the four cameras will be connected to the computer via the firewire hubs. First attach two firewire cables to each of the hubs as shown in Figure 2.6. Figure 2.6 - Firewire Hub with Camera Cables Next, run the firewire cables from the hubs to each individual camera. connector is located on the top of the camera. The firewire Backlight Cables NOTE: Be sure that the GIMM-100 light amplifiers are turned off or unplugged prior to connecting the backlight cables. Connect each backlight to the LIGHT BATH connector on the corresponding GIMM-100. Figure 2.7 - Back Panel of the GIMM-100 Connect the included 15 VDC power supplies to the 15 VDC connectors on the GIMM100s and plug them in. The backlight intensity may be adjusted using the LIGH T INTENSITY knob on the front of the GIMM-100. Figure 2.8 - Front Panel of the GIMM-100 -5Rev 1.5 Copyright 2012 Catamount Research and Development, Inc. CATAMOUNT R&D GIMM SYSTEM Plumbing Instructions Perfusate System for Single Station GIMM System Using One Pump A single-station GIMM system includes one peristaltic pump that is used to circulate the perfusate through the system (pump models may vary). To install the tubing, refer to the instructions in the Instruction Manual provided with the pump. The instructions in this section describe the complete plumbing of one workstation using two pumps. Table 2.1 - Single Station Tubing Guide Section Name Connector 1 Tubing Length Connector 2 Qty. Used A None 36” Female Luer 3 B Male Luer 16” Male Luer 3 C Female Luer 60” Male Slip 1 D Male Luer 6”’ Female Luer Tee 1 E Male Luer 60” Female Luer 2 Cꞌ Female Luer 18” Male Slip 1 Figure 2.9 - Plumbing Diagram for Single Station System with Single Pump ꞌ (Shown Larger in Appendix C) 1. 2. 3. 4. 5. 6. 7. 8. 9. 10. 11. Place Section A in the perfusate bottle. Connect Segment A to Segment B. Install Segment B into the pump. Connect the other end of Segment B to Segment C. Connect Segment C to one end of the Heat Exchanger. Connect the other end of the Heat Exchanger to Segment Cꞌ. Connect Segment Cꞌ to the male luer connector on the Tissue Bath. Connect the female luer connector on the Tissue Bath to Segment D. Connect segment D to two Segment Es. Connect each of the segment Es to a Segment B. Install the segment Bs into two separate pump brackets, being sure that the flow will be going in the same direction as the segment installed in Step 3. 12. Connect each of the Segment Bs to a Segment A. 13. Place the ends of the Segment As in the perfusate bottle. -6Rev 1.5 Copyright 2012 Catamount Research and Development, Inc. CATAMOUNT R&D GIMM SYSTEM Perfusate System for Single Station GIMM System Using Two Pumps GIMM systems with two or more stations include two peristaltic pumps. One is labeled IN and the other is labeled OUT (pump models may vary). To install the tubing, refer to the instructions in the Instruction Manual provided with the pump. Plumbing of multiple workstations require using two pumps per station. Table 2.2 – Single or Multiple Station with Two Pumps Tubing Guide Section Name Connector 1 Tubing Length Connector 2 Qty. Used A None 36” Female Luer 2 B Male Luer 16” Male Luer 2 C Female Luer 60” Male Slip 1 E Male Luer 60” Female Luer 1 Cꞌ Female Luer 18” Male Slip 1 Figure 2.10 - Plumbing Diagram for Two Pump Single or Multiple Station System ꞌ (shown larger in Appendix D) 1. 2. 3. 4. 5. 6. 7. 8. 9. 10. Place Section A in the perfusate bottle. Connect Segment A to Segment B. Install Segment B into the pump marked “IN”. Connect the other end of Segment B to Segment C. Connect Segment C to one end of the Heat Exchanger. Connect the other end of the Heat Exchanger to Segment Cꞌ. Connect Segment Cꞌ to the male luer connector on the Tissue Bath. Connect the female luer connector on the Tissue Bath to Segment E. Connect the segment E to the second Segment B. Install segment B into the pump marked “OUT”, making sure that the flow will be going in the same direction as the segment installed in the pump marked “IN”. 11. Connect Segment B to a second Segment A. 12. Place the end of the second Segment A in the perfusate bottle. 13. Repeat these steps for each additional station, each time installing the tubing in a higher bracket on the pumps. -7Rev 1.5 Copyright 2012 Catamount Research and Development, Inc. CATAMOUNT R&D GIMM SYSTEM Heating System The heating system consists of the up to four heat exchangers, the heat pump and the included 1/4” ID tubing. Connect the heating system as shown in Figure 2.11, with the heat exchangers daisy chained together. Figure 2.11 - Heating System Diagram (Shown Larger in Appendix E) Peristaltic Pump Calibration Now that the GIMM system is set up, the peristaltic pumps can be calibrated. To do this fill the perfusate bottle (Figure 2.9 and Figure 2.10) with deionized water and turn the pumps on. On the back of the pumps there are silver thumbscrews that are used to increase or decrease the flow rate of each workstation. Starti ng at the bottom and working up, set the workstations one at a time. Repeat the process for the outgoing pump but be sure to set the return flows a bit higher than the incoming flow rates to prevent the baths from overflowing. Once the flow rates for the peristaltic pumps are set, turn the heat pump on. Now the saline will be heated while flowing through the heat exchangers. The temperature in the tissue baths should be constant. In order to assure that the temperature is consistent from bath to bath, be sure that the tubing between the heat exchanger and the tissue bath is the same length for each workstation. The heating system can be calibrated for most mammalian work. -8Rev 1.5 Copyright 2012 Catamount Research and Development, Inc. CATAMOUNT R&D GIMM SYSTEM CHAPTER 3 GIMM Software Description Naming Cameras The GIMM system comes standard with four video cameras and four completely independent experimental stations, or “workstations.” It is important to define which camera is associated with each workstation in the GIMM Software. The instructions for naming cameras and workstations are as follows: 1. Open the GIMM software. 2. In the File menu, click Camera Names as shown in Figure 3.1: Figure 3.1 - File | Camera Names Menu Selection 3. This will load the Camera Setup screen seen below: Figure 3.2 - Camera Setup Screen 4. Click on a camera name to rename that camera. By default, cameras are numbered 1-4. 5. When all cameras have the desired name, click the Exit button to return to the GIMM home screen. -9Rev 1.5 Copyright 2012 Catamount Research and Development, Inc. CATAMOUNT R&D GIMM SYSTEM Setting Up Workstations 1. Open the GIMM software 2. In the File menu, click Workstation Setup as seen below in Figure 3.3: Figure 3.3 - File | Workstation Setup Menu Selection 3. This loads the Workstation Setup screen seen below: Figure 3.4 - Workstation Setup Screen 4. By default, these instructions assume Workstations are named 1 -4 (from left to right) and that the Cameras are named 1-4 (from left to right). If the camera names have been altered, substitute the changed camera name when setting up each workstation. 5. Before setting up workstations, verify that all cameras and light sources are connected properly. 6. Turn On all light sources and turn the Light Intensity dial all the way to the right. 7. Begin by clicking on the desired Workstation, which will be highlighted in blue. 8. Then click the Edit button, to open the Workstation screen seen below: - 10 Rev 1.5 Copyright 2012 Catamount Research and Development, Inc. CATAMOUNT R&D GIMM SYSTEM Figure 3.5 - Workstation Screen 9. The Workstation name can be changed by entering desired name in the Workstation field. 10. Match the Workstation to the Camera by selecting the appropriate Camera from the Camera Id pulldown menu, which will highlight the camera name in blue. 11. Now click the Calibrate Camera button. 12. This will load the Calibrate Workstation screen seen below: Figure 3.6 - Calibrate Workstation Screen 13. The video window on this screen is a live feed, so running your fingers under the camera will verify that the correct one has been selected . 14. Now calibrate the scale of the Camera by clicking and dragging one of the red cursors in the live video feed moving it to the 4 cm mark on the ruler. Next click and drag the other red cursor to the 3 cm mark on the ruler, thus making the two red lines 10 mm (1 cm) apart, as shown in Figure 3.7. 15. In the Distance Cursors field, enter “10” and then click the Cal button, this will calibrate the scale for the Camera and display the screen below: - 11 Rev 1.5 Copyright 2012 Catamount Research and Development, Inc. CATAMOUNT R&D GIMM SYSTEM Figure 3.7 - Scale Calibration 16. The green sliders to the right of the video window ( Figure 3.7) are used to adjust the following camera properties: Brightness, Gain, and Shutter. These settings should be adjusted so that the colon segment appears overexposed, as shown in Figure 3.8. This will provide adequate contrast between the colon segment and the fecal pellet, allowing for accurate tracking. Notice the histogram in Figure 3.8. The first peak from the left represents the colon segment and the second peak is the white background. Figure 3.9 illustrates the desired contrast between the colon segment and the fecal pellet. Again, notice the histogram. This time the leftmost peak represents the fecal pellet. Figure 3.8 - Overexposed Colon Segment - 12 Rev 1.5 Copyright 2012 Catamount Research and Development, Inc. CATAMOUNT R&D GIMM SYSTEM Figure 3.9 - Colon Segment and Fecal Pellet 17. When calibration and adjustments are complete, click the Save button at the bottom right. The following prompt will appear: Figure 3.10 - Save Calibration Parameters 18. Click the Yes button. The live video screen will be displayed. 19. Now click the Exit button at the bottom of the screen. 20. This causes the return to the Workstation Setup screen (Figure 3.4). steps 7-20 for each remaining Workstation. 21. When all Workstations have been setup, click Exit on the Workstation Setup screen to return to the GIMM main screen ( Figure 3.16). Repeat - 13 Rev 1.5 Copyright 2012 Catamount Research and Development, Inc. CATAMOUNT R&D GIMM SYSTEM GIMM Organizational Principles The GIMM software is designed with two objectives. The first is to acquire and analyze segments of video images of gastrointestinal specimens showing in vitro motile activity. The second is to serve as a user interface that organizes experimental data and observations; much like a lab notebook is used to record daily laboratory activity. In this way, GIMM software allows users to define experimental protocols that are used in a given set of experiments. Experiments can be performed using pre-defined conditions established in a protocol. This feature greatly simplifies and facilitates the task of experimental design and data collection. The following section will outline the organizational features and conventions used in GIMM. GIMM defines experimental conditions using conventions that are very familiar to pharmacologists and physiologists. A flow chart illustrating the hierarchical structure of data organization used in GIMM is shown in Figure 3.11. Figure 3.11 - Experimental Design Flow Chart A Project is a grouping of experiments that are all related in some way. For example, a project may be called “Joe’s Thesis” or “Histamine Grant.” GIMM stores all the data relating to a given project in a single database file with a *.gmm extension. This database file includes all information about experimental protocols, trial definitions, experimental sessions, video clips, raw da ta, and analyzed data. A Protocol is used to define a sequence of trials that will be used to conduct a given type of experiment. For example, you may have a protocol called “Time Control” that contains the parameters for measuring the reproducibility of motility rates over a sequence of trials. You could also have a protocol titled “Dose Response Curve” that contains the settings for measuring motility rates during successive applications of increasing concentrations of a test compound. Protocols are us ually created during the initial stages of a project, but protocols may be added to existing projects at any time. - 14 Rev 1.5 Copyright 2012 Catamount Research and Development, Inc. CATAMOUNT R&D GIMM SYSTEM A Trial is an individual measurement of motility. A trial consists of the placement of a fecal pellet at the oral end of the colonic segment, then the peristaltic movement of the pellet along the length of the colon towards the anal end. GIMM software documents the trial by recording a video clip. The video is then analyzed off -line to determine the fecal pellet velocity. Experiments usually consist of a sequence of trials performed over time. During the experimental design phase of a project, the sequence of trials to be performed in a given protocol is defined. An Experiment is a set of motility measurements that is obtained from a sin gle gastrointestinal specimen. Experiments may be named according to the date the experiment was performed (e.g. 2002-01-15), or any other convention used in your laboratory for naming experiments in general. The sequence of trials performed during an experiment is defined by the protocol associated with an experiment. Getting Started with GIMM: A Simple Tutorial A new project will need to be created the first time that GIMM is run. When setting out to establish a study design in GIMM, consider creatin g a flowchart that follows along the organization of the chart shown in Figure 3.12. Figure 3.12 - Generic Organization Chart - 15 Rev 1.5 Copyright 2012 Catamount Research and Development, Inc. CATAMOUNT R&D GIMM SYSTEM The organization outlined in Figure 3.12 depicts a protocol with four distinct conditions (trial groups). This format will be used in the following tutorial. The following tutorial will describe the steps for setting up a project called “Sample Project.” For this project, the study design will include two basic types of protocols. The first type will be a cumulative dose-response study of three concentrations (1 M, 5 M, and 10 M) of the hypothetical drug “Pentamil.” The second type of protocol will be a vehicle control experiment with Pentamil replaced by the vehicle (saline, e.g.). Each protocol will consist of three motility measurements (trials). The experimental design for the dose-response protocol is outlined in Figure 3.13. Figure 3.13 - Pentamil Dose Response Chart Here, the protocol name is “Pentamil Dose Response.” Recal l that we will be conducting motility measurements in triplicates for each condition. Each separate experimental condition corresponds to the “Trial Group” in Figure 3.12. The first set of motility measurements (trials) will be done to determine the baseline rate of motility for an individual colon segment. This set of trials will be called “Baseline” ( Figure 3.13). The replicate number will be used to define the “Trial Description” for each trial ( Figure 3.12 and Figure 3.13). - 16 Rev 1.5 Copyright 2012 Catamount Research and Development, Inc. CATAMOUNT R&D GIMM SYSTEM After the Baseline trials are performed, the first concentration of Pentamil, 1 M, will be applied. After the three trials under this condition are conducted, the second concentration of Pentamil, 5 M, will be applied. After the three trials under this condition are performed, the final concentration of Pentamil, 10 M, will be applied. Finally, the three trials under this condition will be performed and the experiment is complete. The organizational details for the vehicle control experiment are shown in Figure 3.14. Figure 3.14 - Vehicle Organization Chart This protocol will be called “Vehicle Control.” Again, the first set of trials is done to determine the baseline motility rate for a given segment of colon and will be called “Baseline.” After the three baseline trials are performed, the vehicle for 1 M Pentamil (e.g. saline or ethanol) will be applied. This set of trials will be called “Pentamil Vehicle Point 1.” After these trials are performed, the vehicle for 5 M Pentamil will be added. These trials will be called “Pentamil Vehicle Point 2.” After these trials are performed, the vehicle for 10 M Pentamil will be applied. These trials will be called “Pentamil Vehicle Point 3.” This is the outline of the organization of the two protocols t hat will be employed in this project. In addition to planning the organization of the project, it is useful to plan the timing of the experiments as a timeline. A common approach used in the field is to allow - 17 Rev 1.5 Copyright 2012 Catamount Research and Development, Inc. CATAMOUNT R&D GIMM SYSTEM a stabilization period after setting up the t issue, such as 30 minutes, followed by motility measurements made every 3 minutes. When drugs are applied, a suitable time period should be allowed for the drug to exert its actions, for example 10 min. This is the approach taken for the sample project. The timeline is shown in Figure 3.15. Figure 3.15 – Timeline - 18 Rev 1.5 Copyright 2012 Catamount Research and Development, Inc. CATAMOUNT R&D GIMM SYSTEM Starting the Sample Project The basic steps for setting up the project “Sample Project” in GIMM are as follows: Open GIMM Software by double clicking on the GIMM icon located on the desktop. The main GIMM screen will open (Figure 3.16). Figure 3.16 - GIMM Main Menu Screen Depending on what is taking place in the program, the content of the menu bar changes, as well as the menus themselves. Initially there are two menus on the menu bar, the File menu and the Help menu. The Help menu contains program information such as the version number and copyright. The initial File menu contains five items ( Figure 3.17). Figure 3.17 - File Menu - 19 Rev 1.5 Copyright 2012 Catamount Research and Development, Inc. CATAMOUNT R&D GIMM SYSTEM File Menu Options: New Project defines a new project database file. Open Project to open an existing project database file. Camera Names to define the naming of the cameras (Cameras 1-4 is default). See Naming Cameras. Workstation Setup to name and calibrate the workstations. See Setting Up a Workstation. Exit to quit GIMM. For this example, select New Project from the File menu. This opens the Create New Project dialog box (Figure 3.18). Enter the name “Sample Project” in the File name field and click on the Create button. Figure 3.18 – Create New Project Screen A dialog box will ask if protocols should be added to this new project ( Figure 3.19). Click Yes to begin defining protocols. Figure 3.19 - Adding Protocols - 20 Rev 1.5 Copyright 2012 Catamount Research and Development, Inc. CATAMOUNT R&D GIMM SYSTEM The Protocol Definition dialog box should now be displayed (Figure 3.20). Figure 3.20 - Protocol Definition Select Create New and enter “Pentamil Dose Response” as the Protocol Name. OK. Click The Trial Editor window will be displayed (Figure 3.21). Protocols are created by defining the sequence of trials to be performed in a given type of experiment. The various components of a trial are the Group, Description, Details, and Max Duration. Figure 3.21 - Trial Editor Group refers to the descriptor that identifies a particular group of trials (refer bac k to Figure 3.12). Description is used to identify a specific trial within a group. Max Duration refers to the maximum length of time that a video clip will be recorded. Leaving Max Duration at 0 seconds results in video clips that need to be started and stopped manually. If any duration other than 0 is entered for the Max Duration, a video clip will be recorded for up to that amount of time, but recording can be stopped manually before the Max Duration has elapsed. Details can be used to enter any other comments or information that will be useful for identifying a specific trial, such as instructions for carrying out the trial. - 21 Rev 1.5 Copyright 2012 Catamount Research and Development, Inc. CATAMOUNT R&D GIMM SYSTEM For this example, type “Baseline” in the Group field, “Replicate 1 of 3” in the D escription field, and “120” in the Max Duration field. Use the Details field to indicate the instructions used by the technician running an experiment. For the first baseline trial Details, enter “Conduct the first baseline motility measurement after a 3 0 minutes stabilization period. After completing a trial, wait 3 min utes, and then start second baseline motility measurement.” See Figure 3.22. Figure 3.22 - Entering Data in Trial Editor Click on the Add New button to add this trial to the protocol. Notice that this trial will be added to the trial list in the Protocols window and the Trial Editor window remains active with the information entered unchanged. This allows the user to add a new trial to the protocol. In this case, simply change the Description to “Replicate 2 of 3” and change the Details to “Conduct second baseline motility measurement. Wait 3 min utes, and then start third baseline motility measurement.” Click on the Add New button to add this trial to the protocol. Change the Description to “Replicate 3 of 3” and change the Details to “Conduct third baseline motility measurement. Apply 1 uM Pentamil. Wait 10 min utes before starting Pentamil 1 uM motility measurements.” Click on the Add New button to add this trial to the protocol. Now, change the Group to “Pentamil 1 uM.” Change the Description to “Replicate 1 of 3,” and change the Details to “Conduct first Pentamil 1 uM motility measuremen t. Wait 3 minutes, and then start second Pentamil 1 uM motility measurement.” Click Add New to add this trial to the protocol. Change the Description to “Replicate 2 of 3,” and change the Details to “Conduct second Pentamil 1 uM motility measurement. Wait 3 minutes, and then start third Pentamil 1 uM motility measurement.” Click Add New to add this trial to the protocol. Change the Description to “Replicate 3 of 3,” and change the Details to “Conduct third Pentamil 1 uM motility measurement. Apply 5 uM Pentamil. Wait 10 minutes before - 22 Rev 1.5 Copyright 2012 Catamount Research and Development, Inc. CATAMOUNT R&D GIMM SYSTEM starting Pentamil 5 uM motility measurements.” Click Add New to add this trial to the protocol. Now, change the Group to “Pentamil 5 uM.” Change the Description to “Replicate 1 of 3,” and change the Details to “Conduct first Pentamil 5 uM motility measurement. Wait 3 minutes, and then start second Pentamil 5 uM motility measurement.” Click Add New to add this trial to the protocol. Change the Description to “Replicate 2 of 3,” and change the Details to “Conduct second Pentamil 5 uM motility measurement. Wait 3 min utes, and then start third Pentamil 5 uM motility measurement.” Click Add New to add this trial to the protocol. Change the Description to “Replicate 3 of 3,” and change the Details to “Conduct third Pentamil 5 uM motility measurement. Apply 10 uM Pentamil. Wait 10 min utes before starting Pentamil 10 uM motility measurements.” Click Add New to add this trial to the protocol. Now, change the Group to “Pentamil 10 uM.” Change the Description to “R eplicate 1 of 3,” and change the Details to “Conduct first Pentamil 10 uM motility measurement. Wait 3 minutes, and then start second Pentamil 10 uM motility measurement.” Click Add New to add this trial to the protocol. Change the Description to “Replicate 2 of 3,” and change the Details to “Conduct second Pentamil 10 uM motility measurement. Wait 3 minutes, and then start third Pentamil 10 uM motility measurement.” Click Add New to add this trial to the protocol. Change the Description to “Replicate 3 of 3,” and change the Details to “Conduct third Pentamil 10 uM motility measurement. After this trial, experiment is complete.” Click Add New to add this trial to the protocol. The protocol “Pentamil Dose Response” is now defined. Click Exit from the Trial Editor window. A Protocols window that looks similar to Figure 3.23 should appear. Figure 3.23 - Pentamil Dose Response Protocol - 23 Rev 1.5 Copyright 2012 Catamount Research and Development, Inc. CATAMOUNT R&D GIMM SYSTEM The next step is to define a protocol for the “Vehicle Control” protocol (refer to Figure 3.14). While the Protocols window is displayed, notice that there are five menu items on the GIMM menu bar: File, Edit, Protocols, View and Help. From the Pro tocols menu, select Add Protocol (Figure 3.24). Figure 3.24 - Protocols Menu Select Create New and type “Vehicle Control” for the Protocol Name. Click OK to bring up the Trial Editor window. This protocol will closely parallel the trials in the Pentamil Dose Response protocol because the experiments that use this protocol should match the Pentamil Dose Response experiments in every way except that the Pentamil vehicle is applied instead of Pentamil. In the Group field type in “Baseline.” Type “Replicate 1 of 3” for the Description. Enter “120” for the Max Duration. In the Details section, enter “Conduct first baseline motility measurement after a 30 min utes stabilization period. After completing trial, wait 3 minutes, and then start second baseline motility measurement.” Click on the Add New button to add this trial to the protocol. Change the Description to “Replicate 2 of 3” and change the Details to “Conduct second baseline motility measurement. Wait 3 minutes, and then start third baseline motility measurement. Click on the Add New button to add this trial to the protocol. Change the Description to “Replicate 3 of 3” and change the Details to “Conduct third baseline motility measurement. Apply Pentamil vehicle. Wait 10 min utes before starting Pentamil vehicle motility measurements.” Click on the Add New button to add this trial to the protocol. Now, change the Group to “Pentamil Vehicle Point 1.” Change the Descrip tion to “Replicate 1 of 3,” and change the Details to “Conduct first Pentamil Vehicle Point 1 motility measurement. Wait 3 minutes, and then start second Pentamil Vehicle Point 1 motility measurement.” Click Add New to add this trial to the protocol. Change the Description to “Replicate 2 of 3,” and change the Details to “Conduct second Pentamil Vehicle Point 1 motility measurement. Wait 3 min utes, and then start third - 24 Rev 1.5 Copyright 2012 Catamount Research and Development, Inc. CATAMOUNT R&D GIMM SYSTEM Pentamil Vehicle Point 1 motility measurement.” Click Add New to add this trial to the protocol. Change the Description to “Replicate 3 of 3,” and change the Details to “Conduct third Pentamil Vehicle Point 1 motility measurement. Wait 10 min utes before starting Pentamil Vehicle Point 2 motility measurements.” Click Add New to add this trial to the protocol. Now, change the Group to “Pentamil Vehicle Point 2.” Change the Description to “Replicate 1 of 3,” and change the Details to “Conduct first Pentamil Vehicle Point 2 motility measurement. Wait 3 minutes, and then start second Pentamil Vehicle Point 2 motility measurement.” Click Add New to add this trial to the protocol. Change the Description to “Replicate 2 of 3,” and change the Details to “Conduct second Pentamil Vehicle Point 2 motility measurement. Wait 3 min utes, and then start third Pentamil Vehicle Point 2 motility measurement.” Click Add New to add this trial to the protocol. Change the Description to “Replicate 3 of 3,” and change the Details to “Conduct third Pentamil Vehicle Point 2 motility measurement. Wait 10 minutes before starting Pentamil Vehicle Point 3 motility measurements.” Click Add New to add this trial to the protocol. Now, change the Group to “Pentamil Vehicle Point 3.” Change the Description to “Replicate 1 of 3,” and change the Details to “Conduct first Pentamil Vehicle Point 3 motility measurement. Wait 3 minutes, and then start second Pentamil Vehicle Point 3 motility measurement.” Click Add New to add this trial to the protocol. Change the Description to “Replicate 2 of 3,” and change the Details to “Conduct second Pentamil Vehicle Point 3 motility measurement. Wait 3 min utes, and then start third Pentamil Vehicle Point 3 motility measurement.” Click Add New to add this trial to the protocol. Change the Description to “Replicate 3 of 3,” and change the Details to “Conduct third Pentamil Vehicle Point 3 motility measurement. After this trial, experiment is complete.” Click Add New to add this trial to the protocol. The protocol “Vehicle Control” is now defined. Click Exit from the Trial Editor window. The Protocols window should look similar to Figure 3.25. Figure 3.25 - Vehicle Control Protocols - 25 Rev 1.5 Copyright 2012 Catamount Research and Development, Inc. CATAMOUNT R&D GIMM SYSTEM The protocols that make up this Sample Project are now fu lly defined. To close the Protocols window, simply click the X in the upper right corner of the Protocols window. The Experiment Notebook view in GIMM should now be on the screen ( Figure 3.26). The next part of the tutorial will describe how to setup an experiment using one of these protocols. Figure 3.26 - Blank Sample Project Experiment Notebook An experiment may now be set up using the protocols defined for the Sample Projec t. Notice that on the Experiment Notebook screen the menu bar has the following menus: File, Edit, Experiment, View, Window, Help. From the Experiment menu, select Add Experiment. The Experiment Setup window will be displayed ( Figure 3.27). Figure 3.27 - Experiment Setup Window - 26 Rev 1.5 Copyright 2012 Catamount Research and Development, Inc. CATAMOUNT R&D GIMM SYSTEM The Project ID shows the name of the project currently open. The Experiment ID is the number corresponding to the experiment being configured. The fi rst experiment added to a project is assigned an ID of 1, and the ID’s are incremented sequentially as experiments are added. The Experiment Name is where a name for the experiment is entered. Protocol is where the protocol that corresponds to the experi ment being set up is chosen from a drop down list of all available protocols associated with the current project. Camera is where the camera that will monitor the experiment being configured is chosen from a drop down list of all available cameras configu red for the system. An experiment named “First Experiment” will be set up to work on Camera 1, using the “Pentamil Dose Response” protocol. In the Experiment Name field, type “Experiment 1”, making sure that Camera 1 is selected. Choose “Pentamil Dose Re sponse” from the drop down Protocol list. Click OK. Notice that a new experiment tab is created in the Experiment Notebook (Figure 3.28). The label on the experiment tab is “Experiment 1”. The label on the experiment tab will always be the name assigned to the experiment. As experiments are added to a project, a specific experiment can be selected by clicking on the tab for the experiment of interest, or by choosing Turn To from the View menu. Figure 3.28 - Experiment Notebook with First Experiment Tab All of the trials to be performed as part of this experiment listed in the experiment notebook. - 27 Rev 1.5 Copyright 2012 Catamount Research and Development, Inc. CATAMOUNT R&D GIMM SYSTEM Data Collection To begin running an experiment, enter into the workstation windo w. Do this by double clicking on the first trial of the experiment. Figure 3.29 - Experiment Notebook After opening the workstation window, activate the camera by clicking on the camera toggle switch, indicated below by the green arrow in Figure 3.30. Figure 3.30 - Starting the Camera - 28 Rev 1.5 Copyright 2012 Catamount Research and Development, Inc. CATAMOUNT R&D GIMM SYSTEM Push the “Record” button to start recording a video clip of the trial, as shown in Figure 3.31. Figure 3.31 - Click Record Button The fecal pellet would now be inserted into the oral end of the colon segment. The peristaltic reflex will move the pellet in the oral to ab oral direction, eventually emptying the pellet from the lumen. Figure 3.32 - Inserted Fecal Pellet, Recording Video - 29 Rev 1.5 Copyright 2012 Catamount Research and Development, Inc. CATAMOUNT R&D GIMM SYSTEM Pushing the record button again will manually stop recording at this point. Note: turni ng the camera off by clicking the camera toggle switch before recording is complete will cause the video clip to be discarded and any video data for that trial will be lost. Figure 3.33 – Video Recording Stopped - 30 Rev 1.5 Copyright 2012 Catamount Research and Development, Inc. CATAMOUNT R&D GIMM SYSTEM Data Analysis To analyze the trial simply double click on the highlighted trial. shown in Figure 3.34, will now be displayed. The analysis window, Figure 3.34 - Trial Analysis From the analysis window there are several options, such as playing back the video clip or analyzing it to determine the motility rate. To play back the video simply click the play button at the bottom left. To analyze the video drag the gre en block on the slider until the peristaltic reflex begins to move the pellet. Notice there are three tabs on the right half of the analysis window, Analysis, Motor Analysis and Notes. The Analysis tab allows the user to create a graph of distance vs. time, and then uses this graph to calculate the motility rate. Motor Analysis is used for creating spatiotemporal maps of colon motility rates. The Notes section indicates what time the trial was started and stopped and can also be used for additional comm ents. - 31 Rev 1.5 Copyright 2012 Catamount Research and Development, Inc. CATAMOUNT R&D GIMM SYSTEM Analysis Tab Begin the analysis by advancing to the desired point in the video for the analysis to begin, and click once on the green “A” button located to the left of the reset button. This is where the tracking system will begin following the pel let. Now advance to the point in the video where the analysis should end. Click the yellow B button located to the left of the reset button. This is where the tracking system will stop following the pellet. Refer to Figure 3.35. The analysis will include data between the positions specified by point A to the position specified by point B. Figure 3.35 - Analyzing Motility - 32 Rev 1.5 Copyright 2012 Catamount Research and Development, Inc. CATAMOUNT R&D GIMM SYSTEM To track the pellet, click on the stopwatch located on the Analysis tab. This will bring up a crosshair that should be placed directly on the pellet, as shown in Figure 3.36. Once pointed at the pellet, left click to start the analysis. The line graph box to the right will create a graph of distance over time, as seen in Figure 3.37. Figure 3.36 - Placing the "Crosshairs" on the Pellet Figure 3.37 - Motility Graph - 33 Rev 1.5 Copyright 2012 Catamount Research and Development, Inc. CATAMOUNT R&D GIMM SYSTEM If this graph is not satisfactory the data may be reanalyzed by clicking Reset and repeating the above procedure. The data may also be analyzed using the red cursors located in the line graph box. Move the cursors to the desired positions and then click on the calculator located below the graph. This will calculate the data between the two cursors (X1 -X2). Figure 3.38 - Reanalysis of Line Graph If, during the course of the analysis, the tracking system loses sight of the pellet then the distance, time, and velocity values will be highlighted in red ( Figure 3.39). Figure 3.39 - Invalid Data Displayed in Red - 34 Rev 1.5 Copyright 2012 Catamount Research and Development, Inc. CATAMOUNT R&D GIMM SYSTEM There are two buttons located to the right of the stopwatch. One is a combination lock and the other is a stop sign. The stop sign is used to stop the tracking analysis. The combination lock is used for locking the trial for further analysis. Only click on th e lock button if the analysis is satisfactory and the trial will not need to be reanalyzed. Motor Analysis Tab The motor analysis function is used to generate a spatiotemporal map of the length of the colon over the time course of the video recording. This method has been used in numerous studies to examine patterns of spontaneous longitudinal and circular contractions, as well as peristaltic activity (e.g. citations 8 – 12 in Appendix A). For example, Figure 3.40 shows spatiotemporal maps of peristalsis, spontaneous propagating slow contractions (SPSCs) and longitudinal muscle (LM) contractions that were generated using the motor mapping features in GIMM. Figure 3.40 - Motor Map Example Figure courtesy of Dr. Gary Mawe, University of Vermont - 35 Rev 1.5 Copyright 2012 Catamount Research and Development, Inc. CATAMOUNT R&D GIMM SYSTEM To create a motor map of a video, click the Motor Analysis tab, as shown below. Figure 3.41 - Motor Analysis Tab Set the start and stop points for analysis in the same manner described in the Analysis Tab section of this manual. Next click on the stopwatch icon to bring up the crosshair. Using the crosshair, click on the colon segment to begin the motor map. After the video segment is analyzed, the motor map will be displayed, as shown in Figure 3.42. Figure 3.42 – Motor Map Displayed - 36 Rev 1.5 Copyright 2012 Catamount Research and Development, Inc. CATAMOUNT R&D GIMM SYSTEM The motor map represents a plot of the colon’s diameter at each point along the length of the colon over time (Figure 3.43). Figure 3.43 - Motor Map Description The red cursors located on the X and Y-axis rulers can be used to generate a motor map of only the data inside the cursors. Place the cursors in the desired locations, click on the stopwatch icon, and then using the crosshairs, click on the colon segment. The motor map will represent only the data inside the cursors. Figure 3.44 – Motor Map Generated Using the Cursors - 37 Rev 1.5 Copyright 2012 Catamount Research and Development, Inc. CATAMOUNT R&D GIMM SYSTEM Click on Zoom to display a larger view of the motor map, as shown in Figure 3.45. This will also display the appropriate time, distance and diameter scales. Figure 3.45 – Zoom Display - 38 Rev 1.5 Copyright 2012 Catamount Research and Development, Inc. CATAMOUNT R&D GIMM SYSTEM Reporting/Printing After the steps mentioned earlier in this chapter are completed for all trials a summary report may be generated. To do this click on the File menu while in the project screen. The trials should now all be highlighted yellow, which means they have been analyzed. Under the File menu there is an Export Data option and a Print Report option. Figure 3.46 - Print Report Menu The Export Data option allows the user to select which format to use when exporting data. Experimental Data Summary results in a PDF file that summarizes the data from that experiment. Included in the summary report are the distances, times, and calculated velocities for each trial of the experiment. It also gives the average velocities for each group (ex. Baseline, DMSO 0.1%). Figure 3.48 shows a sample PDF summary report. ASCII will organize the data in two columns, one column contains the distance data and another column contains the time data. This file may be opened into Excel. Meta File will save a Windows Meta File of the graph display shown on the Analysis tab. Figure 3.47 - Export Data Menu - 39 Rev 1.5 Copyright 2012 Catamount Research and Development, Inc. CATAMOUNT R&D GIMM SYSTEM Figure 3.48 - PDF Summary Report Three types of reports may be printed. To do this, open the File menu in the project whose data is to be printed. Now select Print Report then select Experimental Data Summary, Project Protocol Summary, or Experimental Report Sheet. - 40 Rev 1.5 Copyright 2012 Catamount Research and Development, Inc. CATAMOUNT R&D GIMM SYSTEM APPENDIX A Citations These are a few citations that make use of the in vitro guinea pig distal colon model for measuring the peristaltic reflex. Users desiring more background in this area may wish to consult these publications for methodologies and research approaches that may be found useful. 1. Costa, M. and J. B. Furness (1976). "The peristaltic reflex: an ana lysis of the nerve pathways and their pharmacology." Naunyn Schmiedebergs Arch Pharmacol 294(1): 47-60. 2. Foxx-Orenstein, A. E. and J. R. Grider (1996). "Regulation of colonic propulsion by enteric excitatory and inhibitory neurotransmitters." Am J Physiol Gastrointest Liver Physiol 271(3): G433-437. 3. Jin, J.-G., A. E. Foxx-Orenstein, et al. (1999). "Propulsion in Guinea Pig Colon Induced by 5-Hydroxytryptamine (HT) via 5-HT4 and 5-HT3 Receptors." J Pharmacol Exp Ther 288(1): 93-97. 4. Kadowaki, M., P. R. Wade, et al. (1996). "Participation of 5-HT3, 5-HT4, and nicotinic receptors in the peristaltic reflex of guinea pig distal colon." Am J Physiol Gastrointest Liver Physiol 271(5): G849-857. 5. Linden, D. R., J.-X. Chen, et al. (2003). "Serotonin availability is increased in mucosa of guinea pigs with TNBS-induced colitis." Am J Physiol Gastrointest Liver Physiol 285(1): G207-216. 6. Linden, D. R., K. A. Sharkey, et al. (2004). "Cyclooxygenase -2 contributes to dysmotility and enhanced excitability of myenteric AH neurone s in the inflamed guinea pig distal colon." J Physiol (Lond) 557(1): 191-205. 7. Wade, P., J. Chen, et al. (1996). "Localization and function of a 5 -HT transporter in crypt epithelia of the gastrointestinal tract." J. Neurosci. 16(7): 2352-2364. 8. Benard, T., Bouchoucha, M., Dupres, M., Cugnenc, P.H. In vitro analysis of rat intestinal wall movements at rest and during propagated contraction: a new method. Am J Physiol Gastrointest Liver Physiol 273: G776-G784, 1997. 9. Berthoud, H.R., Hennig, G., Campbell, M., V olaufova, J., Costa, M. Video-based spatio-temporal maps for analysis of gastric motility in vitro: effects of vagal stimulation in guinea-pigs. Neurogastroenterol Mot 14: 677-688, 2002. 10. D’Antona, G., Hennig, G.W., Costa, M., Humphreys, C.M., Brookes, J. H. Analysis of motor patterns in the isolated guinea-pig large intestine by spatio-temporal maps. Neurogastroenterol Mot 13: 483-492, 2001. 11. Hennig, G.W., Costa, M., Chen, B.N., Brookes, S.J.H. Quantitative analysis of peristalsis in the guinea-pig small intestine using spatio-temporal maps. J Physiol 517: 575-590, 1999. 12. Seerden, T.C., Lammers, W.J.E.P., De Winter, B.Y., De Man, J.G., Pelckmans, P.A. Spatiotemporal electrical and motility mapping of distension -induced propagating oscillations in the murine small intestine. Am J Physiol Gastrointest Liver Physiol 289: G1043-G1051, 2005. - 41 Rev 1.5 Copyright 2012 Catamount Research and Development, Inc. CATAMOUNT R&D GIMM SYSTEM APPENDIX B Driver and Software Installation NOTE: If the computer being used with the system was purchased from Catamount Research and Development as part of the GIMM package, the driver and software installation has already been completed. This section must only be completed if the computer being used was not purchased from Catamount Research and Development. Begin driver and software installation by inserting the GIMM CD into a CD-ROM drive. The screen shown below will appear. Click Install GIMM and the screen shown in Figure B.2 will appear. Click Install to being installation. Figure B.1 - GIMM CD Main Screen Figure B.2 – GIMM Install Wizard - 42 Rev 1.5 Copyright 2012 Catamount Research and Development, Inc. CATAMOUNT R&D GIMM SYSTEM The Fire Wire Camera driver will be installed first. Once this installation is complete, the Customer Information screen shown below will appear. Enter the desired User Name, Company Name and the password that was issued when the software was registered with Catamount R & D. Click Next to proceed and the Destination Location screen, shown in Figure B.4, will appear. Figure B.3 – Customer Information Screen The default destination folder is shown on this screen. If this location is acceptable, click Next to continue and the Ready to Install screen shown in Figure B.5 will appear. If it is not, click Browse… to browse to the desired location. Figure B.4 – Destination Location Screen - 43 Rev 1.5 Copyright 2012 Catamount Research and Development, Inc. CATAMOUNT R&D GIMM SYSTEM The wizard is now ready to begin installation. Click Install to complete the installation process and the screen shown in Figure B.6 will appear. Click Back to review or change any of the installation settings. Figure B.5 - Ready to Install Screen The installation is now complete. Click Finish to close this window. Figure B.6 – Install Wizard Complete A few more steps must be completed to install the Fire Wire Camera driver. Return to the screen shown in Figure B.1 and click Browse the CD. The contents of the CD will appear, as shown in Figure B.7. - 44 Rev 1.5 Copyright 2012 Catamount Research and Development, Inc. CATAMOUNT R&D GIMM SYSTEM Double-click on the Manuals folder. The contents of this folder will appear, as shown in Figure B.8. Figure B.7 – Contents of the GIMM CD This folder contains the GIMM manual, as well as Fire Wire Camera driver installation instructions that are specific to each compatible operating system. Double -click on the appropriate file and follow the instructions to complete installation of the Fire Wire Camera driver. Figure B.8 - GIMM Manuals Folder - 45 Rev 1.5 Copyright 2012 Catamount Research and Development, Inc. CATAMOUNT R&D GIMM SYSTEM ꞌ APPENDIX C Plumbing Diagram for Single Station/Single Pump System - 46 Rev 1.5 Copyright 2012 Catamount Research and Development, Inc. CATAMOUNT R&D GIMM SYSTEM ꞌ APPENDIX D Plumbing Diagram for Single or Multiple Station System - 47 Rev 1.5 Copyright 2012 Catamount Research and Development, Inc. CATAMOUNT R&D GIMM SYSTEM APPENDIX E Heating System Diagram - 48 Rev 1.5 Copyright 2012 Catamount Research and Development, Inc.