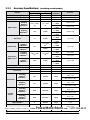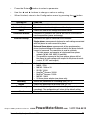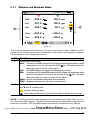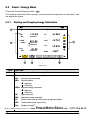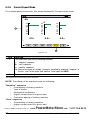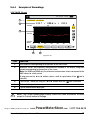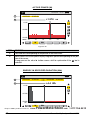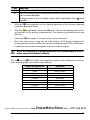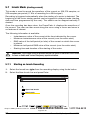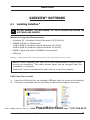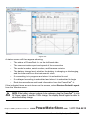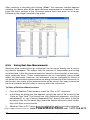
1
SINGLE-PHASE POWER QUALITY ANALYZER Shop for AEMC products online at: ENGLISH www. 8230 PowerPad® Jr. PowerMeterStore.com User Manual 1.877.766.5412 Statement of Compliance Chauvin Arnoux®, Inc. d.b.a. AEMC® Instruments certifies that this instrument has been calibrated using standards and instruments traceable to international standards. We guarantee that at the time of shipping your instrument has met its published specifications. An NIST traceable certificate may be requested at the time of purchase, or obtained by returning the instrument to our repair and calibration facility, for a nominal charge. The recommended calibration interval for this instrument is 12 months and begins on the date of receipt by the customer. For recalibration, please use our calibration services. Refer to our repair and calibration section at www.aemc.com. Serial #: _________________________________ Catalog #: _______________________________ Model #: 8230 Please fill in the appropriate date as indicated: Date Received: __________________________________ Date Calibration Due: ________________________ Chauvin Arnoux®, Inc. d.b.a AEMC® Instruments www.aemc.com Shop for AEMC products online at: www. PowerMeterStore.com 1.877.766.5412 READ CAREFULLY BEFORE USING FOR THE FIRST TIME Your instrument is equipped with a NiMH battery. This technology offers several advantages: • Long battery charge life for a limited volume and weight. • Possibility of quickly recharging your battery. • Significantly reduced memory effect: you can recharge your battery even if it is not fully discharged. • Respect for the environment: no pollutant materials such as lead or cadmium, in compliance with the applicable regulations. After prolonged storage, the battery may be completely discharged. If so, it must be completely recharged. Your instrument may not function during part of this recharging operation. Full recharging of a completely discharged battery may take several hours. NOTE: In this case, at least 5 charge/discharge cycles will be necessary for your battery to recover 95% of its capacity. To make the best possible use of your battery and extend its effective service life: • Only use the charger supplied with your instrument. Use of another charger may be dangerous. • Only charge your instrument at temperatures between 0° and 40°C. • Comply with the conditions of use defined in the operating manual. • Comply with the storage conditions specified in the operating manual. NiMH technology allows a limited number of charge/discharge cycles depending significantly on: • The conditions of use. • The charging conditions. Please refer to § 7 for correct replacement of the battery. Do not dispose of the battery pack with other solid waste. Used batteries must be entrusted to a qualified recycling company or to a company specialized in processing hazardous materials. Shop for AEMC products online at: www. PowerMeterStore.com 1.877.766.5412 Table of Contents 1.INTRODUCTION................................................................................ 5 1.1 International Electrical Symbols............................................................5 1.2 Definition of Measurement Categories..................................................6 1.3 Receiving Your Shipment......................................................................6 1.4 Ordering Information.............................................................................6 1.4.1 Accessories and Replacement Parts.......................................7 2. PRODUCT FEATURES....................................................................... 8 2.1Description............................................................................................8 2.2 Control Functions..................................................................................9 2.3Display................................................................................................11 2.4 Power Supply......................................................................................12 2.5 Optical Interface..................................................................................12 3.SPECIFICATIONS........................................................................... 13 3.1 Reference Conditions.........................................................................13 3.2 Electrical Specifications......................................................................13 3.2.1 Voltage Inputs........................................................................13 3.2.2 Current Inputs........................................................................13 3.2.3 Accuracy Specifications (excluding current probes) ............14 3.2.4 Accuracy Specifications of the Current Probes ....................16 3.2.5 Current Probes and Sensors.................................................17 3.2.6 Power Supply.........................................................................18 3.4 Mechanical Specifications...................................................................19 3.5 Environmental Specifications..............................................................19 3.6 Safety Specifications...........................................................................19 4.OPERATION................................................................................... 20 4.1 Instrument Configuration (Set-up mode).....................................20 4.1.1 Configuring a Current Probe..................................................22 4.1.2 Configuring a Recording........................................................22 4.1.3 Configuring the Alarm Settings..............................................24 5. DISPLAY MODES............................................................................ 25 PowerMeterStore.com 1.877.766.5412 5.1 Waveform Mode..www. ................................................................................25 Shop for AEMC products online at: 2 Power Quality Analyzer Model 8230 5.1.1 5.1.2 5.1.3 Minimum and Maximum Values.............................................27 Simultaneous Display............................................................28 Phase Rotation......................................................................29 5.2 Power / Energy Mode.........................................................................32 5.2.1 Starting and Stopping Energy Totalization.............................32 5.3 Harmonics Mode .....................................................................34 5.3.1 Voltage (V).............................................................................34 5.3.2 Current (A).............................................................................35 5.3.3 Apparent Power (VA).............................................................36 5.3.4 Voltage Expert Mode.............................................................37 5.3.5 Current Expert Mode.............................................................38 5.4 Snapshot Mode .........................................................................39 5.4.1 Taking a Snapshot of a Display.............................................40 5.4.2 Opening and Deleting a Previously Saved Snapshot............40 ..................................................................................41 5.5 Alarm Mode 5.5.1 Programming and Starting Alarms.........................................42 5.5.2 Displaying the Alarms Log.....................................................42 5.5.3 Deleting the Alarms Log.........................................................43 5.6 Recording Mode .......................................................................44 5.6.1 Starting a Recording..............................................................45 5.6.2 Selecting a Recording............................................................46 5.6.3 Deleting a Recording.............................................................46 5.6.4 Examples of Recordings........................................................47 5.7 Inrush Mode (starting current).............................................................50 5.7.1 Starting an Inrush Recording.................................................50 5.7.2 Viewing the Inrush Recording................................................52 6.DATAVIEW® SOFTWARE................................................................. 53 6.1 Installing DataView®............................................................................53 6.2 Connecting the Model 8230 to your Computer...................................56 6.3 Opening the Control Panel..................................................................57 6.3.1 General Functions.................................................................59 6.3.2 Set-up Configuration..............................................................59 6.3.3 Instrument Display Configuration...........................................60 6.3.4 Alarm Conditions Configuration.............................................61 6.3.5 Recordings Configuration......................................................62 6.3.6 Inrush Configuration..............................................................64 6.3.7Monitoring..............................................................................65 6.3.8 Running Shop for AEMC products online at: www.the Test....................................................................66 .com 1.877.766.5412 PowerMeterStore Power Quality Analyzer Model 8230 3 6.4 Real-time Windows.............................................................................66 6.4.1 Waveform, Harmonic Bar and Harmonic Text........................66 6.4.2Power/Energy........................................................................67 6.4.3Trend......................................................................................68 6.5 Downloading Data to Database..........................................................68 6.5.1Recordings.............................................................................69 6.5.2Photographs..........................................................................70 6.5.3Alarms....................................................................................71 6.5.4Inrush.....................................................................................71 6.5.5 Monitoring..............................................................................73 6.5.6 Saving Real-time Measurements...........................................74 7.MAINTENANCE.............................................................................. 76 7.1 Recharging the Battery.......................................................................76 7.2 Changing the Battery..........................................................................77 7.3 Cleaning..............................................................................................77 APPENDIX A: MATHEMATICAL FORMULAS........................................... 78 Half-period Voltage and Current RMS Values.....................................78 MIN / MAX Values for Voltage and Current.........................................78 Short-term Flicker (PST) of the Voltage..............................................79 Peak Factors for Current and Voltage.................................................79 1 sec RMS Values for Voltage and Current.........................................79 Harmonic Calculations........................................................................80 Different Power Levels 1 Sec in Single-Phase Connection................80 Different Power Levels 1 Sec Balanced Three-Phase Connection.....80 K Factor..............................................................................................81 Ratios ...............................................................................................81 Various Types of Energy.....................................................................81 Hysteresis...........................................................................................82 APPENDIX B: GLOSSARY OF UNITS...................................................... 83 Repair and Calibration.........................................................................................84 Technical and Sales Assistance..........................................................................84 Limited Warranty.................................................................................................85 Warranty Repairs.................................................................................................85 Shop for AEMC products online at: 4 www. PowerMeterStore.com 1.877.766.5412 Power Quality Analyzer Model 8230 CHAPTER 1 INTRODUCTION Warning • Never use on circuits with a voltage higher than 600V and an overvoltage category higher than CAT III. • Use in indoor environments only. • Only use accessories that are compliant with the safety standards (IEC 664-1 Ed. 92) 600V CAT III or 300V CAT IV. • Only use factory specified replacement parts. • Always disconnect the power cord, measurement leads and sensors before replacing the battery. 1.1 International Electrical Symbols This symbol signifies that the instrument is protected by double or reinforced insulation. This symbol on the instrument indicates a WARNING and that the operator must refer to the user manual for instructions before operating the instrument. In this manual, the symbol preceding instructions indicates that if the instructions are not followed, bodily injury, installation/sample and/or product damage may result. Risk of electric shock. The voltage at the parts marked with this symbol may be dangerous. This symbol refers to a type A current sensor. This symbol signifies that application around and removal from HAZARDOUS LIVE conductors is permitted. This symbol refers to a type B current sensor. Do not apply around or remove from HAZARDOUS LIVE conductors without additional protective means (de-energizing the circuit or wearing protective clothing suitable for high voltage work). In conformity with WEEE 2002/96/EC Shop for AEMC products online at: www. PowerMeterStore.com Power Quality Analyzer Model 8230 1.877.766.5412 5 1.2 Definition of Measurement Categories CAT I: For measurements on circuits not directly connected to the AC supply wall outlet such as protected secondaries, signal level, and limited energy circuits. CAT II: For measurements performed on circuits directly connected to the electrical distribution system. Examples are measurements on household appliances or portable tools. CAT III: For measurements performed in the building installation at the distribution level such as on hardwired equipment in fixed installation and circuit breakers. CAT IV: For measurements performed at the primary electrical supply (<1000V) such as on primary overcurrent protection devices, ripple control units, or meters. 1.3 Receiving Your Shipment Make sure that the contents shipped are consistent with the ordering information. Notify your distributor of any missing items. If the equipment appears to be damaged, file a claim immediately with the carrier and notify your distributor at once, giving a detailed description of any damage. Save the damaged packing container to substantiate your claim. Do not use equipment which is damaged or appears to be damaged. 1.4 Ordering Information PowerPad® Jr. Model 8230..............................................................Cat. #2130.81 Includes set of two 10 ft (3m) color-coded leads (red/black) with alligator clips, optical USB cable, US 110V power adapter, set of six 1.2V AA NiMH rechargeable batteries, DataView® software, carrying bag, and user manual. PowerPad® Jr. Model 8230 w/MN93-BK.........................................Cat. #2130.82 Includes the PowerPad® Jr. Model 8230, one MN93 (240A) current probe (black connector), set of two 10 ft (3m) color-coded leads (red/black) with alligator clips, optical USB cable, US 110V power adapter, set of six 1.2V AA NiMH rechargeable batteries, DataView® software, carrying bag, and user manual. PowerPad® Jr. Model 8230 w/SR193-BK........................................Cat. #2130.83 Includes the PowerPad® Jr. Model 8230, one SR193 (1200A) current probe (black connector), set of two 10 ft (3m) color-coded leads (red/black) with alligator clips, optical USB cable, US 110V power adapter, set of six 1.2V AA NiMH rechargeable batteries, DataView® software, carrying bag, and user manual. Shop for AEMC products online at: 6 www. PowerMeterStore.com 1.877.766.5412 Power Quality Analyzer Model 8230 PowerPad® Jr. Model 8230 w/24" AmpFlex® 193-24-BK...............Cat. #2130.84 Includes the PowerPad® Jr. Model 8230, one 24" AmpFlex® 193-24 (6500A) sensor (black connector), set of two 10 ft (3m) color-coded leads (red/black) with alligator clips, optical USB cable, US 110V power adapter, set of six 1.2V AA NiMH rechargeable batteries, DataView® software, carrying bag, and user manual. PowerPad® Jr. Model 8230 w/MN193-BK.......................................Cat. #2130.87 Includes the PowerPad® Jr. Model 8230, one MN193 (6A/120A) current probe (black connector), set of two 10 ft (3m) color-coded leads (red/black) with alligator clips, optical USB cable, US 110V power adapter, set of six 1.2V AA NiMH rechargeable batteries, DataView® software, carrying bag, and user manual. PowerPad® Jr. Model 8230 w/MA193-10-BK..................................Cat. #2130.88 Includes the PowerPad® Jr. Model 8230, one MA193 (1000A) current probe (black connector), set of two 10 ft (3m) color-coded leads (red/black) with alligator clips, optical USB cable, US 110V power adapter, set of six 1.2V AA NiMH rechargeable batteries, DataView® software, carrying bag, and user manual. 1.4.1 Accessories and Replacement Parts Adapter-110V outlet w/4mm Banana Plug......................................... Cat. #2118.49 Soft Carrying Pouch.......................................................................... Cat. #2119.48 Small Classic Carrying Bag...............................................................Cat. #2133.72 Optical USB Cable (RS-232 Connector)...........................................Cat. #2135.41 5A Adaptor Box (for 1 or 5A probes)..................................................Cat. #2140.17 AC Current Probe Model MR193 (1000AAC/1400ADC).....................Cat. #2140.28 AC Current Probe Model MN93-BK (240A).......................................Cat. #2140.32 AC Current Probe Model SR193-BK (1200A)...................................Cat. #2140.33 AmpFlex® Sensor 24" 193-24-BK (6500A)........................................Cat. #2140.34 AmpFlex® Sensor 36" 193-36-BK (6500A)........................................Cat. #2140.35 AC Current Probe Model MN193-BK (6A/120A)...............................Cat. #2140.36 MiniFlex® Sensor 10" Model MA193-10-BK (1000A).........................Cat. #2140.48 Set of two 10 ft color-coded leads with alligator clips........................Cat. #2140.31 Power Adapter 110V US....................................................................Cat. #2140.37 220V Power Adapter.........................................................................Cat. #2140.38 Set of 6 Batteries - 1.2V NIMH Rechargeable...................................Cat. #2960.37 Order Accessories and Replacement Parts Directly Online Check our Storefront at www.aemc.com/store for availability Shop for AEMC products online at: www. PowerMeterStore.com Power Quality Analyzer Model 8230 1.877.766.5412 7 CHAPTER 2 PRODUCT FEATURES 2.1Description The PowerPad® Jr. Model 8230 is a single-phase power quality analyzer that is easy-to-use, compact and shock-resistant. It is intended for technicians and engineers to measure and carry out diagnostic work and power quality work on single- or three-phase balanced low voltage networks. Users are able to obtain instant waveforms of an electrical network’s principal characteristics, and also monitor their variation over a period of time. The multitasking measurement system simultaneously handles all the measurement functions and waveform display of the various magnitudes, detection, continuous recordings and their display without any constraints. Features: • Works on single-phase and three-phase systems with balanced loads • Large easy-to-read color graphic display • Records Volts, Amps, Watts, VARs, PowerFactor, THD, Frequency and more • Measures and records True RMS AC volts up to 600VAC/DC • Measures and records True RMS current up to 6500AAC • Measures and records DC volts, amps and power • Captures and displays Inrush Current Waveforms • Verifies and displays phase rotation • Totaling of the energy generated and consumed starting from a time chosen by the operator. • Easy-to-use on-screen setup • Captures and records short term flicker • Captures and records harmonics out to the 50th • Captures up to 4096 alarm events from up to 10 different thresholds • Displays and records up to 17 different power quality parameters • Includes FREE DataView® software for data storage, real-time display, analysis and report generation Shop for• AEMC products onlineMin at: The Max and 8 PowerMeterStore www.measurements are calculated every .com half-period 1.877.766.5412 RMS Power Quality Analyzer Model 8230 2.2 Control Functions 1 2 3 4 COM Use Factory Power Supply Use Factory Current Probe A + 02/25/06 10:26 49.99Hz V Voltage Inputs 600V CAT III 300V CAT IV RMS= 229.4V RMS= 7.0 V THD= 1.8% THD= 0.00% CF=1.37 CF=1.95 300V 0 5 -300 <t= 5.0ms V1= +276 max min V2= -140 1 V3= -145 > 2 3 6 8 7 9 PowerPad® Jr MODEL 8230 Shop for AEMC products online at: www. PowerMeterStore.com Power Quality Analyzer Model 8230 Figure 2-1 1.877.766.5412 9 ITEM 1. 2. 3. 4. 5. 6. FUNCTION External power supply Four-point input for current sensor (MN, SR, AmpFlex, etc.) Negative terminal Positive terminal Color LCD display with graphic representation of system parameters and measurements Function Buttons: ON / OFF Button Turns the instrument ON after approx 5s press, turns OFF after second press. Recording Button Configures, starts/stops, saves, displays and deletes recordings. Alarm Button Displays, configures and deletes alarms Setup Button Configures the settings of the instrument. Waveform Button Displays the voltage and current waveforms, minimum and maximum values, summary tables, and determines phase rotation. Power / Energy Button Displays the measurements linked to power and energy. Harmonics Button Displays curves linked to harmonics Snapshot Button Takes a snapshot of the current screen or access screen stored in the memory. Records associated waveform and power measurement data. 7. Navigation Buttons: Moves up one line in a menu or list of choices Moves down one line in a menu or list of choices 8. Moves one character of field to the right in a menu, moves the graphic cursor, makes a selection or adjusts a cursor. Moves one character of field to the left in a menu, moves the graphic cursor, makes a selection or adjusts a cursor. Infrared optical interface for USB cable Chargingonline light at: Shop for9.AEMC products 10 www. PowerMeterStore.com 1.877.766.5412 Power Quality Analyzer Model 8230 2.3Display 1 02/25/06 10:26 49.99Hz V A RMS= 229.4V RMS= 7.0 A THD= 1.8% THD= 0.00% CF=1.37 CF=1.95 360V 20A 3 0 20A -360V <t= 5.0ms V1= +276 2 max min V2= -140 1 V3= -145 > 2 3 Figure 2-2 When the instrument is first turned ON, the Waveform screen is displayed: ITEM 1. 2. FUNCTION Top display bar indicates: • Symbol of the activated mode (e.g. , , , etc) • Frequency of measured signal • Memory capacity status bar (only available in certain modes) • Current date and time • Battery charge status (see § 7 for recharging instructions) Measurement selection: Display of the waveforms of the RMS and THD values and the peak factor with time displacement cursor. max/min Maximum and Minimum values 1 2 3 3. Simultaneous display of the various measurements in alphanumeric form Phase order Online help Selection tools: Use ▲ and ▼ to select a tool. - Selection of the sub-menu -Instantaneous measurement cursor management tool on a point of the curve Shop for AEMC products online at: www. PowerMeterStore.com Power Quality Analyzer Model 8230 1.877.766.5412 11 2.4 Power Supply When the unit is turned on, the battery icon at top right on the screen indicates the charge condition of the storage batteries. The number of bars inside the icon is proportional to the charge level. ITEM FUNCTION Battery fully charged. Battery discharged. Moving bars: battery charging No battery. The 8230 is supplied by external power unit. When the capacity of the battery is too low, the message “Battery too low. The instrument will be switched off soon” is displayed in the center of the screen. The instrument is switched off 1 minute after this message appears. 2.5 Optical Interface The optical interface (Figure 2-1, item 8) provides an optical, and therefore isolated, two-way connection between the 8230 and a PC for transmission of the information in memory (alarms, snapshots, motor starts, records) and all instantaneous measurements and waveforms displayed on the screen of the 8230. The transfer rate is determined automatically by the 8230 according to the software used; the maximum rate is 115.2 kbps. Shop for AEMC products online at: 12 www. PowerMeterStore.com 1.877.766.5412 Power Quality Analyzer Model 8230 CHAPTER 3 SPECIFICATIONS 3.1 Reference Conditions Parameter Ambient temperature Humidity Atmospheric pressure Phase-to-earth voltage Clamp current circuit input voltage AmpFlex® current circuit input voltage Network frequency Phase shift Harmonics Balanced three-phase connection Reference Conditions 73° ± 5°F (23° ± 3°C) 45 to 75% 25.4" to 31.3" Hg (860 to 1060 hPa) 50 to 600Vrms without DC (< 0.5%) 30mVrms to 1Vrms without DC (<0.5%) 11.8 to 118mVrms without DC (<0.5%) 50 and 60Hz ± 0.1Hz 0° active power / 90° reactive power <0.1% 3φ mode OFF *All specifications are subject to change without notice. 3.2 Electrical Specifications 3.2.1 Voltage Inputs Operating Range: Phase-Phase - 0 to 660Vrms AC/DC* Phase-Neutral - 0 to 600Vrms AC/DC *Provided that the max with 600Vrms in regards to earth is not exceeded. Input Impedance: 451kΩ Overload: 1.2Vn permanently; 2Vn for 1 sec (Vn = nominal voltage) 3.2.2 Current Inputs Operating Range: 0 to 1V Input Impedance: 1MΩ for current probe circuit and 12.4kΩ for AmpFlex® circuit Overload: 1.7V Sample Rate: 256 per cycle PowerMeterStore .com 50 ÷ 2) at 50Hz; 7.68kHz (256 x 601.877.766.5412 ÷ 2) at 60Hz Shop forAEMC products online at: www. 6.4kHz (256 x Power Quality Analyzer Model 8230 13 3.2.3 Accuracy Specifications (excluding current probes) Function Measurement range Minimum Maximum Display Resolution 40Hz 69Hz 0.01Hz ±(1ct) TRMS voltage 6V 600V (6) 0.1V ±(0.5%+2cts) DC voltage 6V 600V ±(1%+5cts) Excluding AmpFlex® & MiniFlex®* Inom ÷ 1000 [A] 1.2 × Inom [A] AmpFlex® & MiniFlex®* 10A 6500A 1A 1700A (1) 0.1V 0,1A I < 1000A 1A I ≥ 1000A 0.1A I < 1000A 1A I ≥ 1000A 0.1A I < 1000A 1A I ≥ 1000A TRMS current DC current ±(0.5%+2cts) ±(0.5%+1ct) ±(0.5%+1A) ±(1%+1A) Excluding AmpFlex® & MiniFlex®* AmpFlex® & MiniFlex®* 0A Excluding AmpFlex® & MiniFlex®* Inom ÷ 100 [A] 1.2 × Inom [A] AmpFlex® & MiniFlex®* 100A 6500A Peak voltage 6V 850V (4) 1A I ≥ 1000A 0.1A I < 1000A 1A I ≥ 1000A 0.1A I < 1000A 1A I ≥ 1000A 0.1 V Half-period TRMS Voltage (5) 6V 600V 0.1V ±(0.8%+5cts) 1 4 0.01 ±(1%+2cts) 4 9.99 0.01 Excluding AmpFlex® & MiniFlex®* 0W 9999kW 4 digits AmpFlex® & MiniFlex®* 0W 9999kW 4 digits Excluding AmpFlex® & MiniFlex®* 0VAR 9999kVAR 4 digits Excluding AmpFlex® & MiniFlex®* 0VAR 9999kVAR 4 digits ±(5%+2cts) ±(1%) Cos φ ≥ 0.8 ±(1.5%+10cts) 0.2 ≤ Cos φ < 0.8 ±(1%) Cos φ ≥ 0.8 ±(1.5%+10cts) 0.5 ≤ Cos φ < 0.8 ±(1%) Sin φ ≥ 0.5 ±(1.5%+10cts) 0.2 ≤ Sin φ < 0.5 ±(1.5%) Sin φ ≥ 0.5 ±(2.5%+20cts) 0.2 ≤ Sin φ < 0.5 0 9999kVA 4 digits Current Peak Half-period TRMS current(4) Crest Factor 1.7 × Inom [A](2) 9190A(3) 0,1A I < 1000A Active Power Reactive Powers Apparent power Power factor Shop for AEMC products online at: 14 Accuracy Frequency -1 www. 1 0.001 PowerMeterStore ±(1%+1A) ±(1%+5cts) ±(1%+1ct) ±(1.5%+4A) ±(1%+5cts) ±(1%) ±(1.5%) Cos φ ≥ 0.5 ±(1.5%+10cts) .com 0.2 ≤ Cos φ < 0.5 1.877.766.5412 Power Quality Analyzer Model 8230 Measurement range Minimum Maximum Display resolution Excluding AmpFlex® & MiniFlex®* 0Wh 9999MWh 4 digits AmpFlex® & MiniFlex®* 0Wh 9999MWh 4 digits Excluding AmpFlex® & MiniFlex®* 0VARh 9999MVARh 4 digits AmpFlex® & MiniFlex®* 0VARh 9999MVARh 4 digits Apparent energy 0VAh 9999MVAh 4 digits Phase shift -179° 180° Tangent VA ≥ 50VA -32.76 32.76 1° 0.001 Tan φ < 10 0.01 Tan φ ≥ 10 -1 1 0.001 ±(1°) on φ ±(5cts) on DPF 0% 999.9% 0.1% ±(1%+5cts) Function Active energy Reactive energies Displacement factor (DPF) Level of harmonics order ∈ [1; 50] (Vrms > 50V) Without AmpFlex® or MiniFlex®* (Irms > 3 × Inom ÷ 100) AmpFlex® (Irms > Inom ÷ 10) Angles of harmonics (Vrms > 50V) Without AmpFlex® or MiniFlex®* (Irms > 3 × I ÷ 100) AmpFlex® (Irms > Inom ÷ 10) Global level of harmonics (THD-F) order ≤ 50 Accuracy ±(1%) Cos φ ≥ 0.8 ±(1.5%) 0.2 ≤ Cos φ < 0.8 ±(1%) Cos φ ≥ 0.8 ±(1,5%) 0.5 ≤ Cos φ < 0.8 ±(1%) Sin φ ≥ 0.5 ±(1,5%) 0.2 ≤ Sin φ < 0.5 ±(1.5%) Sin φ ≥ 0.5 ±(2.5%) 0.2 ≤ Sin φ < 0.5 ±(1%) ±(2°) ±(1°) on φ ±(3°) order ∈ [1 ; 25] -179° 180° 1° 0% 999.9% 0.1% ±(1%+5cts) Distortion factor (THD-R) order ≤ 50 0% 999.9% 0.1% ±(1%+10cts) K factor 1 99.99 0.01 ±(5%) ±(10°) order ∈ [26 ; 50] *NOTE: MiniFlex specified up to 1000A only ® (1) 1.2 x 1000 x √2 - 1700A (2) 1.2 x Inom x √2 = 1.7 x Inom (3) 6500 x √2 - 9190A (4) 600 x √2 = 850V (5)Attention: The absolute value of the offset must not exceed 95% of the peak amplitude. In other words, s(t) = S × sin(ωt) + O, so |O| ≤ 0.95 × S (S positive). The 'half-period' values are the MAX and MIN values of the waveforms mode and the VRMS and ARMS values used in the Alarm mode and the Inrush mode. (6) For the phase-to-earth voltage measurement (phase-neutral). For the phase-to-phase voltage measurement (phase-phase), in balanced three-phase mode, it is possible to reach 660VRMS (balanced three-phase network having a phase-neutral voltage of 380 VRMS). PowerMeterStore 1.877.766.5412 Shop forNOTE: AEMC products at:andwww. Accuracy givenonline for power energy measurements are maximum for Cos φ = 1 or Sin.com φ = 1 and are typical for the other phase shifts. Power Quality Analyzer Model 8230 15 3.2.4 Accuracy Specifications of the Current Probes These characteristics are stated after linearization. The errors of the sensors are compensated by a typical correction inside the instrument. This typical correction is in phase and in amplitude according to the type of sensor connected (detected automatically) and the gain of the current acquisition chain used. The measurement error in RMS current and the phase error are additional errors (they must therefore be added to those of the instrument alone) stated as influences on the calculations performed by the analyzer (powers, energies, power factors, tangent, etc.). Type of sensor TRMS current Maximum error on IRMS [1A; 10A] [100A; 800A] [1200A; 1400A]* [1A; 3A] MiniFlex 1000A ® MN193 5A 5A Adapter ±(0.3%) ±(0.5°) ±(0.2%) ±(0.3°) [10A; 100A] ±(3%) ±(1°) [100A; 6500A] ±(2%) ±(0.5°) [10A; 100A] ±(3%) ±(1°) [100A; 1000A] ±(2%) ±(0.5°) N.S. ±(3%+1A) [2A; 10A] ±(6°) [10A; 100A] ±(2.5%+1A) ±(3°) [100A; 240A] ±(1%+1A) ±(2°) [300mA; 1A] ±(0.7%+2mA) N.S. ±(1.5°) [1A; 120A] ±(0.7%) ±(0.7°) ±(1.7°) [5mA; 50mA] ±(1%+0.1mA) [50mA; 500mA] ±(1%) [500mA; 6A] ±(0.7%) [5mA; 50mA] ±(1%) ±(1°) [50mA; 6A] ±(0.5%) ±(0°) *DC Only Shop for AEMC products online at: 16 N.S. ±(1°) [10A; 100A] [100mA; 300mA] MN193 100A ±(1.5°) [100A; 1200A] [0,5A; 2A] MN93 200A ±(5%) ±(0.8%) [3A; 10A] AmpFlex® 3000A ±(2°) ±(3%) [800A; 1200A] SR193 1000A www. φ N.S. ±(1.5%+1A) [10A; 100A] MR193 1000A Maximum error on PowerMeterStore.com ±(1°) 1.877.766.5412 Power Quality Analyzer Model 8230 3.2.5 Current Probes and Sensors When installing probes, face the arrow on the probe in the direction of the load. Model SR193 1000AAC for f ≤1kHz Nominal Range Measurement Range 1A to 1200AAC max (I >1000A not continuously) Probe Output Signal 1mVAC/AAC Maximum Clamping Diameter 2" (52mm) Safety EN 61010-2-032, Pollution Degree 2, 600V CAT IV, 1000V CAT III NOTE: Currents <0.5A will be displayed as zero. Neutral current measures down to 0A. Model MN93 200A AC for f ≤1kHz Nominal Range Measurement Range 2A to 240A AC max (I >200A not permanent) Probe Output Signal 5mVAC /A AC Maximum Clamping Diameter 0.8" (20mm) Safety EN 61010-2-032, Pollution Degree 2, 300V CAT IV, 600V CAT III NOTE: Currents <0.5A will be displayed as zero. Neutral current measures down to 0A. Model MR193 Nominal Range 1000A AC, 1400ADC max Measurement Range 10A to 1000A AC, 10A to 1300A PEAK AC+DC Probe Output Signal 1mV/A Maximum Clamping Diameter One 1.6" (42mm) or two 0.98" (25.4mm) or two bus bars 1.96 x 0.19" (50 x 5mm) Safety EN 61010-2-032, Pollution Degree 2, 300V CAT IV, 600V CAT III NOTE: Currents <1A AC/DC will be displayed as zero. Neutral current measures down to 0A. Model MN193 Nominal Range 5A and 100AAC Measurement Range 5A: 0.005A to 6A AC max (1A to 1200A with ratio 1000/5 selected) 100A: 0.1A to 120A AC max Probe Output Signal 5A: 200mV/A AC; 100A: 10mV/A AC Maximum Clamping Diameter 0.8" (20mm) Safety EN 61010-2-032, Pollution Degree 2, 300V CAT IV, 600V CAT III The 5A range of the MN193 is designed to work with secondary current transformers. Best accuracy is available when entering the transformer ratio (e.g. 1000/5A). When used to measure 5A direct, the resolution will be limited to 0.1A max. NOTE: Currents < (Primary x 5) ÷ (Secondary x 1000) or <250mA on the 5A range and <0.2A on the 100A range will be displayed as zero with this probe. Power calculations will also be zeroed when the current is zeroed when the current is zeroed. Shop for AEMC products online at: www. PowerMeterStore.com Power Quality Analyzer Model 8230 1.877.766.5412 17 AmpFlex® Sensors Nominal Range 3000A AC Measurement Range 10A to 6500A AC Probe Output Signal* 140mV AC/3000A AC at 60Hz Sensor Length = 24" (610mm); Ø = 7.64" (190mm) Length = 36" (910mm); Ø = 11.46" (290mm) Safety EN 61010-2-032, Pollution Degree 2, 600V CAT IV, 1000V CAT III *Output is proportional to the amplitude and frequency of the measured current. NOTE: Currents <10A will be displayed as zero. Neutral current measures down to 0A. MiniFlex® Sensors Nominal Range 1000A AC Measurement Range 10A to 1000A AC Probe Output Signal* 47µV AC/1000A AC at 60Hz Sensor Length = 10" (250mm); Ø = 2.75" (70mm) Safety EN 61010-2-032, Pollution Degree 2, 600V CAT IV, 1000V CAT III 3.2.6 Power Supply AC Power (internal power supply) Operating Range: 120V ± 10% @ 60Hz ; 230V ± 10% @ 50Hz (model dependent) Max Power: 23.7VA Power Source (allows use in the event of an interruption) Type: 6 NiMH rechargeable battery pack (IEC LR6 - NEDA 15A) >1800mAh Rated Voltage: 7.2V Charging Current: 0.6 to 0.8A Charge Time: 4 hrs (NiMH) Battery Life: >8 hrs with display on ≥ 40 hrs with display off (recording mode) At least 300 charging/discharging cycles NOTE: The battery starts to charge when the power cord is connected. When the battery is charged, the instrument uses the current supplied by the power supply, without drawing from the battery. Shop for AEMC products online at: 18 www. PowerMeterStore.com 1.877.766.5412 Power Quality Analyzer Model 8230 3.4 Mechanical Specifications Dimensions: 8.3 x 4.3 x 2.4" (211 x 108 x 60mm) Weight: 1.94 lbs (880g) Shock and Vibration: per EN 61010-1 Tightness: IP 54 per EN 60529 (electrical IP2X for the terminals) 3.5 Environmental Specifications Operating Temperature: 32° to 122°F (0° to 50°C) Storage Temperature (<30 days): -4° to +122°F (-20 to +50°C) with batteries Recharging Temperature: 50° to 104°F (10° to 40°C) Altitude: Operating: 0 to 2000 meters (6560 ft) Non-Operating: 0 to 10,000 meters (32800 ft) Operating Relative Humidity: 10 to 85% 3.6 Safety Specifications Electrical Safety 600V CAT III, Pollution Degree 2 EN 61010-31: 2002 EN 61010-1: 2001 EN 61010-2: 1995 Electromagnetic Compatibility Immunity: EN 61236-1 A2 Emission: EN 61236-1 A2 Electrostatic discharges: IEC 1000-4-2 Radiation field resistance: IEC 1000-4-3 Fast transients resistance: IEC 1000-4-4 Electric shock resistance: IEC 1000-4-5 Conducted RF interference: IEC 1000-4-6 Interruption of Voltage: IEC 1000-4-11 Shop for AEMC products online at: www. PowerMeterStore.com Power Quality Analyzer Model 8230 1.877.766.5412 19 CHAPTER 4 OPERATION NOTE: Charge the instrument fully before use. Press the ON/OFF button to turn the unit ON. The startup screen appears indicating the instrument’s software version and serial number. If there is no AC power supply, the instrument operates on batteries. The instrument’s batteries are charged when it is connected to a 120/240; 60/50Hz line. 4.1 Instrument Configuration (Set-up mode) NOTE: All configurations are available through the DataView® software. NOTE: The instrument must be configured the first time it is used and then when ever necessary, should your needs change. The configuration is saved when the instrument is turned OFF. Press the configuration button to configure the instrument. 02/25/06 DATE / TIME CONTRAST / BRIGHTNESS COLORS CALCULATION METHOD ELECTRICAL HOOKUP CURRENT SENSORS RECORDING ALARMS CLEAR MEMORY ABOUT FR EN DE ES IT PO Figure 4-1 • Set the display language by using the ◄ and ► buttons. • The parameter that is ready to be configured will be highlighted in yellow. To use the ▲ and ▼ buttons. .com 1.877.766.5412 PowerMeterStore Shop for AEMCto products online at: www. move a different parameter, 20 Power Quality Analyzer Model 8230 • Press the Enter • Use the ◄ and ► buttons to change a value or setting. • When finished, return to the Configuration menu by pressing the PARAMETER Date / Time button to select a parameter. FUNCTION Sets the date and time format Contrast / Brightness Adjusts the contrast and brightness of the display Colors Defines the color of the voltage and current curves Calculation Method Electrical Hookup button. Determines if harmonics are used or not used in calculations of reactive quantities (power and energy) Determines the type of connection to the network: Single-phase: measurement of phase-to-earth voltage associated with the phase-to-earth current of a phase. Balanced three-phase: measurement of the complementary phase-to-phase voltage of the phase of which the phase-to-earth current is measured. The connection is used to calculate: • The total powers and energies of a balanced three-phase network (W, Wh, VAR, VARh, VA and VAh). • The quantities common to the three phases (phase shift of the phase-to-earth voltage with respect to the phase-to-earth current, PF, DPF and tangent). Current Sensors Recording Alarms Clear Memory About Shop for AEMC products online at: Defines the type of current sensor to connect • MN93: 200A • MN193: 100A or 5A • SR193: 1000A • AmpFlex® Sensors: 3000A • MiniFlex® Sensors: 1000A • MR193: 1000A • 5A three-phase adapter (one phase only) Selects the parameters of a recording (see § 4.1.2) Defines the parameters of an alarm (see § 4.1.3) Deletes all data (configurations, alarm settings, snapshots and recordings). The configuration will return to the default setting. Displays the serial number, software and hardware version. www. PowerMeterStore.com Power Quality Analyzer Model 8230 1.877.766.5412 21 4.1.1 Configuring a Current Probe Press the configuration button and select CURRENT SENSORS. 07/25/02 02/25/0610:26 10:26 100% CURRENT SENSORS :02/17/06 11:27 1000/5 Figure 4-2 The type of probe that is currently connected will appear automatically on the display. • The Adapter Box and MN193 Clamp require a transformation ratio selection. Press the Enter button to configure the primary current (1A to 2999A) / secondary current (1 or 5A) transformation ratio. Use the ◄► buttons to select the fields and the ▲▼ buttons to select the values. Validate the selections by pressing the Enter button. 4.1.2 Configuring a Recording Press the configuration button and select RECORDING. 07/25/02 02/25/0610:26 10:26 100% RECORDING Set-up CONFIG 1 VPST Akf PF Hz 07 VAh 08 Shop for AEMC products online at: 22 www. PowerMeterStore .com Figure 4-3 1.877.766.5412 Power Quality Analyzer Model 8230 • Four recording set-ups are available. Choose recording CONFIG 1, 2, 3, or 4 by pressing enter, then use the ▲ button to select the desired configuration number. Press enter again to validate the selection. • Next, move through the choices with the ◄ and ► buttons and select the desired parameters with the ▲ and ▼ buttons. As you move through the parameters, each choice, in turn, will be highlighted. • button. To activate the highlighted parameter for recording, press the Enter The selected parameters will have a filled in and those not selected will have an unfilled . • There are two user-defined parameters at the bottom of the window. At first, they will be listed as a question mark “?”. These parameters allow you to monitor specific, or a range, of voltage, current or power harmonics. To activate the user-defined parameters: - Select the parameter with the ◄ ► buttons, press the Enter button and choose a value (VAh, Ah or Vh). Press Enter again to validate. - Once the desired parameter is selected, use the ► button to select the desired harmonic order. A value from 00 to 50 may be selected for this field using the ▲ and ▼ buttons. - After selecting the desired harmonic order for the beginning value, press the ► button to move to the upper value. Use the same process to select the upper limit. - Press the ► button again to move to the right to modify the last value needed to complete the definition. Here you will choose whether to include all harmonics or only the odd harmonics. - Use the ▲ and ▼ buttons to make this selection. The diamond preceding the Odd Only choice will appear filled in for selected and unfilled for not selected. Example of a user defined choice: Vh 02 → 15 Odd Only In this user defined condition, all odd voltage harmonics between the 2nd and the 15th will be recorded. • Press the enter button when you have finished selecting all the parameters to be recorded to apply the new setup. WARNING: The battery may fully discharge when recording for long periods of time if not connected to a power supply. The PowerPad® Jr. will continue to record for some time, even if below the minimum battery charge value. However, the display may not come back on, and will eventually stop saving data when the battery is too low. All data recorded will be saved. If in the Record Mode, and the display does not come ON, do not turn the instrument OFF. Supply power to the PowerPad® Jr. with the line cord and the display Shop for AEMC products online at: www. .com 1.877.766.5412 will come back ON when any button (other than ON/OFF) is pressed. PowerMeterStore Power Quality Analyzer Model 8230 23 4.1.3 Configuring the Alarm Settings Press the configuration button and select ALARMS. 07/25/02 02/25/0610:26 10:26 100% ALARMS 1 2 5 Hysteresis 10 % 1 ON Vrms < 210 V 01 s 2 ON Arms < 0020 A 02 s 3 ON Vcf > 0 8.0 % 01 s 4 ON Athd > 1 0.0 % 05 min 5 ON W > 1000 W 15 min 6 OFF ? 7 ON Vh > 0 5.0 % 10 min 6 8 7 9 10 3 4 Figure 4-4 A programmed alarm must be set to “ON” to function properly (general activation or deactivation of alarms is generated in the alarm mode). Modifying one or several characteristics of an alarm set to “ON”, automatically switches it to “OFF”. ITEM 1. FUNCTION Hysteresis Percentage (1, 2, 5 or 10%). A hysteresis value is set to prevent multiple recordings of an event that goes above the threshold and a certain percentage below it at times. Example: If the alarm threshold is 100V or higher, the hysteresis is 1%. When the voltage goes up to 100V, the alarm condition starts, when it goes back down to 99V, the alarm condition stops. 2. Alarm number (1 to 10) 3. Alarm activation (ON or OFF) 4. The target of the alarm (Vrms, Arms, VPST, Vcf, Acf, Hz, Akf, Vthd, Athd, W, VAR, VA, DPF, PF, Tan, Vh, Ah or VAh) 5. Threshold value for triggering an alarm 6. Minimum duration from beginning threshold detection to store the alarm (from 0.01 seconds to 99 minutes) 7. Less than “<” or greater than “>” NOTE: When the alarm is “OFF”, the parameters previously used are stored in .com 1.877.766.5412 is selected again. PowerMeterStore Shop for AEMC products onlineifat: memory and reappear thewww. alarm 24 Power Quality Analyzer Model 8230 CHAPTER 5 DISPLAY MODES The screen presentations in this section represent single phase setups for the purpose of explaining the various choices. Your actual screens will appear differently based upon your particular set up. 5.1 Waveform Mode Press the waveform display mode button This button is used to display the current and voltage curves and the measured values and values calculated from the voltages and currents (except power, energy and harmonics). V 2 3 02/25/06 10:26 49.99Hz 1 A RMS= 229.4V RMS= 7.0 V THD= 1.8% THD= 0.00% CF=1.37 CF=1.95 360V 20A 4 12 0 -20 -350 <t= 5.9ms V= +314 5 6 7 > I= +13 max min 1 11 2 3 8 9 10 Figure 5-1 Shop for AEMC products online at: www. PowerMeterStore.com Power Quality Analyzer Model 8230 1.877.766.5412 25 ITEM 1. FUNCTION Top display bar indicates: • Symbol of the activated mode • Frequency of measured signal • Memory capacity status bar (only available in certain modes) • Current date and time • Battery charge status (see § 7.1 for recharging instructions) 2. RMS: RMS AC values of the phase-to-earth voltage (600V max) or of the phase-tophase voltage (660V max) and of the current (6500A max). THD: Total harmonic distortion level. CF: Peak factors. 3. Instantaneous measurement cursor displayed by selection of the tool. The values appear just below the curves. The cursor is moved using the ◄ ► buttons. 4. Display of waveforms (voltage and current). 5. Axis of current and voltage values with automatic scaling. 6. Display of the waveforms of the RMS and THD values and the peak factor with time displacement cursor. 7. Maximum and Minimum values 8. Simultaneous display of the various measurements in alphanumeric form 9. Phase order 10. Online help 11. Instantaneous value of the signal at the intersection of the cursor and the curves. t: time since beginning of period. V: instantaneous value of the voltage. I: instantaneous value of the current. 12. Selection tools: Use ▲ and ▼ to select a tool. - Selection of the sub-menu -Instantaneous measurement cursor management tool on a point of the curve NOTE: In the case of a balanced three-phase connection, a 3φ symbol is displayed in the top bar of the screen. The measurements displayed are then measurements of the phase-to-phase voltage and the phase-to-earth current. Table of minimum scale values and minimum values displayed in the Waveforms mode. Type current sensor Minimum current displayed (A) AmpFlex® Sensors 9 MR193 1 SR193 0.5 MN93 0.5 MN193A 100A 0.2 MN193A 5A products online (Primary x 5) / (Secondary x 1000) Shop for AEMC at: www. Minimum scale value in current (A) 60 10 10 2 1 (Primary x 5 x 10 .com ) / (Secondary x 1000) PowerMeterStore 26 1.877.766.5412 Power Quality Analyzer Model 8230 5.1.1 Minimum and Maximum Values 02/25/06 10:26 49.99Hz V 1 A MAX 222.7 160.5 AVG 221.2 102.5 MIN 220.1 86.5 PEAK+ +300.2 +166.0 PEAK - –300.4 –168.3 max min 1 2 2 3 Figure 5-2 This function displays the maximum, minimum, and mean values (RMS over halfperiod) of the voltage and current, and those of the positive and negative instantaneous peaks of the voltage and current. ITEM 1. 2. FUNCTION Voltage and Current Values: MAX: True half-period RMS value of the AC voltage measured upon power up of the instrument or since the last selection of the tool. Calculation every halfperiod (e.g. every 10 ms for a 50Hz signal). AVG: True RMS voltage of the signal calculated over one second. MIN: True minimum half-period RMS value of the AC voltage measured upon power up of the instrument or since the last selection of the tool. Calculation every half-period (e.g. every 10 ms for a 50Hz signal). PEAK+: Positive instantaneous peak value of the waveform. PEAK–: Negative instantaneous peak value of the waveform. Selection tools: Use ▲ and ▼ to select a tool. - Selection of the sub-menu -Resets Max and Min values. Press the Enter button to display the new values. NOTE: The MAX and MIN measurements are calculated every half period (e.g. every 10ms for a 50Hz signal). The AVG measurements are calculated every second. However, the MAX, AVG and MIN measurements are refreshed every 250ms. Shop for AEMC products online at: www. PowerMeterStore.com Power Quality Analyzer Model 8230 1.877.766.5412 27 5.1.2 Simultaneous Display 02/25/06 10:26 49.99Hz RMS DC THD 1 V A 221.8 86.1 +0.1 38 % CF 1.35 PST 0.27 DF 61.4 % 2.31 4.69 KF 3.7 % max min 2 52.2 % 1 2 3 Figure 5-3 ITEM 1. 2. FUNCTION Column of voltage-related values. RMS: True RMS value calculated over 1 second. DC: Offset (DC component). THD: Level of total harmonic distortion (also called THD-F). CF: Peak factor calculated on the waveform displayed. PST: Short-term flicker (over 10 minutes). DF: Distortion factor (also called THD-R). Column of current-related values. RMS: RMS value calculated over 1 second (the RMS value of the current is true - with DC component - only with a MR193 sensor). THD: Level of total harmonic distortion (also called THD-F). CF: Peak factor calculated on the waveform displayed. DC: DC component of the current, with MR193 sensor only. KF: K factor. Gives an indication of the sum of the current harmonics and can help in choosing a transformer. DF: Distortion factor (also called THD-R). NOTE: DC current will be displayed, however the values are only valid when a current probe capable of measuring DC is used. The MR193 probe is available for this purpose. Shop for AEMC products online at: 28 www. PowerMeterStore.com 1.877.766.5412 Power Quality Analyzer Model 8230 5.1.3 Phase Rotation This display determines the phase order of a three-phase network in three steps. The order of the phases can be determined in either: • Single-phase • Balanced three-phase connection mode. STEP 1 • Connect the 2 voltage measurement cables to inputs Com and + of the PowerPad® Jr. and place the contact tips on the phases assumed to be L1 and L2. • The following display will appear: 02/25/06 10:26 1 2 3 PHASE ORDER Step 1 Plug Phase 1 into COM Input Plug Phase 2 into + Input L1 L2 L3 ( to continue) max min 1 2 3 Figure 5-4 • Press the Enter button. The screen will indicate that the measurement is in progress. Shop for AEMC products online at: www. PowerMeterStore.com Power Quality Analyzer Model 8230 1.877.766.5412 29 STEP 2 • The following display will appear: 02/25/06 10:26 1 PHASE ORDER 2 3 Step 2 Plug Phase 1 into COM Input Plug Phase 3 into + Input L1 L2 L3 ( to continue) max min 1 2 3 Figure 5-5 • Place the red contact tip on the phase assumed to be L3. Do not press any other button. • Wait for the result of the measurement. STEP 3 • The display will indicate the order of the phases (reverse or forward sequence). Reverse sequence: The phase assumed to be L3 leads the phase assumed to be L2, which itself leads the phase assumed to be L1. 02/25/06 10:26 1 2 3 PHASE ORDER RESULT INDIRECT Phase Order L3 ( L2 to continue) max min Shop for AEMC products online at: 30 L1 www. 1 2 3 PowerMeterStore .com Figure 5-6 1.877.766.5412 Power Quality Analyzer Model 8230 Forward sequence: The phase assumed to be L1 leads the phase assumed to be L2, which itself leads the phase assumed to be L3. 02/25/06 10:26 1 2 3 PHASE ORDER RESULT DIRECT Phase Order L1 ( L2 L3 to continue) max min 1 2 3 Figure 5-7 Error Messages If the measurement is not possible, a warning message is displayed. • Waiting time exceeded • Frequency out of Range (40-70Hz) and Signal too Small (Vrms<10V) Shop for AEMC products online at: www. PowerMeterStore.com Power Quality Analyzer Model 8230 1.877.766.5412 31 5.2 Power / Energy Mode Press the Power/Energy button This display shows the active power, reactive powers (capacitive or inductive), and the apparent power. 5.2.1 Starting and Stopping Energy Totalization 02/25/06 10:26 50.01Hz 1 02/25/06 10:49:21 +13.84 kW Wh 2 02/25/06 10:55:08 PF +0.663 DPF +0.761 Tan +0.853 0000203 kVAR VARh 11.64 0000242 0000000 20.86 kVA VAh 0000554 C G 3 4 VA 6 +040° 5 Figure 5-8 ITEM 1. FUNCTION Start and stop date and time of energy totalization. 2. W: Active power Wh: Active energy consumed VAR: Reactive power: - Inductive - Capacitive VARh: Reactive energy consumed - Inductive - Capacitive VA: Apparent power VAh: Apparent energy consumed PF: Power factor (ratio of active power to apparent power) DPF: Displacement factor (cosine of φ) Tan: Tangent of angle φ : Phase shift of the phase-to-earth voltage with respect to the phase-to-earth Shop for AEMC products online at: www. .com 1.877.766.5412 current. PowerMeterStore 32 Power Quality Analyzer Model 8230 3. Display of energies consumed. 4. Display of energies generated. 5. Online help. 6. Selection tools: Use ▲ and ▼ to select a tool. - Selection of the sub-menu. -Select this tool, then press enter to start energy totalization. -Select this tool, then press enter to stop energy totalization. (All eight energy meters are stopped) -Select this tool, then press enter to reset the totalization. (All energy values are reset, including the energies generated) NOTE: In the case of a balanced three-phase connection (selection in Configuration of Connection / Balanced three-phase), a 3 φ symbol is displayed in the top bar of the screen. The energies and powers displayed are then the total energies and powers of the balanced three-phase network. The other measurements are unchanged. Four Quadrant Power Diagram: +VAR 2 1 Reactive Power - from supply -W Reactive Power - from load 3 Produced +W 4 -VAR Consumed Figure 5-9 Shop for AEMC products online at: www. PowerMeterStore.com Power Quality Analyzer Model 8230 1.877.766.5412 33 5.3 Harmonics Mode 5.3.1 Voltage (V) 02/25/06 10:26 49.99Hz 1 Vh 01 100.0 % 228.1 v THD max 100.0% min 100.0% +000° 1.8 % % 100 4 2 50 1 V 3 5 A 7 9 11 13 15 17 19 21 23 25 VA V -,+ A -,+ 3 Figure 5-10 ITEM 1. FUNCTION This information concerns the harmonic located under the cursor. Vh xx: Number of the harmonic. %: Level of the harmonic with respect to the fundamental (order 1). v: RMS voltage of the harmonic in question. +000: Phase shift with respect to the fundamental (order 1). Max/Min: Indicators of the maximum and minimum of the level of the harmonic in question (reset at each change of harmonic number). THD: Total harmonic distortion (also called THD-F). 2. The horizontal axis indicates the orders of the harmonics. Display of the levels of the harmonics as a percentage with respect to the fundamental (order 1). Order 0: DC component. Order (1 to 25): order of the harmonics. As soon as the cursor goes past order 25, the range from 26 to 50 appears. Note: The ► icon to the right of harmonic 25 indicates the presence of harmonics of order higher than 25. 3. Analysis of the voltage harmonics 4. Selection tools: Use ▲ and ▼ to select a tool. - Selection of the sub-menu -Zoom-Out tool. Each press on the Enter button increases the vertical scale. PowerMeterStore on the Enter button decreases the.com vertical1.877.766.5412 scale. Shop for AEMC products onlinetool. at: Each www. -Zoom-In press 34 Power Quality Analyzer Model 8230 5.3.2 Current (A) 02/25/06 10:26 49.99Hz 1 Ah 01 100.0 % 4.9 A +000° THD 62.2% max 100.0% min 100.0% % 100 2 50 1 3 V 5 7 A 9 11 13 15 17 19 21 23 25 VA V -,+ A -,+ 3 Figure 5-11 ITEM 1. FUNCTION This information concerns the harmonic located under the cursor. Ah xx: Number of the harmonic. %: Level of the harmonic with respect to the fundamental (order 1). v: RMS current of the harmonic in question. +000: Phase shift with respect to the fundamental (order 1). Max/Min: Indicators of the maximum and minimum of the level of the harmonic in question (reset at each change of harmonic number). THD: Total harmonic distortion (also called THD-F). 2. The horizontal axis indicates the orders of the harmonics. Display of the levels of the harmonics as a percentage with respect to the fundamental (order 1). Order 0: DC component. Order (1 to 25): order of the harmonics. As soon as the cursor goes past order 25, the range from 26 to 50 appears. Note: The ► icon to the right of harmonic 25 indicates the presence of harmonics of order higher than 25. 3. Analysis of the current harmonics. Shop for AEMC products online at: www. PowerMeterStore.com Power Quality Analyzer Model 8230 1.877.766.5412 35 5.3.3 Apparent Power (VA) 02/25/06 10:26 49.99Hz 1 VAh01 100.0 % +030 ° min 100.0 % % 100 max 100.0 % 2 0 -100 1 V 3 5 7 A 9 11 13 15 17 19 21 23 25 VA V -,+ A -,+ 3 Figure 5-12 ITEM 1. FUNCTION This information concerns the harmonic located under the cursor. VAh xx: Number of the harmonic. %: Level of the harmonic with respect to the fundamental (order 1). +030: Phase shift of the voltage harmonic with respect to the current harmonic for the order in question. Max/Min: Indicators of the maximum and minimum of the level of the harmonic in question (reset at each change of harmonic number). 2. The horizontal axis indicates the orders of the harmonics. (the bars of the chart that are above the horizontal axis represent harmonic power consumed, while those below it represent harmonic power generated). Display of the levels of the harmonics as a percentage with respect to the fundamental (order 1). Order 0: DC component (with MR193 only) Order (1 to 25): order of the harmonics. As soon as the cursor goes past order 25, the range from 26 to 50 appears. Note: The ► icon to the right of harmonic 25 indicates the presence of harmonics of order higher than 25. 3. Analysis of the apparent power harmonics* *Not available with a balanced three-phase connection. Shop for AEMC products online at: 36 www. PowerMeterStore.com 1.877.766.5412 Power Quality Analyzer Model 8230 5.3.4 Voltage Expert Mode For a single-phase connection, this mode displays the Voltage expert mode. 02/25/06 10:26 49.99Hz Vh 1 02 05 08 11 14 17 20 23 03 06 09 12 15 18 21 24 0 0.5 % V 04 07 10 13 16 19 22 25 0.4 % A VA V -,+ 0.4 % A -,+ 2 Figure 5-13 ITEM 1. 2. FUNCTION This information concerns the following elements: -: “negative” sequence. 0: “zero” sequence. +: “positive” sequence. %: Sums of the levels of “voltage” harmonics classified by sequence (“negative” to the left, “zero” in the centre, and “positive” to the right). See NOTE. Sequences of voltage harmonics* *Not available with a balanced three-phase connection. NOTE: the effects of the sequences are the following: "Negative" sequence • Overheating of rotating machine. • Loss of torque. • Mechanical oscillations. • Higher current draw for a given load. • Premature ageing of rotating machine. "Zero" sequence • Overheating of rotating machine. • Higher current draw for a given load. • Overload of the neutral. Shop for AEMC products online at: www. • Premature ageing of rotating machine. PowerMeterStore.com Power Quality Analyzer Model 8230 1.877.766.5412 37 5.3.5 Current Expert Mode For a single-phase connection, this mode displays the Current expert mode. 02/25/06 10:26 49.99Hz Ah 1 02 05 08 11 14 17 20 23 03 06 09 12 15 18 21 24 0 0.5 % V 04 07 10 13 16 19 22 25 0.4 % A VA 0.4 % V -,+ A -,+ 2 Figure 5-14 ITEM 1. 2. FUNCTION This information concerns the following elements: -: “negative” sequence. 0: “zero” sequence. +: “positive” sequence. %: Sums of the levels of “voltage” harmonics classified by sequence (“negative” to the left, “zero” in the centre, and “positive” to the right). See NOTE. Sequences of current harmonics* *Not available with a balanced three-phase connection. NOTE: The effects of the sequences are the following: "Negative" sequence • Overheating of rotating machine. • Loss of torque. • Mechanical oscillations. • Higher current draw for a given load. • Premature ageing of rotating machine. "Zero" sequence • Overheating of rotating machine. • Higher current draw for a given load. • Overload of the neutral. Shop for AEMC products online at: www. • Premature ageing of rotating machine. PowerMeterStore.com 38 1.877.766.5412 Power Quality Analyzer Model 8230 5.4 Snapshot Mode This button allows 8 snapshots to be saved for future recall and evaluation. From any active function, press the Snapshot stored snapshots. button to display a list of 1 02/25/06 10:26 2 02/17/06 11:27 02/17/06 11:28 02/17/06 12:08 02/17/06 12:20 02/17/06 12:30 02/17/06 12:48 3 4 Figure 5-15 ITEM 1. FUNCTION Available memory indicator. The black area of the status bar indicates amount of memory used. 2. List of saved snapshots: Each icon indicates the type of screen stored (recording, alarm, waveforms, etc.) and the date and time of the snapshot. 3. Opens a saved snapshot. 4. Deletes a saved snapshot. Shop for AEMC products online at: www. PowerMeterStore.com Power Quality Analyzer Model 8230 1.877.766.5412 39 5.4.1 Taking a Snapshot of a Display • Press the button (for approx 2s) to capture the current display. • The icon is displayed in the top left corner as soon as the operation is successful. This icon is replaced by if there is no space left in the memory to record the display. NOTE: These screens can be downloaded to a computer using the Data View® software. 5.4.2 Opening and Deleting a Previously Saved Snapshot A short press (about 1s) on the that have been saved. button gives access to the menu of snapshots The small icon to the left of each snapshot (date and time) indicates the type of data stored. To open a saved snapshot: • • • • Make sure the function is selected. Select the snapshot to be displayed using the ◄ and ► buttons. Press the Enter button to display the snapshot. After reviewing the snapshot, press the Enter button again to return to the list of saved snapshots. To delete a saved snapshot: • Select the button. function using the ◄ and ► buttons., then press the Enter • Select the snapshot to be deleted. • Press the Enter button to delete. Shop for AEMC products online at: 40 www. PowerMeterStore.com 1.877.766.5412 Power Quality Analyzer Model 8230 5.5 Alarm Mode Press the alarm display mode button This mode detects crossings of the thresholds of the values (Vrms, Arms, VPST, Vcf, Acf, Hz, Akf, Vthd, Athd, W, VAR, VA, DPF, PF, Tan, Vh, Ah and VAh). The stored alarms can then be transferred to a PC using the DataView software (see § 6). NOTE: The threshold values must first be programmed in the Set-up mode. Also, the alarm event or alarm capture, must end before an alarm will be displayed. 1 02/25/06 10:26 CAPTURE ALARMS 2 Start :02/17/06 11:27 Stop :02/17/06 11:28 OK 3 4 5 Figure 5-16 ITEM 1. FUNCTION Available memory indicator. The black stripe represents the memory already in use, the white stripe the memory still available. 2. Starting and ending times of an alarm. 3. Displays the alarms log. 4. Programs the recording of detected alarms. 5. Erases the alarms log. Shop for AEMC products online at: www. PowerMeterStore.com Power Quality Analyzer Model 8230 1.877.766.5412 41 5.5.1 Programming and Starting Alarms Select the icon with the ◄► buttons. To program the starting and stopping times: 1. With the Start field highlighted in yellow, press the Enter button to define the starting date and time of the alarms. • Use the ▲▼ buttons to increment or decrement a value and ◄► to move to the adjacent item. • Press the Enter button once the programming of the Start is completed. 2. Select the Stop field using the ▼ button and press Enter to define the ending date and time of the alarms. • Use the ▲▼ buttons to increment or decrement a value and ◄► to move to the adjacent item. • Press the Enter button once the programming of the Stop is completed. 3. Press the ▼ button again to highlight OK in yellow, then press Enter. 4. The message “Waiting to start search” will display on the screen. At the starting time, the bottom of the screen displays “Search in progress”. 5. At the stop time, the OK button is displayed again highlighted in yellow. NOTE: To stop the alarm recording before the stop time occurs, select the Hand tool by pressing the ▼ button and then the Enter button. 5.5.2 Displaying the Alarms Log 1 02/25/06 10:26 2 OPEN ALARM LOG 02/25/06 11:27 11:28 11:29 Vthd Vrms Vthd Vthd Arms Arms Arms Arms Arms Vrms (1/2) Min Min Min Max Max Min Min Min Min Min 23.1% 0V 34.3% 35.0% 1A 1A 0A 0A 0A 109V 5 3 Shop for AEMC products online at: 42 4 2s 1 s 1s24 100 1s 1s 1 s 1s5 100 1 1s3 100 s 1 s 1s9 100 1 s 1s9 100 1 s 1s8 100 1 s 3s37 100 www. PowerMeterStore .com Figure 5-17 1.877.766.5412 Power Quality Analyzer Model 8230 ITEM 1. FUNCTION Available memory indicator. The black stripe represents the memory already in use, the white stripe the memory still available. 2. Date and time of the alarm. 3. Measurement parameter monitored. 4. Maximum or minimum amplitude detected (Values in W, VAR, PF, DPF and Tan φ are recorded in absolute value). 5. Alarm Duration To display the alarms log, select the icon with the ◄ button. Use the ▲▼ buttons to move through the alarms. NOTE: All the alarms recorded can be downloaded to a PC with the DataView® software (see § 6). Up to 4096 alarms can be captured. 5.5.3 Deleting the Alarms Log To erase the entire alarms log: 1. Select the icon using the ◄► buttons. 2. Select Yes using the ▲▼ buttons, then press the Enter button. This will delete all logs. 3. To exit without deleting, press No and then the Enter button. Shop for AEMC products online at: www. PowerMeterStore.com Power Quality Analyzer Model 8230 1.877.766.5412 43 5.6 Recording Mode After a recording is set, the instrument will go into sleep mode (no display) to save the batteries. The recording will start as programmed. Press any button other than the ON/OFF button to turn ON the display again. Turning off the PowerPad® Jr. clears the schedule, even if turned on again, the recording will not start. This mode enables all the parameters previously configured in the setup to be recorded. mode Press the Record mode button 1 02/25/06 10:26 NEW RECORDING Set-up 2 : CONFIG 1 Start : 02/25/06 10:56 Stop : 02/25/06 10:57 Period : 10 min Name :TEST1 OK 3 4 5 6 Figure 5-18 ITEM 1. FUNCTION Representing the time already elapsed (black zone) with respect to the total time (white zone) of the recording in progress 2. Sets the configuration for a new recording (see § 5.6.1) 3. Displays a recording. 4. Configures and starts a recording. 5. Deletes a recording. 6. Inrush mode (see § 5.7) Shop for AEMC products online at: 44 www. PowerMeterStore.com 1.877.766.5412 Power Quality Analyzer Model 8230 5.6.1 Starting a Recording Select the icon with the ◄► buttons. 1. Select the Configuration to be used by pressing the Enter button. Then use the ▲▼ buttons and press the Enter button to validate. NOTE: Configurations CONFIG 1 to CONFIG 4 were defined in § 4.1.1 Configura tion / Recording set-up. 2. Select Start using ▼. Press Enter to define the starting date and time of the recording campaign. Use the ▲▼ buttons to increment or decrement a value and ◄► to move to an adjacent item. Press the Enter button once the programming of the Start is completed. 3. Set the Stop date the same way as the Start time in step 2. 4. Select the Period field using ▼. Press Enter to define the duration of integration of the records of the campaign. Use the ▲▼ buttons to increment or decrement the possible values (1s, 5s, 20s, 1mn, 2mn, 5mn, 10mn, or 15mn). Press Enter to validate. NOTE: The recording integration period is the time over which the measure ments of each value recorded will be averaged. 5.Press ▼ again to highlight the Name zone in yellow and press Enter to enter the edit mode. Enter the name of the record, for example TEST1. Several records may have the same name. Use the ▲▼ buttons to display a character and ◄► to move to an adjacent character. Press Enter once the programming of the Name is complete. 6. Press ▼ to reach the OK zone. Press Enter to start the recording. NOTE: The PowerPad® Jr. will calculate the storage needs of the recording, and if necessary, will display the message “Not enough memory”. The message “Waiting to record” will display on the screen until the date and time matches the programmed date and time. The bottom of the screen then indicates “Recording in progress”. NOTE: To stop the recording before the stop time occurs (with no possibility of resumption), select the Hand tool by pressing the ▼ button and then the Enter button. Shop for AEMC products online at: www. .com 1.877.766.5412 PowerMeterStore Power Quality Analyzer Model 8230 45 5.6.2 Selecting a Recording The status bar at the top displays the memory occupied by previous records. To Select a Recording: • Select the icon with the ◄ button. The screen displays the various stored recordings. NOTE: If the “@” symbol appears as the first letter of the recording name (e.g. @ EST), the data may be corrupted and should be checked carefully. • Select the desired recording using the ▲▼ buttons, then press the Enter button. • Next, select the measurement recording to be displayed using the ▲▼ buttons and then press the Enter button. The corresponding screen will display. • Return to the previous screen by selecting the tool must be selected). button (the icon with the ◄ NOTE: It is possible to return to any mode by pressing the corresponding mode button (e.g. , , , etc.) 5.6.3 Deleting a Recording To Delete a Recording: • Select the display. icon with the ◄► buttons. The erase recording screen will • Select the recording to be deleted, then press the Enter button. NOTE: The deletion of the record may take a few seconds to complete. Shop for AEMC products online at: 46 www. PowerMeterStore.com 1.877.766.5412 Power Quality Analyzer Model 8230 5.6.4 Examples of Recordings VOLTAGE (Vrms) 02/25/06 10:26 1 02/25/06 15:25:00 228.7 < 229.4 v < 230.5 2 240.0V 3 230.0V 220.0V min> 0 10 20 30 40 50 0 Vrms 4 5 Figure 5-19 ITEM 1. FUNCTION Date and time corresponding to the position of the time cursor. 2. Minimum, mean, and maximum measurements recorded in the display integration period corresponding to the position of the cursor. Note: For VRMS and ARMS only, the minimum and maximum values correspond to the RMS values for a half-period. tool is A long press on the ◄ or ► button causes a shift to rapid motion if the selected. 3. Time cursor - moves by using the ◄ or ► button when the 4. Returns to the previous screen. 5. Type of measurement displayed. tool is selected. NOTE: The Current measurement display reveals the same information as above except in Current instead of Voltage. Shop for AEMC products online at: www. PowerMeterStore.com Power Quality Analyzer Model 8230 1.877.766.5412 47 ACTIVE POWER (W) 02/25/06 10:26 1 02/25/06 15:25:00 +1.578 2 kW +1.6k +0.90k +0.20k min> 10 11 12 W Wh 13 14 15 Figure 5-20 ITEM 1. 2. FUNCTION Date and time corresponding to the position of the time cursor. Mean value in the active power display integration period corresponding to the position of the cursor. tool is A long press on the ◄ or ► button causes a shift to rapid motion if the selected. ENERGY IN SPECIFIED DURATION (Wh) 02/25/06 10:26 1 02/25/06 15:25:00 02/25/06 15:28:00 +4.4 Wh 2 +1.0k +0.78k +0.56k 3> 0 Shop for AEMC products online at: 48 10 20 W Wh www. 30 40 0 PowerMeterStore .com Figure 5-21 1.877.766.5412 Power Quality Analyzer Model 8230 ITEM 1. 2. FUNCTION Starting and ending dates and times of the energy calculation. Value of the energy from the starting date and time up to the cursor position (date and time of end of calculation). tool is A long press on the ◄ or ► button causes a shift to rapid motion if the selected. • tool selected, set the starting date/time of the energy metering With the using the ◄ or ► buttons. • tool selected, select the Wh icon. The screen displays the recordWith the ing relevant to the energy measurement. The starting and ending dates are identical. • Select the • Move the time cursor using the ◄ or ► buttons. The energy between the starting date and time and the time cursor (ending date and time) is displayed. In addition, the corresponding bars of the bar chart turn grey. tool again. The time cursor is now activated. NOTE: All of the data in a recording session can be downloaded to a com puter using the DataView® software. The and tools allow the integration period of the displayed measurement and the graph time-scale to be changed. Display Averaging Period Shop for AEMC products online at: Graph Scale 2 hours over 5 days 1 hour over 2 1/2 days 15 minutes over 15 hours 10 minutes over 10 hours 5 minutes over 5 hours 1 minute over 1 hour 20 seconds over 20 minutes 5 seconds over 5 minutes 1 second over 1 minute www. PowerMeterStore.com Power Quality Analyzer Model 8230 1.877.766.5412 49 5.7 Inrush Mode (starting current) This mode is used to record the waveform of the current on 229,376 samples, at 256 samples per period (17.92s of recording for a 50Hz signal). Recording is triggered automatically when the starting of a motor is detected. The beginning of the motor starting search can be triggered in delayed mode (starting date and time programmed by the user). The search can be stopped manually if desired. Once the recording has been done, the PowerPad® Jr. displays the waveform of the current. The user can then move along the curve using a cursor and zoom in on features of interest. The following information is available: • Instantaneous value of the current at the time indicated by the cursor. • Maximum instantaneous value of the current (over the entire start). • RMS value of the half-period (or lobe) of the current on which the cursor is placed. • Maximum half-period RMS value of the current (over the entire start). • Starting time and duration of the starting of the motor. WARNING: The voltage must be present before the motor is switched ON in order to have a stable and correct frequency synchronization. 5.7.1 Starting an Inrush Recording 1. Select the Inrush icon from the recording display using the ► button. 2. Select the New Inrush line and press Enter. 02/25/06 10:26 INRUSH MODE Open last Inrush New Inrush Shop for AEMC products online at: www. PowerMeterStore.com Figure 5-22 50 1.877.766.5412 Power Quality Analyzer Model 8230 3. Define the measurement values, then press the Enter button. 02/25/06 10:26 NEW INRUSH Start Threshold : 0100Arms Hysteresis : 2% Start : 02/25/06 15:20 OK Figure 5-23 Use the ▲▼ buttons to select a field, press Enter to enter the field, ▲▼ to increment or decrement the value in the field, ◄► to go from one selection to the other inside the field, and press Enter to exit from the edit mode. • Start Threshold: defines the threshold beyond which recording will be affected. (Note: The triggering and stopping thresholds are half-period RMS current values.) • Hysteresis: determines, with the triggering threshold, the stopping threshold of Inrush recording. With a hysteresis of 2% and a triggering threshold of 1000ARMS, the stopping threshold will be 980ARMS. (Note: When the stopping threshold is not detected, recording continues until the memory is full. The maximum value is 5999ARMS.) • Start: defines the date and time in which the recording will be done. 4. Select OK and press Enter to validate. The message “Waiting for triggering threshold” will display at the bottom of the screen. When the triggering threshold is reached, the current measurements Inrush will be recorded. Recording will stop when the stopping threshold is reached. NOTE: To stop the recording at any time, select the Hand tool ( the ▼ button and then the Enter button. Shop for AEMC products online at: www. PowerMeterStore.com Power Quality Analyzer Model 8230 ) by pressing 1.877.766.5412 51 5.7.2 Viewing the Inrush Recording 1. From the main Inrush mode display, select Open last Inrush and press Enter. This will display the Open Inrush screen. 2. Press Enter one more time and the waveform of the recording is displayed. If the stopping threshold is not detected, the message “Stopping threshold not detected” will be displayed. NOTE: Use the Zoom tools waveform. Shop for AEMC products online at: 52 www. at any time to zoom in or out of part of the PowerMeterStore.com 1.877.766.5412 Power Quality Analyzer Model 8230 CHAPTER 6 DATAVIEW® SOFTWARE 6.1 Installing DataView® DO NOT CONNECT THE INSTRUMENT TO THE PC BEFORE INSTALLING THE SOFTWARE AND DRIVERS. Minimum Computer Requirements: • Windows XP / Windows Vista & Windows 7/8 (32/64 bit) • 256MB of RAM for Windows XP 1GB of RAM for Windows Vista & Windows 7/8 (32 bit) 2GB or RAM for Windows Vista & Windows 7/8 (64 bit) • 80MB of hard disk space (200MB recommended) • USB port Windows is a registered trademark of Microsoft Corporation in the United States and other countries. NOTE: When installing, the user must have Administrative access rights during the installation. The users access rights can be changed after the installation is complete. DataView® must be reinstalled for each user in a multi-user system. USB Flash Drive Install 1. Insert the USB stick into an available USB port (wait for driver to be installed). 2. If Autorun is enabled then an AutoPlay window should appear as shown. Shop for AEMC products online at: www. PowerMeterStore.com Power Quality Analyzer Model 8230 1.877.766.5412 53 2. A Set-up window, similar to the one below, will appear. Figure 6-1 There are several different options to choose from. Some options(*) require an internet connection. • DataView, Version x.xx.xxxx - Installs DataView® onto the PC. • *Adobe Reader - Links to the Adobe® website to download the most recent version of Adobe® Reader to the computer. Adobe® Reader is required for viewing PDF documents supplied with DataView® that are accessible from the Help menu. • *DataView Updates - Links to the online AEMC® software updates to check for new software version releases. • *Firmware Upgrades - Links to the online AEMC® firmware updates to check for new firmware version releases. • Documents - Shows a list of instrument related documents that you can view. Adobe® Reader is required for viewing PDF documents supplied with DataView®. 3. DataView, Version x.xx.xxxx option should be selected by default. Select the desired language and then click on Install. 4.The Installation Wizard window will appear. Click Next. 5. To proceed, accept the terms of the license agreement and click Next. 6. In the Customer Information window, enter a Name and Company, then click Shop for AEMC products online at: Next. 54 www. PowerMeterStore.com 1.877.766.5412 Power Quality Analyzer Model 8230 7. In the Setup Type window that appears, select the “Complete” radio button option, then click Next. 8. In the Select Features window that appears, deselect the instrument’s control panel that you do not want to install, then click Next. NOTE: The PDF-XChange option must be selected to be able to generate PDF reports from within DataView®. Figure 6-2 9. In the Ready to Install the Program window, click on Install. 10. If the instrument selected for installation requires the use of a USB port, a warning box will appear, similar to Figure 6-3. Click OK. Shop for AEMC products online at: www. Figure 6-3 PowerMeterStore.com Power Quality Analyzer Model 8230 1.877.766.5412 55 NOTE: The installation of the drivers may take a few moments. Windows may even indicate that it is not responding, however it is running. Please wait for it to finish. 11. When the drivers are finished installing, the Installation Successful dialog box will appear. Click on OK. 12. Next, the Installation Wizard Complete window will appear. Click on Finish. 13.A Question dialog box appears next. Click Yes to read the procedure for connecting the instrument to the USB port on the computer. NOTE: The Set-up window remains open. You may now select another option to download (e.g. Adobe® Reader), or close the window. 14. Restart your computer, then connect the instrument to the computer. 15. Once connected, the Found New Hardware dialog box will appear. Windows will complete the driver installation process automatically. Shortcuts for DataView® and each instrument control panel selected during the installation process have been added to your desktop. NOTE: If you connected your instrument to the computer before installing the software and drivers, you may need to use the Add/Remove Hardware utility to remove the instrument driver before repeating the process. 6.2 Connecting the Model 8230 to your Computer The Model 8230 is supplied with an optically isolated USB interface cable required for connecting the instrument to the computer. This cable (Cat. #2135.41) is equipped with a USB type A on one end, and an optical connector on the other end. To connect the Model 8230 to your computer: 1. Connect the optical connector end of the cable to the serial port on the side panel of the Model 8230 (see Figure 2-1, item 8) 2. Connect the USB type A end of the cable to an available USB port on your computer. You are now ready to use the DataView® software with the 8230. Shop for AEMC products online at: 56 www. PowerMeterStore.com 1.877.766.5412 Power Quality Analyzer Model 8230 6.3 Opening the Control Panel To open the Power Analyzer Control Panel: • Double-click the PowerPad Icon that was created during installation, located on the desktop. • The Connection window will appear: Figure 6-4 Make sure that the communication port displayed in the dialog box matches the port that the serial cable is plugged into. Once the proper communication parameters have been specified, click OK. NOTE: The communication rate is determined automatically by DataView® and the 8230 (maximum rate is 115.2 kbps). When a communication link is established, DataView® will automatically identify the instrument that it is connected to. Shop for AEMC products online at: www. PowerMeterStore.com Power Quality Analyzer Model 8230 1.877.766.5412 57 Figure 6-5 A status screen will then appear showing: • The status of PowerPad® Jr. on the left-hand side • The communications port and speed of the connection • The model number, serial number, and firmware revision • The battery charge level, whether the battery is charging or discharging, and the time read from the instrument’s clock • If a recording is in progress and when it is scheduled to end • If a delayed recording is scheduled and when it is scheduled to begin • Real-time waveforms and trend information from the PowerPad® Jr. If the indicated items are not shown on the screen, select Restore Default Layout from the Window menu. NOTE: If the battery charge is shown to be unknown, plug the PowerPad® Jr. into AC Power, when it reaches 100% charge, the display should again be able to show the battery charge. Shop for AEMC products online at: 58 www. PowerMeterStore.com 1.877.766.5412 Power Quality Analyzer Model 8230 6.3.1 General Functions The buttons described below appear on several DataView® Setup screens. • Re-Read from Instrument: Reads the current configuration of the PowerPad® Jr. attached via the serial cable. • Save to File: Saves the current configuration. This file will reside on the computer’s disk drive. Saving different configuration setups can be useful for future functions and tests. • Load from File: Retrieves a saved file from the computer’s disk drive to be used in programming the PowerPad® Jr. • OK: Closes the dialog box and brings up the Control Panel. • Cancel: Exits without saving configuration. • Apply: Programs the PowerPad® Jr. using the current settings without closing the window. • Help: Opens the online Help. 6.3.2 Set-up Configuration The Configure the instrument dialog box (Fig. 6-6) lets you configure every aspect of the Model 8230 PowerPad® Jr. Each field is identical to the programmable features available from the instrument’s front panel itself. Several of the functions are configured by typing the appropriate value in the field provided. Others are configured by clicking on the appropriate radio button or Icon, such as, selecting the current probe. Shop for AEMC products online at: www. PowerMeterStore .com Figure 6-6 Power Quality Analyzer Model 8230 1.877.766.5412 59 The Configure the Instrument dialog box consists of the following features: • Reactive Values Calculation: With or without harmonics. Applies to VAR calculation. • Nominal Frequency: 50 or 60Hz (displays last detected frequency). • Current Sensors: MN93, MN193, SR193, MR193, AmpFlex® A193, MiniFlex® or Adapter (used to accept probes with other ratios or a direct 1 Amp or 5 Amp input). Probes displayed are automatically detected by the instrument. (See § 4.1.1 for configuration of the MN193 and Adapter box). • Connection Type: Single-Phase or 3-Phase balanced. • Voltage Transformer Ratio: Sets the scale for voltage measurement in cases where measurements are on the secondary side of a transformer and the primary value needs to be displayed. Data is saved on the PC, but not written to the instrument. • Set Instrument’s Clock: Programs the date and time into the instrument. 6.3.3 Instrument Display Configuration The PowerPad® Jr. Instrument Display window allows you to customize the display (colors, clock, date, language and contrast). Figure 6-7 NOTE: For detailed instructions and descriptions for any feature in a dialog box, click on the Help Button (lower right-side of the dialog box), or right-click on Shop for AEMC products online at: www. .com 1.877.766.5412 the feature you want information about. PowerMeterStore 60 Power Quality Analyzer Model 8230 6.3.4 Alarm Conditions Configuration The Alarm Conditions window allows you to set up 10 alarm configurations. Figure 6-8 Hysteresis: This value for alarms is set to prevent multiple recordings of an event that goes above the threshold and a certain percentage below it at times. Example: If the alarm threshold is 100V or higher, hysteresis is 1%. When the voltage goes up to 100V, the alarm condition starts. When it goes back down to 99V, the alarm condition stops. Schedule Alarm Search: When this check box is checked, an alarm is ready to be scheduled. Once checked, the End Alarm Search button will appear. End Alarm Search: This button will stop all alarms in progress. Capture Parameter: The alarm will be triggered based on the value of the selected parameter. Choices include: • None: no alarm • Vrms: voltage root mean squared • Arms: current root mean squared • VPST: voltage short term flicker • Vcf: voltage crest factor Acf:products currentonline crest Shop for•AEMC at:factor www. • • • • • Hz: frequency Akf: current K factor Vthd: voltage total harmonic distortion Athd: current total harmonic distortion W: active power PowerMeterStore.com Power Quality Analyzer Model 8230 1.877.766.5412 61 Once a parameter is selected, a threshold window will open allowing you to set the trigger value. Duration: The alarm will only be recorded if the duration of the parameter meeting the threshold criteria exceeds the duration. The minimum alarm duration can be in minutes or seconds. In the case of Vrms or Arms not using neutral current, can also be in hundredths of a second. For Vrms and Arms, it can be useful to set a duration of 0 seconds. In that case an event as short as a half cycle can be detected (8 milliseconds at 60Hz). For all other parameters, the minimum duration that can be detected is 1 second. NOTE: It is possible to check for alarms, records and search for transients at the same time. 6.3.5 Recordings Configuration The Recording window shows the dialog box used to configure the parameters for a recording session. Figure 6-9 Four different configurations are available. More configurations can be saved by pressing “Save to File” and recalled later by pressing “Load From File”. PowerMeterStore.com 1. Check the configuration you wish to set up: 1, 2, 3 or 4. Shop for AEMC products online at: 62 www. 1.877.766.5412 Power Quality Analyzer Model 8230 2. Check all the parameters you wish to record by clicking on each one. 3. Configure the harmonic values to be recorded, if desired. It is also possible to record up to 2 of 3 types of harmonic data, voltage (Vh), current (Ah) and power (VAh). For each selected harmonic data type, you can choose a range of harmonics to record from the 1st to 50th. You can further limit that range to only include odd numbers by checking the box for “Odd Harmonics Only”. End Recording: Ends any recording in progress or any future recording. Clear Entries: Clears the data entered in the new recording window. It does not cause any changes to the PowerPad® Jr. Write Changes and Start New Recording: Causes the PowerPad® Jr. to schedule a new recording. NOTE: The PowerPad® Jr. loses its scheduled memory if it is powered off before the recording begins. If it is powered off during the recording, a partial recording will usually still exist but with the first letter of its name changed to “@”. The start and end times requested for the recording might be adjusted by the PowerPad® Jr. to be in even multiples of the averaging period. For instance, if an integration period of 10 minutes were requested, and the start time was 9:03, the recording might not actually begin until 9:10. If OK or Apply is pressed, the following screen appears: Figure 6-10 Select Yes to schedule a recording, select No to bring you back to the Configure dialog box without starting a recording. Shop for AEMC products online at: www. PowerMeterStore.com Power Quality Analyzer Model 8230 1.877.766.5412 63 6.3.6 Inrush Configuration (See § 5.7) The Inrush window allows you to set up the criteria for capturing a motor inrush. Figure 6-11 1. Select the date and time to start the search for an inrush. 2. Select the start threshold for current RMS. The inrush recording begins when the ARMS threshold is reached. 4. Select the hysteresis percentage for ending the inrush capture. The inrush recording ends when the current is below the threshold minus the hysteresis percentage, or when the maximum number of datapoints have been captured. Write Changes and Start New Inrush Search: Initiates searching for an Inrush when the OK or Apply button is pressed. Shop for AEMC products online at: 64 www. PowerMeterStore.com 1.877.766.5412 Power Quality Analyzer Model 8230 6.3.7Monitoring The EN50160 standard defines limiting values and permissible variations of the voltage quality for the European Community. It defines which parameters are relevant, and how are they measured. Continuous or random sampling control of the voltage quality provides the supplier of electric energy with a reliable basis when dealing with network problems, and it contributes to quality assurance. The purpose of the EN50160 standard “Voltage characteristics of electricity supplied by public distribution systems” is to specify the characteristics of the supply voltage with regard to the course of the curve, the voltage level, the frequency and symmetry of the three phase-network at the interconnecting point to the customer. The goal is to determine limiting values for regular operating conditions. However, facility defects may lead to major disturbances in the electricity distribution supply network. Accordingly, the standard establishes these values as limiting values, which are not allowed to be exceeded on the high or low side during 95% of the controlled period, typically one week. Figure 6-12 Configure and start an EN50160 test of line quality. It is recommended that a brief test of 10 minutes or shorter be done first, to verify the connections and parameters of the test are correct. Only then should the 1-week test be done. If neither of the voltage profiles are chosen, a field appears to enter the nominal voltage. The frequency is not asked for, since it will be asked for when the test result is downloaded. Follow the instructions in the dialog box to set up and run this special test. Press PowerMeterStore.com Shop forthe AEMC products online www. Help button forat:further instructions. Power Quality Analyzer Model 8230 1.877.766.5412 65 6.3.8 Running the Test After configuring the instrument, press “OK”. The status window will display if a recording is ready to start. NOTE: Always use the EN50160 data screen when downloading an EN50160 recording, NOT the recording screen. 6.4 Real-time Windows Once setup is complete, different views of real time data and waveforms can be viewed on-screen. 6.4.1 Waveform, Harmonic Bar and Harmonic Text Figure 6-13a Shop for AEMC products online at: 66 www. Figure 6-13b PowerMeterStore .com 1.877.766.5412 Power Quality Analyzer Model 8230 Figure 6-13c In each Real-time window, you can: • • • • Select the type of data to review. Stop the update with the Hold function. Print the selected real-time window. Save it to disk. There is a choice of either .dvb (database to be viewed in DataView) or .csv (file to view in a spreadsheet program). 6.4.2Power/Energy Figure 6-14 The Power/Energy window displays accumulated power and energy data. Accumulated energy data can be started or stopped and the results can be downto a database viewed on the screen, selected by phase. Shop forloaded AEMC products online at: and www. .com 1.877.766.5412 PowerMeterStore Power Quality Analyzer Model 8230 67 6.4.3Trend Figure 6-15 This figure shows a real-time trend of data from the PowerPad® Jr. The data is an average of waveforms downloaded to the PC. There might be 1 waveform per 2.6 seconds. The data is summarized to 1 datapoint every 10 seconds. NOTE: More data types are downloaded to a database or spreadsheet than what is shown on the screen. 6.5 Downloading Data to Database Choose from two ways to download data: • From the Instrument tree view, expand the sections under “Recorded Data from the instrument”, then click on a line that describes the recorded data. It will bring up a window with a graph of the data. • From the Instrument menu, select “Recorded Data” to download the data recorded in the PowerPad® Jr. - Select the data you want to Download by clicking on the desired tab (Recordings, Photographs, etc.), then clicking on the file name. -Select “Save” (this may take a few minutes). - Type a name for the downloaded file. In the Save as type drop-down menu, select either .dvb (saves it as a database to be viewed in DataView) or .csv (saves it as a comma delimited file to be viewed in a spreadsheet), then click “Save”. - Alternatively, select “View”. After the download is complete, a window will appear with a graph of the data, and some viewing or channel options. In Shop for AEMC products online at: www. .com 1.877.766.5412 that window, you can select “Save”, or “Print”. 68 PowerMeterStore Power Quality Analyzer Model 8230 Following are examples of each tab listed in the display window. 6.5.1Recordings Figure 6-16a The Recording window displays a list of recordings within the PowerPad® Jr. These recordings can be selected and printed or saved to a database. Shop for AEMC products online at: www. PowerMeterStore .com Figure 6-16b Power Quality Analyzer Model 8230 1.877.766.5412 69 6.5.2Photographs Figure 6-17a Figure 6-17b The Photographs window displays a list of photographs (snapshots) taken on the PowerPad® Jr. It shows the date and time when the camera button was pressed. When “View” is selected, it shows the waveforms, power data and a Bitmap image of the PowerPad® Jr. screen from the time the camera button was pressed. NOTE: Snapshots can only be initiated using the camera button on the www. .com 1.877.766.5412 PowerPad Jr. itself, not by DataView®. Shop for AEMC products ® online at: 70 PowerMeterStore Power Quality Analyzer Model 8230 6.5.3Alarms Figure 6-18 The Alarms window displays a list of alarms recorded with the PowerPad® Jr. Alarms can be selected and downloaded to a database. The downloaded alarms contain no more information than is shown in the screen display. 6.5.4Inrush Figure 6-19a The Inrush window displays an inrush recording stored on the PowerPad® Jr. It shows the time it began, its duration, the maximum ARMS and maximum A-Peak. Shop forThe AEMCselected products online at:can www. .com 1.877.766.5412 inrush then be downloaded. PowerMeterStore Power Quality Analyzer Model 8230 71 Figure 6-19b The downloaded result contains many waveforms. Use the controls “><” and “<>” located at the lower right corner of the window, to zoom in or out of the data. These controls are available in every graph from recorded data. There is also a checkbox, “View As List”, which can be used to show the value of every datapoint. Shop for AEMC products online at: 72 www. PowerMeterStore .com Figure 6-19c 1.877.766.5412 Power Quality Analyzer Model 8230 The ARMS display shows the ARMS of each half cycle during the inrush. Figure 6-19d 6.5.5 Monitoring The Monitoring window displays recorded tests that can be downloaded and analyzed. Shop for AEMC products online at: www. Figure 6-20a PowerMeterStore .com Power Quality Analyzer Model 8230 1.877.766.5412 73 After selecting a recording and clicking “View”, the summary window appears showing the results after all the data has been downloaded to a database. It displays the name, percent of the 10-minute periods that it has been out of range, followed by the range it needed to be within. Figure 6-20b 6.5.6 Saving Real-time Measurements Real-time data received from an instrument can be saved directly into a recording session database. This differs from the process of downloading and saving recorded data in that the measurements are stored on the computer as the instrument measures them. These measurements are not necessarily being stored within the instrument. However, the instrument may be configured to record at the same time real-time measurements are being received from the instrument. In which case, two copies of the measurements will be stored. One copy is stored on the local computer and the other in memory within the instrument. To Save a Real-time Measurement: 1. From the Realtime Trend window, check the “Rec to PC” checkbox. 2. In the Save As dialog box that appears, specify the type of file to save in the “Save as Type” field. The choices are .dvb (DataView database), .xls (Excel spreadsheet), or .csv (Comma Separated File). Specify the name of the file by typing it into the File name field, select the desired location to save the file, then click Save to save the file. 3. When the “Rec to PC” option is unchecked the file can be opened by selecting dialog box. .com 1.877.766.5412 PowerMeterStore Shop for AEMC products online Saved at: www. Yes from the View File 74 Power Quality Analyzer Model 8230 To edit the Session Properties, return to the Power Analyzer Control Panel and select File > Edit Session Properties. Figure 6-21 The Session Properties dialog box allows you to specify the Operator, Site and Custom parameters that are to be saved with recorded data. These parameters are used when generating reports. The Operator and Site tabs allow you to maintain lists of operators and sites, saving you time when specifying parameters for reports. On the left of the Operator and Site tabs is the list of previously defined Operators and Sites. On the right of the Operator and Site tabs is the individual parameters that will be saved in an associated database. Only a single set of operator and site fields are saved in the recording database. The Custom tab contains a list of user defined parameters. Along side each user defined parameter is a check box. Items that are checked will be added to an associated database. Only a single set of Custom parameters can be maintained (unlike the Operator and Site lists). The Custom tab allows you to specify any user defined parameters (in addition to the comments field of the Site tab) that are to be used in displaying a report. In addition to the pre-designed report templates, DataView® allows you to totally configure reports to your needs. Refer to the DataView® HELP file on “Templates” to learn more about templates. Shop for AEMC products online at: www. PowerMeterStore.com Power Quality Analyzer Model 8230 1.877.766.5412 75 CHAPTER 7 MAINTENANCE Use only factory specified replacement parts. AEMC® will not be held responsible for any accident, incident, or malfunction following a repair done other than by its service center or by an approved repair center. 7.1 Recharging the Battery The 8230 is powered by six rechargeable NiMH storage batteries (Figure 7-1, item 1) having a capacity of at least 1800 mAh. The storage batteries are recharged using the external power unit supplied with the instrument. It is connected to the 8230 using the jack. Use only the external power unit supplied with the equipment. With fully discharged storage batteries, the charging time is approximately four hours. Once the battery is recharged, the instrument uses external power and does not discharge the battery. Note: when the external power unit is connected, the orange indicator lights. The number of bars inside the battery icon on the display is proportional to the charge level. ITEM FUNCTION Battery fully charged. Battery discharged. Moving bars: battery charging No battery. The 8230 is supplied by external power unit. NOTE: The instrument will not recharge if the message “Instrument will soon turn OFF” is displayed on the screen. The Enter button must be pressed or the instrument must be turned OFF before recharging will start. Shop for AEMC products online at: 76 www. PowerMeterStore.com 1.877.766.5412 Power Quality Analyzer Model 8230 7.2 Changing the Battery WARNING: • When changing the battery, disconnect the instrument from the AC power and any other inputs and turn the equipment off. There must be a delay of at least one minute without the battery being connected. • Do not expose the battery to heat exceeding 212°F (100°C). • Do not short-circuit the battery terminals. To access the batteries, turn the 8230 over and turn the lock one-quarter turn (Figure 7-1, item 2) counter-clockwise using a coin (Figure 7-1, item 3). Figure 7-1 7.3Cleaning Disconnect the instrument from any source of electricity. • Use a soft cloth, lightly dampened with soapy water • Wipe with a damp cloth and then dry with a dry cloth • Do not splash water directly on the clamp • Do not use alcohol, solvents or hydrocarbons Sensors: • Clean using a soft cloth lightly dampened with soapy water, then dry rapidly. PowerMeterStore.com • Keep the air gap of the probes (MN, SR and MR) perfectly clean. Shop for AEMC products online at: www. • Oil the visible metallic parts lightly to prevent rust. Power Quality Analyzer Model 8230 1.877.766.5412 77 APPENDIX A MATHEMATICAL FORMULAS FOR VARIOUS PARAMETERS NOTE the following abbreviations used in this section: NSHC = number of samples per half cycle (between two consecutive zeros) NSC = number of samples per cycle NSS = number of samples in a second (multiple of NSC) V = voltage phase to neutral U = voltage phase to phase Network Frequency The sampling is locked to the network frequency so as to provide 256 samples per period (NECHPER) from 40 to 70Hz. This locking is essential for the calculations of the reactive powers, the calculations of levels and angles, and the calculations giving the harmonic magnitudes. Half-period Voltage and Current RMS Values Vhalf = Ahalf = 1 NSHC ⋅ 1 NSHC ⋅ Next Zero ∑V [n] 2 Rms voltage 2 Rms current n:Zero Next Zero ∑A [n] n:Zero NSHC: number of samples per half cycle (between two consecutive zeros) n: sample (0; 255) MIN / MAX Values for Voltage and Current Vmax=max (Vhalf), Vmin=min (Vhalf) Amax=max (Ahalf), Amin=min (Ahalf) Shop for AEMC products online at: 78 www. PowerMeterStore.com 1.877.766.5412 Power Quality Analyzer Model 8230 Short-term Flicker (PST) of the Voltage Numerical method derived from standard IEC 61000-4-15. The PST value is refreshed every 1 minute. Peak Voltage and Current (Updated on each waveform refresh) Vpp=max (V[n]), Vpm=min (V[n]), n ∈ [0..NSC-1] App=max (A[n]), Apm=min (V[n]), n ∈ [0..NSC-1] Peak Factors for Current and Voltage (over 1 second) Vcf = 2 Acf = 2 max (Vpp ,Vpm ) 1 NSC NSC − 1 ∑V [n] ⋅ 2 Peak factor voltage 2 Peak factor current n =0 max (App , Apm ) 1 NSC NSC − 1 ∑A [n] ⋅ n =0 1 sec RMS Values for Voltage and Current Vrms = Arms = 1 NSS ⋅ 1 NSS ⋅ Shop for AEMC products online at: NSS − 1 ∑V [n] 2 Rms voltage n =0 NSS − 1 ∑A [n] 2 Rms current n =0 www. PowerMeterStore.com Power Quality Analyzer Model 8230 1.877.766.5412 79 Harmonic Calculations These are done by 1024-point FFT (4 periods) without windowing (cf. IEC 1000-47). From the real and imaginary parts, the levels Vharm and Aharm are calculated (with respect to the RMS value of the fundamental) and the angles Vph and Aph are calculated (phase shift with respect to the fundamental). 50 ∑ Vharm [n] n=2 Vthd = 50 2 Vharm [1] , Athd = ∑ Aharm [n] 2 n=2 Aharm [1] The voltage harmonic level (Vharm) is multiplied by the current harmonic level (Aharm) to calculate the apparent power harmonic level (VAharm). The power harmonic angles are calculated from the difference between voltage harmonic angles and the current harmonic angles. Different Power Levels 1 Sec in Single-Phase Connection Active power W= 1 NSS NSS-1 ∑ V [n] . A [n] n=0 Apparent power VA = Vrms .Arms Reactive power VAR = NSS-1 1 . ∑ VF [n - NSC / 4] .AF [n] NSS n = 0 or VAR = VA2 – W 2 if computation method is with harmonics Different Power Levels 1 Sec in Balanced Three-Phase Connection Total Active power W= -3 3 × NSS 3 Total Apparent power VA = Total Reactive power VAR 3 = or VAR = NSS-1 ∑ U [n − NSC / 4].A[n] n=0 ⋅ URM S ⋅ ARM S VA² − W ² 3 NSS-1 3 × NSS n=0 ∑ UF [n].AF [n] U = voltage phase to phase between phase 1 to phase 2 A = phase 3 Shop for AEMC products online at: www. if computation method is without harmonics PowerMeterStore.com 80 1.877.766.5412 Power Quality Analyzer Model 8230 K Factor n =50 Akf = ∑n 2 ⋅ Aharm[n] n =1 n =50 ∑ Aharm[n] 2 2 n =1 Ratios PF = W VA phase power factor DPF = cos(φ) phase displacement factor Tan = tan(φ) phase tangent NSS-1 ∑ VF [n] . AF [n] n=0 cos(φ) = NSS-1 NSS-1 ∑ VF [n] ∑ AF [n] 2 n=0 2 Cosine angle between voltage fundamental and phase current n=0 Various Types of Energy W for W ≥ 0 3600 Tint Active energy consumed −W for W < 0 3600 Active energy generated Whc = ∑ Whg = ∑ Tint VA for W ≥ 0 Tint 3600 Apparent energy consumed VA for W < 0 3600 Apparent energy generated VAhc = ∑ VAhg = ∑ Tint VAR for VAR ≥ 0 and W ≥ 0 Tint 3600 VARhLc = ∑ Inductive reactive energy consumed VARhLg = ∑ − VAR for VAR < 0 and W < 0 3600 Inductive reactive energy generated VARhCc = ∑ − VAR for VAR < 0 and W ≥ 0 3600 Capacitive reactive energy consumed VARhCg = ∑ VAR Tint Tint for VAR ≥ 0 and W < 0 Shop for AEMC products 3600 at: Tint online www. Capacitive reactive energy generated PowerMeterStore .com 1.877.766.5412 Power Quality Analyzer Model 8230 81 Hysteresis Hysteresis is a filtering principle, often used after the threshold detection has occurred. A correct setting of hysteresis value will avoid repeated triggering when the measure is varying close to the threshold. The event detection is activated when the measure is going over the threshold but it can only be deactivated if the measure goes under the threshold minus the value of the hysteresis. The default hysteresis value is 2% of the reference voltage but it may be set in the range of [1%, 5%] depending of the voltage stability on the system. Detection of voltage overload Threshold of swell = 100% Uref Hysteresis = 2% Uref Level to go back = 100% - 2% = 98% Uref Swell duration Undervoltage or blackout detection Duration Level to go back = (100% + 2%)Uref Hysteresis = 2% Uref Threshold = 102% Uref Shop for AEMC products online at: 82 www. PowerMeterStore.com 1.877.766.5412 Power Quality Analyzer Model 8230 APPENDIX B GLOSSARY OF UNITS Symbol Definition AC and DC AC DC φ Phase shift of phase-to-earth voltage with respect to phase-to-earth current Acf Peak factor of the current Ahx Level of order ‘x’ harmonic in current Arms True RMS current Athd Total harmonic distortion DF Distortion factor (of the voltage or current) DPF Displacement factor (cosine of φ) Hz Frequency of the network studied PF Power factor (ratio of active power to apparent power) PST Short-term flicker RMS See Arms and Vrms Tan Tangente of angle φ THD See Athd and Vtd VA Apparent power (total if 3 φ) VAh Apparent energy (consumed or generated; total if 3 φ) VAR Reactive power (total if 3 φ) Vcf Peak factor of the voltage (phase-to-phase if 3 φ) Vhx Level of order ‘x’ harmonic in voltage (phase-to-phase 3 φ) Vrms True RMS voltage (phase-to-phase 3 φ) Vthd Total harmonic distortion of the voltage (phase-to-phase 3 φ) W Active power (total 3 φ) Wh Active energy (consumed of generated; total 3 φ) Shop for AEMC products online at: www. PowerMeterStore.com Power Quality Analyzer Model 8230 1.877.766.5412 83 Repair and Calibration To ensure that your instrument meets factory specifications, we recommend that it be scheduled back to our factory Service Center at one-year intervals for recalibration, or as required by other standards or internal procedures. For instrument repair and calibration: You must contact our Service Center for a Customer Service Authorization Number (CSA#). This will ensure that when your instrument arrives, it will be tracked and processed promptly. Please write the CSA# on the outside of the shipping container. If the instrument is returned for calibration, we need to know if you want a standard calibration, or a calibration traceable to N.I.S.T. (Includes calibration certificate plus recorded calibration data). Ship To: Chauvin Arnoux®, Inc. d.b.a. AEMC® Instruments 15 Faraday Drive Dover, NH 03820 USA Phone:(800) 945-2362 (Ext. 360) (603) 749-6434 (Ext. 360) Fax: (603) 742-2346 or (603) 749-6309 E-mail:[email protected] (Or contact your authorized distributor) Costs for repair, standard calibration, and calibration traceable to N.I.S.T. are available. NOTE: You must obtain a CSA# before returning any instrument. Technical and Sales Assistance If you are experiencing any technical problems, or require any assistance with the proper operation or application of your instrument, please call, mail, fax or e-mail our technical support team: Chauvin Arnoux®, Inc. d.b.a. AEMC® Instruments 200 Foxborough Boulevard Foxborough, MA 02035 USA Phone:(800) 343-1391 (508) 698-2115 Fax: (508) 698-2118 E-mail:[email protected] www.aemc.com NOTE: Do not ship Instruments to our Foxborough, MA address. Shop for AEMC products online at: 84 www. PowerMeterStore.com 1.877.766.5412 Power Quality Analyzer Model 8230 Limited Warranty The PowerPad® Jr. Model 8230 is warranted to the owner for a period of one year from the date of original purchase against defects in manufacture. This limited warranty is given by AEMC® Instruments, not by the distributor from whom it was purchased. This warranty is void if the unit has been tampered with, abused or if the defect is related to service not performed by AEMC® Instruments. Full warranty coverage and product registration is available on our website at www.aemc.com/warranty.html. Please print the online Warranty Coverage Information for your records. What AEMC® Instruments will do: If a malfunction occurs within the one-year period, you may return the instrument to us for repair, provided we have your warranty registration information on file or a proof of purchase. AEMC® Instruments will, at its option, repair or replace the faulty material. REGISTER ONLINE AT: www.aemc.com Warranty Repairs What you must do to return an Instrument for Warranty Repair: First, request a Customer Service Authorization Number (CSA#) by phone or by fax from our Service Department (see address below), then return the instrument along with the signed CSA Form. Please write the CSA# on the outside of the shipping container. Return the instrument, postage or shipment pre-paid to: Ship To: Chauvin Arnoux®, Inc. d.b.a. AEMC® Instruments 15 Faraday Drive • Dover, NH 03820 USA Phone:(800) 945-2362 (Ext. 360) (603) 749-6434 (Ext. 360) Fax: (603) 742-2346 or (603) 749-6309 E-mail:[email protected] Caution: To protect yourself against in-transit loss, we recommend you insure your returned material. NOTE: You must obtain a CSA# before returning any instrument. Shop for AEMC products online at: www. PowerMeterStore.com Power Quality Analyzer Model 8230 1.877.766.5412 85 01/13 99-MAN 100296 v13 PowerMeterStore Chauvin Arnoux®, Inc. d.b.a. AEMC® Instruments Shop for AEMC products online at: www. .com 1.877.766.5412 15 Faraday Drive • Dover, NH 03820 USA • Phone: (603) 749-6434 • Fax: (603) 742-2346 www.aemc.com