1
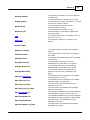
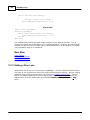
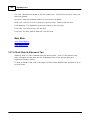
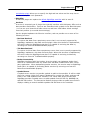
RightEdge 2010
Program Documentation
by RightEdge Systems, LLC
RightEdge is a trading system development product.
Trading systems can be back tested and run in a live
environment.
RightEdge Help
© 2015 RightEdge Systems, LLC
All rights reserved. No parts of this work may be reproduced in any form or by any means - graphic, electronic, or
mechanical, including photocopying, recording, taping, or information storage and retrieval systems - without the
written permission of the publisher.
Products that are referred to in this document may be either trademarks and/or registered trademarks of the
respective owners. The publisher and the author make no claim to these trademarks.
While every precaution has been taken in the preparation of this document, the publisher and the author assume no
responsibility for errors or omissions, or for damages resulting from the use of information contained in this
document or from the use of programs and source code that may accompany it. In no event shall the publisher and
the author be liable for any loss of profit or any other commercial damage caused or alleged to have been caused
directly or indirectly by this document.
Contents
3
Table of Contents
Part I Getting Started
11
Part II What's New In This Edition?
17
Part III Charting Overview
22
Part IV Using the RightEdge Environment
31
Part V Developing Trading Systems in RightEdge
35
Part VI Analyzing System Results
53
Part VII Technical Indicator List
61
Part VIII RightEdge Environment
64
1 Using...................................................................................................................................
the RightEdge Environment
64
2 Automating
...................................................................................................................................
RightEdge
67
3 Watchlist
...................................................................................................................................
Pane
69
4 Trading
...................................................................................................................................
System Pane
72
Trading System
..........................................................................................................................................................
Properties
75
5 Indicators
...................................................................................................................................
Pane
77
6 Bar Data
...................................................................................................................................
Editor
80
7 System
...................................................................................................................................
Components Pane
81
8 Chart...................................................................................................................................
Objects Pane
82
9 Live Data
...................................................................................................................................
Pane
84
10 Live System
...................................................................................................................................
Pane
86
11 Properties
...................................................................................................................................
Pane
88
12 Output
...................................................................................................................................
Pane
89
13 Build ...................................................................................................................................
Output Pane
90
14 Windows
...................................................................................................................................
Dialog
91
15 Using...................................................................................................................................
the Editor
92
16 Editor...................................................................................................................................
Colors
95
17 Code ...................................................................................................................................
Snippets
96
18 Floating
...................................................................................................................................
Documents
99
19 Trading
...................................................................................................................................
System Project Properties
100
Part IX Options
104
1 RightEdge
...................................................................................................................................
Program Options
104
© 2015 RightEdge Systems, LLC
3
4
RightEdge Help
2 General
...................................................................................................................................
Options
104
3 Chart
...................................................................................................................................
Options
106
Configure Position
..........................................................................................................................................................
Labels
107
4 Chart
...................................................................................................................................
Color Options
107
5 Editor
...................................................................................................................................
Options
109
6 Research
...................................................................................................................................
Options
110
7 Risk ...................................................................................................................................
Assessment Options
111
8 Live ...................................................................................................................................
Systems
111
9 System
...................................................................................................................................
Results Options
113
10 Managing
...................................................................................................................................
Frequencies
113
Adding and Editing
..........................................................................................................................................................
Frequencies
114
Part X How Do I?
116
1 Create
...................................................................................................................................
a Trading System
116
2 Debug
...................................................................................................................................
Trading Systems in Visual Studio
117
3 Setup
...................................................................................................................................
A Watchlist
118
4 Configure
...................................................................................................................................
a Service
121
5 Run ...................................................................................................................................
a Backtest / Simulation
124
6 Optimize
...................................................................................................................................
a System
125
7 View...................................................................................................................................
Live Charts
127
8 View...................................................................................................................................
System Charts
127
9 Start...................................................................................................................................
Live Trading System
129
10 Manual
...................................................................................................................................
or Discretionary Trading
130
11 Import
...................................................................................................................................
Data
130
Bar Data Cleanup
.......................................................................................................................................................... 139
12 Analyze
...................................................................................................................................
Simulation Results
139
13 Save...................................................................................................................................
Chart Settings
147
14 Start...................................................................................................................................
Live Data
148
15 See ...................................................................................................................................
a Chart Now!
149
16 Setting
...................................................................................................................................
a Simulated Broker
151
17 Setting
...................................................................................................................................
a Timeout
151
18 Setting
...................................................................................................................................
a Profit Target
153
19 Setting
...................................................................................................................................
a Stop Loss
154
20 Collecting
...................................................................................................................................
Forex Data
156
Part XI Data Sources
157
1 Configuring
...................................................................................................................................
Data Sources
157
Part XII Services
161
1 Modify
...................................................................................................................................
Service
161
© 2015 RightEdge Systems, LLC
Contents
Part XIII Charts
5
163
1 Using
...................................................................................................................................
RightEdge Charts
163
2 Opening
...................................................................................................................................
Live Charts
171
3 Bar Chart
................................................................................................................................... 172
4 Candlestick
...................................................................................................................................
Chart
173
5 Line...................................................................................................................................
Chart
174
6 Stacking
...................................................................................................................................
Charts
175
7 Using
...................................................................................................................................
Chart Objects
177
Part XIV Chart Objects
179
1 Chart
...................................................................................................................................
Objects Archimedes Spiral
180
2 Chart
...................................................................................................................................
Objects Arrow Line
181
3 Chart
...................................................................................................................................
Objects Asynchronous Linear Regression Channel
183
4 Chart
...................................................................................................................................
Objects Circle
184
5 Chart
...................................................................................................................................
Objects Cross Channel
186
6 Chart
...................................................................................................................................
Objects Downtrend Channel
187
7 Chart
...................................................................................................................................
Objects Ellipse
189
8 Chart
...................................................................................................................................
Objects Equal Channel
191
9 Chart
...................................................................................................................................
Objects Equal Cycle Line
192
10 Chart
...................................................................................................................................
Objects Fan
194
11 Chart
...................................................................................................................................
Objects Fibonacci Circle
195
12 Chart
...................................................................................................................................
Objects Fibonacci Cycle Line
197
13 Chart
...................................................................................................................................
Objects Fibonacci Fan
198
14 Chart
...................................................................................................................................
Objects Horizontal Line
200
15 Chart
...................................................................................................................................
Objects Hyperbolic Spiral
201
16 Chart
...................................................................................................................................
Objects Image
203
17 Chart
...................................................................................................................................
Objects Label
204
18 Chart
...................................................................................................................................
Objects Line
205
19 Chart
...................................................................................................................................
Objects List
207
20 Chart
...................................................................................................................................
Objects Lituus Spiral
208
21 Chart
...................................................................................................................................
Objects Logarithmic Spiral
209
22 Chart
...................................................................................................................................
Objects Linear Regression Channel
211
23 Chart
...................................................................................................................................
Objects Linear Regression Line
212
24 Chart
...................................................................................................................................
Objects Multi Arc
214
25 Chart
...................................................................................................................................
Objects Linear Regression Line
215
26 Chart
...................................................................................................................................
Objects Parabolic Spiral
217
27 Chart
...................................................................................................................................
Objects Parallelogram
219
28 Chart
...................................................................................................................................
Objects Percent Line
220
29 Chart
...................................................................................................................................
Objects Rectangle
222
© 2015 RightEdge Systems, LLC
5
6
RightEdge Help
30 Chart
...................................................................................................................................
Objects Rectangle Band
223
31 Chart
...................................................................................................................................
Objects Rectangle Price
225
32 Chart
...................................................................................................................................
Objects Rounded Rectangle
226
33 Chart
...................................................................................................................................
Objects Sine Object
228
34 Chart
...................................................................................................................................
Objects Square Cycle Line
229
35 Chart
...................................................................................................................................
Objects Standard Channel
231
36 Chart
...................................................................................................................................
Objects Standard Channel
232
37 Chart
...................................................................................................................................
Objects Symmetry Line
234
38 Chart
...................................................................................................................................
Objects Text
236
39 Chart
...................................................................................................................................
Objects Triangle
238
40 Chart
...................................................................................................................................
Objects Up/Down Trend Channel
239
41 Chart
...................................................................................................................................
Objects Uptrend Channel
241
42 Chart
...................................................................................................................................
Objects Vertical Line
243
Part XV Plugins & Services
246
1 Service
...................................................................................................................................
& Plugin Overview
246
2 Creating
...................................................................................................................................
an Indicator
250
Part XVI Optimization
253
1 Optimization
...................................................................................................................................
Overview
253
2 Optimization
...................................................................................................................................
Output
254
3 Optimization
...................................................................................................................................
Dialog
255
Part XVII Technical Indicators
257
1 Technical
...................................................................................................................................
Indicator Overview
257
2 Accumulation
...................................................................................................................................
/ Distribution
258
3 Accumulation
...................................................................................................................................
Swing Index
258
4 Add ...................................................................................................................................
Series
258
5 ADX...................................................................................................................................
Indicator
259
6 ADXR
...................................................................................................................................
Indicator
259
7 Aroon
...................................................................................................................................
Down Indicator
259
8 Aroon
...................................................................................................................................
Up Indicator
260
9 Aroon
...................................................................................................................................
Oscillator
260
10 Average
...................................................................................................................................
Price Indicator
260
11 Average
...................................................................................................................................
True Range Indicator
261
12 Balance
...................................................................................................................................
of Power Indicator
261
13 Bollinger
...................................................................................................................................
Band (Lower) Indicator
261
14 Bollinger
...................................................................................................................................
Band (Upper) Indicator
262
15 Center
...................................................................................................................................
of Gravity Oscillator Indicator
262
16 Chaikin
...................................................................................................................................
Money Flow Indicator
262
© 2015 RightEdge Systems, LLC
Contents
7
17 Chaikin
...................................................................................................................................
Oscillator Indicator
263
18 Chaikin
...................................................................................................................................
Volatility Indicator
263
19 Chande
...................................................................................................................................
Momentum Indicator
263
20 Commodity
...................................................................................................................................
Channel Index (CCI) Indicator
263
21 Commodity
...................................................................................................................................
Selection Index (CSI) Indicator
264
22 Constant
...................................................................................................................................
Series Indicator
264
23 Detrended
...................................................................................................................................
Price Oscillator (DPO) Indicator
264
24 DI+ Indicator
................................................................................................................................... 265
25 DI- Indicator
................................................................................................................................... 265
26 Directional
...................................................................................................................................
Movement Indicator
265
27 Divide
...................................................................................................................................
Series Indicator
266
28 Donchian
...................................................................................................................................
Channel (Lower) Indicator
266
29 Donchian
...................................................................................................................................
Channel (Upper) Indicator
266
30 Double
...................................................................................................................................
Exponential Moving Average Indicator
267
31 Dynamic
...................................................................................................................................
Momentum Index (DMI) Indicator
267
32 Ease...................................................................................................................................
of Movement Indicator
268
33 Envelope
...................................................................................................................................
(Lower) Indicator
268
34 Envelope
...................................................................................................................................
(Upper) Indicator
268
35 Exponential
...................................................................................................................................
Moving Average (EMA) Indicator
269
36 Forecast
...................................................................................................................................
Oscillator Indicator
269
37 Historical
...................................................................................................................................
Volatility Indicator
269
38 Intraday
...................................................................................................................................
Momentum Index (IMI) Indicator
270
39 Keltner
...................................................................................................................................
Band (Lower)
270
40 Keltner
...................................................................................................................................
Band (Upper)
270
41 Klinger
...................................................................................................................................
Oscillator
271
42 Linear
...................................................................................................................................
Regression Indicator
271
43 Linear
...................................................................................................................................
Regression Slope Indicator
271
44 Linear
...................................................................................................................................
Regression Trend Line Indicator
271
45 MACD
...................................................................................................................................
Indicator
272
46 Market
...................................................................................................................................
Facilitation Index (MFI) Indicator
272
47 Mass...................................................................................................................................
Index Indicator
273
48 Median
...................................................................................................................................
Price Indicator
273
49 Momentum
...................................................................................................................................
Indicator
273
50 Money
...................................................................................................................................
Flow Index Indicator
273
51 Multiply
...................................................................................................................................
Series Indicator
274
52 Negative
...................................................................................................................................
Volume Index (NVI) Indicator
274
53 On Balance
...................................................................................................................................
Volume Indicator
274
54 Parabolic
...................................................................................................................................
SAR Indicator
275
55 Performance
...................................................................................................................................
Indicator
275
© 2015 RightEdge Systems, LLC
7
8
RightEdge Help
56 Positive
...................................................................................................................................
Volume Index (PVI) Indicator
275
57 Price...................................................................................................................................
and Volume Trend (PVT) Indicator
275
58 Price...................................................................................................................................
Channel (Lower) Indicator
276
59 Price...................................................................................................................................
Channel (Upper) Indicator
276
60 Price...................................................................................................................................
Oscillator Indicator
276
61 Price...................................................................................................................................
Rate of Change Indicator
277
62 Qstick
...................................................................................................................................
Indicator
277
63 Range
...................................................................................................................................
Indicator
277
64 Relative
...................................................................................................................................
Momentum Index (RMI) Indicator
278
65 Relative
...................................................................................................................................
Strength (RSI) Indicator
278
66 Relative
...................................................................................................................................
Vigor Index (RVI) Indicator
278
67 Relative
...................................................................................................................................
Volatility Index Indicator
278
68 rsquared
...................................................................................................................................
indicator
279
69 Shift...................................................................................................................................
Series Indicator
279
70 Simple
...................................................................................................................................
Moving Average (SMA) Indicator
279
71 Standard
...................................................................................................................................
Deviation Indicator
280
72 Standard
...................................................................................................................................
Deviation Channel (Lower) Indicator
280
73 Standard
...................................................................................................................................
Deviation Channel (Upper) Indicator
280
74 Standard
...................................................................................................................................
Error Band (Lower) Indicator
281
75 Standard
...................................................................................................................................
Error Band (Upper) Indicator
281
76 Standard
...................................................................................................................................
Error Indicator
282
77 Standard
...................................................................................................................................
Error Channel (Lower) Indicator
282
78 Standard
...................................................................................................................................
Error Channel (Upper) Indicator
282
79 Stochastic
...................................................................................................................................
%D (Slow) Indicator
283
80 Stochastic
...................................................................................................................................
%K (Fast) Indicator
283
81 Stochastic
...................................................................................................................................
Momentum Index Indicator
283
82 Stochastic
...................................................................................................................................
Oscillator Indicator
284
83 Stochastic
...................................................................................................................................
RSI Indicator
284
84 Subtract
...................................................................................................................................
Series Indicator
284
85 Swing
...................................................................................................................................
Index Indicator
285
86 Time...................................................................................................................................
Series Forecast Indicator
285
87 Tirone
...................................................................................................................................
Levels (Center) Indicator
285
88 Tirone
...................................................................................................................................
Levels (Lower) Indicator
285
89 Tirone
...................................................................................................................................
Levels (Upper) Indicator
286
90 Triangular
...................................................................................................................................
Moving Average (TMA) Indicator
286
91 TEMA
...................................................................................................................................
Indicator
286
92 TRIX...................................................................................................................................
Indicator
287
93 True...................................................................................................................................
Range Indicator
287
94 Ultimate
...................................................................................................................................
Oscillator Indicator
287
© 2015 RightEdge Systems, LLC
Contents
9
95 Variable
...................................................................................................................................
Moving Average (VMA) Indicator
288
96 Vertical
...................................................................................................................................
Horizontal Filter (VHF) Indicator
288
97 Volume
...................................................................................................................................
Adjusted Moving Average Indicator
288
98 Volume
...................................................................................................................................
Oscillator Indicator
289
99 Volume
...................................................................................................................................
Rate of Change Indicator
289
100 Weighted
...................................................................................................................................
Close Indicator
289
101 Weighted
...................................................................................................................................
Moving Average (WMA) Indicator
289
102 Widner
...................................................................................................................................
Band (Lower) Indicator
290
103 Widner
...................................................................................................................................
Band (Upper) Indicator
290
104 Widner
...................................................................................................................................
Oscillator Indicator
290
105 Wilders
...................................................................................................................................
Smoothing Indicator
291
106 Williams
...................................................................................................................................
%R Indicator
291
107 Williams
...................................................................................................................................
Accumulation / Distribution Indicator
291
108 Zig Zag
...................................................................................................................................
Indicator
292
Part XVIII Risk Evaluators
293
1 Payoff
...................................................................................................................................
Ratio
293
2 Profit
...................................................................................................................................
Factor
293
3 Recovery
...................................................................................................................................
Factor
293
4 Risk ...................................................................................................................................
Adjusted Return
294
5 Sharpe
...................................................................................................................................
Ratio
294
Part XIX Glossary of Terms
295
1 Futures
................................................................................................................................... 295
2 Asset...................................................................................................................................
Class
295
3 Strike
...................................................................................................................................
Price
295
4 Forex
................................................................................................................................... 295
5 Exchange
................................................................................................................................... 295
6 APR................................................................................................................................... 295
7 Backtesting
................................................................................................................................... 295
8 Buy ...................................................................................................................................
& Hold
296
9 C# ................................................................................................................................... 296
10 Drawdown
................................................................................................................................... 296
11 Exposure
................................................................................................................................... 297
12 Initial
...................................................................................................................................
Margin
297
13 Limit...................................................................................................................................
Order
297
14 Long...................................................................................................................................
Position
297
15 MAE................................................................................................................................... 298
16 Maintenance
...................................................................................................................................
Margin
298
17 Margin
................................................................................................................................... 298
© 2015 RightEdge Systems, LLC
9
10
RightEdge Help
18 MFE................................................................................................................................... 298
19 OHLC
...................................................................................................................................
Charts - Definition
298
20 Option
................................................................................................................................... 299
21 Profit
...................................................................................................................................
Target
299
22 Short
...................................................................................................................................
Selling
300
23 Stock
................................................................................................................................... 300
24 Stop...................................................................................................................................
Loss
300
25 Symbols
................................................................................................................................... 300
26 Timeout
................................................................................................................................... 301
27 Visual
...................................................................................................................................
Basic.NET
301
Index
303
© 2015 RightEdge Systems, LLC
Getting Started
1
11
Getting Started
Welcome to RightEdge, the next level of trading system development and execution.
This article aims to get data and a system developed in as little as fifteen minutes.
This quick start guide is broken into the following sections. Select the topics below to get
relevant information quickly.
Configuring services for the first time.
Main screen navigation.
Using charts and indicators.
Creating a system for the first time.
Executing a system and analyzing the results.
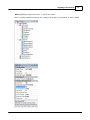
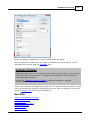
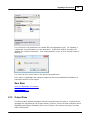
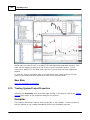
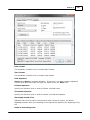
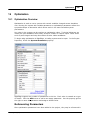
Configuring Services
A service is a type of plugin that supports retrieving realtime data, retrieving historical
data, or connecting to a broker. Services are associated with symbols in the Watchlist
pane.
For a detailed walk through of configuring services, visit the Configuring Services section.
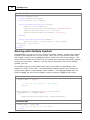
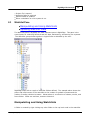
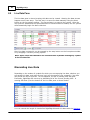
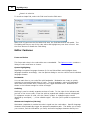
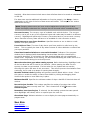
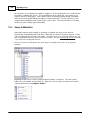
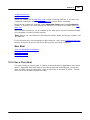
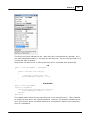
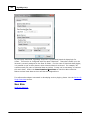
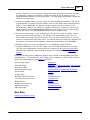
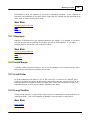
Once services are configured, the next step is to create a symbol list. Right click on the
Watchlist window (shown above) to create a folder. Select New Folder and assign the
folder any name. Right click on the newly created folder and click configure folder. This is
the area to enter symbols, select the historical data provider, real time data provider and
broker.
For details on the Watchlist pane, see the Watchlist section.
© 2015 RightEdge Systems, LLC
12
RightEdge Help
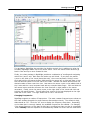
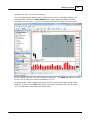
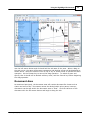
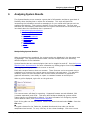
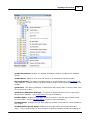
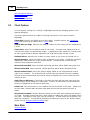
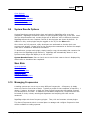
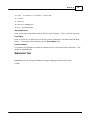
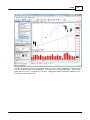
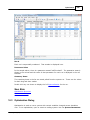
Main Screen Navigation
The main screen in RightEdge is designed to display as much information as possible
without getting in the way of doing work. Since you know the best way that you work,
the panes within RightEdge are dockable, floatable, detachable and pinnable.
Each sub window contains a label, or a small title bar. This title gives a one or two word
description of this tool window's functionality. Each tool window is described briefly
below.
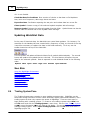
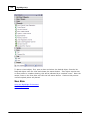
Indicators
This window houses the technical indicators. The indicators are broken off into
indicator categories. Indicators can be dragged from the list and dropped onto a
chart. A complete list of built in indicators can be viewed here. Indicator
properties are displayed in Properties window when a chart object is selected.
Indicators can be changed using the Properties window. Changes made to the
indicator are reflected immediately on the opened chart. For more information on
the indicator pane, see the Indicator Pane help topic.
Chart Objects
This window contains a list of chart objects that can be dragged and dropped
© 2015 RightEdge Systems, LLC
Getting Started
13
onto a chart window. The chart objects are broken off into logical groups. Click
and hold the mouse button the desired chart object and move the mouse cursor to
the chart window and release to plot the chart object. Chart object properties
are displayed in Properties window when a chart object is selected. Chart objects
can be changed on the fly. For more information on the chart objects pane, see
the Chart Objects Pane help topic.
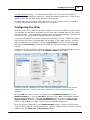
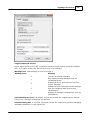
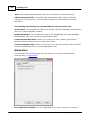
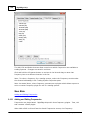
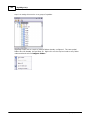
Watchlist
This contains a grouping of symbols. Create a folder by right clicking on the top
level folder and selecting New Folder... This will create a folder that can be
named and configured. Right click on the newly created folder and select
Configure Folder... to set the symbols and data retrieval settings for this folder.
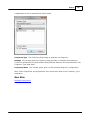
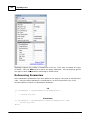
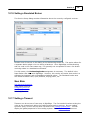
The General tab contains the frequency of the data and the actual symbols
contained within this folder. The Services tab contains the associated services
set with this folder. If a service is configured for real time or historical data,
select it in this tab. Different services can be selected for different folders.
Create folders to group these symbols into a way that makes sense when running
various systems. For example, you might want to group the Nasdaq 100 into a
folder of its own, but also, there might be a folder for the Biotech or
semiconductors, which would be a sub set of the Nasdaq 100. Now these symbols
can be listed any number of times in any number of folders all pulling from the
same symbol list. For more information on the Watchlist pane, see the Watchlist
Pane help topic.
Live Data
When live data is started, symbol items that are configured and selected for live
data will be displayed in this area. Right click on the columns in this window to
customize the appearance. For more information on the Live Data pane, see the
Live Data Pane help topic.
Live System
This area contains several tabs that pertain to live systems. This area is updated
when a live system is running against live data. Items such as open positions,
open orders, P/L, etc are updated while the live system is in progress. For more
information on the Live System pane, see the Live System Pane help topic.
Components
Components are items used to assemble drag and drop trading systems. For more
information on the System Components pane, see the System Components Pane
help topic.
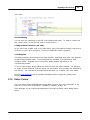
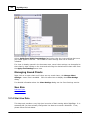
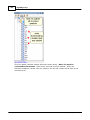
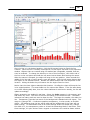
Document Manager
This area in the center of the main window contains all of the work related items.
Things such as the charts, bar data editor, code editor and trade system results
will appear in this work space. Each new work item will create a new tab. As
shown above, there is a chart in the foreground with a code window behind the
chart. For more information on the document manager, see the Using the
RightEdge Environment help topic.
Build Output
This window contains output related to the system build. If there are syntax
errors during the compilation, they will be displayed in this window. If not
© 2015 RightEdge Systems, LLC
14
RightEdge Help
currently working with a system, it would be a good idea to close, or auto-hide
this window. For more information on the Build Output pane, see the Build Output
Pane help topic.
Trading System
This window contains the system project. All items associated with this project
including source files and references are listed in this tree. Use this tool window
to change project settings, perform source file and reference management. For
more information on the Trading System pane, see the Trading System Pane help
topic.
Output Pane
The output pane displays information generated by the system. Often times this
is user defined output but may also be used by RightEdge when a special condition
that is not an exception needs to be reported. For more information on the
Output pane, see the Output Pane help topic.
Properties
The properties window will contain items relevant to the currently selected item.
Most of the time properties will be tied to the project files.
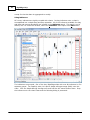
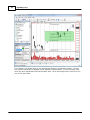
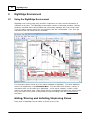
Using Charts and Indicators
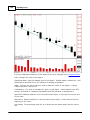
To display a chart without executing a system, double click any symbol with data in the
Symbols list. The chart window will be opened in the document manager as a new tab.
A horizontal scroll bar appears at the bottom of the chart. Use this to navigate through
the historical data. There is a toolbar that allows for a quick change to the number of
bars displayed per page.
Now that a chart is displayed, use the Indicators window to begin dragging and dropping
indicators onto the chart window. Each indicator has a different interface depending on
the input parameters required. Once the OK button is clicked, the parameters are set and
the indicator values are plotted on the chart.
To remove plotted indicators from the chart, move the mouse cursor over any indicator
value on the chart and right click. A context menu is displayed and the option named
Remove Indicator is enabled when the mouse is over an indicator. Select this item to
remove the indicator values from the chart.
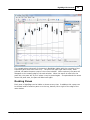
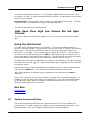
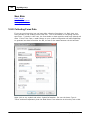
A Word About Chart Persistence
Building a chart to personal taste with the proper indicators and parameters provided
to those indicators is a bit of a tedious task. Typically, a technical analyst likes a few
indicators on the chart to start. For this, RightEdge offers a way to persist or save
charts as they are on the screen. Understandably, it is not important to store the
data, but rather the indicators and their parameters.
© 2015 RightEdge Systems, LLC
Getting Started
15
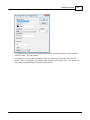
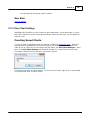
Once a chart is built to taste, right click on the chart and select the Save Chart
Settings... item. Give the chart setting a name and click OK. From this point, the
chart settings will be available for retrieval on the master symbol list. Reapply the
saved setting to any symbol by right clicking on a symbol in the master symbol list and
selecting the Quick Chart (With Chart Settings) item. The saved chart setting will
be recalled so that it may be selected. Select the saved name and the chart will
appear with the saved settings.
Creating A System for the First Time
System building is the cornerstone feature of the RightEdge platform. Fortunately,
starting the system building process is simple and intuitive.
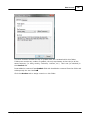
Select File followed by New and then Trading System. Select the preferred language
(C# or Visual Basic), name the project and click OK. The Trading System tool window is
populated with a new project and a trading system source file.
Note: The language is not of consequence if this is purely a drag and drop trading
system.
Once you have created a trading system project, please refer to the Developing Trading
Systems in RightEdge topic which provides in depth coverage of creating trading systems
using C# and Visual Basic).
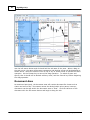
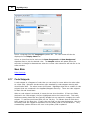
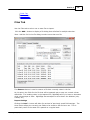
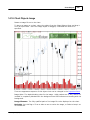
Executing a System and Analyzing the Results
A functional system, albeit a simple one, has now been built. This system will take trades
if the conditions are met and exit at a profit target of 5% or a time out of 50 bars, which
ever comes first.
To execute this system, select the symbol or symbols to run the system against by
clicking the checkbox next to each symbol or symbol group. From the Build menu, select
Run Backtest. If all of the steps were followed above, the result of the build in the Build
Results screen should be successful. While the system is executing, a progress dialog is
displayed. This will allow cancellation of a simulation run.
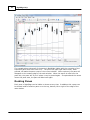
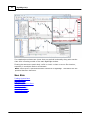
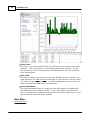
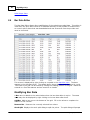
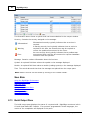
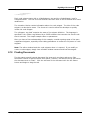
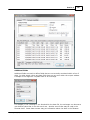
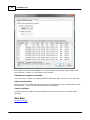
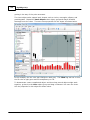
Upon completion, a new document is created in the document manager. This document
will contain multiple tabs that break the system results down in various detail.
© 2015 RightEdge Systems, LLC
16
RightEdge Help
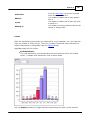
The Summary tab contains a quick summary of all trades taken either long or short
across all of the symbols selected for this run. It takes the starting capital, computes all
trades taken and determines the ending capital. It will display win/loss percentages for
long, short and all trades as well as a simulated buy & hold.
The Trade List tab breaks each individual trade down. Each trade that could've been
taken assuming the conditions were met and the capital was available are displayed. The
trade list shows the symbol for which the trade was taken, the date of the trade, number
of shares, position type and P/L. The far right hand columns keeps a cumulative P/L
figure.
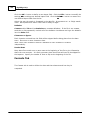
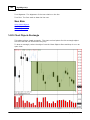
The Symbol Results tab is a very quick and simple way to view the trades taken by each
individual symbol. This tab simply aggregates the trade data at the symbol level. For
example, if our system traded MSFT four times throughout the course of the simulation,
MSFT would be displayed one time with four trades and the corresponding number of
winners and losers. It will also calculate total profit and profit per active bar. The
winning percentage provides a quick way to determine which symbol or symbols do
particularly well and which do not. This may be helpful on days when multiple signals are
generated. While past performance does not guarantee future results, it may provide
some bias towards symbols that have done particularly well in the past.
For more information on the system results, see the System Results help topic.
See Also
Getting Started With Charts
Analyzing System Results
© 2015 RightEdge Systems, LLC
What's New In This Edition?
2
17
What's New In This Edition?
This topic will introduce the new features in this edition of RightEdge.
Breaking Changes And Other Important Information
License files are NO LONGER COMPATIBLE between this edition and previous editions
of RightEdge. You will need to obtain a new license file for this edition. If you have a
subscription in force, are a lease subscriber or have purchased RightEdge in the last 90
days, your customer area will contain an updated license file. Others will need to
purchase an upgrade.
Project files from this edition of RightEdge cannot be opened in previous versions of
RightEdge. When you open a project file from an older version of RightEdge, a copy of
that project file will be saved with the previous version number added to the filename so
that you can still open it up in the older version of RightEdge. For example, if the
project filename is MySystem.rep, a copy named MySystem.2008.1.0.0.rep will be
saved.
If you use a custom data storage plugin, you will not have a data storage plugin set up
in this edition. You will need to go to the options dialog and choose your plugin there.
RList class
No longer has AsIList() method or InnerList property.
Count now refers to the number of available items. This may be less than the total
number of bars if MaxLookBack is not zero. The TotalBars property will get the total
number of bars.
RightEdge is now built on version 3.5 of the .NET Framework. This allows trading system
developers to take advantage of language enhancements such as extension methods
and Linq.
System results plugins no longer have direct access to bar history. Some of the built-in
system results are not calculated (they should display as 0 or n/a).
The SystemData.TradeInsideBars property has been removed. There is now a
CreateTicksFromBars property (which is set to true by default) and an
EnableTradeOnClose (which is set to false by default).
The BarOpened event has been removed.
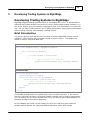
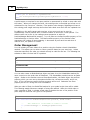
Multiple Frequencies
RightEdge now has support for multiple frequencies. The Frequency class represents a
given frequency for a given symbol. It provides a list of bars for the frequency, as well as
events for NewBar and NewTick for that frequency. There are GetFrequency methods on
the symbol script and SystemData classes which allow you to retrieve a Frequency object
for the desired frequency and symbol. RightEdge will only start building bars for the
frequency after you have requested it by calling GetFrequency, so generally you will want
to call it in your system startup code. To set an indicator to a different frequency, call
SystemData.IndicatorManager.SetFrequency(). If the indicator needs a series as input,
and you want to use a bar element series for that input, be sure to use the bar element
© 2015 RightEdge Systems, LLC
18
RightEdge Help
series from the corresponding Frequency class.
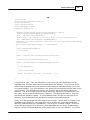
The code below shows how to subscribe to bars in a different frequency and how to
create an indicator using that frequency.
public class SampleSymbolScript : MySymbolScriptBase
{
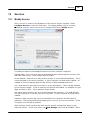
Frequency HourlyFreq;
SMA sma25;
SMA sma5Hourly;
public override void Startup()
{
//
Create indicator using system frequency
sma25 = new SMA(25, Close);
//
Get hourly frequency and subscribe to new bars
HourlyFreq = GetFrequency(BarFrequency.SixtyMinute);
HourlyFreq.NewBar += NewHourlyBar;
//
Create indicator using hourly frequency
sma5Hourly = new SMA(5, HourlyFreq.Close);
SystemData.IndicatorManager.SetFrequency(sma5Hourly, HourlyFreq);
}
public override void NewBar()
{
OutputMessage("New system bar: " + Bars.Current.PriceDateTime.ToString());
}
public void NewHourlyBar(object sender, SingleBarEventArgs args)
{
OutputMessage("New hourly bar: " + args.Bar.PriceDateTime.ToString());
}
}
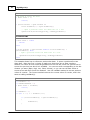
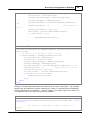
Large Data Set Support
Most systems only need a certain amount of bar history for their calculations, and there is
no need to keep bar data available past that amount. When working with large amounts
of high frequency data, it may not be possible to store all of the data in memory at once.
To allow systems to be run with large amounts of data, RightEdge now includes a
MaxLookBack property in the RList class. If its value is greater than zero, RightEdge will
discard any items past the maximum lookback. If you try to access any of the discarded
items, an exception will be thrown. You can set the value in your symbol script startup
method, like this:
Bars.MaxLookBack = 1000;
If you are using multiple frequencies, you will need to set the MaxLookBack on the bar list
for each additional frequency, also.
Depending on your system, using a maximum lookback for the bar lists may or may not
have a significant effect on your memory consumption. The system statistics, indicators,
© 2015 RightEdge Systems, LLC
What's New In This Edition?
19
and trade history, as well as possibly your system code itself, may all use a lot of memory.
If you need to decrease memory usage, you can selectively disable elements of your
system and measure the effect on your system's memory usage. You can use the
following code in your system class to help with this:
long _initialMemory;
public override void Startup()
{
_initialMemory = GC.GetTotalMemory(true);
}
public override void Shutdown()
{
long finalMemory = GC.GetTotalMemory(true);
long diff = finalMemory - _initialMemory;
string msg = string.Format("Memory used: {0:n}", diff);
SystemData.Output.Add(OutputSeverityLevel.Informational,
msg, null, "", SystemOutputLocation.OutputWindowAndStatusBar);
}
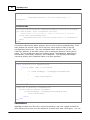
There are four sets of system statistics stored (long, short, all, and buy and hold). They
save a snapshot is saved for each system bar. If the system is only running with a single
symbol, the system statistics memory usage will be significantly larger than the memory
used by the symbol's bar data. However, the system statistics memory usage doesn't
increase with the number of symbols. So if you are using many symbols the system
statistics may not affect your memory usage too much. You can disable some or all of
the system statistics by setting the Enabled property on them to false in your system's
startup method:
SystemData.SystemHistory.LongStatistics.Enabled = false;
SystemData.SystemHistory.ShortStatistics.Enabled = false;
SystemData.SystemHistory.SystemStatistics.Enabled = false;
SystemData.SystemHistory.BuyAndHoldStatistics.Enabled = false;
However, with all of them disabled, the system results summary won't show much useful
information. Another way to reduce the system statistics memory usage is to reduce the
main system frequency. If your system operates on one minute bars, you could set the
system frequency to daily, and use the multiple frequency support to run most or all of
your system logic on the one minute frequency.
Indicators may also use a significant amount of memory. They don't currently support a
MaxLookBack setting, so they will keep all the data for all the bars of your system. If you
need to reduce memory consumption you may have to re-implement the calculations
outside of a RightEdge indicator. Each trade that your system makes also consumes some
memory. If your system trades at a very high frequency then this could lead to high
memory usage.
Bar/Tick Generation
The frequency of your system is no longer tied to the frequency of the input data. The
main system frequency is specified in the trading system options. This controls the
© 2015 RightEdge Systems, LLC
20
RightEdge Help
frequency for many things such as when your NewBar methods will be called, the default
frequency for your indicators, the frequency that system statistics will be saved, etc.
Right now you are limited to a set of predefined frequencies or "Tick" for the system
frequency. If set to "Tick", then the frequency of the symbols you have selected in the
watchlist when you run the system will be used for the system frequency. Otherwise, the
input data will be aggregated to the specified frequency and passed to your system.
The input data bars for your system are sent to a tick generator. If the
CreateTicksFromBars property in the SystemData class is set to true, the tick generator
breaks the bars down into ticks. Currently the tick generator just generates 4 ticks for
each bar, for the open, low, high, and close. We will probably allow you to supply your
own tick generator, which would allow you to determine whether the low or high tick
comes first, or to randomly generate more ticks in between these values.
The ticks from the tick generator are sent to the frequency manager for the system. This
aggregates the ticks into the system frequency, and raises the NewTick and NewBar
events. The paper broker fills orders based on ticks, which means you can use higher
frequency data on a lower frequency system for a more accurate simulation. For example,
it is possible that both the profit target and stop loss for a position could be triggered
within the range of a daily bar. If you use higher frequency data (say 15 minute bar
data), then it is more likely that the simulation will reflect which price would have been hit
first.
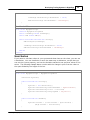
New Plugin System
This edition of RightEdge introduces a new plugin system. One of the advantages of the
new system is that it is easier for plugin writers to define custom settings for plugins. A
property grid is used to display the plugin settings, and XML serialization is used to save
them. This means that to add a custom setting to your plugin, you simply need to define
a public property on your plugin class. The property grid and XML serialization are
standard features of .NET, and offer a high degree of flexibility in how the settings are
displayed in the property grid or saved to XML. The code below shows how a plugin can
define a basic custom property.
[DisplayName("Time-based Bar Frequency")]
[Serializable]
public sealed class TimeFrequency : FrequencyPlugin
{
[Description("Indicates the timespan or period for each bar.")]
[DisplayName("Bar Length")]
public TimeSpan BarLength { get; set; }
public TimeFrequency()
{
BarLength = TimeSpan.FromMinutes(1);
}
// FrequencyPlugin methods go here
}
For more advanced functionality pertaining to property grid customization or XML
serialization, please refer to the .NET documentation or other .NET resources.
Currently, only data storage plugins and custom frequency plugins use the new plugin
© 2015 RightEdge Systems, LLC
What's New In This Edition?
21
system. The new interface for data storage plugins to use is IDataStore. Existing plugins
which use the old IBarDataStorage interface will continue to work.
Custom Frequency Plugins
RightEdge uses frequency plugins to handle bar generation. It includes plugins for time
based, tick based, and volume based bars. Additional plugins can be created to create
other bar types. To create a frequency plugin, derive a class from the abstract
FrequencyPlugin class. This class should use public properties to define the settings for
the frequency. The actual logic for generating bars should go in a class which implements
IFrequencyGenerator and created and returned by the CreateFrequencyGenerator method
of the FrequencyPlugin.
To use a custom frequency in a system, create an instance of the frequency plugin class
and pass it to the GetFrequency method to get a Frequency object. If GetFrequency is
called multiple times for the same settings for the frequency plugin and the same symbol,
it will return the same Frequency object. For this to work even if different instances of
the frequency plugin with the same values for the settings were used, it needs to be able
to compare them to see if they are equivalent. This is why the FrequencyPlugin class
includes abstract Equals and GetHashCode methods which you must implement.
Currently, frequency plugins besides the time-based frequency can only be used from
within a system. The main system frequency, charts, and bar data storage all only use
time based frequencies.
Miscellaneous
Partial bars are now stored in the PartialItem property of the RList<BarData> class. This
means that the Current property will always contain a completed bar. There is also a
HasPartialItem property which indicates whether there is a partial bar or not.
A bar data cleaner tool has been added. It is accessible from the watchlist, and will find
and fix problems with bars in the data store. It will delete extra bars where there is more
than one bar for a given date/time, and if the time for a bar is not rounded correctly
(based on the bar frequency) it will round it. For daily bars this means it will set the time
to 12:00 midnight, for hourly bars it would round to the nearest hour, etc.
There are no longer separate SymbolBars and SystemBars. Use the Synchronize Bars
property of the trading system to control whether the bar lists should be synchronized.
© 2015 RightEdge Systems, LLC
22
3
RightEdge Help
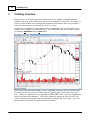
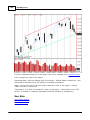
Charting Overview
Charts are one of the most important components of any trading system development
package. After all, that's where all of the action is displayed in living color. We made it a
point to create flexible chart settings and navigation with features that not only make it
easier to get from point A to point B, but to do it in style.
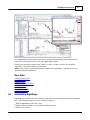
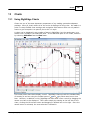
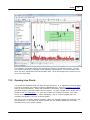
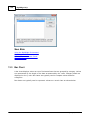
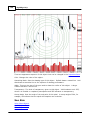
A chart can be displayed in any number of ways in RightEdge, but the easiest way is to
double click a symbol in the Watchlist pane. If the Watchlist pane is not visible, enable it
by selecting Watchlist from the View menu.
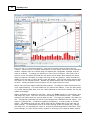
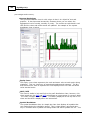
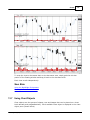
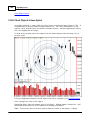
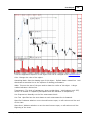
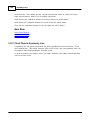
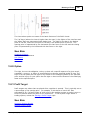
First some points about data display control. RightEdge charts provide the standard way
of zooming in and out using the toolbar buttons (
and
) to show more bars or less
bars. However, in addition to this, RightEdge will also allow a finer control by dragging the
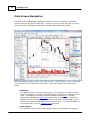
mouse over bars to be displayed. This is done simply by starting at the left side of the
chart, clicking the left mouse button and dragging to desired bar on the right. Once the
mouse button is released, the new selection is zoomed in.
© 2015 RightEdge Systems, LLC
Charting Overview
23
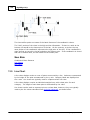
For navigation, RightEdge also provides the familiar controls, but in addition to using the
scrollbar, RightEdge makes use of the mouse wheel. Move the mouse wheel down to go
back in time and up to move forward in time.
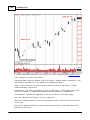
Finally, the chart package in RightEdge provides a combination of scrolling and navigating
within the X and Y axis. Both axes are broken up until thirds. If you place the mouse
cursor on left third of the X axis (date/time axis), the cursor becomes a "sizing" cursor.
Click and hold the left mouse button while moving the mouse left or right and more or less
bars will become visible in the left side of the chart. Release the mouse button when the
desired number of bars come into view. Now move the mouse cursor to the middle third of
the X axis and the cursor becomes hand with an extended index finger. Click and hold the
left mouse button and this will move the chart from left to right based on the mouse
movement. Finally, move the mouse cursor to the right third of the X axis and click and
hold the left mouse button. This will allow finer control of the bars displayed on the right
hand side of the chart. This logic holds true for the Y axis as well.
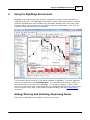
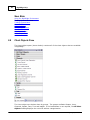
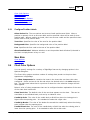
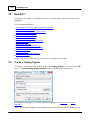
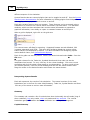
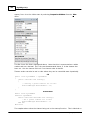
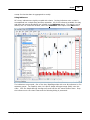
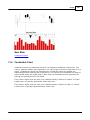
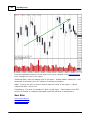
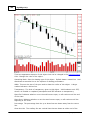
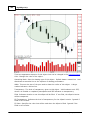
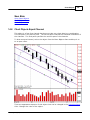
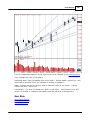
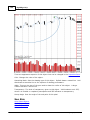
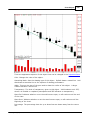
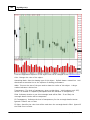
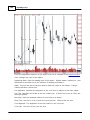
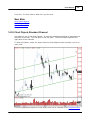
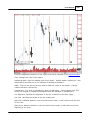
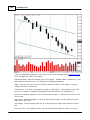
Changing Frequencies
RightEdge supports a number of frequencies. The most common frequencies are shown on
the chart toolbar alongside the zoom features discussed previously. The default is daily,
abbreviated as "1D". Click the "1D" text to display the frequency drop down. Depending
on the data that is currently loaded, the available frequencies are enabled. For example,
if the lowest frequency of the data is daily bars, anything less than one day is unavailable.
Select Weekly from the dropdown to automatically rebuild this chart with the same data
© 2015 RightEdge Systems, LLC
24
RightEdge Help
except for that bar data is aggregated to weekly.
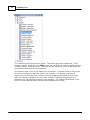
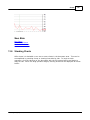
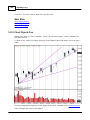
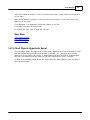
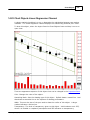
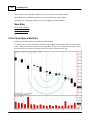
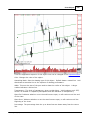
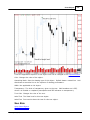
Using Indicators
Of course, indicators are tightly coupled with charts. Putting indicators onto a chart is
accomplished but a simple drag and drop operation. All of the indicators available for drag
and drop and system developers are located in the Indicators panel. This panel is on by
default, but if it cannot be located, select the Indicators menu option from View menu.
The indicators are grouped. Out of the box, RightEdge ships with over 80 indicators in five
separate groups. For simplicity sake, let's plot a simple moving average (SMA) onto this
chart. Click the Simple Moving Average once and hold the left mouse button down. Drop
the indicator onto the chart frame and the following dialog is presented:
© 2015 RightEdge Systems, LLC
Charting Overview
25
The defaults are presented and clicking OK will plot a 50 period simple moving average
onto the chart. It's that simple.
The indicator can be removed from the chart by selecting the indicator with the left
mouse button to "highlight" the indicator line and hitting the delete key. The plotted 50
day simple moving average selected is shown below.
© 2015 RightEdge Systems, LLC
26
RightEdge Help
Not all indicators are useful on the price pane of course. When dragging an indicator onto
a chart, a default pane is recommended. This pane can be named anything. If the pane
name does not exist, a new pane is created. Dragging a Relative Strength indicator onto
the chart demonstrates this.
© 2015 RightEdge Systems, LLC
Charting Overview
27
To remove user defined panes, right click in the pane and select Close Pane.
Using Chart Objects
Chart objects encompass all items that are related to shapes and not necessarily price
information. Chart objects are used to help identify or outline patterns such as support
and resistance lines or channels. Chart objects are useful to both pure technical as well
as discretionary traders. The Chart Objects pane is located in the upper left pane by
default. If the Chart Objects pane is not visible, select Chart Objects from View menu.
The Chart Objects panel breaks the objects down into logical types. Simply click an
object heading to expand the group and reveal the underlying available objects. To start,
expand the Lines group. Click the Line object and drag it onto an open chart. Release
the mouse button to establish the first point of the line. Move the mouse to change the
length and direction of the line.
© 2015 RightEdge Systems, LLC
28
RightEdge Help
Once the line is in the desired position, click the left mouse button to finish the line
creation. Once the line is created, items specific to this object will show in the properties
window. Objects that are created using this method are changeable, movable, and can
even be removed. To change the direction or size of this line object, click either end of
the line on the end points and hold the left mouse button down while moving the mouse.
When the mouse is released, the object will snap to its new position. Move towards the
middle of the line and a "hand" mouse cursor will appear. Click the left mouse button drag
the object to the desired location. Release the mouse button and it will be placed in this
location. Hitting the delete key will remove the line object from the chart.
Notice that the chart objects maintain their location. Scrolling the chart will keep the line
in its original position. The same holds true for various time frames. If the line was drawn
on a chart showing daily bars, then the chart timeframe is switched to weekly, the line will
update accordingly.
Object properties are updated in real time. Select the Color property in the property grid
and select any color. The color of the line will change to the selected color. The width
indicates how many pixels are used to draw the line. The larger the number, the wider the
line. Transparency controls how much of the background is blended with the object. The
range is 0 through 255. 0 indicates complete transparency, in other words, an invisible
object. 255 indicates that the line will be solid and the background of the chart will not
show through. To demonstrate how all of these settings effect this simple line, change
the width to 3, the transparency value to 40 and the Smoothing Mode to Anti Alias. With
these settings, it's quite obvious how a support or resistance line could be drawn without
© 2015 RightEdge Systems, LLC
Charting Overview
29
getting in the way of the price movement.
The chart objects also support basic shapes such as circles, rectangles, ellipses, and
parallelograms. Expand the Basic Shapes chart object group and drag a Rounded
Rectangle onto the chart. There are more properties for this object as shown below.
In this example, the line color was changed to dark gray. The Filled flag was set to true,
the fill color to light green and fill transparency to 120.
To demonstrate a more complicated object and show how several objects might work
together, go back to the Lines object group and drag a Fibonacci Line onto the chart.
Set the properties for this object as shown below.
© 2015 RightEdge Systems, LLC
30
RightEdge Help
The Fibonacci line draws lines at the well known Fibonacci retracement values. Stretch
the rounded rectangle to highlight these important retracements. It now becomes clear
when the price penetrates that retracement area. All of these objects are still not in the
way of the price bars.
© 2015 RightEdge Systems, LLC
Using the RightEdge Environment
4
31
Using the RightEdge Environment
RightEdge uses cutting edge user interface components so that relevant information is
available at all times. The RightEdge environment consists of dockable windows, floating
windows, dockable menus and toolbars and a document manager with "tear-away" tabs.
There are many aspects about the user interface that are customizable. First, let's get
acquainted with the panes that are available.
The illustration above shows all of the panes available in RightEdge. The most important
area of the application is the Document Area. The document area houses a variety of
documents that can be called up in RightEdge. In the above example, a chart current
exists in the document area. Other items that are considered documents are source code
files, the Project form (used in drag and drop system building) and the System Results
document.
Hiding/Pinning and Unhiding/Unpinning Panes
Each pane in RightEdge can be hidden or shown at any time.
© 2015 RightEdge Systems, LLC
32
RightEdge Help
The example above shows all of the panes in RightEdge hidden with the exception of the
Properties pane which has "flown out". The pin in the upper right hand corner, when
pressed, will make the pane a part of the current window. When unpinned, the pane will
disappear to the nearest edge of the main window. When the mouse is rolled over the
pane title, the pane will "fly out" where it can be pinned again. If unpinned and the mouse
leaves the pane area, the pane will hide itself again.
Docking Panes
Each pane in RightEdge can be hidden or shown at any time. In addition this a pane can
be docked inside of another pane or to the top, bottom, left or right of the edge of the
main window.
© 2015 RightEdge Systems, LLC
Using the RightEdge Environment
33
Use the left mouse button and click and hold the tab area of the pane. When a drag on
the tab occurs, the pane will become transparent and docking arrows will be displayed as
shown above. Move the mouse cursor on top of any of these arrows to perform the dock
operation. Hit the Escape key to cancel the drag operation. To undock a pane and
specify that it should not be docked with any other, hold the Control key before beginning
the drag operation.
Document Area
As mentioned previously, the document area will contain document like items such as
charts and source files. Documents cannot be docked within other panes, however,
documents can be split within the document area or "float". Click the tab area of the
document with the left mouse button and begin to drag the tab.
© 2015 RightEdge Systems, LLC
34
RightEdge Help
The sample above shows two charts that are stacked horizontally along with another
chart that is floating outside of the main RightEdge window.
Floating documents are particularly useful in a both a chart or source file situation,
especially in a multiple monitor environment.
Note: Pane layout is persisted between instances of RightEdge. Documents are not
persisted between instances.
See Also
Trading System Pane
Watchlist Pane
Indicator Pane
System Components Pane
Live Data Pane
Live System Pane
Chart Objects Pane
Build Output Pane
© 2015 RightEdge Systems, LLC
Developing Trading Systems in RightEdge
5
35
Developing Trading Systems in RightEdge
Developing Trading Systems in RightEdge
RightEdge supports trading systems written in Visual Basic.NET or C#. It also provides a
drag and drop system designer which can be used to create simple trading systems, or to
set up the objects (such as indicators and triggers) that your Visual Basic or C# code will
use. See the "New Trading System" and "Trading System Pane" help topics for information
about creating, opening, and managing a trading system.
Brief Introduction
This section gives a quick introduction to writing systems in RightEdge through various
examples. Later sections will go into more detail on specific topics. The samples are
shown in both C# and Visual Basic.NET.
C#
public class MySymbolScript : MySymbolScriptBase
{
public override void NewBar()
{
if (Close.Current < Open.Current)
{
// Open a position on a down bar
OpenPosition(PositionType.Long, OrderType.Market);
}
}
}
Visual Basic.NET
Public Class MySymbolScript
Inherits MySymbolScriptBase
Public Overloads Overrides Sub NewBar()
If Close.Current < Open.Current Then
' Open a position on a down bar
OpenPosition(PositionType.Long, OrderType.Market)
End If
End Sub
End Class
The NewBar method inside your symbol script class runs after each bar. If the close of
the bar is less than the open, this system submits a market order to open a long position.
You can specify the size of the position here, but if you don't it will be determined by the
allocation settings in the system properties.
In the examples that follow, we will usually just show the code that goes inside the
NewBar method, without the class and method definitions, which don't change.
© 2015 RightEdge Systems, LLC
36
RightEdge Help
C#
// We need at least two bars
if (Bars.Count < 2)
return;
if (Close.Current < Open.Current &&
Close.LookBack(1) < Open.LookBack(1))
{
// Open a position after two down bars in a row.
OpenPosition(PositionType.Long, OrderType.Market);
}
Visual Basic.NET
' We need at least two bars
If Bars.Count < 2 Then
Return
End If
If Close.Current < Open.Current AndAlso Close.LookBack(1) <
Open.LookBack(1) Then
' Open a position after two down bars in a row.
OpenPosition(PositionType.Long, OrderType.Market)
End If
This example shows how to reference previous bar data. It opens a position after two
down bars. Note that first it checks to make sure that there are at least two bars.
Without this check an error would be generated on the first bar, when the system tries to
access the previous bar which isn't available. You can use series corresponding to the bar
element you want (Open, High, Low, Close, Volume), or you can use the Bars series to
access a bar and then access its members. Use the LookBack method to access previous
values of a series. The Current method retrieves the current value of a series, and is the
same as calling LookBack(0).
C#
int testBars = 5;
int downBarsNeeded = 4;
if (Bars.Count < testBars)
return;
int downBars = 0;
for (int i = 0; i < testBars; i++)
{
if (Close.LookBack(i) < Open.LookBack(i))
{
downBars++;
}
}
© 2015 RightEdge Systems, LLC
Developing Trading Systems in RightEdge
37
if (downBars >= downBarsNeeded)
{
OpenPosition(PositionType.Long, OrderType.Market);
}
Visual Basic.NET
Dim testBars As Integer = 5
Dim downBarsNeeded As Integer = 4
If Bars.Count < testBars Then
Return
End If
Dim downBars As Integer = 0
For i As Integer = 0 To testBars - 1
If Close.LookBack(i) < Open.LookBack(i) Then
downBars += 1
End If
Next
If downBars >= downBarsNeeded Then
OpenPosition(PositionType.Long, OrderType.Market)
End If
This example shows how you can loop through the previous bars and perform some
calculation. In this case, it is counting the number of down bars over the previous 5
bars. If there are 4 or more down bars, then a position will be opened.
You can add indicators to your system by dragging them to the System Designer or to the
Trading System Pane. Once you have done so, it is easy to access them from within your
system. The following code uses an indicator named WidnerLowerBand. (or "Widner Lower
Band" - the spaces are automatically removed in the name you use to access the
indicator from your system code.)
C#
OpenPosition(PositionType.Long, OrderType.Limit,
WidnerLowerBand.Current);
Visual Basic.NET
OpenPosition(PositionType.Long, OrderType.Limit, WidnerLowerBand.Current)
This example submits a limit order with a limit price equal to the value of the
WidnerLowerBand indicator. By default, open position orders are cancelled after one bar,
so there will always be a single limit order active with a limit price equal to the value of
the WidnerLowerBand indicator on the previous bar. You can also create an indicator in
code instead of using the system designer. You just declare an indicator as a member of
your class, and initialize it in the Startup method. The following example shows how to
create a lower Bollinger Band of the close price and use it to place limit orders.
C#
© 2015 RightEdge Systems, LLC
38
RightEdge Help
public class MySymbolScript : MySymbolScriptBase
{
BollingerBandLower bbLower;
public override void Startup()
{
bbLower = new BollingerBandLower(14, 3);
bbLower.SetInputs(Close);
bbLower.ChartSettings.Color = Color.Brown;
}
public override void NewBar()
{
OpenPosition(PositionType.Long, OrderType.Limit,
bbLower.Current);
}
}
Visual Basic.NET
Public Class MySymbolScript
Inherits MySymbolScriptBase
Private bbLower As BollingerBandLower
Public Overloads Overrides Sub Startup()
bbLower = New BollingerBandLower(14, 3)
bbLower.SetInputs(Close)
bbLower.ChartSettings.Color = Color.Brown
End Sub
Public Overloads Overrides Sub NewBar()
OpenPosition(PositionType.Long, OrderType.Limit,
bbLower.Current)
End Sub
End Class
RightEdge Trading System Architecture
RightEdge trading systems use an event driven architecture. This means that when an
event (such as a new bar, filled order, or new tick) occurs, a corresponding method in the
trading system is called. This design allows the same code to be used for backtesting and
live trading. In addition, it does not provide access to price or other data "from the
future" while backtesting, preventing systems from accidentally using this data to make
trading decisions and providing unrealistic results.
RightEdge trading systems can operate on multiple symbols. When you create a trading
system, two classes will be created for you. The MySystem class is for your system-level
logic, and only one copy of this class will be created when the system is run. The
MySymbolScript class is for your symbol-level logic, and there will be a copy of this class
© 2015 RightEdge Systems, LLC
Developing Trading Systems in RightEdge
39
created for each symbol in your system symbols. Most of your code will probably go in
your symbol script class, and if you don't need to store any custom system-level data,
you may not add any code to the system class at all.
Below is what what the empty symbol script class created when you create a system will
look like.
C#
public class MySymbolScript : MySymbolScriptBase
{
public override void Startup()
{
// Perform initialization here.
}
public override void NewBar()
{
// Put your trading code here
}
public override void OrderFilled(Position position, Trade trade)
{
// This method is called when an order is filled
}
public override void OrderCancelled(Position position, Order order,
string information)
{
// This method is called when an order is cancelled or
rejected
}
}
Visual Basic.NET
Public Class MySymbolScript
Inherits MySymbolScriptBase
Public Overloads Overrides Sub Startup()
' Perform initialization here.
End Sub
Public Overloads Overrides Sub NewBar()
' Put your trading code here
© 2015 RightEdge Systems, LLC
40
RightEdge Help
End Sub
Public Overloads Overrides Sub OrderFilled(ByVal position As Position,
ByVal trade As Trade)
' This method is called when an order is filled
End Sub
Public Overloads Overrides Sub OrderCancelled(ByVal position As
Position, ByVal order As Order, ByVal information As String)
' This method is called when an order is cancelled or rejected
End Sub
End Class
Accessing Bar Data
You can access bar data using the "Bars" series, or you can use series for the Open, High,
Low, Close, and Volume. The Current property returns the current value of a series, and
the LookBack method returns previous values. Below is an example of code that computes
the difference between the current bar's open price and the previous bar's close price,
using both methods of accessing bar data.
C#
if (Bars.Count >= 2)
{
// Compute the change in price from the previous bar's close to
this bar's open
double diff = Bars.Current.Open - Bars.LookBack(1).Close;
double diff2 = Open.Current - Close.LookBack(1);
}
Visual Basic.NET
If Bars.Count >= 2 Then
' Compute the change in price from the previous bar's close to this
bar's open
Dim diff As Double = Bars.Current.Open - Bars.LookBack(1).Close
Dim diff2 As Double = Open.Current - Close.LookBack(1)
End If
Note that this code checks to make sure there are at least two total bars before trying to
access the previous bar. Without this check, the code would try to access the previous
bar the first time NewBar was called, which would cause an index out of range exception
to be thrown.
Opening a Position
To open a position, you can call the OpenPosition method. The simplest overload of this
© 2015 RightEdge Systems, LLC
Developing Trading Systems in RightEdge
41
method takes a position type and an order type. Other overloads allow you to specify a
price (for limit and stop orders), and the size of the position. If you do not specify a size,
then the allocation settings will be used to size the position. These can be modified in the
system properties, or in code via the PositionManager.UseFixedAmountPerPosition,
PositionManager.PercentPerPosition, and PositionManager.FixedAmountPerPosition
properties.
The OpenPosition method returns a Position object. There are various errors that may
occur when you try to open a position, for example if the limit price was not specified for
a limit order, or the maximum number of positions specified in the project properties are
already open. You can check if there was an error by checking the Position's Error
property. If this property is null, then the order to open the position was submitted
successfully. If there was an error, then the Error property will be a string with error
information. The code below shows how you can open a position, check if there was an
error, and if so add a warning to the output window.
C#
Position pos = OpenPosition(PositionType.Long, OrderType.Market);
if (pos.Error != null)
{
OutputWarning(pos.Error);
}
Visual Basic.NET
Dim pos As Position = OpenPosition(PositionType.Long, OrderType.Market)
If pos.Error IsNot Nothing Then
OutputWarning(pos.Error)
End If
Note that even if there is no error, the position is not yet open. The order to open the
position has been submitted to the broker, but it will be filled at a later time or perhaps
not filled at all. A position where the open order has been submitted but not yet filled is
called a pending position.
For control over more settings when opening a Position, you can create a PositionSettings
object, set its properties, and pass it to the OpenPosition method.
C#
PositionSettings settings = new PositionSettings();
settings.PositionType = PositionType.Long;
settings.OrderType = OrderType.Market;
settings.Size = 100;
settings.BarsValid = 5;
//
Open position order is valid
for 5 bars
settings.ProfitTarget = .10;
//
10% profit target
settings.ProfitTargetType = TargetPriceType.Percentage;
settings.BarCountExit = 30;
//
Close position automatically
after 30 bars
© 2015 RightEdge Systems, LLC
42
RightEdge Help
OpenPosition(settings);
Visual Basic.NET
Dim settings As New PositionSettings()
settings.PositionType = PositionType.Long
settings.OrderType = OrderType.Market
settings.Size = 100
settings.BarsValid = 5
' Open position order is
valid for 5 bars
settings.ProfitTarget = 0.1
' 10% profit target
settings.ProfitTargetType = TargetPriceType.Percentage
settings.BarCountExit = 30
' Close position
automatically after 30 bars
OpenPosition(settings)
By default, open position orders are automatically cancelled after one bar if they have not
been filled. This means that for a band violation style system, for example, you can simply
call OpenPosition on each bar with the current limit price, without having to cancel the
previous order. You can modify this behavior with the BarsValid property of the
PositionSettings. The above code submits an order that is valid for 5 bars. You can set
this property to -1 if you do not want the order to be automatically cancelled at all.
Accessing Open, Pending, and Closed Positions
You can access the list of open positions, the pending positions, and the closed positions
for the current symbol with the OpenPositions, PendingPositions, and ClosedPositions
properties of the symbol script class. The following code shows how you could close all
open positions for a symbol if the close of the current bar is less than 75% of the price of
the open.
C#
if (Close.Current < Open.Current * .75)
{
foreach (Position pos in OpenPositions)
{
pos.CloseAtMarket();
}
}
Visual Basic.NET
If Close.Current < Open.Current * 0.75 Then
For Each pos As Position In OpenPositions
pos.CloseAtMarket()
Next
End If
Position Exit Conditions
Profit target and stop loss values can be specified as a percentage gain or loss, or as a
fixed price target. Default percentage values for profit targets and stop losses can be
© 2015 RightEdge Systems, LLC
Developing Trading Systems in RightEdge
43
specified in the trading system properties. The default values can be modified from your
system code by using the PositionManager.ProfitTarget and PositionManager.StopLoss
properties. The following code sets the default profit target to 10% and the default stop
loss to 5%.
C#
PositionManager.ProfitTarget = 0.10;
PositionManager.StopLoss = 0.05;
Visual Basic.NET
PositionManager.ProfitTarget = 0.10
PositionManager.StopLoss = 0.05
This would change the defaults for new positions, but would not change the profit
targets or stop losses for any existing positions.
You can override the defaults when you call OpenPosition by setting the ProfitTarget,
ProfitTargetType, StopLoss, and StopLossType properties of the PositionOrder object.
The following code uses the close of the current bar plus the current bar's height as the
profit target.
C#
PositionSettings settings = new PositionSettings();
settings.PositionType = PositionType.Long;
settings.OrderType = OrderType.Market;
settings.ProfitTarget = Close.Current + (High.Current - Low.Current);
settings.ProfitTargetType = TargetPriceType.Price;
OpenPosition(settings);
Visual Basic.NET
Dim settings As New PositionSettings()
settings.PositionType = PositionType.[Long]
settings.OrderType = OrderType.Market
settings.ProfitTarget = Close.Current + (High.Current - Low.Current)
settings.ProfitTargetType = TargetPriceType.Price
OpenPosition(settings)
The Position class also has ProfitTarget, ProfitTargetType, StopLoss, and StopLossType
properties which tell you what the current profit target and stop loss are. You can modify
these values with the SetProfitTargetPrice, SetProfitTargetPercent, SetStopLossPrice, and
SetStopLossPercent methods. The following code sets the stop loss on all open positions
to the entry price minus 0.05.
C#
foreach (Position pos in OpenPositions)
{
pos.SetStopLossPrice(pos.EntryPrice.SymbolPrice - 0.05);
}
Visual Basic.NET
© 2015 RightEdge Systems, LLC
44
RightEdge Help
For Each pos As Position In OpenPositions
pos.SetStopLossPrice(pos.EntryPrice.SymbolPrice - 0.05)
Next
A profit target or stop loss for an open position is represented by a limit or stop order with
the broker. When you change the value, the existing order is cancelled and a new one is
submitted for the new price. Likewise, if the position size changes, RightEdge will cancel
the existing profit target and stop loss orders and submit new ones with the updated size.
In addition to the profit target and stop loss, a bar count exit can be used to
automatically close a position after a certain number of bars since it was opened. The
default value can be set in the trading system properties or with the
PositionManager.BarCountExit property. You can also set the BarCountExit property of the
PositionSettings or Position class. The BarCountExit property of the Position class
represents the number of bars remaining- it decreases by one each bar and when it
reaches zero, the position is closed.
Order Management
You can submit your own orders for a position using the Position class's SubmitOrder
method. This allows you to resize or close a position based on your own logic. Unless
otherwise specified, the order you submit will only be valid for one bar. The following line
submits an order to close half of a position.
C#
pos.SubmitOrder(pos.CurSize / 2, TransactionType.Sell, OrderType.Market,
0);
Visual Basic.NET
pos.SubmitOrder(pos.CurSize / 2, TransactionType.Sell, OrderType.Market,
0)
You can also create an OrderSettings object and pass it to the SubmitOrder method for
more control over the order that is submitted. The SubmitOrder method returns an Order
object. Similar to the Position returned from OpenPosition, the Order object has an Error
property which you can use to determine whether the call was successful, and if not,
why. If the call was successful the Error property will be null. Otherwise the Error
property be set to a string with error information.
When an order is filled, the OrderFilled method in your symbol script class will be called.
The following sample shows an example of using this method. When the initial order to
open a position is filled, it submits a limit order to double the size of the position if the
price drops 5% from the entry price of the position.
C#
public override void OrderFilled(Position position, Trade trade)
{
//
This method is called when an order is filled
if (trade.TradeType == TradeType.OpenPosition)
{
© 2015 RightEdge Systems, LLC
Developing Trading Systems in RightEdge
45
OrderSettings settings = new OrderSettings();
settings.Size = position.CurSize;
settings.TransactionType = TransactionType.Buy;
settings.OrderType = OrderType.Limit;
settings.LimitPrice = position.EntryPrice.SymbolPrice *
0.95;
settings.BarsValid = -1;
//
Order should not
time out
settings.Description = "Buy more";
Order order = position.SubmitOrder(settings);
if (order.Error != null)
{
OutputWarning(order.Error);
}
}
}
Visual Basic.NET
Public Overloads Overrides Sub OrderFilled(ByVal position As Position, ByVal
trade As Trade)
' This method is called when an order is filled
If trade.TradeType = TradeType.OpenPosition Then
Dim settings As New OrderSettings()
settings.Size = position.CurSize
settings.TransactionType = TransactionType.Buy
settings.OrderType = OrderType.Limit
settings.LimitPrice = position.EntryPrice.SymbolPrice * 0.95
settings.BarsValid = -1
' Order should not time out
settings.Description = "Buy more"
Dim order As Order = position.SubmitOrder(settings)
If order.Error IsNot Nothing Then
OutputWarning(order.Error)
End If
End If
End Sub
Similarly, the OrderCancelled method is called when an order is cancelled. The following
sample uses this method to output a warning if an order is cancelled without RightEdge
having requested the cancellation. This can happen if the broker rejects the order, or if
you manually cancel the order using another program.
C#
public override void OrderCancelled(Position position, Order order, string
information)
{
//
This method is called when an order is cancelled or
rejected
© 2015 RightEdge Systems, LLC
46
RightEdge Help
if (!order.CancelPending)
{
OutputWarning("Order cancelled unexpectedly: " +
information);
}
}
Visual Basic.NET
Public Overloads Overrides Sub OrderCancelled(ByVal position As Position,
ByVal order As Order, ByVal information As String)
' This method is called when an order is cancelled or rejected
If Not order.CancelPending Then
OutputWarning("Order cancelled unexpectedly: " + information)
End If
End Sub
The position class has an Orders property which is a list of all the pending orders. If an
open position has a profit target and a stop loss, there will be an order in this list
corresponding to each one. Any user-submitted orders will also be in the list. The
TradeType property of the Order can be used to distinguish between these types of
orders. It is an enumeration with the following values: UserSubmitted, OpenPosition,
ClosePosition, ProfitTarget, StopLoss, and TrailingStop. The following code sample
cancels all pending user-submitted orders on all open positions.
C#
foreach (Position pos in OpenPositions)
{
foreach (Order order in pos.Orders)
{
if (order.TradeType == TradeType.UserSubmitted)
{
order.CancelOrder();
}
}
}
Visual Basic.NET
For Each pos As Position In OpenPositions
For Each order As Order In pos.Orders
If order.TradeType = TradeType.UserSubmitted Then
order.CancelOrder()
End If
Next
Next
Indicators
RightEdge includes over 100 built-in technical indicators, and uses a plugin architecture
which allows you to write your own indicators or obtain them from a third party. You can
© 2015 RightEdge Systems, LLC
Developing Trading Systems in RightEdge
47
manage the indicators in your system by drag and drop in the System Designer, or you
can create them in code.
The available indicators are listed in the Indicator toolbox. If the toolbox is not visible,
you can show it by selecting "Indicators" from the view menu. To add an indicator to your
system, drag it onto the System Designer window. This window is opened automatically
when you open a system, and can be reopened from the view menu if you close it. The
settings for an indicator (such as its input values or period) are displayed below the
indicator. You can double-click on these values to change them, and the indicator name
can also be changed by double-clicking on it. You can also modify an indicator's
properties by selecting it and using the properties toolbox. In addition, the properties
toolbox will allow you to set visual settings such as the indicator color and line type.
To access an indicator from within your trading system code, simply refer to it by its
name, with spaces (and other non-permitted characters) removed. For example, if you
create a Widner Lower Band, the default name will be "Widner Lower Band", and you would
refer to it in your code as "WidnerLowerBand". Assuming you have this indicator added to
your system, the following code shows how to submit a limit order based on the indicator's
value.
C#
OpenPosition(PositionType.Long, OrderType.Limit,
WidnerLowerBand.Current);
Visual Basic.NET
OpenPosition(PositionType.Long, OrderType.Limit, WidnerLowerBand.Current)
You can copy drag and drop indicators from your system to a quick chart. The drag and
drop indicators are listed in the tree in the Trading System toolbox. You can drag them
onto a chart, or drag the "Indicators" node of the tree to add all of the trading system
indicators to a chart. If you have added some indicators to a chart and would like to
copy them to your system, you can right click on the chart and select "Add Indicators to
System."
You can also create your indicators entirely in code if you prefer. Create fields of your
trading script class for each indicator, and initialize the indicators in the Startup method.
The following example is a band violation system using a 14-period, 3 standard deviation
Bollinger Band of the close price.
C#
public class MySymbolScript : MySymbolScriptBase
{
BollingerBandLower bbLower;
public override void Startup()
{
bbLower = new BollingerBandLower(14, 3);
bbLower.SetInputs(Close);
bbLower.ChartSettings.Color = Color.Brown;
}
© 2015 RightEdge Systems, LLC
48
RightEdge Help
public override void NewBar()
{
OpenPosition(PositionType.Long, OrderType.Limit,
bbLower.Current);
}
}
Visual Basic.NET
Public Class MySymbolScript
Inherits MySymbolScriptBase
Private bbLower As BollingerBandLower
Public Overloads Overrides Sub Startup()
bbLower = New BollingerBandLower(14, 3)
bbLower.SetInputs(Close)
bbLower.ChartSettings.Color = Color.Brown
End Sub
Public Overloads Overrides Sub NewBar()
OpenPosition(PositionType.Long, OrderType.Limit,
bbLower.Current)
End Sub
End Class
As with other series, you can use the Current property to retrieve the current value of an
indicator, and the LookBack method to retrieve previous values. The ChartSettings
property of an indicator allows you to control how the indicator will be drawn on the
chart. It includes settings for the series color, display name, and line type and size. You
can set ChartSettings.ShowInChart to false if you do not want the indicator added to the
charts.
Indicator Chaining
You can use one indicator as the input for another. The following example calculates the
average true range by using a simple moving average on the true range. RightEdge does
have an Average True Range indicator built in, but it uses an exponential moving average
instead of a simple moving average.
C#
public class MySymbolScript : MySymbolScriptBase
{
public TrueRange trueRange = new TrueRange();
public SMA ATR = new SMA(25);
public override void Startup()
{
© 2015 RightEdge Systems, LLC
Developing Trading Systems in RightEdge
49
ATR.SetInputs(trueRange);
trueRange.ChartSettings.ShowInChart = false;
ATR.ChartSettings.ChartPaneName = "TrueRange";
}
}
Visual Basic.NET
Public Class MySymbolScript
Inherits MySymbolScriptBase
Public trueRange As New TrueRange()
Public ATR As New SMA(25)
Public Overloads Overrides Sub Startup()
ATR.SetInputs(trueRange)
trueRange.ChartSettings.ShowInChart = False
ATR.ChartSettings.ChartPaneName = "TrueRange"
End Sub
End Class
User Series
If you want to calculate values in your system and show them on the chart, you can use
a UserSeries. You use UserSeries in much the same way as indicators, except that you
can set the Current property, and use the SetValue method to set previous values of the
series. The following example draws a series with the change in price from the close to
the open divided by the height of the bar.
C#
public class MySymbolScript : MySymbolScriptBase
{
UserSeries mySeries;
public override void Startup()
{
mySeries = new UserSeries();
mySeries.ChartSettings.ChartPaneName = "MySeriesPane";
mySeries.ChartSettings.Color = Color.Red;
mySeries.ChartSettings.DisplayName = "My Ratio";
}
public override void NewBar()
{
mySeries.Current = (Close.Current - Open.Current) /
(High.Current - Low.Current);
}
}
© 2015 RightEdge Systems, LLC
50
RightEdge Help
Visual Basic.NET
Public Class MySymbolScript
Inherits MySymbolScriptBase
Private mySeries As UserSeries
Public Overloads Overrides Sub Startup()
mySeries = New UserSeries()
mySeries.ChartSettings.ChartPaneName = "MySeriesPane"
mySeries.ChartSettings.Color = Color.Red
mySeries.ChartSettings.DisplayName = "My Ratio"
End Sub
Public Overloads Overrides Sub NewBar()
mySeries.Current = (Close.Current - Open.Current) /
(High.Current - Low.Current)
End Sub
End Class
Working with Multiple Symbols
With RightEdge, it is easy to run your system for multiple symbols. Simply select multiple
symbols in the watchlist and run your system. When you run a system with more than
one symbol, a copy of your SymbolScript class is created for each of the symbols. This
means that your code can be written for one symbol and it will work with multiple symbols
without any extra work. However, if you do want to write logic that involves multiple
symbols, you can.
The Symbol property of the symbol script class is the symbol corresponding to that
instance (or copy) of the class. The OtherSymbols property allows you to access the
symbol script objects corresponding to other symbols. The following example does not
trade for QQQQ, but for all other symbols it opens a position if QQQQ had an up bar.
C#
if (Symbol.Name == "QQQQ")
{
//
Don't do any trading for this symbol
return;
}
BarData QQQQBar = OtherSymbols["QQQQ"].Bars.Current;
if (QQQQBar.Close > QQQQBar.Open)
{
OpenPosition(PositionType.Long, OrderType.Market);
}
Visual Basic.NET
If Symbol.Name = "QQQQ" Then
' Don't do any trading for this symbol
Return
© 2015 RightEdge Systems, LLC
Developing Trading Systems in RightEdge
51
End If
Dim QQQQBar As BarData = OtherSymbols("QQQQ").Bars.Current
If QQQQBar.Close > QQQQBar.Open Then
OpenPosition(PositionType.[Long], OrderType.Market)
End If
You can use either an instance of the Symbol class or the symbol name as a string in the
indexer for the OtherSymbols property. If the symbol wasn't included in the system run,
an exception will be thrown. In this case, if you ran the system without having QQQQ
checked in the watch list, you would get an exception that would say "No symbol found
with requested name: QQQQ."
You can also use series from other symbols as inputs. The following example uses a
DivideSeries indicator. For MSFT, this indicator is MSFT's close divided by GOOG's close,
while for GOOG, the indicator is GOOG's close divided by MSFT's close.
C#
public class MySymbolScript : MySymbolScriptBase
{
public DivideSeries Ratio = new DivideSeries();
public override void Startup()
{
if (Symbol.Name == "MSFT")
{
Ratio.SetInputs(Close, OtherSymbols["GOOG"].Close);
}
else if (Symbol.Name == "GOOG")
{
Ratio.SetInputs(Close, OtherSymbols["MSFT"].Close);
}
Ratio.ChartSettings.ChartPaneName = "Ratio";
}
}
Visual Basic.NET
Public Class MySymbolScript
Inherits MySymbolScriptBase
Public Ratio As New DivideSeries()
Public Overloads Overrides Sub Startup()
If Symbol.Name = "MSFT" Then
Ratio.SetInputs(Close, OtherSymbols("GOOG").Close)
ElseIf Symbol.Name = "GOOG" Then
Ratio.SetInputs(Close, OtherSymbols("MSFT").Close)
© 2015 RightEdge Systems, LLC
52
RightEdge Help
End If
Ratio.ChartSettings.ChartPaneName = "Ratio"
End Sub
End Class
Note that you will get an error if you include any symbols besides GOOG and MSFT when
you run this system, because the inputs to the DivideSeries indicator would not be set. If
you use an indicator from one symbol as an input to an indicator for another symbol, you
need to make sure the indicator has been created before you use SetInputs to set it as
an input to another indicator. The easiest way to do this is to call the constructor on the
same line you declare the indicator, and call the SetInputs method from the Startup
method.
© 2015 RightEdge Systems, LLC
Analyzing System Results
6
53
Analyzing System Results
The System Results screen contains a great deal of information and also a great deal of
flexibility when deciding how to utilize the information. This topic will deal with
interpreting the information as well as managing it for your needs with features such as
exporting and printing. This section is broken up into two main areas. The first area
describes the functionality presented within the system results and the second area goes
into detail about the information that is presented.
1. Manipulating System Results
2. Interpreting System Results
a. Summary
b. System Parameters
c. Position List
d. Trade List
e. Symbol Results
f. Scan
g. Charts
Manipulating System Results
When a simulation has completed, the system results are displayed in the document area
of RightEdge. The System Results document contains multiple tabs each assessing
different aspects of the simulation.
System Results tabs are external plugins that can be toggled on and off. See the System
Results screen documentation for more information on loading plugins from third parties
and toggling existing system result screens on and off.
Each tab contains features that are common. These features can be accessed using a
combination of items on the context menus and items in the main menu. The statistics
windows, which are those windows that contain textual information as opposed to
graphical information, have ability to export to common formats as well as print.
When a grid is displayed, right click on the grid area.
This context menu will allow for exporting. Supported formats are tab delimited, CSV
(common separated) and HTML. This menu also facilitates displaying system results
charts that are not displayed by default. For more information on configuring system
results default charts, see System Results Options.
Each of the grids can also be printed. Select the desired tab and select Print... from the
File menu.
The grids columns for the Trade List, Symbols Results and Scan tabs can also be
manipulated and sorted. To sort, click any of the column headings. Click once to sort
© 2015 RightEdge Systems, LLC
54
RightEdge Help
ascending and click the same column again to sort descending. To move a grid column
into another position, click the column heading and hold the left mouse button down.
Drag the column to the desired location and release the mouse button.
Interpreting System Results
Each tab represents the results of the simulation. The textual versions of the result
breakdowns are in the first four tabs titled Summary, Trade List, Symbol Results and Scan.
Click any of the areas to retrieve more information.
Summary
The summary tab contains a list of totals broken down horizontally into all trades (long &
short combined), long only trades, short only trades and buy and hold. The vertical
breakdown groups information about this simulation into manageable categories.
Capital Summary
Starting Capital
The amount of capital set in the simulation
to begin with.
Ending Capital
The total amount of capital that is in the
account after all trades are placed. This will
include the starting capital.
Net Profit ($)
The total amount of profit or loss
represented as currency.
Net Profit (%)
The total amount of profit or less
represented as a percentage against the
starting capital.
APR
The calculated annual percentage return of
the profit or loss.
Exposure
The average exposure of capital to the
market.
System Totals
Number of Trades
Maximum Profit
Maximum Loss
Average Profit ($)
The total number of trades the simulation
opened.
The highest profit achieved for all trades in
the group.
The largest loss encountered over all trades
in the group.
The average profit from a currency
standpoint over all trades in the group.
© 2015 RightEdge Systems, LLC
Analyzing System Results
Average Profit (%)
Average Bars Held
Maximum Exposure
Max Exposure (%)
Max Exposure Date
Max Exposure (%) Date
Max Drawdown ($)
Max Drawdown (%)
Max Drawdown Date
Max Drawdown (%) Date
55
The average profit from a percentage
standpoint over all trades in the group.
The average number of periods that a
position was held over all trades in the
group.
The maximum value exposed to the market
represented as currency.
The maximum value exposed to the market
represented as a percentage.
The date when the maximum currency
exposure occurred.
The date when the maximum percentage
exposure occurred.
The maximum drawdown encountered during
this simulation represented as currency.
The maximum drawdown encountered during
this simulation represented as a percentage.
The date when the maximum currency
drawdown occurred.
The date when the maximum percentage
drawdown occurred.
Winning Totals
Winning Trades
The number of trades where the profit is
greater than 0. Trades that break even are
considered losing trades.
Winning %
The percentage of trades where the profit is
greater than 0.
Gross Profit
The total amount of profit represented as
currency.
Average Profit ($)
The average amount of profit represented
as currency.
Average Profit (%)
The average amount of profit represented
as a percentage.
Average Bars Held
The average number of periods each winning
position was open.
Consecutive Winners
The number of winning trades in a row.
Losing Totals
Losing Trades
Losing %
Gross Loss
Average Loss ($)
© 2015 RightEdge Systems, LLC
The number of trades where the profit was
less than or equal to 0. Trades that break
even are considered losing trades.
The percentage of trades where the profit is
than or equal to 0.
The total value lost represented as
currency.
The average amount lost represented as
56
RightEdge Help
Average Loss (%)
Average Bars Held
Consecutive Losers
currency.
The average amount lost represented as a
percentage.
The average number of periods each losing
position was open.
The number of losing trades in a row.
System Parameters
This tab contains information about this particular system run.
Run Date
The date and time the system was run.
Run Length
The amount of time taken to complete the
system execution.
System Parameters
This contains a list of all optimization
parameters contained within the system and
the value of those parameters for this run.
Position List
The position list contains each trade aggregated into its respective position. Positions are
nothing more than a grouping of trades. This screen shows the trades grouped by
position.
This position list is split into two pieces. The top portion of the screen contains the list of
positions established throughout the system. When a position is clicked or selected, the
trades that are associated with this position are shown in the trade list below.
Position List Columns
Symbol
Type
Shares
Open Date
Close Date
Avg Entry
Avg Exit
Bars Held
P/L Bar
P/L
The tradable symbol name.
The position type taken, long or short.
The maximum number of shares or contracts
held throughout the lifetime of this position.
The date the first trade was made for this
position.
The date the position was completely
liquidated.
The weighted average of opening trades in
this position
The weighted average price that the shares
or contracts were closed/covered at.
The number of periods the position was
open.
The average amount gained or lost on a per
bar basis.
The total amount gained or lost throughout
© 2015 RightEdge Systems, LLC
Analyzing System Results
Description
57
the life of the position.
The user assigned name of this position.
Trade List
The trade list contains the complete list of every trade generated by the simulation.
Trade List Columns
Symbol
The tradable symbol name.
Type
The type of transaction, either buy, short,
sell or cover.
Transaction Date
The date the trade was placed.
Shares
Number of shares or contracts that were
filled in this transaction.
Price
The fill price of the trade.
Commission
The cost of commissions for this trade.
Amount
The amount of capital added or deducted
from the account for this trade.
Description
The user assigned name given to this trade.
Cash
The amount of cash available in the account
after this transaction was completed.
Symbol Results
The symbol results tab contains an aggregated list of the trades. The trades are
aggregated by symbol. This provides a way to quickly determine which symbols are
performing and which are not.
Symbol Results Columns
Symbol
Profit
Profit per Bar
Trades
Winners
Losers
Winning %
© 2015 RightEdge Systems, LLC
The tradable symbol name.
The amount gained or lost for this symbol.
The amount gained or lost averaged over
the number of bars held.
Total number of trades entered with this
symbol.
The number of trades with a profit greater
than 0.
The number of trades with a profit less than
or equal to 0.
The number of winning trades divided by the
number of losing trades.
58
RightEdge Help
Avg Bars Held
The average number of periods each
position was open.
Scan
The scan tab is useful for determining the next action that the simulation would take. For
example, if the system trades daily bars, the scan would show the next day's actions to
be taken such as opening a new position or closing an existing position. Theoretically, a
daily, weekly or monthly time frame trader can use the results from the scan and generate
orders manually.
Scan Columns
Date
The date that the action should occur.
Order Type
The type of order to be submitted to the
broker. This could be any number of the
order types supported by RightEdge.
Symbol
The tradable symbol name.
Order Price
If this is a limit order, the price of the limit
order will be specified here.
Winners
The number of trades with a profit greater
than 0.
Losers
The number of trades with a profit less than
or equal to 0.
Winning %
The number of winning trades divided by the
number of losing trades.
Charts
While the grid based system results are opened after every simulation, the chart tabs can
have any number of charts pull up. There are a number of potential chart tabs and the
default chart tabs are configurable under the Options dialog.
RightEdge ships with five charts.
Profit Distribution
The Profit Distribution chart breaks down the profit and loss values into scaled
values. A sample profit distribution chart is shown below.
© 2015 RightEdge Systems, LLC
Analyzing System Results
59
Use the Display dropdown to toggle between representing the chart in profit and loss
percentages and currency.
System Breakdown
The system breakdown chart is a bit unique in that it is a hybrid of text and
graphics. It also has some interactivity features where you can select the
aggregation level of weekly, monthly or yearly. The results are calculated in real
time and the chart and results areas are updated. An example of the system
breakdown chart is below.
© 2015 RightEdge Systems, LLC
60
RightEdge Help
Equity Curve
The equity curve chart represents the cash and asset value at each point during
simulation. This is a visual way of assessing drawdown and exposure. The Buy
and Hold account value is represent as a line displayed over the cash and asset
value stacked series.
MAE / MFE
This chart is similar in look and feel to the profit distribution chart, however, this
chart breaks out the MAE and MFE calculations on a percentage or currency basis.
The chart is broken into two pieces. The MAE is displayed on the top half of the
chart and the MFE is displayed on the bottom half.
Symbol Breakdown
The symbol breakdown chart is a simple pie chart that displays all symbols that
took trades during the simulation period. This is chart allows a quick and easy
way to visualize which symbols are taking trades and which symbols are not. This
can help identify and prune "dead" symbols.
See Also
General Options
© 2015 RightEdge Systems, LLC
Technical Indicator List
7
61
Technical Indicator List
RightEdge ships with a robust set of technical indicators out of the box. The RightEdge
developers assembled the most commonly used indicators so that a system developer can
be productive quickly. Below is a list of technical indicators that have shipped with the
product. Click on the indicator name to receive an overview of the indicator. Each
overview also contains sample code to use the indicator in a trading system.
Accumulation/Distribution
Accumulation Swing Index
Add Series
ADX
ADXR
Aroon Down
Aroon Oscillator
Aroon Up
Average Price
Average True Range (ATR)
Balance of Power
Bollinger Band (Lower)
Bollinger Band (Upper)
Center of Gravity Oscillator
Chaikin Money Flow
Chaikin Oscillator
Chaikin's Volatility
Chande Momentum
Commodity Channel Index
Commodity Selection Index
Constant
Detrended Price Oscillator (DPO)
DI Minus (DI-)
DI Plus (DI+)
Divide Series
Donchian Channel (Lower)
Donchian Channel (Upper)
Double Exponential Moving Average
DX
Dynamic Momentum Index
Ease of Movement
Exponential Moving Average (EMA)
Envelope (Lower)
Envelope (Upper)
Forecast Oscillator
Historical Volatility
Intraday Momentum Index (IMI)
Keltner (Lower)
Keltner (Upper)
Klinger Oscillator
Linear Regression Indicator
© 2015 RightEdge Systems, LLC
62
RightEdge Help
Linear Regression Slope
Linear Regression Trendline
MACD
Market Facilitation Index
Mass Index
Median Price
Momentum
Money Flow Index
Multiply Series
Negative Volume Index
On Balance Volume
Parabolic SAR
Performance
Positive Volume Index
Price and Volume Trend
Price Channel (Lower)
Price Channel (Upper)
Price Oscillator
Price Rate-of-Change
Projection Bands Lower (Widner)
Projection Bands Upper (Widner)
Projection Oscillator (Widner)
Qstick
R-Squared
Range Indicator
Relative Momentum Index
Relative Strength Index (RSI)
Relative Vigor Index
Relative Volatility Index
Shift Series
Simple Moving Average (SMA)
Standard Deviation
Standard Deviation (Lower)
Standard Deviation (Upper)
Standard Error
Standard Error Band (Lower)
Standard Error Band (Upper)
Standard Error Channel (Lower)
Standard Error Channel (Upper)
Stochastic Momentum Index
Stochastics (Fast)
Stochastics (Slow)
Stochastics RSI (StochRSI)
Subtract Series
Swing Index
Time Series Forecast
Tirone Level (Lower)
Tirone Level (Upper)
© 2015 RightEdge Systems, LLC
Technical Indicator List
Triangular Moving Average
Triple Exponential Moving Average
TRIX
True Range
Ultimate Oscillator
Variable Moving Average (VIDYA)
Vertical Horizontal Filter (VHF)
Volume Adjusted Moving Average
Volume Oscillator
Volume Rate-of-Change
Weighted Close
Weighted Moving Average
Wilders Smoothing
Williams Accumulation Distribution
Williams %R
ZigZag
© 2015 RightEdge Systems, LLC
63
64
RightEdge Help
8
RightEdge Environment
8.1
Using the RightEdge Environment
RightEdge uses cutting edge user interface components so that relevant information is
available at all times. The RightEdge environment consists of dockable windows, floating
windows, dockable menus and toolbars and a document manager with "tear-away" tabs.
There are many aspects about the user interface that are customizable. First, let's get
acquainted with the panes that are available.
The illustration above shows all of the panes available in RightEdge. The most important
area of the application is the Document Area. The document area houses a variety of
documents that can be called up in RightEdge. In the above example, a chart current
exists in the document area. Other items that are considered documents are source code
files, the Project form (used in drag and drop system building) and the System Results
document.
Hiding/Pinning and Unhiding/Unpinning Panes
Each pane in RightEdge can be hidden or shown at any time.
© 2015 RightEdge Systems, LLC
RightEdge Environment
65
The example above shows all of the panes in RightEdge hidden with the exception of the
Properties pane which has "flown out". The pin in the upper right hand corner, when
pressed, will make the pane a part of the current window. When unpinned, the pane will
disappear to the nearest edge of the main window. When the mouse is rolled over the
pane title, the pane will "fly out" where it can be pinned again. If unpinned and the mouse
leaves the pane area, the pane will hide itself again.
Docking Panes
Each pane in RightEdge can be hidden or shown at any time. In addition this a pane can
be docked inside of another pane or to the top, bottom, left or right of the edge of the
main window.
© 2015 RightEdge Systems, LLC
66
RightEdge Help
Use the left mouse button and click and hold the tab area of the pane. When a drag on
the tab occurs, the pane will become transparent and docking arrows will be displayed as
shown above. Move the mouse cursor on top of any of these arrows to perform the dock
operation. Hit the Escape key to cancel the drag operation. To undock a pane and
specify that it should not be docked with any other, hold the Control key before beginning
the drag operation.
Document Area
As mentioned previously, the document area will contain document like items such as
charts and source files. Documents cannot be docked within other panes, however,
documents can be split within the document area or "float". Click the tab area of the
document with the left mouse button and begin to drag the tab.
© 2015 RightEdge Systems, LLC
RightEdge Environment
67
The sample above shows two charts that are stacked horizontally along with another
chart that is floating outside of the main RightEdge window.
Floating documents are particularly useful in a both a chart or source file situation,
especially in a multiple monitor environment.
Note: Pane layout is persisted between instances of RightEdge. Documents are not
persisted between instances.
See Also
Trading System Pane
Watchlist Pane
Indicator Pane
System Components Pane
Live Data Pane
Live System Pane
Chart Objects Pane
Build Output Pane
8.2
Automating RightEdge
RightEdge can perform high level tasks by specifying certain parameters on the command
line. The following tasks can be performed on startup.
Open a RightEdge Project file (.rep)
Update historical data for a particular Watchlist folder
Start a live system.
© 2015 RightEdge Systems, LLC
68
RightEdge Help
Start collecting live data.
Run a simulation.
The command line options to perform these tasks are listed below. You can always run
RightEdge from the command line with a '/?' parameter to see a summary of the commands
as well as a description.
Usage:
RightEdge.exe /W:"Watchlist Folder Name" [/P:"Project File"] [/L] [/S] [/U] [/E] [/
O:"Optimization Inputs File"]
/W:
/P:
/L
/U
/S
/D
/E
/O:
Specifies the Watchlist Folder. This is a required parameter.
Project File. Specifies the .rep to load when running a live system or simulation.
Executes a live system using the specified project. This may not be used with /S.
Will perform a historical data update on the Watchlist folder name specified.
Executes a simulation on the specified watchlist folder using the specified project.
Start live data collection. Note: This is started automatically if running a live
system.
Shut RightEdge down upon task completion.
Specifies an unattended optimization run using the specified file. (see below for
input file format)
Additional notes on command line switches
Optional parameters are in brackets.
Items shown in quotes should contain quotes to ensure that spaces contained the within
the parameters are properly accounted for.
If a live system or simulation is not specified and a project file is specified. The project
file will open. However, a project file is absolutely required if a simulation or live system
run is specified.
A project file (.rep) can be specified all by itself on the command with no switches.
RightEdge will start up and simply open this trading system project file.
If running an optimization, the optimization inputs are required on the command line using
the /O: option. The list of parameters can be comma or tab separated but must be in the
following order:
Parameter Name, Low, High, Number of Steps.
For example, to specify the optimization inputs for a system that has an optimization
parameter named "MyOptVar", the file would look like this:
MyOptVar,10,100,10
This would specify that the optimization value starts at 10 and ends at 100 with a step
increment of 10.
Order of Operation Evaluation
© 2015 RightEdge Systems, LLC
RightEdge Environment
69
Project file is opened
Watchlist folder is selected
Historical data is updated
Either a simulation or a live system is run.
8.3
Watchlist Pane
Manipulating and Using Watchlists
Updating Watchlist Data
The Watchlist pane is arguably the most important pane in RightEdge. This pane is the
central point for collecting historical and live data, backtesting, and starting live systems.
The Watchlist groups items together in logical forms as dictated by the user.
RightEdge ships with a couple of watchlist folders defined. The example above shows the
power and intuitiveness of the watchlist as the number of symbols increases and the
number of trading vehicles increases. Shown above is a collection of indexes, stocks, and
forex folders. Some are real time, some are historical.
Manipulating and Using Watchlists
A folder is created by right clicking any other folder or the top level node in the watchlist.
© 2015 RightEdge Systems, LLC
70
RightEdge Help
Select New Folder to begin the process and type the desired folder name. Folders can
contain any number of folders and a folder can contain any number of symbols. The
checkboxes next to each symbol indicate that any action requested will be performed on
the selected symbols. For example, to run a simulation on the Nasdaq 100, click the
checkbox next to the Nasdaq 100 folder. This will check all symbol items underneath the
folder. Individual symbols can be toggled as well. When starting a live system, the
selected symbols are loaded into the live data pane and the live system will load these
symbols into memory for processing.
To add symbols to the newly created folder, right click on the folder and select Configure
Folder.
Symbols are added and removed from the Symbols box. Please see the Symbol Folder
Settings topic for detailed information.
When OK is clicked, the symbol items will be added underneath the folder in the watchlist.
Right clicking on a symbol displays a different set of options.
© 2015 RightEdge Systems, LLC
RightEdge Environment
71
Symbol Information Displays the Symbol Information dialog to configure the individual
symbol.
Symbol Notes Allows for free form text notes to be associated with this symbol.
Research Symbol This menu is available based on items configured in the Research tab
under Options. It allows research to be performed using external resources specific to this
symbol.
Quick Chart This option will display a vanilla price and volume chart in the document area
for the selected symbol.
Quick Chart (With Chart Settings) This option is populated when there are previously
saved charts available. See Saved Charts for more information.
Bar Data Editor Displays the bar data editor for access to the raw price values stored
for this symbol. See the Bar Data Editor section for more information.
Tick Data Editor Displays the tick data editor for access to the raw tick values stored for
this symbol.
Tick Data Editor Specify Range Displays the tick data editor for the specified date
range. This is useful when the store contains a significant amount of data and loading all
© 2015 RightEdge Systems, LLC
72
RightEdge Help
of it is not feasible.
Check Bar Data For Problems Runs a series of checks on bar data to find duplicate
bars, bars out of sequence, data range issues and more.
Export Bar Data Facilitates exporting the raw price and volume data into a text file.
Clone Symbol Creates a copy of the selected symbol complete with all settings.
Remove Symbol Deletes the selected symbol from this folder. Symbol items can also be
deleted under the General tab of the Symbol Folder Settings.
Updating Watchlist Data
In the case of historical data, the Watchlist can control data updates. For instance, if a
watchlist for the Nasdaq 100 was created with a frequency of Daily, at the end of the day
it would be necessary to update the data in this folder manually. To do so, use the
toolbar located at the top of the Watchlist.
The first button will update all historical data for all symbols indiscriminately. The second
button will update the symbols that are checked. The third button will export the raw
data for the selected symbols. Data is exported in a tab delimited format in the following
order:
Symbol Date Open Close High Low Volume Open Interest
See Also
Using the RightEdge Environment
Trading System Pane
Indicator Pane
System Components Pane
Chart Objects Pane
Live Data Pane
Live System Pane
Build Output Pane
8.4
Trading System Pane
The Trading System pane contains an open trading system project. RightEdge can do
some basic things functions such as collect historical, display charts and indicators, but a
trading system is what truly exposes the power in RightEdge. There are two ways to
begin working with a trading system. To create a new trading system select New from
the File menu and click the Trading System... menu item. See the New Trading System
topic for more information about the fields in this dialog. The second option is to open an
existing trading system. Select Open Trading System from the File menu and select a
RightEdge project file.
© 2015 RightEdge Systems, LLC
RightEdge Environment
73
Note: RightEdge project files have a .rep file extension.
Once a trading system is opened, the trading system pane is populated as shown below.
© 2015 RightEdge Systems, LLC
74
RightEdge Help
Working With an Open Trading System
When the Project node (the topmost level tree item) is selected, project properties are
displayed in the properties pane. The properties grid contains all of the project properties.
See the Trading System Properties and Project Properties dialog for further information.
The References node contains all of the external assemblies that are referenced in this
project.
The Indicators node contains all of the indicators that are associated with the project.
Indicator items can be dragged from the Indicator Pane and dropped onto the Indicators
node. When indicators are selected on this node, properties for the indicators are
displayed in the Properties pane.
The remaining items in the project are the files used to build the trading system. In the
case of drag and drop systems or a trading system that has been previously exported,
there may be nothing of consequence here. When source files do exist, double click on
the file to open the file. It will be displayed in the document area.
Each item in the project tree contains a context menu. For example, right clicking on a
source file gives relevant options such as Copy, Delete, Rename, etc. References and
Indicators are only given the Remove option which removes them from the project (and
does not permanently delete them).
Running the Trading System
Once a trading system is created or opened, an additional menu is created within
RightEdge. This top level menu item is titled "Build".
Compile If the project contains source files, this will invoke the appropriate compiler to
find and report any source code errors. The compilation status is reported in the Build
Output Pane.
Run Backtest This will compile the trading system and run a backtest or simulation with
the currently selected symbols.
Run Live This will compile the trading system and begin running it against live data. If
live data is not started, it will be started automatically.
Stop Live This item is enabled when a system is running live. This will stop the system
and live data.
See Also
Using the RightEdge Environment
Trading System Properties
Project Properties
Watchlist Pane
System Components Pane
Live Data Pane
Live System Pane
Chart Objects Pane
© 2015 RightEdge Systems, LLC
RightEdge Environment
8.4.1
75
Trading System Properties
Trading system properties are values that can be manipulated in the user interface before
a system run. Some of these values will also dictate defaults for frequent actions such as
opening a position, settings a stop loss, etc. These items are global in nature, meaning
that they are not symbol specific. If any of these settings need to be symbol specific, it
is recommended that the global option is disabled and that symbol specific handling is
done in code. For example, if symbol specific risk management or funds allocation is
desired, these are dynamic cases that should be handled in the system code itself. For
more information about handling position management manually, see the Order
Management heading under the Developing Trading Systems in RightEdge topic.
Lead Bars This is the number of bars to skip before the system begins taking trades. A
setting of 0 means trades are accepted immediately. This setting can be greater than 0 if
there are indicators or other items that require a certain number of bars before they can
be calculated.
Data Start Date The date that historical data will start being fed to the trading system.
By default (empty data start date), the first bar encountered in the data store is when
the data begins being fed to the trading system.
Trade Start Date The first date when trades will be accepted. By default (empty trade
start date), the first date of data is also the first date trades will be accepted.
Simulation End Date A forced stop date of the simulation. If more data exists, it will
not be fed to the simulation loop.
Starting Capital The initial amount of capital dedicated to the system.
Live Lead Bars The number of bars to skip before trades will be accepted when the
system is running live. This setting is ignored in simulation.
Live Data Date The start date that historical data will be loaded in a live trading system.
Frequency The frequency of this trading system. The default setting, Automatic, will
detect the frequency based on the data loaded. To override this, select a different
frequency from the list. For more information about configuring frequencies, please see
the Managing Frequencies topic.
Tick-level Simulation Indicates whether or not to use tick data if the data is available.
If this data is available and this option is enabled, trading systems will receive NewTick
notifications in simulations. Live systems always receive tick notifications when hooked up
to a live data source.
Note: If enabled, this may increase load time and slow down the overall simulation.
Synchronize Bars Indicates whether or not bars are kept in sync across symbols. For
example, if symbol XXX trades on 1/3/2009 and symbol YYY does not, an empty bar is
inserted for symbol YYY so that the historical data lists are kept in sync. If this is
disabled, there would be no bar for YYY on that trade date.
Allocation Amount of capital put towards newly created positions.
© 2015 RightEdge Systems, LLC
76
RightEdge Help
Allocation Type
Percentage
Allocates a percentage of the total portfolio for every position opened. For example, if
the system has a starting capital of $100,000 and the percentage is set to 10%, the first
open position would allocated $1,000. As the account value grows or shrinks, the
percentage allocated to each position would also grow or shrink.
Fixed Value
Allocates a fixed amount to each position regardless of account size. For example, if
system has a starting capital amount of $100,000 and a fixed size of $50,000 per position,
the system could only have 2 open positions with an account size of $100,000. If this
dips below $50,000, the system will stop taking trades.
Fixed Size
Allocates a fixed unit size per position. In the case of stocks, a fixed number of shares
would be used per position (assuming the required capital is available). In futures and
options, a fixed number of contracts.
Allocation Amount of capital put towards newly created positions.
Bar Count Exit Specifies the number of bars after which a position should be closed if it
hasn't already been closed by another order. By default, this is 0, which means that a
position will never be closed after a particular number of bars have elapsed.
Force Round Lots This property will tell the system to only submit orders using round
lots (i.e. a share count rounded to the nearest 100).
Max Open & Max Open Per Symbol The number of total number of open positions and/
or the number of open positions per symbol.
For example, if the Max Open value was set to 3 and the Max Open Per Symbol was set to
1 and we had the following situation:
2 open positions, 1 for symbol YY and another for symbol XX. If a buy signal occurred for
YY, the trade would be declined because we already have our maximum number of open
positions per symbol. If on the other hand, a signal was generated for symbol ZZ, the
trade would be accepted. However, we have now hit our maximum limit for Maximum
Open, so all further trades would be declined until any of the open positions were closed.
Profit Target An automatic, global profit target value assigned to newly created
positions. This can be overridden in code, but by default, this profit target value will be
applied to positions. Valid values are:
Relative Ratio This setting will take the value placed in the Profit Target setting and
multiply the asset's current price. For example, to set a relative profit target of 5%, the
PT value must be 0.05.
Relative Price This setting will take the value placed in the Profit Target setting and add
(for a short) or subtract (in the case of a long) it the asset's current price. For example,
to set a profit target that is $1 above the current price, the PT value would be 1.
Relative Ticks This setting will take the value placed in the Profit Target setting and add
© 2015 RightEdge Systems, LLC
RightEdge Environment
77
(for a short) or subtract (in the case of a long) the specified number of ticks when setting
the profit target. This is particularly useful for futures or other leveraged instruments
where a profit target represented as a percentage or price does not make sense.
None Automatic profit target orders are turned off.
Stop Loss An automatic, stop loss value assigned to newly created positions. This can
be overridden in code, by default, this stop loss value will be applied to positions. Valid
values are Relative Ratio, Relative Price, Relative Ticks and None. See above for detailed
descriptions of what these settings mean.
Restrict Orders Sent This property specifies whether the "maximum open positions"
settings should limit the number of position open orders submitted. For example, if there is
a maximum open position setting of two and there is one open position and an additional
limit order submitted, if the restrict setting is set to true, any subsequent orders will be
rejected until the limit order is cleared. If it is set to false, open orders are ignored in the
count and only truly open positions are counted.
System / Optimization Parameters System parameters can be set inline. Click the
Add System Parameter link to add a new system parameter. The parameter is created
inline where it can be named and the default, high and low values can be assigned. Steps
indicates the increment value. For example, with a low value of 1, a high value of 10 and
a step parameter of 1, this would indicate that by itself, this optimization parameter would
create 10 iterations. See the Optimization Overview topic for a complete overview.
See Also
Developing Trading Systems in RightEdge
Managing Frequencies
Optimization Overview
Optimization Parameters
***
8.5
Indicators Pane
The indicator pane (shown below) contains all of the technical indicators that are
available in RightEdge.
© 2015 RightEdge Systems, LLC
78
RightEdge Help
The indicators are broken down by groups. The default groups are Momentum, Trend,
Volatility, Volume and Other. The Other group is a catch all that contains indicators such
as Add, Subtract, Divide and Shift. While not actually indicators, these simple operations
are commonly performed on true indicators.
The indicator pane serves as the master list of indicators. Indicator items in this list can
be moved or assigned to different areas of the program. For example, if a chart is
displayed in the document area, indicators can be dragged and dropped onto the chart.
When an indicator is dropped onto the chart, a dialog is displayed prompting for the
parameters for the indicator as well as visual settings. The example shown below is the
result of a lower Bollinger Band indicator being dropped onto a chart.
© 2015 RightEdge Systems, LLC
RightEdge Environment
79
Please see Indicator Parameters for further details about this dialog.
Once an indicator is dropped onto the chart, the indicator and visual settings can be
manipulated in real time using the Properties pane.
Indicator Plugins
RightEdge supports the use of indicator plugins written by third parties. You may even
create your own indicator plugin. The plugin will be displayed in the list along with
native RightEdge indicators.
Consult the RightEdge Developer's Guide for additional information regarding
development of third party indicator plugins.
Finally, once indicators are placed on the chart and the desired parameters are set, charts
can be saved with the indicators configured so that they may be restored at a later time.
See the Saving Charts topic for more information.
See Also
Using the RightEdge Environment
Trading System Pane
Watchlist Pane
System Components Pane
Chart Objects Pane
Live Data Pane
Live System Pane
© 2015 RightEdge Systems, LLC
80
RightEdge Help
Build Output Pane
8.6
Bar Data Editor
The Bar Data Editor allows direct modification of the underlying symbol data. This editor is
used when the price data needs to be modified manually for any number of reasons such
as a stock split or data that was downloaded and was erroneous from the provider and
must be corrected.
This screen is displayed by right clicking on a symbol in the Watchlist pane. The data
appears in the document area. The sample above shows the bar data displayed in a grid.
The items in the grid can be sorted by clicking the heading portion of the grid. Dates are
entered in a free form manner and are sensitive to locales.
Modifying Bar Data
A Bar menu is added to the main window when the bar data editor is active. The same
menu may also be displayed by right clicking on the bar data editor itself.
Add Bar Adds a new row to the bottom of the grid. Fill in the values to complete the
addition of the new bar.
Remove Bar
Removes the currently selected bar or bars.
Stock Split Displays the stock split dialog to split the prices. The split dialog will prompt
© 2015 RightEdge Systems, LLC
RightEdge Environment
81
for the split date and the split factor. For example, if IBM was scheduled to split 3 for 2
on January 1st, 2007, the split becomes effective that date. All data before the split date
will have to be adjusted.
Export Bar Data This provides a way to export the data displayed in the grid. The data
is exported into a tab delimited file using the filename specified.
The data is exported in the following order:
Date Open Close High Low Volume Bid Ask Open
Interest
The data is always sorted by date regardless of the current sort in the bar data editor
grid.
Using the Grid Control
The data above is displayed within a grid control. The grid control displays data in a
series of rows and columns. The grid control contains two areas, a selection area and the
display area. The selection shows which rows are currently selected and allows the
selection to be changed. There are two ways to change the selection. The first way is
by selecting a row and holding down the Shift key and using the up and down arrows to
select rows above or below the current selection. The second way is by using the mouse
to click and drag over the desired rows within the selection area of the grid.
Inserting items can also be accomplished by scrolling to the bottom of the grid and clicking
the data area in the star ( ) row. When data editing begins, RightEdge will fill in all fields
with default values.
Deleting one or more rows is accomplished by selecting the row or rows as outlined above
and hitting the Delete key. The selected rows will be removed from the data.
Note: Data additions or removals are not committed to the data store until Save is
selected.
Each of the columns in the grid can be sorted by clicking their corresponding header. For
example, to sort the data in the grid by the opening price, click the column labeled Open.
An arrow will be drawn within the header to indicate the direction of the current sort.
Click the header again to invert the sort.
See Also
Indicator Pane
Watchlist Pane
8.7
System Components Pane
The System Components pane lists the triggers and actions that can be added to a
trading system. To add a camponent, drag it from the System Components pane to the
System Designer. See the Trading System Overview for more information.
© 2015 RightEdge Systems, LLC
82
RightEdge Help
See Also
Using the RightEdge Environment
Trading System Overview
Trading System Pane
Watchlist Pane
Indicator Pane
Chart Objects Pane
Live Data Pane
Live System Pane
Build Output Pane
8.8
Chart Objects Pane
The chart objects pane (shown below) contains all of the chart objects that are available
in RightEdge.
The chart objects are broken down by groups. The groups are Basic Shapes, Lines,
Channels, Spirals, Fans, Text and images. If the break down is not required, the All Chart
Objects heading displays the entire list without categorization.
© 2015 RightEdge Systems, LLC
RightEdge Environment
83
Like indicators, chart objects are dragged and dropped onto an open chart in the
document area. Chart objects are different from indicators in that they are free form. To
compare, an indicator can have different parameters changed and draw to reflect the new
parameters. There is no additional control at that by the end user at that point. By
contrast, chart objects can be manipulated once drawn on the chart.
Manipulating Chart Objects
If a line object is placed on the chart, the line points are determined by the end user and
not any pre-defined algorithm. Once the initial line points are determined, they can be
changed at any time by selecting the line object using the left mouse button. To select
an object to move it, click anywhere inside the outer points of the object. Keep the
mouse button down and drag the object to its desired location. To change the starting
and ending points of the chart object, select the outermost areas of the object.
The illustration below shows a selected line object on a chart.
If either of the green squares are clicked, the object's size and points can be manipulated.
Visual properties of the chart object are dynamic in nature. Properties that apply to the
selected chart object will be displayed in the Properties pane. Items such as size, color
and drawing mode are common among all chart objects.
See Also
Using the RightEdge Environment
Trading System Pane
Watchlist Pane
Indicator Pane
System Components Pane
Live Data Pane
Live System Pane
Build Output Pane
© 2015 RightEdge Systems, LLC
84
8.9
RightEdge Help
Live Data Pane
The live data pane is where incoming tick data can be viewed. Starting the data stream
happens one of two ways. The first way is to start live data manually using the Start
button on the live options toolbar. The second way is to start a live system. After the
live system is loaded and the specified amount of historical data is loaded, the live system
will automatically begin live data collection.
Once live data is started it can be stopped by the stop button on the live options toolbar
or by stopping a currently running system.
Note: Open a live chart based on the collected data by double clicking any symbol
in the live data list.
Discarding Live Data
Depending on the number of symbols for which you are capturing live data, whether you
are saving tick data, and other factors (such as the speed of your computer), live data
may arrive too fast to process. As this happens, the list of pending ticks will grow.
Eventually, RightEdge will catch up by discarding all of the current pending ticks. A
warning will show up at the bottom of the live data pane as shown below.
You can control the length of time before RightEdge discards tick data with the Maximum
© 2015 RightEdge Systems, LLC
RightEdge Environment
85
Live Data Backlog setting. To avoid discarding data, you can reduce the number of
symbols you retrieve data for, switch to a higher performance data store, or turn off the
option to save raw tick data in the watchlist folder settings.
Tick data may also be dropped if the time for a tick is out of order, or if it is outside of
exchange hours that you have specified in the live options.
Configuring the View
Different pieces of tick data are valuable to different systems and different asset classes.
For example, the bid and ask portions of the tick are more valuable than the last price in
the case of forex. To accommodate varying needs, the columns displayed as well as the
column order are configurable and persist between program runs.
To change the order of the columns, simply click and drag a column. Release the mouse
button when the column is dragged past the boundary of the target column. Using the
above illustration as an example, to put the Last Volume column at the far right, click
and drag the Last Volume column until it is past the rightmost border of the Change
column.
Columns in the grid can also be added or removed. This is accomplished by right clicking
anywhere in the grid and selecting the Configure Columns menu option.
The list on the left contains the columns that are not displayed currently but may be
displayed if desired. The list of the right contains the columns that are currently
displayed.
Click the Add >> button to move a column from the Available Columns list to the
Visible Columns list. Click the Add All >> button to move all of the available columns
into the visible columns list. Click the << Remove button to move a column from the
Visible Columns list back to the Available Columns list. Click the << Remove All
button to move all of the visible columns into the available columns list.
Once the desired columns are in the Visible Columns section, clicking a visible column
entry will allow individual column manipulation. When a visible column is selected it can be
ordered using the Move Up and Move Down buttons.
© 2015 RightEdge Systems, LLC
86
RightEdge Help
Column Size will change the size of the currently selected column.
When applicable, the Decimal Places field will be enabled to allow setting a default
number of decimal places when the value for this column is rendered.
See Also
Using the RightEdge Environment
Trading System Pane
Watchlist Pane
Indicator Pane
System Components Pane
Chart Objects Pane
Live System Pane
Build Output Pane
8.10
Live System Pane
The live system pane contains information about a currently running system. The
information is broken into three groups, Pending Orders, Open Positions and Closed
Positions.
Pending Orders
Whenever a system submits an order to a broker (simulated or real), it will be displayed in
the Pending Orders tab.
Symbol This is the symbol that the order belongs to.
Order Type The specified order type of this pending order. See the RightEdge
supported order types for more information.
Position Type This is the assigned position action. There are four actions that can be
performed. Buy to open a long position, short to open a short position, close to exit a
long position and cover to exit a short position.
Entry Time The time that this order was submitted to the broker.
© 2015 RightEdge Systems, LLC
RightEdge Environment
87
Shares The number of shares or contracts.
Limit Price If the order type is a limit order, the limit price is displayed here. For market
orders, this column is not populated.
Open Positions
After a position is filled by the broker (simulated or real), it will be displayed in the Open
Positions tab.
Symbol This is the symbol that the order belongs to.
Order Type The specified order type of this open position, as it was in the Pending
Orders screen. See the RightEdge supported order types for more information.
Position Type Specifies whether this position is long or short.
Entry Time The time that this order was submitted to the broker.
Shares The number of shares or contracts.
Fill Price The actual price that this order was filled at by the broker.
Avg Cost The amount of equity or initial margin used to open this position.
P/L Current profit or loss (unrealized) of this open position.
Open Name A user defined name given to this position.
Closed Positions
After a closing order is filled by the broker (simulated or real), it will be displayed in the
Closed Positions tab.
© 2015 RightEdge Systems, LLC
88
RightEdge Help
Symbol This is the symbol that the order belongs to.
Order Type The specified order type of this closed position, as it was in the Pending
Orders screen. See the RightEdge supported order types for more information.
Position Type Specifies whether this position is long or short.
Entry Time The time that this order was submitted to the broker.
Shares The number of shares or contracts.
Open Price The original fill price when this position was opened.
Close Price The fill price of the closing order.
P/L The final or realized profit and loss.
Bars Held The number of bars or periods that this position was open.
Close Name A user defined name given to this close order.
Manipulating Grid Columns
Columns in all of the grids in the live system pane can be sorted and rearranged. To
change the order of the columns, simply click and drag a column. Release the mouse
button when the column is dragged past the boundary of the target column. Using the
Closed Positions grid as an example, to put the Order Type column at the far right, click
and drag the Order Type column until it is past the rightmost border of the Close Name
column. Release the mouse button to set the new column position.
Click the left mouse button once on any grid column header to sort. Click again on the
same column to reverse the sort.
See Also
Using the RightEdge Environment
Trading System Pane
Watchlist Pane
Indicator Pane
System Components Pane
Live Data Pane
Chart Objects Pane
Build Output Pane
8.11
Properties Pane
The properties pane is a dynamic pane the reflects configurable items for the currently
selected object. Many objects in the RightEdge environment are configurable at run time.
For example, if a trading system is open, the trading system properties are displayed in
the properties pane when the top level item is selected. References and individual files
also have configurable properties when selected.
The example below shows the properties of an indicator when it is selected on the chart
or within the system properties.
© 2015 RightEdge Systems, LLC
RightEdge Environment
89
The controls for the properties are created with the appropriate type. For example, a
configurable color will produce a color drop down. A field that requires a number will
disallow non-numeric characters. If an invalid property is set, an error (shown below) is
displayed.
The value will then revert back to the last known good value.
Each object in RightEdge that supports properties will contain additional information on
properties specific to that object.
See Also
Using the RightEdge Environment
Indicator Pane
Chart Objects Pane
8.12
Output Pane
The Output pane displays messages that were generated by the system. Typically these
messages are generated by the system author, however, there are some occasions where
RightEdge may display information that is not critical to the system executing, but does
require notification.
© 2015 RightEdge Systems, LLC
90
RightEdge Help
The illustration above shows a system that has items submitted to the output window.
Severity Contains the severity assigned to the message.
Informational
Informational severity typically indicates that no action is
required.
Warning
A warning severity level typically indicates that no action is
required at this time, but some action may be required to
correct the problem encountered in the future.
Error
An error severity level typically indicates that a problem was
encountered that could not be corrected or requires immediate
correction from the operator.
Message Contains verbose information about the line item.
Symbol An optional field that relates the symbol to the message displayed.
Module An optional field that relates a module (trading system) to the message displayed.
Time The actual date and time that the message was placed into the output pane.
Note: Items in this list can be sorted by clicking on the column header.
See Also
Using the RightEdge Environment
Trading System Pane
Watchlist Pane
Indicator Pane
System Components Pane
Live Data Pane
Live System Pane
Chart Objects Pane
8.13
Build Output Pane
The build output pane displays the status of a system build. RightEdge contains a built in
C# and Visual Basic.NET compiler. If a system is programmed in these languages, the
results of the compilation are displayed in this pane.
© 2015 RightEdge Systems, LLC
RightEdge Environment
91
The illustration above shows a system that contains compiler errors. These errors must
be addressed before a live system or backtest can continue. The build output pane will
also display compiler warnings that do not have to be addressed before the system is
executed.
Type Contains the message type. An error is critical, a warning indicates that it's a good
idea to address before continuing.
Description Contains verbose information about the line item.
File Contains the fully qualified filename where the error resides.
Line Indicates the line number that the error or warning has been detected.
Double clicking on the line item will open the source file if it is not already opened. The
line number displayed will also be scrolled into view.
Note: This pane is strictly for trading system developers who are writing source code and
not applicable to drag and drop systems.
See Also
Using the RightEdge Environment
Trading System Pane
Watchlist Pane
Indicator Pane
System Components Pane
Live Data Pane
Live System Pane
Chart Objects Pane
8.14
Windows Dialog
This dialog box allows you to display, close, and arrange documents that are open in
editors and designers. You can display this dialog box by choosing Windows from the
Window menu.
Name
Displays the names of document and tool windows, with the item currently active
selected.
© 2015 RightEdge Systems, LLC
92
RightEdge Help
Path
Displays the full path for documents. Windows typically do not have a path.
Activate
Makes the document or tool window selected the active item in the editor or designer.
Close
Closes the selected documents and windows in the list.
Save
Saves the selected documents and windows in the list.
See Also
Using the RightEdge Environment
8.15
Using the Editor
The Code and Text editor is the word processor of the integrated development
environment (IDE). When it is used to edit text, it is referred to as the Text Editor. When
used to edit source code in a development language, its most common use, it is referred
to as the Code Editor. You can open multiple Code Editors to view the code in different
files, and copy and paste among them. A list of all documents opened for editing in
instances of the Code Editor is available in the Windows menu.
Select the topics below to get relevant information quickly.
Code Window Components
Editing Text
Editor Features
Code Window Components
Code Pane
The area where code or text is displayed for editing. It provides statement completion for
the C# language.
Indicator Margin
A gray column on the left side of the Code Editor where indicators such as bookmarks are
displayed.
Selection Margin
© 2015 RightEdge Systems, LLC
RightEdge Environment
93
A column between the Indicator Margin and the editing window where you can click to
select lines of code. Changes to code are tracked here when you select the Mark
Modifications option from the Edit menu.
Horizontal and Vertical Scroll Bars
Allows you to scroll the Code Pane horizontally and vertically so that you can view the
code that extends beyond the viewable edges of the Code Pane.
Editing Text
The editor provides the customary functionality of a text editor or word
processor. The procedures to select, copy and paste text and code are familiar and
consistent. The editor also provides automatic statement completion in C#, syntax
checking, keyword colorization, and other services.
There are various ways to move through text or code in the Code Editor using the mouse
and navigation keys:
Use the arrow keys to move one character at a time, or the arrow keys in
combination with the CTRL key to move one word at a time. Arrow keys move one
line at a time also.
Click a location with the mouse.
Use the scroll bars or scroll wheel on the mouse to move through the text.
Use the HOME, END, PAGEUP, and PAGEDOWN keys.
Use CTRL+PAGE UP and CTRL+PAGE DOWN to move the insertion point to the top
or bottom of the window, respectively.
Use CTRL+UP ARROW and CTRL+DOWN ARROW to scroll the view without moving
the insertion point.
Cut, Copy and Paste
As mentioned previously, the procedures to perform cut, copy and paste operations are
standard. Click on the selection margin with the left mouse button and drag the mouse up
or down. Selected text should now be highlighted in gray. Copy text by selecting Copy
from the Edit menu. Cut the text by selecting Cut from the Edit menu. Pasting will
remove the selected contents and paste what the text that is currently available on the
clipboard.
Find and Replace
The code editor features an extremely powerful find and replace capability. Find
operations support these options:
Text searching
Regular expression-based searching and substitutions
Wildcard-based searching
Match group capturing
Case matching
Whole word matching
Backwards searching
Search hidden text option
© 2015 RightEdge Systems, LLC
94
RightEdge Help
Search in selection
To invoke a simple find, select the Find item from the Edit menu.
When text is typed into the Find what text area, the Find Next button will enable. The
Find dialog will stay on top of the code editor and highlight any text that is found. Use
the Close button to dismiss the Find dialog.
Editor Features
Fonts and Colors
This fonts and colors in the code editor are customizable. The Options screen contains a
listing of colors and fonts to choose.
Syntax Highlighting
RightEdge recognizes language elements for C# and Visual Basic and highlights those
language elements accordingly. Use the Options dialog to set the colors of each individual
language element.
Bookmarks
You can mark lines in your code files with bookmarks. Bookmarks are a way to quickly
navigate to previously marked lines of code. To set a bookmark, select the Bookmarks
menu item from the Edit menu, followed by the Toggle Bookmark item. Bookmarks are
shown in the indicator margin as a blue rectangle.
Outlining
Outlining is used to visually organize sections of code. To the right of the indicator and
just left of the source code, a tree line with an expand and collapse control is displayed.
To collapse a section of code, click the "minus" symbol. A collapsed region can be
identified by an ellipsis (...) in the editable region. Click the "plus" symbol to expand this
region.
Statement Completion (C# Only)
Statement completion is enabled as code is typed into the code editor. Specific language
elements will automatically trigger the proposed completion path. This allows you to keep
your context, find the information you need, and insert language elements directly into
© 2015 RightEdge Systems, LLC
RightEdge Environment
95
your code.
Line Numbering
You can turn line numbering on and off in the Options dialog box. To jump to a particular
line, choose Goto Line on the Edit menu or press CTRL+G.
Coding Problem Indicators (C# Only)
As you enter and compile code in the Code Editor, wavy lines appear beneath code that is
incorrect or could cause a problem. These are sometimes called "squigglies."
Code Snippets
The editor supports Visual Studio style code snippets. RightEdge ships with code snippets
for performing common tasks. These definitions are installed in the Application Data
\Snippets folder. Snippets can be created by adding snippet definitions to the
corresponding folders.
To use a code snippet, begin typing the shortcut within the editor window. For example,
to create a class definition, start by typing the word 'class' onto an empty line followed by
the tab key. The code will be autogenerated and allow you to define your class name.
See the Code Snippets topic for detailed information about using and creating code
snippets.
8.16
Editor Colors
The code editor within RightEdge has configurable colors to aid in the recognition of key
parts of the code such as keywords, comments, numbers, strings, etc.
Each language can be configured independently through the Editor Colors dialog shown
below.
© 2015 RightEdge Systems, LLC
96
RightEdge Help
Select a language from the Language dropdown list. The color items will then be
displayed in the Display Items list.
Select an item from the list and use the Item Foreground and Item Background
dropdown lists to pick the desired color. The Sample window will update when the
selection is changed to demonstrate when the current color selections will look like in the
editor window.
See Also
Editor Settings
8.17
Code Snippets
A code snippet is a fragment of code that you can store for reuse within the code editor
at a later time. Microsoft introduced an open standard for code snippets starting with
Visual Studio 2005. The editor honors this format. RightEdge ships with a number of code
snippets that are contained in the AppData\Snippets directory. There are code snippets
for both C# and Visual Basic.
When a code snippet is activated, it inserts its text into the editor. If there are fields
declared in the code snippet, they are highlighted within the inserted code. This easily
facilitates naming items that are typically variable but are required to complete the code
snippet. To move around these fields, hit the Tab key. To indicate that all fields have
been named, hit the Enter key. If more than one field use the same declaration, then the
secondary fields are flagged as dependent on the primary field for the declaration. They
automatically update whenever the text in the primary field is updated.
© 2015 RightEdge Systems, LLC
RightEdge Environment
97
Using Code Snippets
To use a code snippet, begin typing the shortcut within the editor window. For example,
to create a class definition, start by typing the word 'class' onto an empty line followed by
the tab key. The code will be auto-generated and allow you to define your class name.
Code snippets may also be invoked via the Insert Snippet command on the Edit menu or
by right clicking in the editor window and selecting Insert Snippet.
The up and down arrow keys also allow for selection of items in the list. The Tab and
Enter keys pick the selected folder or code snippet, while the Escape key cancels the
popup. If a folder is picked, the folder is traversed into and its contents are displayed in
the list. Code snippets are grouped in the list through a directory structure on disk. The
name shown in the list for each snippet indicates the shortcut name that will invoke this
snippet when typed into the editor.
In the sample below, prop followed by the Tab key were entered into the editor window to
invoke a property snippet.
© 2015 RightEdge Systems, LLC
98
RightEdge Help
If a code snippet requires additional items, these fields are highlighted and represent the
regions of text that need to be edited to complete the code snippet. While the caret is in
a field, the Tab key can be used to navigate to the next field. Likewise, Shift+Tab
navigates to the previous field.
The active field is drawn with a line around it. Sometimes a field refers to a declaration
that is used in multiple places within the code snippet. In that case, only the first field is
designated as editable. When its value changes, the other fields that are dependent on it
automatically update. The dependent fields are drawn with a dotted line around them.
Creating Code Snippets
As mentioned, RightEdge ships with a number of code snippets that are ready to use. In
some cases it may be desirable to create your own code snippets. The snippets follow
the format put forth by Microsoft.
A code snippet is simple an XML-formatted file on the file system that contains a .snippet
extension. These are placed in RightEdge's AppData\Snippets folder underneath the
corresponding folder (C# and VB.NET). The code snippets that ship with RightEdge can
be examined and changed with any text editor. The full schema definition can be found in
the Visual Studio documentation.
The example below is a quick analysis of the basic nodes within a code snippet file. This
snippet is the contents of the current close snippet.
<?xml version="1.0" encoding="utf-8" ?>
<CodeSnippets xmlns="http://schemas.microsoft.com/VisualStudio/2005/CodeSnippet">
<CodeSnippet Format="1.0.0">
<Header>
<Title>Current Close</Title>
<Shortcut>close</Shortcut>
<Description>Code snippet for current close value</Description>
<Author>Yye Software</Author>
</Header>
<Snippet>
<Code Language="csharp"><![CDATA[Close.CurrentValue]]>
</Code>
</Snippet>
© 2015 RightEdge Systems, LLC
RightEdge Environment
99
</CodeSnippet>
</CodeSnippets>
Each code snippet starts with a <CodeSnippets> tag and the <CodeSnippet> itself is
contained within. The first four lines and the last three lines of the file should never need
modification.
The <Header> blocks contain information about the code snippet. The title of the code
snippet is a descriptive name. The shortcut is used to allow the developer to quickly
invoke this code snippet.
The <Snippet> tag itself contains the meat of the snippet definition. The language is
specified in the <Code> tag followed by a CDATA element that contains the actual code
that is inserted. This simple example takes no parameters.
Once you have a firm understanding of this example, consider opening some of the more
complicated snippets, especially those taking parameters to realize the full power of code
snippets.
Note: The editor window loads the code snippets when it is opened. If you modify or
create a code snippet, simply close all editor window instances and load them again.
8.18
Floating Documents
The document area will contain document like items such as charts and source files.
Documents cannot be docked within other panes, however, documents can be split within
the document area or "float". Click the tab area of the document with the left mouse
button and begin to drag the tab.
© 2015 RightEdge Systems, LLC
100
RightEdge Help
Notice that the chart for CAT is outside of the main RightEdge application window. This
chart can be dragged anywhere on the screen or even to another monitor. It will
continue to update (if in live data mode) just as if it were within the main application
window.
To snap the chart or document back to the document area, simply grab the title bar
portion of the floating window and drag it back to the document area.
See Also
Using the RightEdge Environment
8.19
Trading System Project Properties
Selecting the Properties menu item when right clicking on the project node in the Trading
System pane brings up the properties dialog for this system.
Compiler
The compiler tab contains options that are relevant to the compiler. These are options
that are passed to the compiler immediately before the compilation process.
© 2015 RightEdge Systems, LLC
RightEdge Environment
101
Target Framework Version
Select which version of the .NET Framework that this trading system should be compiled
with. It is highly unlikely that this will ever have to be changed.
Warning Level Valid settings are level 0 through 4.
Warning Level
Meaning
0
Turn off all warning messages.
1
Only display warning messages that are
considered severe.
2
Displays all severe plus selected "less than
severe" warnings.
3
Displays all level 2 warnings plus all warnings
that are considered more severe than
"informational".
4
Displays all warnings including those that are
informational.
Treat Warnings as Errors By default, only errors can halt the compile and run process.
If this is set, warnings will also halt the process.
Generate Debug Info If checked, this option causes the compiler to generate debugging
information and place it in the output file.
© 2015 RightEdge Systems, LLC
102
RightEdge Help
Note: Generating debug information may have some impact on execution speed.
XML Documentation File If specified, XML documentation will be derived from the
comments in the source files. See Using XML Comments for Documentation for more
information.
The following class settings are recommended for advanced users only.
System Class This specifies the name of the System class that RightEdge will instantiate
when your system assembly is loaded.
Symbol Script Class This specifies the name of the SymbolScript class that RightEdge
will instantiate when your system system assembly is load.
Custom System Base Class Allows you to insert your own custom system class in
between the base system and the actual system class.
Custom Script Base Class Allows you to insert your own custom script class in between
the base SymbolScript and the actual SymbolScript class.
Simulation
The simulation tab contains options that are relevant to running a system against
historical data, or "backtesting".
Save Optimization Results For every optimization run, the run data in its entirety is
© 2015 RightEdge Systems, LLC
RightEdge Environment
103
saved to disk for later retrieval. In situations where the number of runs are large, this
may not make practical sense. If optimization results are not saved, only summary data
for the optimization run will be available. Any attempt to drill down from the optimization
summary screen will result in an error.
You may now load these optimization results files for later use. Simply use the Open
System Results... menu option on the File menu.
NOTE: Optimization results files will not be compatible between different builds of
RightEdge. This is meant for gathering temporary run information.
Analyze High Before Low Typically in a simulation, tick data or lower level data may not
be available. Without that data is impossible to know in which order the high or low of the
period was hit. RightEdge defaults to processing the low tick first. Place a check next to
this option to reverse that behavior.
See Also
New Trading System
Trading System Pane
© 2015 RightEdge Systems, LLC
104
RightEdge Help
9
Options
9.1
RightEdge Program Options
RightEdge comes with a number of program level options. These options are available to
customize your RightEdge experience. To select the options, click the Options item from
the Tools menu.
The Options dialog contains the following tabs.
Chart Colors Used to configure the colors of the various items on the candlestick or bar
charts.
Chart Options Configure the various visual aspects of the chart such as chart style,
scale, bars per page.
Editor Options Configures the source code editor options such as font, colors, tab size,
etc.
General Options Configures global options for RightEdge. Items such as data store,
currency, etc.
Live Options Options specific to running live systems. Items such as position
management, broker interfaces, etc.
Research Options Configures settings that aid in quickly determining relevant information
about a particular symbol.
Risk Assessment Contains settings that allow hiding and revealing certain risk
assessment calculations performed after a simulation run.
System Results Options Settings for the customizing the System Results screen
See Also
Chart Colors
Chart Options
Editor Options
General Options
Live Systems
Research Options
Portfolio Risk Assessment Options
System Results Options
9.2
General Options
You can specify settings for a variety of RightEdge features by changing options in the
Options dialog box.
The General options contain a number of settings that are global in nature to RightEdge.
Available Data Stores Displays the currently installed data stores. RightEdge is
configured to use a local data store, that is, all bar and tick data is saved to the local
© 2015 RightEdge Systems, LLC
Options
105
hard disk. Other data stores include stores that will allow data to be saved to a database
or XML file.
If a data store requires additional information to function properly, the Setup... button
immediately to the right of the list of data stores will enable. The setup for the various
data stores will vary.
Note: Changing a data store can have serious implications including loss of data.
Please thoroughly understand the changes that will be made before committing them.
Account Currency The currency type of available cash with the broker. The account
currency can be set to any of the supported types and trades may be made in a different
currency. RightEdge will perform the currency conversion back to your account currency.
Note: Historical currency data will have to be available for this conversion to work.
Apply Interest to open Forex Positions Specifies whether or not to debit or credit
interest from open positions.
Forex Rollover Time The time of day that a spot forex position is rolled over by the
broker. This is typically the time of day where interest is either debited or credited from
your open positions.
Close Data Download window on successful download Indicates if the progress
window that is displayed while downloading historical data should be closed upon a
successful download. If unchecked, the data download dialog will not automatically
dismiss itself. Regardless of this setting, the data download dialog will remain active if an
error is encountered during the retrieval process.
Warn about bar data gaps when running system Before backtesting, RightEdge loads
all the bar data that will be used in the backtest. Before passing the data into the
system, the data is synchronized. If a bar exists for one symbol and not another,
selecting this option will warn of this encounter. This will not prevent the simulation from
continuing, but is used as a means of ensuring data integrity.
Movable Position Labels RightEdge will generate position labels within a chart. Check
this option to enable the ability to move these labels by clicking and dragging them.
Uncheck this option to have label stay in place.
Minimum Backfill Specifies the minimum number of days a backfill of historical data will
retrieve.
Recent Project List Size This number specifies the number of projects that will be
displayed in the "most recently used" list. This is located off of the File menu under
Recent Projects.
Remember Last Open Project If selected, the last trading system that was opened
when RightEdge was closed, will be re-opened upon the next run.
Show Start Page Indicates whether or not to display the start page automatically on
program start.
See Also
Chart Options
Chart Color Options
Editor Settings
© 2015 RightEdge Systems, LLC
106
RightEdge Help
Risk Assessment Options
Research Options
Live Systems
System Results Options
9.3
Chart Options
You can specify settings for a variety of RightEdge features by changing options in the
Options dialog box.
The Chart options contain a number of settings that pertain to the price charts in
RightEdge.
Chart Style Specify the display style of price data. Available options are candlestick,
stick (also referred to as OHLC charts) or line charts.
Default Bars per Page Specifies the default number of price points that are displayed on
a chart.
Chart Scale Specifies the default scale for the chart. A normal chart indicates that all
vertical price points are represented equally. A logarithmic scale skews the vertical points
so that a given distance always represents the same percentage change in price.
Decimal Places Specifies the number of points values on the chart are carried out to.
Show Crosshairs Check this field to show crosshairs on the chart. Crosshairs are drawn
immediately underneath the current mouse position. Horizontal and vertical lines will
extend to their respective axis point.
Show Horizontal Grid When checked, horizontal grid lines will be drawn along each tick.
Show Vertical Grid When checked, vertical grid lines will be drawn along each tick.
Show Crosshair Label Check this field to display labels at the horizontal and vertical
ends of the crosshair. The horizontal and vertical lines that extend from the crosshairs
will end at the horizontal and vertical axis points and display the current values for their
respective axis.
Date/Time on All Panes If this field is checked, the date and time that runs along the
horizontal axis will be displayed on each pane. If this is is unchecked, the date and time
will only be displayed on the bottom most pane.
Chart Font Click this button to set a default font for text items in the chart. Items such
as price data, indicator data and date time data will use this font when the chart is
drawn.
Show Position Labels Position labels are drawn on the chart when positions are opened
or closed. A trading system that has a high number of trades may cause the labels clutter
the chart. The labels, in that case, can be turned off. In most cases and by default, the
labels are turned on. To information regarding controlling the colors of the position labels,
please see the Configure Position Labels topic.
See Also
General Options
© 2015 RightEdge Systems, LLC
Options
107
Chart Color Options
Editor Settings
Live Systems
Risk Assessment Options
Research Options
System Results Options
9.3.1
Configure Position Labels
Select Colors For The two options are Account Credit and Account Debit. When a
position is opened, this is an account debit and the specified colors will be used for that
position label. When a position is closed, this is an account credit and the specified colors
will be used for that position label.
Text Color Specifies the color of the text for the position label.
Background Color Specifies the background color of the position label.
Font Specifies the font used in the text of the position label.
Show Detailed Label Indicates whether or not the position label will show P/L details in
the label or simply denote a buy or a sell.
See Also
Chart Options
Chart Colors
9.4
Chart Color Options
You can specify settings for a variety of RightEdge features by changing options in the
Options dialog box.
The Chart Color options contain a number of settings that pertain to the price chart
appearance in RightEdge.
The Chart Components list contains the items in the chart that can have their color
configured. Select an item in this list and select the desired color in the Color selection
box. The mini chart below that is a preview of what the color selection change will look
like if applied.
Below is a list of chart components that can be configured and an explanation of the area
of the chart that is affected.
Chart Text Color The default color of the text that appears on the chart. This can be
overridden on an individual basis, such as by an indicator color.
Candle Up Color The color of the candle body or OHLC line when the closing price is
higher than the opening price. It is standard to make this a light color.
Candle Up Border The color of the border line around the candle body when the closing
price is higher than the opening price.
Candle Down Color The color of the candle body or OHLC line when the closing price is
lower than the opening price. It is standard to make this a dark color.
© 2015 RightEdge Systems, LLC
108
RightEdge Help
Candle Down Border The color of the border line around the candle body when the
closing price is lower than the opening price.
Volume Bar Color When a volume chart is displayed, a volume bar will be filled with the
specified color.
Volume Bar Border When a volume chart is displayed, the border line around the volume
bar will use the specified color.
Chart Frame Color The frame contains the horizontal and vertical values and tick marks.
This setting represents the background color for this area. Use this in conjunction with
text color to ensure readability.
Chart Background Color The background of the price action area of the chart.
Chart Border Color The line that separates the price action area of the chart and any
panes that exist within the entire chart area.
Tick Line Color Tick lines are value intervals. Each tick is a small line that extends from
the right edge of the chart towards the actual value.
Axis Color The axis color specifies the foreground color of items drawn within the axis
labels.
Crosshair Color If the crosshair is enabled, this specifies the color of the crosshair lines.
Crosshair Text Foreground If the crosshair label feature is enabled, this specifies the
foreground color of the crosshair label.
Crosshair Text Background If the crosshair label feature is enabled, this specifies the
background color of the crosshair label.
Zoom Selection Color Charts can be zoomed by holding the mouse cursor and dragging
to select the desired area. A selection rectangle or zoom selection is drawn. This setting
will specify the color of this selection rectangle.
Multiplier Background Color Typically the volume chart will display a multiplier, since
the digits contained within the volume will not fit. The multiplier tag will show the
multiplier of the values displayed. This setting will specify the background of the multiplier
tag.
Multiplier Border Color Set the border color around the multiplier tag.
Grid Line Color If configured, vertical and horizontal grid lines will extend from the ticks
along the vertical and horizontal axes. Use this setting to configure the color used to
draw the grid lines.
Price Label Positive Change The price of the bar where the mouse cursor is hovering is
displayed in the upper left corner of the chart. Positive and negative price changes are
represented in different colors. Use this setting to change the color of a positive price
change.
Price Label Negative Change Use this setting to change the color of a negative price
change.
Price Label No Change Use this setting to specify the color of the price label when
there is no price change for the bar.
Last Price Color The tag at the far right side represents the current price of the latest
© 2015 RightEdge Systems, LLC
Options
109
bar. The color of this tag can be changed with this setting.
See Also
General Options
Chart Options
Editor Settings
Live Systems
Risk Assessment Options
Research Options
System Results Options
9.5
Editor Options
You can specify settings for a variety of RightEdge features by changing options in the
Options dialog box.
The Editor options contain a number of settings that pertain to the editor window
appearance as well as the look and feel.
Font Specify the font that the text contained within the editor window will be displayed
in.
Font Size Indicate the size for the font specified above.
Indent Type The default is smart indent. Smart indention sets the editor to perform
indention where it is typically desired in source code. For example, if a branch statement
is performed such as an "if" statement, the lines that follow the true branch of this "if"
statement will typically be followed by a "{" in C# or a "Then" in Visual Basic.NET. The
editor will automatically perform this indention. Uncheck this setting to perform the
indention manually.
Bracket Highlighting When bracket highlighting is enabled, and the editor cursor is over
a bracket, the corresponding bracket in the editor will be highlighted.
Show Whitespace When enabled, this option will represent the whitespace in the editor
with a ".".
Virtual Space Turn this setting on to allow the cursor to exist at any column within the
editor. With this disabled, the cursor will always revert to the end of the line if the
previous line's length is greater than the current line's length.
Convert Tabs to Spaces When enabled, this setting will convert all tab characters to
the appropriate number of spaces before saving the file.
Show Indention Guides When enabled, will draw a faint vertical line along each tab or
indention boundary.
Show Line Numbers When enabled, creates an area to the far left of the editor window
which will contain the line numbers.
Tab Size Specifies the number of character spaces that are inserted when the tab key is
pressed.
© 2015 RightEdge Systems, LLC
110
RightEdge Help
Colors Configure the colors for various items within the editor. Refer to the Editor Colors
section for additional information.
See Also
Using the Code Editor
General Options
Chart Options
Chart Color Options
Live Systems
Research Options
Risk Assessment Options
System Results Options
9.6
Research Options
You can specify settings for a variety of RightEdge features by changing options in the
Options dialog box.
The Research options contain settings that aid in quickly determining relevant information
about a particular symbol. When items are setup for research, the context menu in the
Watchlist will be populated at the symbol level.
For example, if a symbol is generating a buy or a sell or just simply moving unexpectedly,
items such as news or company fundamentals can be brought up in a timely manner.
Research Item Type RightEdge comes configured with four research items, News,
Quote, Chart, Other (user defined). Select the item from the list to be configured.
Site Parameters Enter a web address (URL) that will be navigated to when this research
item is selected.
Replaceable Parameters
Replaceable parameters are the heart of this piece of functionality. RightEdge
acknowledges four different types of parameters.
%s will insert the ticker symbol for the symbol selected for research.
%c will insert the company name (if configured) selected for research.
%i will insert the industry field (if configured) selected for research.
%f will insert the sector (if configured) selected for research.
See the Symbol Information section for more information about setting these items in
the symbol information.
For example, to configure a news item to visit the Yahoo Company Headlines for the
selected symbol, set the URL to http://finance.yahoo.com/q?s=%s. If the selected
symbol is Microsoft, the URL would become http://finance.yahoo.com/q?s=MSFT and the
appropriate page would be displayed.
© 2015 RightEdge Systems, LLC
Options
9.7
111
Risk Assessment Options
You can specify settings for a variety of RightEdge features by changing options in the
Options dialog box.
The Risk Assessment options contain settings that allow hiding and revealing certain risk
assessment calculation performed after a simulation run.
Since different risk assessment calculations are of different value to different people in
different situations, this list allows you to turn risk assessment calculations on and off.
Some risk assessment calculations are expensive with regard to calculation time. Use the
Portfolio Risk Assessment Plugins list to select the desired calculations.
RightEdge ships with the list of risk assessment plugins below.
Sharpe Ratio
Profit Factor
Risk Adjusted Return
Recovery Factor
Payoff Ratio
Third Party Risk Assessment Plugins
RightEdge supports the use of risk assessment plugins written by third parties. You
may even create your own risk assessment plugin. Place any additional risk
assessment plugins in the application's plugin directory and they will be displayed in
the list.
Consult the RightEdge Developer's Guide for additional information regarding
development of third party risk assessment plugins.
See Also
General Options
Chart Options
Chart Color Options
Editor Settings
Research Options
System Results Options
9.8
Live Systems
You can specify settings for a variety of RightEdge features by changing options in the
Options dialog box.
The Live Systems options contain a number of settings that pertain to the startup and
behavior of live trading systems in RightEdge.
Saved Open Positions RightEdge will remember the positions that it opened during a live
system run. Upon exiting a system, these positions will be saved for recall when the
© 2015 RightEdge Systems, LLC
112
RightEdge Help
system is run again. The options below will tell RightEdge how to handle these positions
when a live system is restarted and open positions were recorded.
Prompt user to select which positions are still open A screen is displayed with a list
of the open positions. Select the positions to move as open in the current system run.
Ignore open positions This will bypass the screen and assume no positions are to be
carried forward.
Automatically accept saved open positions This option bypasses the prompt screen
and assumes all positions are to be carried forward into the new system instance. Use
this with caution.
Auto Reconnect on Error Enable this option to have both the real time data and broker
plugins reconnect if an error occurs. A notification will be sent to the output pane upon
disconnection and a successful reconnection.
Note: The plugins will reconnect indiscriminately. Enable this with caution.
Ignore system generated warnings RightEdge will provide warnings when certain
certain conditions look suspect. These warnings are placed in the Output pane.
Sometimes these warnings are acceptable and may be ignored. With this option enabled,
RightEdge will not generate live system warnings.
Use Broker Buying Power Depending on the capabilities of the broker and/or broker
plugin, RightEdge may have the ability to use the buying power as given by the broker. If
using the real broker buying power is not desired, uncheck this option to use the starting
capital figure specified as the buying power.
Warn before executing live systems RightEdge can provide live trade executions
against real brokers. If system code doesn't run as expected or the system was not
intended to run against a live broker, this can present substantial risk. This warning will
be displayed before the live system executes against a live broker to prevent inadvertent
system starts with live brokers attached.
Run full simulation before starting live system If selected, RightEdge will run a
simulation first before going into live mode. Depending on your system parameters, this
may take some time. However, all simulated positions that were generated will be shown
on the live system, but no orders for the simulated trades will be placed with a live broker.
Ignore Data Outside of Exchange Hours
It may be desirable to begin running a live system before the official opening of the
exchange. However, before and after market data can tick and will be passed along to
the live trading system. In cases where this is not desired, enable this option and set the
exchange hours. Any data that is received outside of these hours will be displayed be
shown on the live data window and will be collected by the data store, but will not be
passed along to the live system itself.
Maximum Live Data Backlog (seconds) Sets the number of seconds that live data
processing can lag behind live data collection before data will be discarded in an attempt
to catch up. See also Discarding Live Data
See Also
General Options
© 2015 RightEdge Systems, LLC
Options
113
Chart Options
Chart Color Options
Editor Settings
Risk Assessment Options
Research Options
System Results Options
9.9
System Results Options
System Results are external plugins that are loaded by RightEdge after a run has
completed. RightEdge contains a number of system results plugins out of the box. Much
like the risk assessment tab, certain plugins are of different value in different situations.
RightEdge allows the user complete control of which plugins are shown by default. In
addition to this, result plugins may be toggled on the fly via the View menu.
Since these are fully external, utility developers are welcomed to develop their own
system result plugins. Please refer to the developer documentation as well as the sample
code that is installed for additional information.
To distribute a system result plugin, simply install or copy the assembly that contains the
plugin into the RightEdge plugin directory. RightEdge will automatically detect it as a
system results plugin and display it to the end user.
System Results Charts Place a check next to each chart name to have it displayed by
default after a simulation has completed.
See Also
General Options
Chart Options
Chart Color Options
Editor Settings
Research Options
Risk Assessment Options
9.10
Managing Frequencies
A trading system can run at one or more different frequencies. A frequency is simply
some unit used to form a bar of data. Typically a period of time comprises a frequency. 1
minute, 5 minute, 60 minute, or daily are some typical frequencies that trading systems
are developed to run under. In addition to time based frequencies, frequencies can also
be based on ticks, volume, astrological alignments and anything else that can be
measured.
RightEdge ships with three frequency plugins. Time, tick and constant volume plugins.
The Saved Frequencies tab is a central place to manage and configure frequencies that
will be available to trading systems.
© 2015 RightEdge Systems, LLC
114
RightEdge Help
The Add, Edit and Delete buttons allow control over which frequencies are available to
trading systems. Changes are saved in real time.
Click and hold the left mouse button on an item in the list and drag to move that
frequency item to a different location in the list.
Note: To select a frequency for a trading system, select the Frequency section under
the General subheading in the Trading System Properties pane.
Note: As stated above, these frequency generators are plugins which allows anyone to
write a custom frequency plugin for use in a trading system.
See Also
Adding and Editing Frequencies
9.10.1 Adding and Editing Frequencies
Frequencies are plugin based. RightEdge ships with three frequency plugins. Time, tick
and constant volume plugins.
When Add or Edit is clicked from the Saved Frequencies screen, the Frequency
© 2015 RightEdge Systems, LLC
Options
115
configuration screen is presented as shown below.
Frequency Type The frequency plugin using to generate this frequency
Settings Any settings that the frequency plugin provides to configure this frequency.
These are provided by the plugin and are likely different based on the item selected in the
Frequency Type drop down.
Frequency Name The "friendly name" given to this particular frequency configuration.
Note: Since frequencies are plugin based, more items may show in the Frequency Type
drop down.
See Also
Managing Frequencies
© 2015 RightEdge Systems, LLC
116
10
RightEdge Help
How Do I?
The How Do I? section is a task based section to help perform common functions within
RightEdge.
The sections available are:
Configuring Services for data and broker providers
Create a Trading System
Debug a Trading System in Visual Studio
Run a Backtest / Simulation
Analyze Backtesting Results
Optimize a Trading System
Start Collecting Live Data
Place Manual or Discretionary Trades
View Live Charts
Save Chart Settings
Import Data from Other Software
View Backtesting / Simulation Charts
Set a Profit Target
Set a Stop Loss
Set a Time Based Order Timeout
Collect Forex Data
Please click on any of the section links above to navigate to that topic.
10.1
Create a Trading System
To create a new system from scratch, select the Trading System... option from the File
menu. The New Trading System Project window is displayed as shown below.
Development Language The current supported languages are Visual C# and Visual
Basic.NET.
Note: If the planned usage for developing this system is strictly drag and drop then the
© 2015 RightEdge Systems, LLC
How Do I?
117
language is essentially irrelevant.
Project Name This is the user defined name given to the trading system. This will also
become the name of the project file.
Project Location Specifies the folder on the disk where this project folder and
associated files will be saved.
Browse Click this button to browse for the desired project folder.
As each of the project items are changed in this dialog, the text at the bottom is updated
to reflect the fully qualified directory of this project.
See Also
Using the RightEdge Environment
Trading System Pane
Live System Pane
10.2
Debug Trading Systems in Visual Studio
RightEdge provides access to industry standard languages. While the RightEdge IDE can
be used to perform basic trading system development, you may also use industry standard
tools such as Microsoft Visual Studio to create, build and debug trading systems for use
with RightEdge.
RightEdge strategies are compiled to standard .NET assemblies (DLLs). There are a
number of ways to begin debugging using Visual Studio. If the trading system is already
running, you can load up Visual Studio and use the "Attach To Process" option. This
option is located under the Debug menu. A project must already be loaded.
Note: If you're using the Express editions of Visual Studio, the "Attach To Process" option
is not available.
You may also create a project from the RightEdge IDE. To do this, load your trading
system in RightEdge. Under the System menu select Visual Studio, Create VS Project.
The name of your system with the appropriate Visual Studio project extension will be
placed in your trading system's folder. You can open this project using Visual Studio.
To begin debugging, follow these steps.
1. If RightEdge is open, close RightEdge.
2. Open Visual Studio and open the trading system project.
3. Right click on your project in Visual Studio and select Properties.
4. Click the Debug tab.
5. Under Start Action, select Start External Program and navigate to the RightEdge
executable.
6. Open your trading system file in Visual Studio and set your desired breakpoints.
7. Hit F5 to begin debugging. This should launch RightEdge.
8. Open your trading system project in RightEdge and begin either a simulation or live
system run.
© 2015 RightEdge Systems, LLC
118
RightEdge Help
At this point, your breakpoints should be triggered. If the breakpoints are a solid red dot,
the library is loaded and active. If the breakpoints are a hollow dot, the system is not
properly setup for debugging. One common cause is missing program debug information.
Make sure that program debug information is begin produced. The file extension of the
program debug database that Visual Studio uses is .pdb. This should reside in the same
location as your trading system assembly.
10.3
Setup A Watchlist
Watchlists indicate what symbol or grouping of symbols are going to be used for
backtesting, downloading historical data, collecting live data or running a system. These
can be configured at the user's discretion. Services have to be configure before you are
able to download historical data or collect live data. See the Configuring Services section
if you have not configured services.
Once the service is configured, the next step is to assign this service to a group of
symbols.
RightEdge ships with a couple of default folders already configured. The two symbol
folders are the Nasdaq 100 and Dow 30. Right click on the top level node or any folder
underneath and select Configure Folder...
© 2015 RightEdge Systems, LLC
How Do I?
119
The Dow 30 folder contains the list of symbols that are contained within this folder.
Folders can contain any number of symbols, the only requirement is that they're all the
same frequency (i.e. daily, weekly, 5 minutes, 1 minute, etc). This is set (or inherited) in
the General tab.
Items added or removed from Symbols field with be added or removed from the folder and
subsequently the user interface.
Click the Services tab to assign a service to this folder.
© 2015 RightEdge Systems, LLC
120
RightEdge Help
As previously mentioned, RightEdge ships with a predefined historical data plugin for
Yahoo. This service is configured with the name "Historical". "Historical" shows up in the
list and is currently assigned to the Dow 30 folder. For the case of historical data plugins,
it is possible to set a start date at which historical data is retrieved. For example, GE
contains nearly 50 years of historical data on Yahoo. It may not be necessary to retrieve
this much data. Select the Data Download Start Date to limit this data collection.
Broker and real time data services will also be assigned here.
Inheriting Folder Settings
By default, folder settings are setup to inherit. Inheritance is a powerful time saving
feature where you can set a parent folder with specific information such as service
selections, data saving selections and frequencies and allow folders that appear
underneath the parent folder to use those settings. This saves time since each folder
does not have to be explicitly setup.
See Also
Getting Started
Start Collecting Live Data
Starting a Live System
Charting
© 2015 RightEdge Systems, LLC
How Do I?
10.4
121
Configure a Service
A service is a type of plugin that may supporting retrieving realtime data, retrieving
historical data, or connecting to a broker. Services are associated with symbols in the
Watchlist pane. You can set up a hierarchical folder structure and have child folders
inherit settings from their parents (or override those settings).
Simply put, this is how to retrieve and act on data.
RightEdge provides a simple, yet robust means of organizing not only data, but the means
in which data is acted upon. Services are configured at a global level, yet they are
assigned at a group level and can be optionally inherited down the tree.
First, the services must be configured.
Select the Configure Services... menu item from Tools menu.
RightEdge comes default with a predefined service for Yahoo and it is named "Historical".
The Service Setup list will show the capabilities of a configured server. Since some
plugins support more than one piece of functionality, this is the place to determine the
available functionality for each plugin and whether or not it is currently configured to use.
In this case, the Yahoo service has the ability to retrieve historical data. It does not
have the ability to retrieve live data, nor does it provide broker services.
To add a new service, click the New... button. A wizard prompting for information that
this service needs will follow. Upon the completion of the wizard steps, the service will
appear in the list.
Assigning Services
Setting up a service is the first step in realizing the functionality of the service. The next
© 2015 RightEdge Systems, LLC
122
RightEdge Help
step is to assign this service to a group of symbols.
RightEdge ships with a couple of default folders already configured. The two symbol
folders are the Nasdaq 100 and Dow 30. Right click on the top level node or any folder
underneath and select Configure Folder...
© 2015 RightEdge Systems, LLC
How Do I?
123
The Dow 30 folder contains the list of symbols that are contained within this folder.
Folders can contain any number of symbols, the only requirement is that they're all the
same frequency (i.e. daily, weekly, 5 minutes, 1 minute, etc). This is set (or inherited) in
the General tab.
Items added or removed from Symbols field with be added or removed from the folder and
subsequently the user interface.
Click the Services tab to assign a service to this folder.
© 2015 RightEdge Systems, LLC
124
RightEdge Help
As previously mentioned, RightEdge ships with a predefined historical data plugin for
Yahoo. This service is configured with the name "Historical". "Historical" shows up in the
list and is currently assigned to the Dow 30 folder. For the case of historical data plugins,
it is possible to set a start date at which historical data is retrieved. For example, GE
contains nearly 50 years of historical data on Yahoo. It may not be necessary to retrieve
this much data. Select the Data Download Start Date to limit this data collection.
Broker and real time data services will also be assigned here.
For software developers interested in developing service plugins, please visit the Service &
Plugin Overview section.
See Also
Modifying Services
10.5
Run a Backtest / Simulation
This help topic provides a very high level overview of back testing within RightEdge.
Open a trading system using the Open Trading System... option from the File menu. If
you do not have a trading system, see the Create New Trading System topic. You can
also download existing trading systems from the RightEdge website.
© 2015 RightEdge Systems, LLC
How Do I?
125
Once a trading system is opened, select the symbols on the Watchlist pane to run this
system against. If you have not configured a watchlist, see the Setup a Watchlist
section before continuing.
Now that the symbols are selected, select Run Backtest from the System menu. If
there are no errors in the system, the simulation will complete and the system results
screen is displayed.
For details on reviewing and interpreting the system results screen, see the Analyzing
System Results section.
For details on running a system with optimization parameters, see the Optimization
Overview section.
See Also
Charting
Backtesting (definition)
Getting Started
10.6
Optimize a System
Optimization is used to test a system with certain variables changed across simulation
runs. Running the system with variable parameters or optimization parameters allows the
system developer to determine which values result in the most favorable system
performance.
Any value in the system can be used as an optimization value. Technical indicators are
usually the first candidates since many accept a number of numeric inputs. Other items
such as profit targets and stop loss values are also viable candidates.
To begin using optimization in RightEdge, a trading system must be open. In the Project
Properties, locate the System Parameters property.
© 2015 RightEdge Systems, LLC
126
RightEdge Help
RightEdge supports any number of parameters in this list. Each value is treated as a type
of double. Click the Add button to add a new empty parameter. Use the property grid on
the right to name this parameter and assign a default value.
Referencing Parameters
Once optimization parameters have been added to the project, they may be referenced in
code. Using the above parameter, stochBuyValue, we will only perform a buy if the
StochK indicator is below our optimization parameter.
C#
if (stochKValue < SystemParameters["stochBuyValue"])
{
// Perform buy here.
}
Visual Basic
If (stochKValue < SystemParameters.Item("stochBuyValue")) Then
' Perform buy here.
End If
© 2015 RightEdge Systems, LLC
How Do I?
127
See Also
Optimization Dialog
Optimization Output
Automating RightEdge
10.7
View Live Charts
This help topic provides guidance on opening charts containing indicators and chart
objects are being generated during the collection of live data or while a live system is
running.
To see charts with indicators and chart objects that are being created by a currently
running live system you should not open them from the watchlist. Opening a chart by
double clicking on the symbol from the watchlist will always open a raw chart, showing
only bar data. We do this for a few reasons.
It is good to have a place where you can always get a clear, uncluttered, view of
the bar data for a symbol.
Since RightEdge allows multiple sets of symbol results to be open at one time and
there are we’d have no easy way to know which set of system results to use to
plot indicators and chart object.
When you start a live system the Live Data window will be populated with a list of all
symbols for which data is being collected. Double clicking on any of these symbols will
bring a live chart.
See Also
Charting Overview
10.8
View System Charts
This help topic provides guidance on opening charts containing indicators and chart
objects that were generated during a simulation.
To see charts with indicators and chart objects that were created by a system you should
not open them from the watchlist. Opening a chart by double clicking on the symbol from
the watchlist will always open a raw chart, showing only bar data. We do this for a few
reasons.
© 2015 RightEdge Systems, LLC
128
RightEdge Help
It is good to have a place where you can always get a clear, uncluttered, view of
the bar data for a symbol.
Since RightEdge allows multiple sets of symbol results to be open at one time we’d
have no easy way to know which set of system results to use to plot indicators
and chart object.
After you create a system and run it against a group of symbols a “System Results” tab
will be created in your workspace.
From here, you can select one of the following tabs
On the Position List tab, selecing a position on the top pane will display a list of trades
within that position on the lower tab. Double clicking on any of the trades will open a
system chart and bring you to the position of that trade.
On the Trade List tab, double clicking any of the trades will open a system chart and bring
you to the position of that trade.
© 2015 RightEdge Systems, LLC
How Do I?
129
On the Symbol Results tab , double clicking any symbol will open a system chart for that
symbol.
See Also
Charting Overview
10.9
Start Live Trading System
This help topic provides a very high level overview of back testing within RightEdge. It is
assumed that you have already configured a live data service, a Watchlist and created or
downloaded a trading system to run. If not, please follow the links below.
Configuring Services
Setup a WatchList
Create New Trading System
Open a trading system using the Open Trading System... option from the File menu. If
you do not have a trading system, see the Create New Trading System topic. You can
also download existing trading systems from the RightEdge website.
Once a trading system is opened, select the symbols on the Watchlist pane to run this
system against. If you have not configured a watchlist, see the Setup a Watchlist
section before continuing.
Now that the symbols are selected, select Run Live from the Build menu. If there are no
errors in the system, the system will begin running.
The system also starts live data for the specified symbols. See Live Data pane for more
information. Double click a symbol in the live data pane to open a live chart into the
document area.
The Live System pane will contain information about positions, P/L, etc.
To stop a live system, select the Stop Live option from the Build menu.
See Also
Using the RightEdge Environment
Setup a Watchlist
Configure Services
Capturing Live Data
Charting Overview
© 2015 RightEdge Systems, LLC
130
RightEdge Help
10.10 Manual or Discretionary Trading
Most of the time it is desirable to have your system do all of the trading for you. In rare
cases, however, it may be necessary to place opening orders, close existing positions or
cancel existing orders. For this purpose, RightEdge provides some basic discretionary
trading features while a live system is running.
The discretionary features can be found in the "Live Options" toolbar.
These items are available when a live system is currently running and accepting trades.
Submitting a new order is always available. When this button is clicked, the Submit Order
screen is presented which accepts the parameters to open a new position. For more
information please see the Submit Order help topic.
Cancel Order is enabled when an existing order is selected in the Pending Orders grid in
the Live System pane. The currently selected order will have a cancel request submitted
to the broker when clicked.
Close Position is enabled when an existing position is selected from the Open Positions tab
in the Live System pane. An order will be sent to the broker to close the currently
selected position in its entirety.
Note: These orders are routed directly to broker that is associated with the running
trading system. All orders will be submitted immediately. Use with great caution
and care.
Note: These items are also accessible by right clicking within the corresponding
tabs in the Live System pane.
10.11 Import Data
Use Import Data tool to import data from a text file into a Watchlist folder. The Import
Data tool examines the text file that you are importing and helps you ensure that the data
is imported in the way that you want. You can import multiple files with the same import
settings at one time.
To begin the process, select Import Bar and Tick Data... from the Tools menu.
Files Tab
© 2015 RightEdge Systems, LLC
How Do I?
131
Fields Tab
Formats Tab
Watchlist Tab
Files Tab
Use the Files tab to select one or more files to import.
Click the Add... button to display a file dialog that will allow for multiple selection.
Note: Hold the Ctrl in the file dialog to select more than one file.
The Remove button is used to remove a file that currently exists in the list.
At this point, the fields for the file that will be imported may or may not contain column
definitions. If a heading exists in the imported file, RightEdge will try its best to determine
what column maps to what. RightEdge also attempts to auto-detect the delimiter (tab,
comma, etc).
Import Settings
Clicking the Load... button will allow for retrieval of previously saved field settings. The
Save button allows the currently set fields to be saved to disk for later use. This is
particularly useful if the same file is parsed on a regular basis.
© 2015 RightEdge Systems, LLC
132
RightEdge Help
Autodetect Click this button to force RightEdge to auto-detect the columns within the
file.
Symbol Name Specify the name of the symbol as it will appear in the Watchlist.
Details Allows additional information to be set for this symbol. For example, if this is a
futures contract, set the expiration date in the symbol details screen.
Bars or Ticks Specifies whether this data file contains bar or tick data.
Bar Frequency Specifies the frequency of the imported data.
Tick Types Select this item to map tick types to the data file. RightEdge supports bid,
ask and last tick types.
Fields Tab
If the field definitions are not retrieved from disk, it will be necessary to
specify them manually. These can be specified regardless of the tab selected by simply
clicking the header of the sample data shown in the output window. In this particular
case, it was necessary to select the proper delimiter. This file is comma delimited,
therefore, we have select the Comma checkbox.
© 2015 RightEdge Systems, LLC
How Do I?
133
Additional Fields
Additional fields are used to define fields that are not actually contained within a line of
data. In other words, these are data fields that are not seen within the output window.
A sample of this might be a symbol name or an exchange.
For example, if the exchange is not listed within the data file, the exchange can become a
user defined value that is set with each row. Another source that may be used is the
filename itself. Some data streams may put information about the data in the filename.
© 2015 RightEdge Systems, LLC
134
RightEdge Help
Click the Add... button to define a new import field. Click the Edit... button to modify the
settings of an existing user defined import field. Click the Delete... button to remove the
user defined import field from the list.
Select the way the month is formatted in the data file. M represents a 1 or 2 digit month
value. MM represents a month value that is always 2 digits.
Delimiter
Comma and/or Tab and /or Semicolon are common delimiters. If the file is not comma,
semicolon or tab separated, uncheck all of the delimiter checkboxes and type the delimiter
into the Other field.
Characters to Ignore
Each character entered into this field will be stripped before being placed into the data
store. Enter one or more characters here.
Note: Enter each character without a delimiter as each character is treated
independently.
Header Rows
Many data files contain one or more rows at the beginning of the file to give information
about the row contents. It is likely necessary that these lines will need to be skipped for
the importer. Specify the number of lines to skip at the beginning of the file.
Formats Tab
The formats tab is used to define the date and time elements and how they're
comprised.
© 2015 RightEdge Systems, LLC
How Do I?
135
Date Format
This dropdown contains a list of common date formats.
Time Format
This dropdown contains a list of common time formats.
Date Separator
Dash and/or Slash are common delimiters. If the date is not slash or dash separated,
uncheck both Dash and Slash and type the delimiter into the Other field.
Decimal Separator
Specify the character that is used to indicate a decimal value.
Thousands Separator
Specify the character that is used to indicate a thousands separator.
Timestamp at end of bar
Indicates that the time value encountered is when the bar is ending. By default,
RightEdge assumes that the timestamp in the imported file indicates the beginning of the
bar.
Dates in descending order
© 2015 RightEdge Systems, LLC
136
RightEdge Help
By default, RightEdge expects the dates of each bar to appear in ascending order. Select
this option to reverse this.
Advanced
Click this button to specify the date and time elements independently.
Date Order
Specifies the order in which the date elements appear.
Date Separators
Enter one or more characters used to split the date elements. This is used for dates only.
Date/Time Separators
Enter one or more characters used to split the date and time elements. This is used when
the date and time is specified in the same column.
The time and date formats are shown below.
Date format notation
yyyy = 2007
yy = 07 yyy = 107
M =1
MM = 01 MMM = Jan MMMM=January
d =1
dd = 01
Time format notation
© 2015 RightEdge Systems, LLC
How Do I?
h = hour
137
m = minute s = second t = am or pm
h = 12 hour
H = 24 hour
hh, mm, ss = leading zero
h, m, s = no leading zero
Time Separators
Enter one or more characters used to split the time elements. This is used for time only.
Test Input
Enter in a test line of data here to test the current selections in the date and time drop
downs. The output will be displayed in the Test Output field.
Format Sample
The importer will generate a sample line based on the current drop down selections. This
sample is displayed here.
Watchlist Tab
RightEdge now has enough information to begin mapping the data within each
column.
© 2015 RightEdge Systems, LLC
138
RightEdge Help
The importer will allow the symbols to be created within an existing symbol folder within
the watchlist or allow for a new folder to be created.
Add imported symbols to watchlist
Check this box to import the symbols and the associated data directly into the watchlist.
Add to existing folder
Specifies that the symbol and associated data will be imported to an existing folder within
the watchlist. Select the desired name from the dropdown.
Create new folder
Specifies that the symbol and associated data will be imported to a new folder name
specified.
See Also
Bar Data Cleanup
© 2015 RightEdge Systems, LLC
How Do I?
139
10.11.1 Bar Data Cleanup
The bar data cleanup utility is used to identify problems with bar data. The utility looks
for:
Bar timestamps that are not rounded to the correct frequency. An example of this
would be 5 minute bars where the timestamps would be precisely every 5 minutes. If
one or more bar timestamps does not fall precisely on this boundary, RightEdge will flag
it as a bar timestamp not rounded based on bar frequency.
Duplicate bars for the same timestamp. If two or more bars contain the exact same
timestamp, this will be logged as a problem.
Duplicate bars after rounding for the same timestamp. If a bar is out of the frequency
boundaries, it would be rounded, however, this rounding may create a collision with
another bar. This will be flagged as an issue.
When issues are found within the bar data, the symbol, frequency, timestamp and price
data are all displayed in the clean up list. You may use the Bar Data Editor to fix these
problems manually or click the Autofix All button to allow RightEdge to make an attempt to
fix these problems automatically.
See Also
Import Data
Bar Data Editor
10.12 Analyze Simulation Results
The System Results screen contains a great deal of information and also a great deal of
flexibility when deciding how to utilize the information. This topic will deal with
interpreting the information as well as managing it for your needs with features such as
exporting and printing. This section is broken up into two main areas. The first area
describes the functionality presented within the system results and the second area goes
into detail about the information that is presented.
1. Manipulating System Results
2. Interpreting System Results
a. Summary
b. System Parameters
c. Position List
d. Trade List
e. Symbol Results
f. Scan
g. Charts
Manipulating System Results
When a simulation has completed, the system results are displayed in the document area
of RightEdge. The System Results document contains multiple tabs each assessing
© 2015 RightEdge Systems, LLC
140
RightEdge Help
different aspects of the simulation.
System Results tabs are external plugins that can be toggled on and off. See the System
Results screen documentation for more information on loading plugins from third parties
and toggling existing system result screens on and off.
Each tab contains features that are common. These features can be accessed using a
combination of items on the context menus and items in the main menu. The statistics
windows, which are those windows that contain textual information as opposed to
graphical information, have ability to export to common formats as well as print.
When a grid is displayed, right click on the grid area.
This context menu will allow for exporting. Supported formats are tab delimited, CSV
(common separated) and HTML. This menu also facilitates displaying system results
charts that are not displayed by default. For more information on configuring system
results default charts, see System Results Options.
Each of the grids can also be printed. Select the desired tab and select Print... from the
File menu.
The grids columns for the Trade List, Symbols Results and Scan tabs can also be
manipulated and sorted. To sort, click any of the column headings. Click once to sort
ascending and click the same column again to sort descending. To move a grid column
into another position, click the column heading and hold the left mouse button down.
Drag the column to the desired location and release the mouse button.
Interpreting System Results
Each tab represents the results of the simulation. The textual versions of the result
breakdowns are in the first four tabs titled Summary, Trade List, Symbol Results and Scan.
Click any of the areas to retrieve more information.
Summary
The summary tab contains a list of totals broken down horizontally into all trades (long &
short combined), long only trades, short only trades and buy and hold. The vertical
breakdown groups information about this simulation into manageable categories.
Capital Summary
© 2015 RightEdge Systems, LLC
How Do I?
Starting Capital
Ending Capital
Net Profit ($)
Net Profit (%)
APR
Exposure
141
The amount of capital set in the simulation
to begin with.
The total amount of capital that is in the
account after all trades are placed. This will
include the starting capital.
The total amount of profit or loss
represented as currency.
The total amount of profit or less
represented as a percentage against the
starting capital.
The calculated annual percentage return of
the profit or loss.
The average exposure of capital to the
market.
System Totals
Number of Trades
Maximum Profit
Maximum Loss
Average Profit ($)
Average Profit (%)
Average Bars Held
Maximum Exposure
Max Exposure (%)
Max Exposure Date
Max Exposure (%) Date
Max Drawdown ($)
Max Drawdown (%)
Max Drawdown Date
Max Drawdown (%) Date
© 2015 RightEdge Systems, LLC
The total number of trades the simulation
opened.
The highest profit achieved for all trades in
the group.
The largest loss encountered over all trades
in the group.
The average profit from a currency
standpoint over all trades in the group.
The average profit from a percentage
standpoint over all trades in the group.
The average number of periods that a
position was held over all trades in the
group.
The maximum value exposed to the market
represented as currency.
The maximum value exposed to the market
represented as a percentage.
The date when the maximum currency
exposure occurred.
The date when the maximum percentage
exposure occurred.
The maximum drawdown encountered during
this simulation represented as currency.
The maximum drawdown encountered during
this simulation represented as a percentage.
The date when the maximum currency
drawdown occurred.
The date when the maximum percentage
drawdown occurred.
142
RightEdge Help
Winning Totals
Winning Trades
The number of trades where the profit is
greater than 0. Trades that break even are
considered losing trades.
Winning %
The percentage of trades where the profit is
greater than 0.
Gross Profit
The total amount of profit represented as
currency.
Average Profit ($)
The average amount of profit represented
as currency.
Average Profit (%)
The average amount of profit represented
as a percentage.
Average Bars Held
The average number of periods each winning
position was open.
Consecutive Winners
The number of winning trades in a row.
Losing Totals
Losing Trades
The number of trades where the profit was
less than or equal to 0. Trades that break
even are considered losing trades.
Losing %
The percentage of trades where the profit is
than or equal to 0.
Gross Loss
The total value lost represented as
currency.
Average Loss ($)
The average amount lost represented as
currency.
Average Loss (%)
The average amount lost represented as a
percentage.
Average Bars Held
The average number of periods each losing
position was open.
Consecutive Losers
The number of losing trades in a row.
System Parameters
This tab contains information about this particular system run.
Run Date
The date and time the system was run.
Run Length
The amount of time taken to complete the
system execution.
System Parameters
This contains a list of all optimization
parameters contained within the system and
the value of those parameters for this run.
Position List
© 2015 RightEdge Systems, LLC
How Do I?
143
The position list contains each trade aggregated into its respective position. Positions are
nothing more than a grouping of trades. This screen shows the trades grouped by
position.
This position list is split into two pieces. The top portion of the screen contains the list of
positions established throughout the system. When a position is clicked or selected, the
trades that are associated with this position are shown in the trade list below.
Position List Columns
Symbol
The tradable symbol name.
Type
The position type taken, long or short.
Shares
The maximum number of shares or contracts
held throughout the lifetime of this position.
Open Date
The date the first trade was made for this
position.
Close Date
The date the position was completely
liquidated.
Avg Entry
The weighted average of opening trades in
this position
Avg Exit
The weighted average price that the shares
or contracts were closed/covered at.
Bars Held
The number of periods the position was
open.
P/L Bar
The average amount gained or lost on a per
bar basis.
P/L
The total amount gained or lost throughout
the life of the position.
Description
The user assigned name of this position.
Trade List
The trade list contains the complete list of every trade generated by the simulation.
Trade List Columns
Symbol
Price
Commission
The tradable symbol name.
The type of transaction, either buy, short,
sell or cover.
The date the trade was placed.
Number of shares or contracts that were
filled in this transaction.
The fill price of the trade.
The cost of commissions for this trade.
Amount
The amount of capital added or deducted
Type
Transaction Date
Shares
© 2015 RightEdge Systems, LLC
144
RightEdge Help
Description
Cash
from the account for this trade.
The user assigned name given to this trade.
The amount of cash available in the account
after this transaction was completed.
Symbol Results
The symbol results tab contains an aggregated list of the trades. The trades are
aggregated by symbol. This provides a way to quickly determine which symbols are
performing and which are not.
Symbol Results Columns
Symbol
The tradable symbol name.
Profit
The amount gained or lost for this symbol.
Profit per Bar
The amount gained or lost averaged over
the number of bars held.
Trades
Total number of trades entered with this
symbol.
Winners
The number of trades with a profit greater
than 0.
Losers
The number of trades with a profit less than
or equal to 0.
Winning %
The number of winning trades divided by the
number of losing trades.
Avg Bars Held
The average number of periods each
position was open.
Scan
The scan tab is useful for determining the next action that the simulation would take. For
example, if the system trades daily bars, the scan would show the next day's actions to
be taken such as opening a new position or closing an existing position. Theoretically, a
daily, weekly or monthly time frame trader can use the results from the scan and generate
orders manually.
Scan Columns
Date
Order Type
Symbol
The date that the action should occur.
The type of order to be submitted to the
broker. This could be any number of the
order types supported by RightEdge.
The tradable symbol name.
© 2015 RightEdge Systems, LLC
How Do I?
Order Price
Winners
Losers
Winning %
145
If this is a limit order, the price of the limit
order will be specified here.
The number of trades with a profit greater
than 0.
The number of trades with a profit less than
or equal to 0.
The number of winning trades divided by the
number of losing trades.
Charts
While the grid based system results are opened after every simulation, the chart tabs can
have any number of charts pull up. There are a number of potential chart tabs and the
default chart tabs are configurable under the Options dialog.
RightEdge ships with five charts.
Profit Distribution
The Profit Distribution chart breaks down the profit and loss values into scaled
values. A sample profit distribution chart is shown below.
Use the Display dropdown to toggle between representing the chart in profit and loss
© 2015 RightEdge Systems, LLC
146
RightEdge Help
percentages and currency.
System Breakdown
The system breakdown chart is a bit unique in that it is a hybrid of text and
graphics. It also has some interactivity features where you can select the
aggregation level of weekly, monthly or yearly. The results are calculated in real
time and the chart and results areas are updated. An example of the system
breakdown chart is below.
Equity Curve
The equity curve chart represents the cash and asset value at each point during
simulation. This is a visual way of assessing drawdown and exposure. The Buy
and Hold account value is represent as a line displayed over the cash and asset
value stacked series.
MAE / MFE
This chart is similar in look and feel to the profit distribution chart, however, this
chart breaks out the MAE and MFE calculations on a percentage or currency basis.
The chart is broken into two pieces. The MAE is displayed on the top half of the
chart and the MFE is displayed on the bottom half.
Symbol Breakdown
The symbol breakdown chart is a simple pie chart that displays all symbols that
took trades during the simulation period. This is chart allows a quick and easy
way to visualize which symbols are taking trades and which symbols are not. This
© 2015 RightEdge Systems, LLC
How Do I?
147
can help identify and prune "dead" symbols.
See Also
General Options
10.13 Save Chart Settings
RightEdge has the ability to save charts for later application. More specifically, it saves
the chart's indicators and the associated indicator values so that they can be applied to
another chart.
Creating Saved Charts
To save a chart in RightEdge, begin by opening a chart from Watchlist pane. Drag and
drop the desired indicators onto the chart and set the desired parameters. Once the
chart is set up, right click on the chart itself and select the Save Chart Settings... menu
item. The Save Chart Settings will dialog will prompt for a name for this saved chart.
This name is defined by the end user, but must be unique.
This saved chart has now been saved. To recall a saved chart, right click on any symbol
in the Watchlist pane as shown below.
© 2015 RightEdge Systems, LLC
148
RightEdge Help
Select Quick Chart (With Chart Settings) and notice that the chart settings that were
just saved appear in this list. The number of chart settings that can be saved is
unlimited.
If a chart is already opened in the document area, saved chart settings can be applied to
that chart by right clicking on the chart and selecting the desired saved chart name from
the Apply Chart Settings menu item.
Managing Saved Charts
Right click on an open chart and if there are any saved charts, the Manage Chart
Settings... menu item is available. Click this menu item to display the Chart Settings
dialog.
For detailed information about the Chart Settings dialog see the Chart Settings section.
See Also
Indicator Pane
Watchlist Pane
10.14 Start Live Data
This help topic provides a very high level overview of back testing within RightEdge. It is
assumed that you have already configured a live data service and a Watchlist. If not,
please follow the links below.
© 2015 RightEdge Systems, LLC
How Do I?
149
Configuring Services
Setup a WatchList
Select the symbols on the Watchlist pane to begin collecting data for. If you have not
configured a watchlist, see the Setup a Watchlist section before continuing.
Now that the symbols are selected, select Start Data Feed button from Live Options
toolbar. If there are no errors starting the collection, live data will be shown in the Live
Data pane.
Once live data is started it can be stopped by the stop button on the live options toolbar
or by stopping a currently running system.
Note: Open a live chart based on the collected data by double clicking any symbol in the
live data list.
If you encounter any errors starting live data collection, refer to the Configuring Services
section of the help to ensure that a live data provider is properly configured.
See Also
Using the RightEdge Environment
Setup a Watchlist
Start Live System
Charting Overview
10.15 See a Chart Now!
This topic serves as a quick guide to viewing a historical chart in RightEdge in less than a
minute. RightEdge ships with data services and a Watchlist preconfigured. Locate the
"Dow 30" folder within the Watchlist. Place a check next to the Dow 30 folder. This will
select all of the symbols beneath this folder.
© 2015 RightEdge Systems, LLC
150
RightEdge Help
Click the update checked symbols button as shown above. Note: You must be
connected to the internet. Data will be retrieved for all 30 symbols. When the
download completes, double click any symbol in the list and a chart will be show in the
document area.
© 2015 RightEdge Systems, LLC
How Do I?
151
10.16 Setting a Simulated Broker
The Service Setup dialog contains information about the currently configured services.
Another item of interest on this dialog is the Backtesting Broker list. This option allows for
a separate broker plugin to be run during a backtest. Since RightEdge runs backtesting
and live code in the exact same way, it is generally not acceptable to have a live broker
receiving orders in a simulated environment.
For this reason, the Backtesting Broker assignment is necessary. The default is the
Paper Broker that ships with RightEdge. However, this can be any broker that works in a
simulated environment and acknowledges simulated orders. The simulated broker must
also handle available cash, open positions, buying power, etc.
See Also
Run Backtest/Simulation
Paper Broker Settings
Configuring Services
Modifying Services
Removing Services
10.17 Setting a Timeout
Timeouts can be set one of two ways in RightEdge. The first method involves setting the
value at the system level within the trading system project settings. Once a trading
system is open, click on the top most tree item in the Trading System pane. This will
display the global properties for this trading system. If the Properties pane does not
© 2015 RightEdge Systems, LLC
152
RightEdge Help
appear, force it to the visible state by selecting Properties Window from the View
menu.
The Bar Count Exit field is highlighted above. Note that this is represented as a whole
number and not a decimal. So in the case demonstrated above, a 10 bar timeout has
been set. Set the timeout field to 0 if no timeout order is desired.
Timeout orders can also be set in code where they can be controlled more dynamically.
C#
public class SystemMain : SystemBase
{
public override void Startup()
{
// Setting a global timeout for 10 bars
PositionManager.BarCountExit = 10;
}
}
Visual Basic
Public Class SystemMain
Inherits SystemBase
Public Overloads Overrides Sub Startup()
' Set a global timeout for 10 bars
PositionManager.BarCountExit = 10
End Sub
End Class
The samples above show the timeout being set in the startup function. This is identical to
© 2015 RightEdge Systems, LLC
How Do I?
153
setting the timeout in the system properties. However, the BarCountExit variable can be
set in any function and it is honored whenever a new position is opened (not necessarily
when it is submitted).
See Also
Timeout
New Trading System
Trading System Pane
10.18 Setting a Profit Target
Profit targets can be set one of two ways in RightEdge. The first method involves setting
the value at the system level within the trading system project settings. Once a trading
system is open, click on the top most tree item in the Trading System pane. This will
display the global properties for this trading system. If the Properties pane does not
appear, force it to the visible state by selecting Properties Window from the View
menu.
The profit target field is indicated in red. Note that this is represented as a decimal. So
in the case demonstrated above, a 3% profit target has been set. Set the profit target
field to 0 if no profit target order is desired.
Profit targets can also be set in code where they can be controlled more dynamically.
C#
public class SystemMain : SystemBase
© 2015 RightEdge Systems, LLC
154
RightEdge Help
{
public override void Startup()
{
// Setting a global profit target
PositionManager.ProfitTarget = 0.03;
}
}
Visual Basic
Public Class SystemMain
Inherits SystemBase
Public Overloads Overrides Sub Startup()
PositionManager.ProfitTarget = 0.03
End Sub
End Class
The samples above show the profit target being set in the startup function. This is
identical to setting the profit target in the system properties. However, the ProfitTarget
variable can be set in any function and it is honored whenever a new position is opened
(not necessarily when it is submitted).
See Also
Profit Target
New Trading System
Trading System Pane
10.19 Setting a Stop Loss
Stop losses can be set one of two ways in RightEdge. The first method involves setting
the value at the system level within the trading system project settings. Once a trading
system is open, click on the top most tree item in the Trading System pane. This will
display the global properties for this trading system. If the Properties pane does not
appear, force it to the visible state by selecting Properties Window from the View
menu.
© 2015 RightEdge Systems, LLC
How Do I?
155
The Stop Loss field is indicated in red. Note that this is represented as a decimal. So in
the case demonstrated above, a 5% stop loss has been set. Set the stop loss field to 0 if
no stop loss order is desired.
Stop Losses can also be set in code where they can be controlled more dynamically.
C#
public class SystemMain : SystemBase
{
public override void Startup()
{
// Setting a global stop loss
PositionManager.StopLoss = 0.05;
}
}
Visual Basic
Public Class SystemMain
Inherits SystemBase
Public Overloads Overrides Sub Startup()
PositionManager.StopLoss = 0.05
End Sub
End Class
The samples above show the stop loss being set in the startup function. This is identical
to setting the stop loss in the system properties. However, the StopLoss variable can be
set in any function and it is honored whenever a new position is opened (not necessarily
when it is submitted).
© 2015 RightEdge Systems, LLC
156
RightEdge Help
See Also
Profit Target
New Trading System
Trading System Pane
10.20 Collecting Forex Data
If you are receiving ticks, but not bars while collecting forex data, it is likely that your
forex provider is not sending a last trade tick. This is uncommon in everything else but
spot forex. Typically in this case, the forex dealer or data provider sends only bid and ask
data. If this is the case, a small change to your symbol configuration will allow RightEdge
to generate bar data from either the bid, the ask or the mean between the bid and ask.
Right click on any symbol and select Symbol Information. Be sure the Asset Type is
"Forex" and most importantly that the Build Prices From selection is either bid, ask or Mid.
© 2015 RightEdge Systems, LLC
Data Sources
11
Data Sources
11.1
Configuring Data Sources
157
A service is a type of plugin that may supporting retrieving realtime data, retrieving
historical data, or connecting to a broker. Services are associated with symbols in the
Watchlist pane. You can set up a hierarchical folder structure and have child folders
inherit settings from their parents (or override those settings).
Simply put, this is how to retrieve and act on data.
RightEdge provides a simple, yet robust means of organizing not only data, but the means
in which data is acted upon. Services are configured at a global level, yet they are
assigned at a group level and can be optionally inherited down the tree.
First, the services must be configured.
Select the Configure Services... menu item from Tools menu.
RightEdge comes default with a predefined service for Yahoo and it is named "Historical".
The Service Setup list will show the capabilities of a configured server. Since some
plugins support more than one piece of functionality, this is the place to determine the
available functionality for each plugin and whether or not it is currently configured to use.
In this case, the Yahoo service has the ability to retrieve historical data. It does not
have the ability to retrieve live data, nor does it provide broker services.
To add a new service, click the New... button. A wizard prompting for information that
this service needs will follow. Upon the completion of the wizard steps, the service will
appear in the list.
© 2015 RightEdge Systems, LLC
158
RightEdge Help
Assigning Services
Setting up a service is the first step in realizing the functionality of the service. The next
step is to assign this service to a group of symbols.
RightEdge ships with a couple of default folders already configured. The two symbol
folders are the Nasdaq 100 and Dow 30. Right click on the top level node or any folder
underneath and select Configure Folder...
© 2015 RightEdge Systems, LLC
Data Sources
159
The Dow 30 folder contains the list of symbols that are contained within this folder.
Folders can contain any number of symbols, the only requirement is that they're all the
same frequency (i.e. daily, weekly, 5 minutes, 1 minute, etc). This is set (or inherited) in
the General tab.
Items added or removed from Symbols field with be added or removed from the folder and
subsequently the user interface.
Click the Services tab to assign a service to this folder.
© 2015 RightEdge Systems, LLC
160
RightEdge Help
As previously mentioned, RightEdge ships with a predefined historical data plugin for
Yahoo. This service is configured with the name "Historical". "Historical" shows up in the
list and is currently assigned to the Dow 30 folder. For the case of historical data plugins,
it is possible to set a start date at which historical data is retrieved. For example, GE
contains nearly 50 years of historical data on Yahoo. It may not be necessary to retrieve
this much data. Select the Data Download Start Date to limit this data collection.
Broker and real time data services will also be assigned here.
For software developers interested in developing service plugins, please visit the Service &
Plugin Overview section.
See Also
Modifying Services
© 2015 RightEdge Systems, LLC
Services
12
Services
12.1
Modify Service
161
Once a service is created, the parameters of the service may be changed. Select
Configure Services... from the Tools menu. This dialog displays a list of currently
configured services. Select the service to change and click the Modify button.
This dialog is similar to that displayed when the service is initially configured.
Friendly Name This is the text that will be displayed when referencing this service in the
Watchlist folder setup. These names must be unique.
Server Address Some services may need to connect to a pre-defined IP address. This is
usually provided by the service provider. If this is required, this field will be enabled. An
example of a server address might be 206.152.8.1 or data.mydataprovider.com.
Port Some services may need to connect to a pre-defined port. This is usually provided
by the service provider. If this is required, this field will be enabled. An example of a port
might be 8000 or 7623. This is always a single number.
User Name Some services may need to authenticate the requestor. This field will hold
the user name given to you by your service provider. If this is required, this field will be
enabled.
Password Some services may need to authenticate the requestor and will require a
password. This field will hold the password given to you by your service provider. If this
is required, this field will be enabled.
Other Settings Some services may have service specific settings that apply to that
particular service. If this is the case, the Other Settings button will be enabled. When
© 2015 RightEdge Systems, LLC
162
RightEdge Help
this button is clicked, the service will display the user interface supplied by the service.
See Also
Configuring Services
Simulated Broker
Removing Services
© 2015 RightEdge Systems, LLC
Charts
13
Charts
13.1
Using RightEdge Charts
163
Charts are one of the most important components of any trading system development
package. After all, that's where all of the action is displayed in living color. We made it a
point to create flexible chart settings and navigation with features that not only make it
easier to get from point A to point B, but to do it in style.
A chart can be displayed in any number of ways in RightEdge, but the easiest way is to
double click a symbol in the Watchlist pane. If the Watchlist pane is not visible, enable it
by selecting Watchlist from the View menu.
First some points about data display control. RightEdge charts provide the standard way
of zooming in and out using the toolbar buttons (
and
) to show more bars or less
bars. However, in addition to this, RightEdge will also allow a finer control by dragging the
mouse over bars to be displayed. This is done simply by starting at the left side of the
chart, clicking the left mouse button and dragging to desired bar on the right. Once the
mouse button is released, the new selection is zoomed in.
© 2015 RightEdge Systems, LLC
164
RightEdge Help
For navigation, RightEdge also provides the familiar controls, but in addition to using the
scrollbar, RightEdge makes use of the mouse wheel. Move the mouse wheel down to go
back in time and up to move forward in time.
Finally, the chart package in RightEdge provides a combination of scrolling and navigating
within the X and Y axis. Both axes are broken up until thirds. If you place the mouse
cursor on left third of the X axis (date/time axis), the cursor becomes a "sizing" cursor.
Click and hold the left mouse button while moving the mouse left or right and more or less
bars will become visible in the left side of the chart. Release the mouse button when the
desired number of bars come into view. Now move the mouse cursor to the middle third of
the X axis and the cursor becomes hand with an extended index finger. Click and hold the
left mouse button and this will move the chart from left to right based on the mouse
movement. Finally, move the mouse cursor to the right third of the X axis and click and
hold the left mouse button. This will allow finer control of the bars displayed on the right
hand side of the chart. This logic holds true for the Y axis as well.
Changing Frequencies
RightEdge supports a number of frequencies. The most common frequencies are shown on
the chart toolbar alongside the zoom features discussed previously. The default is daily,
abbreviated as "1D". Click the "1D" text to display the frequency drop down. Depending
on the data that is currently loaded, the available frequencies are enabled. For example,
if the lowest frequency of the data is daily bars, anything less than one day is unavailable.
Select Weekly from the dropdown to automatically rebuild this chart with the same data
© 2015 RightEdge Systems, LLC
Charts
165
except for that bar data is aggregated to weekly.
Using Indicators
Of course, indicators are tightly coupled with charts. Putting indicators onto a chart is
accomplished but a simple drag and drop operation. All of the indicators available for drag
and drop and system developers are located in the Indicators panel. This panel is on by
default, but if it cannot be located, select the Indicators menu option from View menu.
The indicators are grouped. Out of the box, RightEdge ships with over 80 indicators in five
separate groups. For simplicity sake, let's plot a simple moving average (SMA) onto this
chart. Click the Simple Moving Average once and hold the left mouse button down. Drop
the indicator onto the chart frame and the following dialog is presented:
© 2015 RightEdge Systems, LLC
166
RightEdge Help
The defaults are presented and clicking OK will plot a 50 period simple moving average
onto the chart. It's that simple.
The indicator can be removed from the chart by selecting the indicator with the left
mouse button to "highlight" the indicator line and hitting the delete key. The plotted 50
day simple moving average selected is shown below.
© 2015 RightEdge Systems, LLC
Charts
167
Not all indicators are useful on the price pane of course. When dragging an indicator onto
a chart, a default pane is recommended. This pane can be named anything. If the pane
name does not exist, a new pane is created. Dragging a Relative Strength indicator onto
the chart demonstrates this.
© 2015 RightEdge Systems, LLC
168
RightEdge Help
To remove user defined panes, right click in the pane and select Close Pane.
Using Chart Objects
Chart objects encompass all items that are related to shapes and not necessarily price
information. Chart objects are used to help identify or outline patterns such as support
and resistance lines or channels. Chart objects are useful to both pure technical as well
as discretionary traders. The Chart Objects pane is located in the upper left pane by
default. If the Chart Objects pane is not visible, select Chart Objects from View menu.
The Chart Objects panel breaks the objects down into logical types. Simply click an
object heading to expand the group and reveal the underlying available objects. To start,
expand the Lines group. Click the Line object and drag it onto an open chart. Release
the mouse button to establish the first point of the line. Move the mouse to change the
length and direction of the line.
© 2015 RightEdge Systems, LLC
Charts
169
Once the line is in the desired position, click the left mouse button to finish the line
creation. Once the line is created, items specific to this object will show in the properties
window. Objects that are created using this method are changeable, movable, and can
even be removed. To change the direction or size of this line object, click either end of
the line on the end points and hold the left mouse button down while moving the mouse.
When the mouse is released, the object will snap to its new position. Move towards the
middle of the line and a "hand" mouse cursor will appear. Click the left mouse button drag
the object to the desired location. Release the mouse button and it will be placed in this
location. Hitting the delete key will remove the line object from the chart.
Notice that the chart objects maintain their location. Scrolling the chart will keep the line
in its original position. The same holds true for various time frames. If the line was drawn
on a chart showing daily bars, then the chart timeframe is switched to weekly, the line will
update accordingly.
Object properties are updated in real time. Select the Color property in the property grid
and select any color. The color of the line will change to the selected color. The width
indicates how many pixels are used to draw the line. The larger the number, the wider the
line. Transparency controls how much of the background is blended with the object. The
range is 0 through 255. 0 indicates complete transparency, in other words, an invisible
object. 255 indicates that the line will be solid and the background of the chart will not
show through. To demonstrate how all of these settings effect this simple line, change
the width to 3, the transparency value to 40 and the Smoothing Mode to Anti Alias. With
these settings, it's quite obvious how a support or resistance line could be drawn without
© 2015 RightEdge Systems, LLC
170
RightEdge Help
getting in the way of the price movement.
The chart objects also support basic shapes such as circles, rectangles, ellipses, and
parallelograms. Expand the Basic Shapes chart object group and drag a Rounded
Rectangle onto the chart. There are more properties for this object as shown below.
In this example, the line color was changed to dark gray. The Filled flag was set to true,
the fill color to light green and fill transparency to 120.
To demonstrate a more complicated object and show how several objects might work
together, go back to the Lines object group and drag a Fibonacci Line onto the chart.
Set the properties for this object as shown below.
© 2015 RightEdge Systems, LLC
Charts
171
The Fibonacci line draws lines at the well known Fibonacci retracement values. Stretch
the rounded rectangle to highlight these important retracements. It now becomes clear
when the price penetrates that retracement area. All of these objects are still not in the
way of the price bars.
13.2
Opening Live Charts
Live charts are available while live data is being collected. It is important to have a grasp
on how to configure and collect live data in RightEdge first. See the Capturing Live Data
topic for more information. While real time data is streaming, data is stored at the
specified frequency so that charts can be created. To open a single chart, double click a
symbol in the Live Data pane. To open one or more live charts, the Select Live Chart
screen is an appropriate choice. When displayed, a list of current symbols that are
streaming will display in the list as shown below.
Use the Ctrl key to select multiple symbols. When the desired symbols are selected, click
the OK button. If the charts for these symbols are not already displayed in the main
document area, they will be created.
© 2015 RightEdge Systems, LLC
172
RightEdge Help
See Also
Using the RightEdge Environment
Capturing Live Data
Floating Documents and Charts
Stacking Charts
13.3
Bar Chart
A bar chart displays series as sets of horizontal bars that are grouped by category. Values
are represented by the length of the bars as measured by the x-axis. Category labels are
displayed on the y-axis. Bar charts are typically used to compare values between
categories.
Bar charts are typically used to represent volume on a stock chart as shown below.
© 2015 RightEdge Systems, LLC
Charts
173
See Also
Candlestick Charts
13.4
Candlestick Chart
Candlestick charts are sometimes referred to as Japanese candlestick charts since 17th
century Japanese traders were reported to use these types of charts to speculate on rice
prices. Candlesticks contain the same data as a normal bar chart but highlight the
relationship between opening and closing prices. The narrow stick represents the range of
prices traded during the period (high to low) while the broad mid-section represents the
opening and closing prices for the period.
If the close is higher than the open, the candlestick body is said to be "hollow" or "open".
A higher price is typically represented with a light color.
If the open is higher than the close, the candlestick body is said to be "dark" or "closed".
A lower price is typically represented with a dark color.
© 2015 RightEdge Systems, LLC
174
RightEdge Help
The chart above points out some of the basic features of the candlestick charts.
The "wick" portion of the chart is the high and low information. If there is a wick at the
bottom, this would be the lowest price of the bar. On the contrary, a wick at the top
most portion of the candlestick represents the high point of the day. If the candlestick is
open and has no top wick, the bar ended on the highest price. If the candlestick is closed
and has no bottom wick, the bar ended on the lowest price.
See Also
Candlestick Chart Patterns
Line Charts
Bar Charts
13.5
Line Chart
A line chart displays series as a set of points connected by a line. Values are represented
by the height of the point as measured by the y-axis. Category labels are displayed on
the x-axis. Line charts are typically used to compare values over time.
A line chart displays a series as individual straight lines, with a data point for each
category. The height of each data point is determined by the value.
Line charts can be used to represent price or volume data, however, they are typically
used to plot the values calculated from technical indicators, as shown below.
© 2015 RightEdge Systems, LLC
Charts
175
See Also
Bar Charts
Candlestick Charts
Technical Indicators
13.6
Stacking Charts
Often times it is desirable to see two or more charts in the document area. This can be
accomplished by stacking charts or viewing them side by side. To begin a stack
operation, click the tab area of the document with the left mouse button and begin to
drag the tab. When the drag operation begins, docking arrows will be displayed as shown
below:
© 2015 RightEdge Systems, LLC
176
RightEdge Help
In this example, the MSFT tab was dragged and the mouse cursor was brought to the
bottom dock arrow. Release the mouse the button on this dock arrow to dock MSFT
below AMZN as shown below.
© 2015 RightEdge Systems, LLC
Charts
177
To snap the chart or document back to the document area, simply grab the title bar
portion of the floating window and drag it back to the document area.
Each chart scrolls independently.
See Also
Using the RightEdge Environment
Floating Documents and Charts
13.7
Using Chart Objects
Chart objects are the groups of shapes, text and images that can be placed on a chart
both manually and programmatically. Each available chart object is displayed in the chart
object pane (shown below).
© 2015 RightEdge Systems, LLC
178
RightEdge Help
To place a chart object, first, open a chart and select the desired object from the list.
Drag and object onto the chart and release the mouse button. If an object requires one
or more points to complete plotting, this will be indicated by a crosshair cursor. Move the
mouse cursor to the next point and click the left mouse button. Continue this process
until all required points are plotted.
See Also
Using the RightEdge Environment
Chart Objects Pane
© 2015 RightEdge Systems, LLC
Chart Objects
14
Chart Objects
RightEdge ships with the following chart objects (alphabetically):
Archimedes Spiral
Arrow Line
Asynchronous Linear Regression Channel
Circle
Cross Channel
Downtrend Channel
Ellipse
Equal Channel
Equal Cycle Line
Fan
Fibonacci Fan
Fibonacci Circle
Fibonacci Cycle Line
Horizontal Line
Hyperbolic Spiral
Image
Label
Line
Lituus Spiral
Logarithmic Spiral
Linear Regression Line
Linear Regression Channel
Multi Arc
Open Linear Regression Line
Parabolic Spiral
Parallelogram
Percent Line
Rectangle
Rectangle Band
Rectangle Price
Rounded Rectangle
Sine Object
Square Cycle Line
Standard Channel
Standard Error Channel
Symmetry Line
Text
Triangle
Up/Down Trend Channel
Up Trend Channel
Vertical Line
See Also
Using Chart Objects
© 2015 RightEdge Systems, LLC
179
180
RightEdge Help
Chart Objects Pane
14.1
Chart Objects Archimedes Spiral
This Archimedes spiral is distinguished from the logarithmic spiral by the fact that
successive turnings of the spiral have a constant separation distance, while in a
logarithmic spiral these distances form a geometric progression.
To draw an Archimedes spiral, select the object from the Chart Objects Pane and drop it
on to an open chart.
There are appearance aspects of this object that can be changed in the Properties Pane.
Color Changes the color of the object.
Smoothing Mode Sets the drawing type of this object. Default draws a normal line. Antialias draws a smoother line at the expense of drawing performance.
Width This sets the size of the pen used to draw the outline of this object. A larger
number indicates a thicker line.
© 2015 RightEdge Systems, LLC
Chart Objects
181
Transparency The level of transparency given to this object. Valid numbers are 0-255,
where 0 is invisible or completely transparent and 255 indicates no transparency.
Sweep Angle Sets the angle of the end point of this spiral. A sweep angle of 360, for
example, will indicate that the spiral will complete one revolution.
See Also
Using Chart Objects
Chart Objects Pane
Chart Objects List
14.2
Chart Objects Arrow Line
This object is simply a line that can be drawn in any direction. The end of the line has an
arrow cap. The line can be rotated so that the arrow points in any direction.
To draw an arrow line, select the object from the Chart Objects Pane and drop it on to an
open chart.
© 2015 RightEdge Systems, LLC
182
RightEdge Help
There are appearance aspects of this object that can be changed in the Properties Pane.
Color Changes the color of the object.
Smoothing Mode Sets the drawing type of this object. Default draws a normal line. Antialias draws a smoother line at the expense of drawing performance.
Width This sets the size of the pen used to draw the outline of this object. A larger
number indicates a thicker line.
Transparency The level of transparency given to this object. Valid numbers are 0-255,
where 0 is invisible or completely transparent and 255 indicates no transparency.
See Also
Using Chart Objects
Chart Objects Pane
Chart Objects List
© 2015 RightEdge Systems, LLC
Chart Objects
14.3
183
Chart Objects Asynchronous Linear Regression Channel
A classic statistical problem is to try to determine the relationship between two random
variables. The Linear Regression line displays the statistically predicted price value.
To draw this object, select the object from the Chart Objects Pane and drop it on to an
open chart.
There are appearance aspects of this object that can be changed in the Properties Pane.
Color Changes the color of the object.
Smoothing Mode Sets the drawing type of this object. Default draws a normal line. Antialias draws a smoother line at the expense of drawing performance.
Width This sets the size of the pen used to draw the outline of this object. A larger
number indicates a thicker line.
Transparency The level of transparency given to this object. Valid numbers are 0-255,
where 0 is invisible or completely transparent and 255 indicates no transparency.
Open End Indicates whether or not the end lines are open, or will continue until the end
© 2015 RightEdge Systems, LLC
184
RightEdge Help
of the chart.
Open Start Indicates whether or not the start lines are open, or will continue until the
beginning of the chart.
Percentage The percentage that the up or down lines are drawn away from the center
line.
Show Center Line Indicates whether or not the center line will be drawn.
Show Down Line Indicates whether or not the lower line will be drawn.
Show Up Line Indicates whether or not the upper line will be drawn.
See Also
Using Chart Objects
Chart Objects Pane
Chart Objects List
14.4
Chart Objects Circle
This object is simply an ordinary or basic circle that can be placed anywhere on the chart.
To draw a circle, select the object from the Chart Objects Pane and drop it on to an open
chart.
© 2015 RightEdge Systems, LLC
Chart Objects
185
There are appearance aspects of this object that can be changed in the Properties Pane.
Color Changes the color of the object.
Smoothing Mode Sets the drawing type of this object. Default draws a normal line. Antialias draws a smoother line at the expense of drawing performance.
Width This sets the size of the pen used to draw the outline of this object. A larger
number indicates a thicker line.
Transparency The level of transparency given to this object. Valid numbers are 0-255,
where 0 is invisible or completely transparent and 255 indicates no transparency.
Filled Indicates whether or not this circle will be filled. If not filled, the circle's interior will
be transparent.
Fill Transparency Indicates the level of transparency for the circle's interior. Ignored if
Filled is set to False.
Fill Color Specifies the color that will be used when the circle is filled. Ignored if the Filled
is set to False.
© 2015 RightEdge Systems, LLC
186
RightEdge Help
See Also
Using Chart Objects
Chart Objects Pane
Chart Objects List
14.5
Chart Objects Cross Channel
This object is a free form channel that does not take any chart data into consideration.
The anchor point (the first point) controls the direction of the channel lines. The second
and third points control the width of the channels in relation to one another.
To draw a cross channel, select the object from the Chart Objects Pane and drop it on to
an open chart.
There are appearance aspects of this object that can be changed in the Properties Pane.
Color Changes the color of the object.
© 2015 RightEdge Systems, LLC
Chart Objects
187
Smoothing Mode Sets the drawing type of this object. Default draws a normal line. Antialias draws a smoother line at the expense of drawing performance.
Width This sets the size of the pen used to draw the outline of this object. A larger
number indicates a thicker line.
Transparency The level of transparency given to this object. Valid numbers are 0-255,
where 0 is invisible or completely transparent and 255 indicates no transparency.
Line Count This sets the number of lines drawn out from the center line. In the example
above, this is set to 2 to give a total of 5 lines (1 center line, 2 lines above, 2 lines
below).
See Also
Using Chart Objects
Chart Objects Pane
Chart Objects List
14.6
Chart Objects Downtrend Channel
This object is not a free form channel. It uses the price data on the chart to determine
the direction of the lines. The first point is the left point. The second point specifies the
right point of the channels.
To draw a downtrend channel, select the object from the Chart Objects Pane and drop it
on to an open chart.
© 2015 RightEdge Systems, LLC
188
RightEdge Help
There are appearance aspects of this object that can be changed in the Properties Pane.
Color Changes the color of the object.
Smoothing Mode Sets the drawing type of this object. Default draws a normal line. Antialias draws a smoother line at the expense of drawing performance.
Width This sets the size of the pen used to draw the outline of this object. A larger
number indicates a thicker line.
Transparency The level of transparency given to this object. Valid numbers are 0-255,
where 0 is invisible or completely transparent and 255 indicates no transparency.
Open End Indicates whether or not the end lines are open, or will continue until the end
of the chart.
Open Start Indicates whether or not the start lines are open, or will continue until the
beginning of the chart.
Percentage The percentage that the up or down lines are drawn away from the center
line.
Show Aux Line The auxiliary line are vertical lines that are drawn at either end of the
© 2015 RightEdge Systems, LLC
Chart Objects
189
start and end points. Select True to display these lines.
Show Center Line Indicates whether or not the center line will be drawn.
Show Down Line Indicates whether or not the lower line will be drawn.
Show Up Line Indicates whether or not the upper line will be drawn.
See Also
Using Chart Objects
Chart Objects Pane
Chart Objects List
14.7
Chart Objects Ellipse
This object is simply an ordinary or basic ellipse that can be placed anywhere on the
chart.
To draw an ellipse, select the object from the Chart Objects Pane and drop it on to an
open chart.
© 2015 RightEdge Systems, LLC
190
RightEdge Help
There are appearance aspects of this object that can be changed in the Properties Pane.
Color Changes the color of the object.
Smoothing Mode Sets the drawing type of this object. Default draws a normal line. Antialias draws a smoother line at the expense of drawing performance.
Width This sets the size of the pen used to draw the outline of this object. A larger
number indicates a thicker line.
Transparency The level of transparency given to this object. Valid numbers are 0-255,
where 0 is invisible or completely transparent and 255 indicates no transparency.
Filled Indicates whether or not this ellipse will be filled. If not filled, the ellipse's interior
will be transparent.
Fill Transparency Indicates the level of transparency for the ellipse's interior. Ignored if
Filled is set to False.
Fill Color Specifies the color that will be used when the ellipse is filled. Ignored if the
Filled is set to False.
© 2015 RightEdge Systems, LLC
Chart Objects
191
See Also
Using Chart Objects
Chart Objects Pane
Chart Objects List
14.8
Chart Objects Equal Channel
This object is a free form channel that does not take any chart data into consideration.
The first point is the anchor point. The second point controls the horizontal orientation of
the channels. The final point specifies the vertical span of the channels.
To draw an equal channel, select the object from the Chart Objects Pane and drop it on
to an open chart.
There are appearance aspects of this object that can be changed in the Properties Pane.
Color Changes the color of the object.
© 2015 RightEdge Systems, LLC
192
RightEdge Help
Smoothing Mode Sets the drawing type of this object. Default draws a normal line. Antialias draws a smoother line at the expense of drawing performance.
Width This sets the size of the pen used to draw the outline of this object. A larger
number indicates a thicker line.
Transparency The level of transparency given to this object. Valid numbers are 0-255,
where 0 is invisible or completely transparent and 255 indicates no transparency.
See Also
Using Chart Objects
Chart Objects Pane
Chart Objects List
14.9
Chart Objects Equal Cycle Line
Draws a set of lines that are the same distance from each other vertically. The distance
is set by the initial two points. For example, if the distance between point 1 and point 2
is 5, there will be lines drawn at position 0, 5, 10, 15, 20, 25, etc.
To draw an equal cycle line, select the object from the Chart Objects Pane and drop it on
to an open chart.
© 2015 RightEdge Systems, LLC
Chart Objects
193
There are appearance aspects of this object that can be changed in the Properties Pane.
Color Changes the color of the object.
Smoothing Mode Sets the drawing type of this object. Default draws a normal line. Antialias draws a smoother line at the expense of drawing performance.
Width This sets the size of the pen used to draw the outline of this object. A larger
number indicates a thicker line.
Line Alignment Specifies the alignment of the cycle lines in relation to the chart edges.
Line Text Specifies the format of the line number text. If Show Text is set to False, this
setting is ignored.
Max Lines Sets the maximum number of cycle lines to be drawn.
Show Text Set this to True to show the cycle line text. False to hide the text.
Text Alignment The alignment of the text relative to the cycle line.
Text Color The color of the cycle line text.
© 2015 RightEdge Systems, LLC
194
RightEdge Help
Text Font The font used to draw the cycle line text.
See Also
Using Chart Objects
Chart Objects Pane
Chart Objects List
14.10 Chart Objects Fan
Draws three lines in a "fan" formation. Point 1 is the anchor point. Point 2 dictates the
top most fan line.
To draw a fan, select the object from the Chart Objects Pane and drop it on to an open
chart.
There are appearance aspects of this object that can be changed in the Properties Pane.
Color Changes the color of the object.
© 2015 RightEdge Systems, LLC
Chart Objects
195
Smoothing Mode Sets the drawing type of this object. Default draws a normal line. Antialias draws a smoother line at the expense of drawing performance.
Width This sets the size of the pen used to draw the outline of this object. A larger
number indicates a thicker line.
Transparency The level of transparency given to this object. Valid numbers are 0-255,
where 0 is invisible or completely transparent and 255 indicates no transparency.
See Also
Using Chart Objects
Chart Objects Pane
Chart Objects List
14.11 Chart Objects Fibonacci Circle
Draws eleven lines in a circle formation from the anchor point. Point 1 is the anchor point.
Point 2 dictates the inner most circle. Subsequent circles are plotted at significant
Fibonacci values.
To draw an arrow line, select the object from the Chart Objects Pane and drop it on to an
open chart.
© 2015 RightEdge Systems, LLC
196
RightEdge Help
There are appearance aspects of this object that can be changed in the Properties Pane.
Color Changes the color of the object.
Smoothing Mode Sets the drawing type of this object. Default draws a normal line. Antialias draws a smoother line at the expense of drawing performance.
Width This sets the size of the pen used to draw the outline of this object. A larger
number indicates a thicker line.
Transparency The level of transparency given to this object. Valid numbers are 0-255,
where 0 is invisible or completely transparent and 255 indicates no transparency.
Line Frequencies Contains the raw Fibonacci ratios.
See Also
Using Chart Objects
Chart Objects Pane
Chart Objects List
© 2015 RightEdge Systems, LLC
Chart Objects
197
14.12 Chart Objects Fibonacci Cycle Line
Creates a Fibonacci cycle line. Similar to the equal cycle line except for the fact that the
lines are drawn using Fibonacci values instead of equal numbers.
To draw a Fibonacci cycle line, select the object from the Chart Objects Pane and drop it
on to an open chart.
There are appearance aspects of this object that can be changed in the Properties Pane.
Color Changes the color of the object.
Smoothing Mode Sets the drawing type of this object. Default draws a normal line. Antialias draws a smoother line at the expense of drawing performance.
Width This sets the size of the pen used to draw the outline of this object. A larger
number indicates a thicker line.
Line Alignment Specifies the alignment of the cycle lines in relation to the chart edges.
© 2015 RightEdge Systems, LLC
198
RightEdge Help
Line Text Specifies the format of the line number text. If Show Text is set to False, this
setting is ignored.
Max Lines Sets the maximum number of cycle lines to be drawn.
Show Text Set this to True to show the cycle line text. False to hide the text.
Text Alignment The alignment of the text relative to the cycle line.
Text Color The color of the cycle line text.
Text Font The font used to draw the cycle line text.
See Also
Using Chart Objects
Chart Objects Pane
Chart Objects List
14.13 Chart Objects Fibonacci Fan
Draws six lines in a "fan" formation from the anchor point. Point 1 is the anchor point.
Point 2 dictates the top most fan line. Subsequent lines of the fan are plotted at
significant Fibonacci values.
To draw a Fibonacci fan, select the object from the Chart Objects Pane and drop it on to
an open chart.
© 2015 RightEdge Systems, LLC
Chart Objects
199
There are appearance aspects of this object that can be changed in the Properties Pane.
Color Changes the color of the object.
Smoothing Mode Sets the drawing type of this object. Default draws a normal line. Antialias draws a smoother line at the expense of drawing performance.
Width This sets the size of the pen used to draw the outline of this object. A larger
number indicates a thicker line.
Transparency The level of transparency given to this object. Valid numbers are 0-255,
where 0 is invisible or completely transparent and 255 indicates no transparency.
See Also
Using Chart Objects
Chart Objects Pane
Chart Objects List
© 2015 RightEdge Systems, LLC
200
RightEdge Help
14.14 Chart Objects Horizontal Line
This object is a horizontal line that can only be moved vertically.
To draw a horizontal line, select the object from the Chart Objects Pane and drop it on to
an open chart.
There are appearance aspects of this object that can be changed in the Properties Pane.
Color Changes the color of the object.
Smoothing Mode Sets the drawing type of this object. Default draws a normal line. Antialias draws a smoother line at the expense of drawing performance.
Width This sets the size of the pen used to draw the outline of this object. A larger
number indicates a thicker line.
Transparency The level of transparency given to this object. Valid numbers are 0-255,
where 0 is invisible or completely transparent and 255 indicates no transparency.
Line Alignment Specifies the alignment of the line in relation to the chart edges.
Line Text Specifies the format of the line number text.
© 2015 RightEdge Systems, LLC
Chart Objects
201
Open End Indicates whether or not the end lines are open, or will continue until the end
of the chart.
Open Start Indicates whether or not the start lines are open, or will continue until the
beginning of the chart.
Text Alignment The alignment of the text relative to the line.
Text Color The color of the line text.
Text Font The font used to draw the line text.
See Also
Using Chart Objects
Chart Objects Pane
Chart Objects List
14.15 Chart Objects Hyperbolic Spiral
The hyperbolic spiral, also called the inverse spiral, originated with Pierre Varignon in 1704
and was studied by Johann Bernoulli between 1710 and 1713. It begins at an infinite
distance from the pole in the center, it winds faster and faster around as it approaches
the pole, the distance from any point to the pole, following the curve, is infinite.
To draw an Archimedes spiral, select the object from the Chart Objects Pane and drop it
on to an open chart.
© 2015 RightEdge Systems, LLC
202
RightEdge Help
There are appearance aspects of this object that can be changed in the Properties Pane.
Color Changes the color of the object.
Smoothing Mode Sets the drawing type of this object. Default draws a normal line. Antialias draws a smoother line at the expense of drawing performance.
Width This sets the size of the pen used to draw the outline of this object. A larger
number indicates a thicker line.
Transparency The level of transparency given to this object. Valid numbers are 0-255,
where 0 is invisible or completely transparent and 255 indicates no transparency.
Sweep Angle Sets the angle of the end point of this spiral. A sweep angle of 360, for
example, will indicate that the spiral will complete one revolution.
See Also
Using Chart Objects
Chart Objects Pane
Chart Objects List
© 2015 RightEdge Systems, LLC
Chart Objects
203
14.16 Chart Objects Image
Draws an image file on to the chart.
To place an image on a chart, select the object from the Chart Objects Pane and drop it
on to an open chart. Once the image object is dragged, a filename will need to be
specified.
There are appearance aspects of this object that can be changed in the Properties Pane.
Image Alpha The alpha blending value for the image. Valid numbers are 0-255, where 0 is
invisible or completely blended with the background and 255 indicates no blending with the
background.
Image Filename The fully qualified path of the image file to be displayed on the chart.
Resizable Set this flag to True to allow a user to resize the image, or False to keep it at
it's normal size.
© 2015 RightEdge Systems, LLC
204
RightEdge Help
See Also
Using Chart Objects
Chart Objects Pane
Chart Objects List
14.17 Chart Objects Label
This object is used to draw labels on to the chart.
To place a label on the chart, select the Label object from the Chart Objects Pane and
drop it on to an open chart. An entry field will immediately be placed where the object
was dropped. Begin typing text here.
There are appearance aspects of this object that can be changed in the Properties Pane.
Color Changes the color of the object.
© 2015 RightEdge Systems, LLC
Chart Objects
205
Smoothing Mode Sets the drawing type of this object. Default draws a normal line. Antialias draws a smoother line at the expense of drawing performance.
Width Not applicable to this object.
Transparency The level of transparency given to the text. Valid numbers are 0-255,
where 0 is invisible or completely transparent and 255 indicates no transparency.
Label Alignment Sets the alignment relative to the stick.
Label Text The literal text for this text object.
Label Font Font used to draw the text for this text object.
Label Transparency Sets the transparency value of the label bubble.
Round Width Sets the number of pixels used when rounding the label bubble. A higher
number of pixels equates to a rounder edge.
Shadow Width The label bubble has a shadow drawn around the edges. This produces a
3D effect. To increase the shadow size, select a higher value.
Stick Length Describes the length of the area between the point and actual label text.
Increasing this values will lengthen this area.
Text Background Color Sets the color of the bubble's background.
Text Color Sets the color of the text within the label bubble.
See Also
Using Chart Objects
Chart Objects Pane
Chart Objects List
14.18 Chart Objects Line
This object is simply a line that can be drawn in any direction. The end of the line has no
cap. The line can be rotated so that the arrow points in any direction.
To draw a simple line, select the object from the Chart Objects Pane and drop it on to an
open chart.
© 2015 RightEdge Systems, LLC
206
RightEdge Help
There are appearance aspects of this object that can be changed in the Properties Pane.
Color Changes the color of the object.
Smoothing Mode Sets the drawing type of this object. Default draws a normal line. Antialias draws a smoother line at the expense of drawing performance.
Width This sets the size of the pen used to draw the outline of this object. A larger
number indicates a thicker line.
Transparency The level of transparency given to this object. Valid numbers are 0-255,
where 0 is invisible or completely transparent and 255 indicates no transparency.
See Also
Using Chart Objects
Chart Objects Pane
Chart Objects List
© 2015 RightEdge Systems, LLC
Chart Objects
14.19 Chart Objects List
RightEdge ships with the following chart objects (alphabetically):
Archimedes Spiral
Arrow Line
Asynchronous Linear Regression Channel
Circle
Cross Channel
Downtrend Channel
Ellipse
Equal Channel
Equal Cycle Line
Fan
Fibonacci Fan
Fibonacci Circle
Fibonacci Cycle Line
Horizontal Line
Hyperbolic Spiral
Image
Label
Line
Lituus Spiral
Logarithmic Spiral
Linear Regression Line
Linear Regression Channel
Multi Arc
Open Linear Regression Line
Parabolic Spiral
Parallelogram
Percent Line
Rectangle
Rectangle Band
Rectangle Price
Rounded Rectangle
Sine Object
Square Cycle Line
Standard Channel
Standard Error Channel
Symmetry Line
Text
Triangle
Up/Down Trend Channel
Up Trend Channel
Vertical Line
See Also
Using Chart Objects
© 2015 RightEdge Systems, LLC
207
208
RightEdge Help
Chart Objects Pane
14.20 Chart Objects Lituus Spiral
According to Robert C. Yates 1952, the Lituus curve is studied by Roger Cotes in 1722. It
is named after an ancient Roman trumpet called lituus. The curve is asymptotic to the
positive x-axis, and the other end spiral in towards the pole. As theta approaches infinity,
the curve approaches the origin.
To draw a Lituus spiral, select the object from the Chart Objects Pane and drop it on to
an open chart.
There are appearance aspects of this object that can be changed in the Properties Pane.
Color Changes the color of the object.
Smoothing Mode Sets the drawing type of this object. Default draws a normal line. Antialias draws a smoother line at the expense of drawing performance.
Width This sets the size of the pen used to draw the outline of this object. A larger
© 2015 RightEdge Systems, LLC
Chart Objects
209
number indicates a thicker line.
Transparency The level of transparency given to this object. Valid numbers are 0-255,
where 0 is invisible or completely transparent and 255 indicates no transparency.
Sweep Angle Sets the angle of the end point of this spiral. A sweep angle of 360, for
example, will indicate that the spiral will complete one revolution.
See Also
Using Chart Objects
Chart Objects Pane
Chart Objects List
14.21 Chart Objects Logarithmic Spiral
The logarithmic spiral, also known as the growth spiral, was first studied by Descartes in
1638 and Jakob Bernoulli. This spiral often appears in nature. Probably the most
important aspect of the logarithmic spiral is that if we increase the angle ø by equal
amounts, the distance r from the poles increases in equal ratios.
To draw a Logarithmic spiral, select the object from the Chart Objects Pane and drop it on
to an open chart.
© 2015 RightEdge Systems, LLC
210
RightEdge Help
There are appearance aspects of this object that can be changed in the Properties Pane.
Color Changes the color of the object.
Smoothing Mode Sets the drawing type of this object. Default draws a normal line. Antialias draws a smoother line at the expense of drawing performance.
Width This sets the size of the pen used to draw the outline of this object. A larger
number indicates a thicker line.
Transparency The level of transparency given to this object. Valid numbers are 0-255,
where 0 is invisible or completely transparent and 255 indicates no transparency.
Sweep Angle Sets the angle of the end point of this spiral.
See Also
Using Chart Objects
Chart Objects Pane
Chart Objects List
© 2015 RightEdge Systems, LLC
Chart Objects
211
14.22 Chart Objects Linear Regression Channel
A classic statistical problem is to try to determine the relationship between two random
variables. The Linear Regression channel displays the statistically predicted price value.
To draw this object, select the object from the Chart Objects Pane and drop it on to an
open chart.
There are appearance aspects of this object that can be changed in the Properties Pane.
Color Changes the color of the object.
Smoothing Mode Sets the drawing type of this object. Default draws a normal line. Antialias draws a smoother line at the expense of drawing performance.
Width This sets the size of the pen used to draw the outline of this object. A larger
number indicates a thicker line.
Transparency The level of transparency given to this object. Valid numbers are 0-255,
where 0 is invisible or completely transparent and 255 indicates no transparency.
© 2015 RightEdge Systems, LLC
212
RightEdge Help
Open End Indicates whether or not the end lines are open, or will continue until the end
of the chart.
Open Start Indicates whether or not the start lines are open, or will continue until the
beginning of the chart.
Percentage The percentage that the up or down lines are drawn away from the center
line.
Show Center Line Indicates whether or not the center line will be drawn.
Show Down Line Indicates whether or not the lower line will be drawn.
Show Up Line Indicates whether or not the upper line will be drawn.
See Also
Using Chart Objects
Chart Objects Pane
Chart Objects List
14.23 Chart Objects Linear Regression Line
A classic statistical problem is to try to determine the relationship between two random
variables. The Linear Regression line displays the statistically predicted price value.
To draw this object, select the object from the Chart Objects Pane and drop it on to an
open chart.
© 2015 RightEdge Systems, LLC
Chart Objects
213
There are appearance aspects of this object that can be changed in the Properties Pane.
Color Changes the color of the object.
Smoothing Mode Sets the drawing type of this object. Default draws a normal line. Antialias draws a smoother line at the expense of drawing performance.
Width This sets the size of the pen used to draw the outline of this object. A larger
number indicates a thicker line.
Transparency The level of transparency given to this object. Valid numbers are 0-255,
where 0 is invisible or completely transparent and 255 indicates no transparency.
Open End Indicates whether or not the end lines are open, or will continue until the end
of the chart.
Open Start Indicates whether or not the start lines are open, or will continue until the
beginning of the chart.
Percentage The percentage that the up or down lines are drawn away from the center
line.
© 2015 RightEdge Systems, LLC
214
RightEdge Help
Show Center Line Indicates whether or not the center line will be drawn.
Show Down Line Indicates whether or not the lower line will be drawn.
Show Up Line Indicates whether or not the upper line will be drawn.
See Also
Using Chart Objects
Chart Objects Pane
Chart Objects List
14.24 Chart Objects Multi Arc
Draws one or more arcs on an existing chart window.
To draw an arc, select the object from the Chart Objects Pane and drop it on to an open
chart. Move the arm of the arc to the lower 50% of the arc to draw the arc down. Move
the arm of the arc above the higher 50% of the arc to draw the arc up.
© 2015 RightEdge Systems, LLC
Chart Objects
215
There are appearance aspects of this object that can be changed in the Properties Pane.
Color Changes the color of the object.
Smoothing Mode Sets the drawing type of this object. Default draws a normal line. Antialias draws a smoother line at the expense of drawing performance.
Width This sets the size of the pen used to draw the outline of this object. A larger
number indicates a thicker line.
Transparency The level of transparency given to this object. Valid numbers are 0-255,
where 0 is invisible or completely transparent and 255 indicates no transparency.
Line Frequencies Set up to five separate arcs. To display one arc, set all values to the
same number.
See Also
Using Chart Objects
Chart Objects Pane
Chart Objects List
14.25 Chart Objects Linear Regression Line
A classic statistical problem is to try to determine the relationship between two random
variables. The Linear Regression line displays the statistically predicted price value.
To draw this object, select the object from the Chart Objects Pane and drop it on to an
open chart. This object is the same as the Linear Regression Line object except for the
fact that the line is open.
© 2015 RightEdge Systems, LLC
216
RightEdge Help
There are appearance aspects of this object that can be changed in the Properties Pane.
Color Changes the color of the object.
Smoothing Mode Sets the drawing type of this object. Default draws a normal line. Antialias draws a smoother line at the expense of drawing performance.
Width This sets the size of the pen used to draw the outline of this object. A larger
number indicates a thicker line.
Transparency The level of transparency given to this object. Valid numbers are 0-255,
where 0 is invisible or completely transparent and 255 indicates no transparency.
Open End Indicates whether or not the end lines are open, or will continue until the end
of the chart.
Open Start Indicates whether or not the start lines are open, or will continue until the
beginning of the chart.
Percentage The percentage that the up or down lines are drawn away from the center
line.
© 2015 RightEdge Systems, LLC
Chart Objects
217
Show Center Line Indicates whether or not the center line will be drawn.
Show Down Line Indicates whether or not the lower line will be drawn.
Show Up Line Indicates whether or not the upper line will be drawn.
See Also
Using Chart Objects
Chart Objects Pane
Chart Objects List
14.26 Chart Objects Parabolic Spiral
A parabolic spiral can be represented by the mathematical equation r2 = a2. This spiral
discovered by Bonaventura Cavalieri creates a curve commonly known as a parabola.
To draw a Parabolic spiral, select the object from the Chart Objects Pane and drop it on
to an open chart.
© 2015 RightEdge Systems, LLC
218
RightEdge Help
There are appearance aspects of this object that can be changed in the Properties Pane.
Color Changes the color of the object.
Smoothing Mode Sets the drawing type of this object. Default draws a normal line. Antialias draws a smoother line at the expense of drawing performance.
Width This sets the size of the pen used to draw the outline of this object. A larger
number indicates a thicker line.
Transparency The level of transparency given to this object. Valid numbers are 0-255,
where 0 is invisible or completely transparent and 255 indicates no transparency.
Sweep Angle Sets the angle of the end point of this spiral. A sweep angle of 360, for
example, will indicate that the spiral will complete one revolution.
See Also
Using Chart Objects
Chart Objects Pane
Chart Objects List
© 2015 RightEdge Systems, LLC
Chart Objects
219
14.27 Chart Objects Parallelogram
This object plots a parallelogram or a quadrilateral with opposite sides parallel.
To draw a parallelogram, select the object from the Chart Objects Pane and drop it on to
an open chart.
There are appearance aspects of this object that can be changed in the Properties Pane.
Color Changes the color of the object.
Smoothing Mode Sets the drawing type of this object. Default draws a normal line. Antialias draws a smoother line at the expense of drawing performance.
Width This sets the size of the pen used to draw the outline of this object. A larger
number indicates a thicker line.
Transparency The level of transparency given to this object. Valid numbers are 0-255,
where 0 is invisible or completely transparent and 255 indicates no transparency.
© 2015 RightEdge Systems, LLC
220
RightEdge Help
Filled Indicates whether or not this parallelogram will be filled. If not filled, the
parallelogram's interior will be transparent.
Fill Transparency Indicates the level of transparency for the parallelogram's interior.
Ignored if Filled is set to False.
Fill Color Specifies the color that will be used when the parallelogram is filled. Ignored if
the Filled is set to False.
See Also
Using Chart Objects
Chart Objects Pane
Chart Objects List
14.28 Chart Objects Percent Line
This object plots a percent line or percent level retracement. These levels are created by
drawing a trend line between two extreme points and then dividing the vertical distance
by round percentage values of 25%, 50%, 75% and 100%.
To draw a Percent Line, select the object from the Chart Objects Pane and drop it on to
an open chart.
© 2015 RightEdge Systems, LLC
Chart Objects
221
There are appearance aspects of this object that can be changed in the Properties Pane.
Color Changes the color of the object.
Smoothing Mode Sets the drawing type of this object. Default draws a normal line. Antialias draws a smoother line at the expense of drawing performance.
Width This sets the size of the pen used to draw the outline of this object. A larger
number indicates a thicker line.
Transparency The level of transparency given to this object. Valid numbers are 0-255,
where 0 is invisible or completely transparent and 255 indicates no transparency.
Line Frequencies Manually set the five retracement levels.
Line Text Specifies how the text drawn at each retracement line is formatted.
Open End Indicates whether or not the end lines are open, or will continue until the end
of the chart.
Open Start Indicates whether or not the start lines are open, or will continue until the
beginning of the chart.
© 2015 RightEdge Systems, LLC
222
RightEdge Help
Text Alignment The alignment of the text relative to the line.
Text Font The font used to draw the line text.
See Also
Using Chart Objects
Chart Objects Pane
Chart Objects List
14.29 Chart Objects Rectangle
This object plots a simple rectangle. The start and end points for this rectangle object
are free form and not restricted in any way.
To draw a rectangle, select the object from the Chart Objects Pane and drop it on to an
open chart.
© 2015 RightEdge Systems, LLC
Chart Objects
223
There are appearance aspects of this object that can be changed in the Properties Pane.
Color Changes the color of the object.
Smoothing Mode Sets the drawing type of this object. Default draws a normal line. Antialias draws a smoother line at the expense of drawing performance.
Width This sets the size of the pen used to draw the outline of this object. A larger
number indicates a thicker line.
Transparency The level of transparency given to this object. Valid numbers are 0-255,
where 0 is invisible or completely transparent and 255 indicates no transparency.
Filled Indicates whether or not this rectangle will be filled. If not filled, the rectangle's
interior will be transparent.
Fill Transparency Indicates the level of transparency for the rectangle's interior. Ignored
if Filled is set to False.
Fill Color Specifies the color that will be used when the rectangle is filled. Ignored if the
Filled is set to False.
See Also
Using Chart Objects
Chart Objects Pane
Chart Objects List
14.30 Chart Objects Rectangle Band
This object plots a rectangle band. A rectangle band is a rectangle where the top and
bottom segments of the rectangle are open. Only the right and left portions of the
rectangle are specified.
To draw a rectangle band, select the object from the Chart Objects Pane and drop it on
to an open chart.
© 2015 RightEdge Systems, LLC
224
RightEdge Help
There are appearance aspects of this object that can be changed in the Properties Pane.
Color Changes the color of the object.
Smoothing Mode Sets the drawing type of this object. Default draws a normal line. Antialias draws a smoother line at the expense of drawing performance.
Width This sets the size of the pen used to draw the outline of this object. A larger
number indicates a thicker line.
Transparency The level of transparency given to this object. Valid numbers are 0-255,
where 0 is invisible or completely transparent and 255 indicates no transparency.
Filled Indicates whether or not this rectangle band will be filled. If not filled, the
rectangle band's interior will be transparent.
Fill Transparency Indicates the level of transparency for the rectangle band's interior.
Ignored if Filled is set to False.
Fill Color Specifies the color that will be used when the rectangle band is filled. Ignored if
the Filled is set to False.
© 2015 RightEdge Systems, LLC
Chart Objects
225
See Also
Using Chart Objects
Chart Objects Pane
Chart Objects List
14.31 Chart Objects Rectangle Price
This object plots a price rectangle. A price rectangle is a rectangle where the top and
bottom segments of the rectangle snap to the top and bottom prices visible on the
charts. Only the right and left portions of the rectangle are specified.
To draw a price rectangle, select the object from the Chart Objects Pane and drop it on
to an open chart.
There are appearance aspects of this object that can be changed in the Properties Pane.
Color Changes the color of the object.
© 2015 RightEdge Systems, LLC
226
RightEdge Help
Smoothing Mode Sets the drawing type of this object. Default draws a normal line. Antialias draws a smoother line at the expense of drawing performance.
Width This sets the size of the pen used to draw the outline of this object. A larger
number indicates a thicker line.
Transparency The level of transparency given to this object. Valid numbers are 0-255,
where 0 is invisible or completely transparent and 255 indicates no transparency.
Filled Indicates whether or not this rectangle band will be filled. If not filled, the
rectangle band's interior will be transparent.
Fill Transparency Indicates the level of transparency for the rectangle band's interior.
Ignored if Filled is set to False.
Fill Color Specifies the color that will be used when the rectangle band is filled. Ignored if
the Filled is set to False.
See Also
Using Chart Objects
Chart Objects Pane
Chart Objects List
14.32 Chart Objects Rounded Rectangle
This object plots a simple rectangle with rounded corners. This rectangle is identical to
the simple rectangle except that the corners will be rounded.
To draw a rounded rectangle, select the object from the Chart Objects Pane and drop it
on to an open chart.
© 2015 RightEdge Systems, LLC
Chart Objects
227
There are appearance aspects of this object that can be changed in the Properties Pane.
Color Changes the color of the object.
Smoothing Mode Sets the drawing type of this object. Default draws a normal line. Antialias draws a smoother line at the expense of drawing performance.
Width This sets the size of the pen used to draw the outline of this object. A larger
number indicates a thicker line.
Transparency The level of transparency given to this object. Valid numbers are 0-255,
where 0 is invisible or completely transparent and 255 indicates no transparency.
Filled Indicates whether or not this rounded rectangle will be filled. If not filled, the
rounded rectangle's interior will be transparent.
Fill Transparency Indicates the level of transparency for the rounded rectangle's interior.
Ignored if Filled is set to False.
Fill Color Specifies the color that will be used when the rounded rectangle is filled.
Ignored if the Filled is set to False.
© 2015 RightEdge Systems, LLC
228
RightEdge Help
See Also
Using Chart Objects
Chart Objects Pane
Chart Objects List
14.33 Chart Objects Sine Object
A geometric waveform that oscillates (moves up, down or side-to-side) periodically, and is
defined by the function y = sin x. It is an s-shaped, smooth wave that oscillates above
and below zero. The two points that are used for the sine wave object specify the top
portion of the wave and the bottom portion of the wave.
To draw a sine object, select the object from the Chart Objects Pane and drop it on to an
open chart.
There are appearance aspects of this object that can be changed in the Properties Pane.
© 2015 RightEdge Systems, LLC
Chart Objects
229
Color Changes the color of the object.
Smoothing Mode Sets the drawing type of this object. Default draws a normal line. Antialias draws a smoother line at the expense of drawing performance.
Width This sets the size of the pen used to draw the outline of this object. A larger
number indicates a thicker line.
Transparency The level of transparency given to this object. Valid numbers are 0-255,
where 0 is invisible or completely transparent and 255 indicates no transparency.
See Also
Using Chart Objects
Chart Objects Pane
Chart Objects List
14.34 Chart Objects Square Cycle Line
Draws a set of lines that push further apart through the passage of time. The algorithm
used to calculate this distance is the bar index squared (index2). The beginning bar is
considered index 1.
To draw a square cycle line, select the object from the Chart Objects Pane and drop it on
to an open chart.
© 2015 RightEdge Systems, LLC
230
RightEdge Help
There are appearance aspects of this object that can be changed in the Properties Pane.
Color Changes the color of the object.
Smoothing Mode Sets the drawing type of this object. Default draws a normal line. Antialias draws a smoother line at the expense of drawing performance.
Width This sets the size of the pen used to draw the outline of this object. A larger
number indicates a thicker line.
Line Alignment Specifies the alignment of the cycle lines in relation to the chart edges.
Line Text Specifies the format of the line number text. If Show Text is set to False, this
setting is ignored.
Max Lines Sets the maximum number of cycle lines to be drawn.
Show Text Set this to True to show the cycle line text. False to hide the text.
Text Alignment The alignment of the text relative to the cycle line.
Text Color The color of the cycle line text.
© 2015 RightEdge Systems, LLC
Chart Objects
231
Text Font The font used to draw the cycle line text.
See Also
Using Chart Objects
Chart Objects Pane
Chart Objects List
14.35 Chart Objects Standard Channel
This object is not a free form channel. It uses the standard calculation to determine the
direction of the lines. The first point is the left point. The second point specifies the
right point of the channels.
To draw this object, select the object from the Chart Objects Pane and drop it on to an
open chart.
There are appearance aspects of this object that can be changed in the Properties Pane.
© 2015 RightEdge Systems, LLC
232
RightEdge Help
Color Changes the color of the object.
Smoothing Mode Sets the drawing type of this object. Default draws a normal line. Antialias draws a smoother line at the expense of drawing performance.
Width This sets the size of the pen used to draw the outline of this object. A larger
number indicates a thicker line.
Transparency The level of transparency given to this object. Valid numbers are 0-255,
where 0 is invisible or completely transparent and 255 indicates no transparency.
Open End Indicates whether or not the end lines are open, or will continue until the end
of the chart.
Open Start Indicates whether or not the start lines are open, or will continue until the
beginning of the chart.
Percentage The percentage that the up or down lines are drawn away from the center
line.
Show Aux Line The auxiliary line are vertical lines that are drawn at either end of the
start and end points. Select True to display these lines.
Show Center Line Indicates whether or not the center line will be drawn.
Show Down Line Indicates whether or not the lower line will be drawn.
Show Up Line Indicates whether or not the upper line will be drawn.
See Also
Using Chart Objects
Chart Objects Pane
Chart Objects List
14.36 Chart Objects Standard Channel
This object is not a free form channel. It uses the standard error calculation to determine
the direction of the lines. The first point is the left point. The second point specifies the
right point of the channels.
To draw this object, select the object from the Chart Objects Pane and drop it on to an
open chart.
© 2015 RightEdge Systems, LLC
Chart Objects
233
There are appearance aspects of this object that can be changed in the Properties Pane.
Color Changes the color of the object.
Smoothing Mode Sets the drawing type of this object. Default draws a normal line. Antialias draws a smoother line at the expense of drawing performance.
Width This sets the size of the pen used to draw the outline of this object. A larger
number indicates a thicker line.
Transparency The level of transparency given to this object. Valid numbers are 0-255,
where 0 is invisible or completely transparent and 255 indicates no transparency.
Open End Indicates whether or not the end lines are open, or will continue until the end
of the chart.
Open Start Indicates whether or not the start lines are open, or will continue until the
beginning of the chart.
Percentage The percentage that the up or down lines are drawn away from the center
line.
© 2015 RightEdge Systems, LLC
234
RightEdge Help
Show Aux Line The auxiliary line are vertical lines that are drawn at either end of the
start and end points. Select True to display these lines.
Show Center Line Indicates whether or not the center line will be drawn.
Show Down Line Indicates whether or not the lower line will be drawn.
Show Up Line Indicates whether or not the upper line will be drawn.
See Also
Using Chart Objects
Chart Objects Pane
Chart Objects List
14.37 Chart Objects Symmetry Line
A symmetry line is a group of lines that are placed equidistant from one another. The 0
line is placed first. Then either from the right or left of the 0 line, the symmetry lines can
be pulled to place them equidistant from the center.
To draw a symmetry line object, select the object from the Chart Objects Pane and drop
it on to an open chart.
© 2015 RightEdge Systems, LLC
Chart Objects
235
There are appearance aspects of this object that can be changed in the Properties Pane.
Color Changes the color of the object.
Smoothing Mode Sets the drawing type of this object. Default draws a normal line. Antialias draws a smoother line at the expense of drawing performance.
Width This sets the size of the pen used to draw the outline of this object. A larger
number indicates a thicker line.
Transparency The level of transparency given to this object. Valid numbers are 0-255,
where 0 is invisible or completely transparent and 255 indicates no transparency.
Line Alignment Specifies the alignment of the line in relation to the chart edges.
Line Text Specifies the format of the line number text.
Open End Indicates whether or not the end lines are open, or will continue until the end
of the chart.
Open Start Indicates whether or not the start lines are open, or will continue until the
beginning of the chart.
© 2015 RightEdge Systems, LLC
236
RightEdge Help
Text Alignment The alignment of the text relative to the line.
Text Color The color of the line text.
Text Font The font used to draw the line text.
See Also
Using Chart Objects
Chart Objects Pane
Chart Objects List
14.38 Chart Objects Text
This object is used to draw solid or transparent text on to the chart.
To place text on the chart, select the Text object from the Chart Objects Pane and drop
it on to an open chart. An entry field will immediately be placed where the object was
dropped. Begin typing text here.
© 2015 RightEdge Systems, LLC
Chart Objects
237
There are appearance aspects of this object that can be changed in the Properties Pane.
Color Changes the color of the object.
Smoothing Mode Sets the drawing type of this object. Default draws a normal line. Antialias draws a smoother line at the expense of drawing performance.
Width Not applicable to this object.
Transparency The level of transparency given to the text. Valid numbers are 0-255,
where 0 is invisible or completely transparent and 255 indicates no transparency.
Text Color Changes the color of the text.
Label Text The literal text for this text object.
Label Font Font used to draw the text for this text object.
See Also
Using Chart Objects
Chart Objects Pane
© 2015 RightEdge Systems, LLC
238
RightEdge Help
Chart Objects List
14.39 Chart Objects Triangle
This object plots a simple triangle. The start and end points for this triangle object are
free form and not restricted in any way. This object requires three points, so it will be
necessary to click three times (once for each point) to properly plot this object.
To draw a triangle, select the object from the Chart Objects Pane and drop it on to an
open chart.
There are appearance aspects of this object that can be changed in the Properties Pane.
Color Changes the color of the object.
Smoothing Mode Sets the drawing type of this object. Default draws a normal line. Antialias draws a smoother line at the expense of drawing performance.
Width This sets the size of the pen used to draw the outline of this object. A larger
© 2015 RightEdge Systems, LLC
Chart Objects
239
number indicates a thicker line.
Transparency The level of transparency given to this object. Valid numbers are 0-255,
where 0 is invisible or completely transparent and 255 indicates no transparency.
Filled Indicates whether or not this triangle will be filled. If not filled, the triangle's
interior will be transparent.
Fill Transparency Indicates the level of transparency for the triangle's interior. Ignored if
Filled is set to False.
Fill Color Specifies the color that will be used when the triangle is filled. Ignored if the
Filled is set to False.
See Also
Using Chart Objects
Chart Objects Pane
Chart Objects List
14.40 Chart Objects Up/Down Trend Channel
This object is not a free form channel. It uses the price data on the chart to determine
the direction of the lines. The first point is the left point. The second point specifies the
right point of the channels.
To draw an up/down trend channel, select the object from the Chart Objects Pane and
drop it on to an open chart.
© 2015 RightEdge Systems, LLC
240
RightEdge Help
There are appearance aspects of this object that can be changed in the Properties Pane.
Color Changes the color of the object.
Smoothing Mode Sets the drawing type of this object. Default draws a normal line. Antialias draws a smoother line at the expense of drawing performance.
Width This sets the size of the pen used to draw the outline of this object. A larger
number indicates a thicker line.
Transparency The level of transparency given to this object. Valid numbers are 0-255,
where 0 is invisible or completely transparent and 255 indicates no transparency.
Open End Indicates whether or not the end lines are open, or will continue until the end
of the chart.
Open Start Indicates whether or not the start lines are open, or will continue until the
beginning of the chart.
Percentage The percentage that the up or down lines are drawn away from the center
line.
Show Aux Line The auxiliary line are vertical lines that are drawn at either end of the
© 2015 RightEdge Systems, LLC
Chart Objects
241
start and end points. Select True to display these lines.
Show Center Line Indicates whether or not the center line will be drawn.
Show Down Line Indicates whether or not the lower line will be drawn.
Show Up Line Indicates whether or not the upper line will be drawn.
See Also
Using Chart Objects
Chart Objects Pane
Chart Objects List
14.41 Chart Objects Uptrend Channel
This object is not a free form channel. It uses the price data on the chart to determine
the direction of the lines. The first point is the left point. The second point specifies the
right point of the channels.
To draw a downtrend channel, select the object from the Chart Objects Pane and drop it
on to an open chart.
© 2015 RightEdge Systems, LLC
242
RightEdge Help
There are appearance aspects of this object that can be changed in the Properties Pane.
Color Changes the color of the object.
Smoothing Mode Sets the drawing type of this object. Default draws a normal line. Antialias draws a smoother line at the expense of drawing performance.
Width This sets the size of the pen used to draw the outline of this object. A larger
number indicates a thicker line.
Transparency The level of transparency given to this object. Valid numbers are 0-255,
where 0 is invisible or completely transparent and 255 indicates no transparency.
Open End Indicates whether or not the end lines are open, or will continue until the end
of the chart.
Open Start Indicates whether or not the start lines are open, or will continue until the
beginning of the chart.
Percentage The percentage that the up or down lines are drawn away from the center
line.
Show Aux Line The auxiliary line are vertical lines that are drawn at either end of the
© 2015 RightEdge Systems, LLC
Chart Objects
243
start and end points. Select True to display these lines.
Show Center Line Indicates whether or not the center line will be drawn.
Show Down Line Indicates whether or not the lower line will be drawn.
Show Up Line Indicates whether or not the upper line will be drawn.
See Also
Using Chart Objects
Chart Objects Pane
Chart Objects List
14.42 Chart Objects Vertical Line
This object is a vertical line that can only be moved vertically.
To draw a vertical line, select the object from the Chart Objects Pane and drop it on to an
open chart.
© 2015 RightEdge Systems, LLC
244
RightEdge Help
There are appearance aspects of this object that can be changed in the Properties Pane.
Color Changes the color of the object.
Smoothing Mode Sets the drawing type of this object. Default draws a normal line. Antialias draws a smoother line at the expense of drawing performance.
Width This sets the size of the pen used to draw the outline of this object. A larger
number indicates a thicker line.
Transparency The level of transparency given to this object. Valid numbers are 0-255,
where 0 is invisible or completely transparent and 255 indicates no transparency.
Line Alignment Specifies the alignment of the line in relation to the chart edges.
Line Text Specifies the format of the line number text.
Open End Indicates whether or not the end lines are open, or will continue until the end
of the chart.
Open Start Indicates whether or not the start lines are open, or will continue until the
beginning of the chart.
© 2015 RightEdge Systems, LLC
Chart Objects
Text Alignment The alignment of the text relative to the line.
Text Color The color of the line text.
Text Font The font used to draw the line text.
See Also
Using Chart Objects
Chart Objects Pane
Chart Objects List
© 2015 RightEdge Systems, LLC
245
246
RightEdge Help
15
Plugins & Services
15.1
Service & Plugin Overview
RightEdge is designed to be extensible and customizable. Many parts of RightEdge's
functionality are provided by plugins, which allows you to modify or replace them
according to your needs. There are different types of plugins for accessing market data,
connecting to a broker, calculating indicators, displaying system results, and more. Plugins
are .NET classes which implement an interface defined by RightEdge corresponding to the
type of the plugin.
Plugin Types
RightEdge supports the following plugin types:
Data storage
A data storage plugin allows a developer to control the way data is stored by RightEdge.
RightEdge ships with a proprietary binary data store and a SQL Server data store. If a
developer wanted to support their own proprietary data store or a database not
supported out of the box, implementing a data store would allow for seamless integration
into RightEdge.
Indicators
Indicator plugins are for developers who wish to implement their own indicators. Every
indicator in RightEdge is a plugin. Everything that is shown in the RightEdge user
interface as it relates to indicators is available to third party developers as well. All
available indicators are displayed in the Indicator panel.
Frequencies
Frequency plugins aggregate price data (in the form of ticks and/or bars) to create bar
series. RightEdge includes frequency plugins to generate time-based bars, tick bars,
and constant volume bars. There is also a frequency plugin that generates daily bars
but filters out any data outside of the specified market hours.
Risk Assessment
Risk assessment plugins are implemented by those developers who want to perform
portfolio level risk analysis after a simulation is complete. RightEdge ships with a number
of risk assessment plugins such as Profit Factor and Sharpe Ratio, but developers who
want to apply their own proprietary calculations can do so by implementing this plugin
type. All available risk assessment plugins are displayed in the Options dialog.
Actions
Actions, as used in the drag and drop interface of RightEdge, are implemented as
plugins. Custom action code can be developed by implementing an action plugin. Action
plugins are shown in the Components panel.
Triggers
Triggers, as used in the drag and drop interface of RightEdge, are implemented as
plugins. Custom trigger code can be developed by implementing a trigger plugin. Trigger
plugins are shown in the Components panel.
Optimization
Optimization plugins can run multiple simulations of a system with different parameter
values to search for an optimal set of parameter values according to some measurement
(for example, the best combination of high profit and low risk). RightEdge's default
© 2015 RightEdge Systems, LLC
Plugins & Services
247
optimization plugin allows you to specify the high and low values and the step size or
number of steps for each parameter.
Watchlist
A watchlist plugin can replace the default RightEdge watchlist with its own UI.
Services
A service is a special type of plugin that typically interface with third party APIs such as
data providers and brokers. Services are associated with symbols in the Watchlist pane.
You can set up a hierarchical folder structure and have child folders inherit settings
from their parents (or override those settings).
Service plugins implement the IService interface, and can provide one or more of the
following services:
o Bar Data Retrieval
To retrieve bar data from a proprietary source that is not currently supported by
RightEdge, implement a bar data retrieval plugin. When this interface is implemented,
the service must let RightEdge know that it is capable of retrieving bar data by
returning true from the BarDataAvailable property.
o Tick Data Retrieval
To retrieve tick level data from a proprietary source that is not currently supported by
RightEdge, implement a tick data retrieval plugin. When this interface is implemented,
the service must let RightEdge know that it is capable of retrieving tick data by
returning true from the TickDataAvailable property.
o Broker Connectivity
RightEdge interfaces with live brokers. A service plugin can implement broker level
services to communicate with any broker that will allow communication with a third
party application. When implementing broker services, the service must let RightEdge
know that it is capable of performing broker services by returning true from the
BrokerFunctionsAvailable property.
o Symbol Source
A symbol source service can provide symbols to add to the watchlist. It will be called
when the context (right click) menu is displayed for a watch list folder, and can add
items to the "Add Symbols From" submenu. The Yahoo data plugin included with
RightEdge provides a symbol source to add symbols from the Dow 30, NASDAQ 100,
and S&P 500 indices. The Interactive Brokers plugin provides a symbol source which
displays a dialog to search available symbols and add them to the watchlist.
© 2015 RightEdge Systems, LLC
248
RightEdge Help
Writing Plugins
Implementing a RightEdge program requires some .NET programming skills, and an
environment capable of compiling code into .NET assemblies. A great option is Visual
Studio Community, a free edition of Visual Studio.
The easiest way to get started writing a plugin is by modifying code for an existing plugin.
You can find sample code for RightEdge plugins by selecting "RightEdge samples" from the
RightEdge help menu. The RightEdgePlugins folder contains source code for many of the
plugins that are part of RightEdge itself. The C# and VB.NET folders contain various other
plugin samples.
To modify a plugin, build it, and use it in RightEdge, follow these steps:
1. Create a copy of the folder with the solution (.sln) file in it. This is so that when you
install a new build of RightEdge it won't overwrite the changes you made, and so you
will still have the original source code available to refer to.
2. From the copied folder you created, open the solution file in Visual Studio.
3. Make changes to the plugin code.
4. Build the plugin, and copy the output DLL to the Plugins folder under the RightEdge
installation directory.
If the plugin you copied was one of the ones included in RightEdge by default, this will
copy over the default version. If you want to create a new plugin instead of modifying an
existing one, do the following:
1. Change the assembly name of the project. This will change the filename of the DLL that
is produced so you can have both the original version and your customized version in
the RightEdge plugins directory. To change the assembly name, right click on the
project node in the solution explorer and go to the project properties.
2. Change the identity of the plugin. This is what RightEdge uses to uniquely identify each
plugin, and if you have multiple plugins with the same identity, at least one of them
© 2015 RightEdge Systems, LLC
Plugins & Services
249
won't be loaded. For service plugins, change the value returned from the id() method.
For indicators, triggers, and actions, change the value of the Id property of the
RightEdgeObjectAttribute on the plugin class. For other plugin types simply change the
name of the plugin class.
3. Change the display name or service name, and other applicable metadata. This will let
you distinguish your plugin from the default version of the plugin when selecting which
plugin to use in RightEdge. For IService plugins, change the return value for the
ServiceName() method. For indicators, triggers, and actions, change the value of the
Name property of the RightEdgeObjectAttribute on the plugin class. For other plugins,
change the value in the DisplayNameAttribute before the plugin class.
4. If there are other plugins in the same project that you don't want to modify, remove
those source files from the project. For example, the DataStorage project has the
binary data store plugin, SQL Server plugin, and a Jet data storage plugin. If you just
want to customize the binary data store, you should remove the other two plugins from
the project so you don't have duplicate versions of them showing up in RightEdge.
5. Build the project and copy the plugin DLL to the RightEdge plugins directory.
6. Configure RightEdge to use the new plugin. How to do this will depend on the plugin
type you have implemented. Services can be configured in the Service Setup dialog.
Data storage, watchlist, and optimization plugins are configured in the RightEdge
options.
Details on the APIs used to implement plugins can be found in the RightEdge developer
documentation. The interface for each plugin type to implement is listed below. Service
plugins must also implement the IService interface.
Data Storage Plugin
IDataStore
Indicator Plugin
IIndicator or ISeriesCalculator (more details)
Frequency Plugin
FrequencyPlugin
Risk Assessment Plugin
IRiskAssessment, IRiskAssessmentPlugin
Action Plugin
IAction
Trigger Plugin
ITrigger
Bar Data Retrieval Service
IBarDataRetrieval
Tick Data Retrieval Service
ITickRetrieval
Broker Service
IBroker
Symbol Source Service
ISymbolSource
Optimization Plugin
OptimizationPlugin
Watchlist Plugin
IWatchListPlugin
See Also
Creating an Indicator Plugin
© 2015 RightEdge Systems, LLC
250
15.2
RightEdge Help
Creating an Indicator
This topic is intended by software developers that would like to include their own
indicators in the RightEdge Indicator Pane.
Implementing plugins requires some programming knowledge. It also requires a
programming environment capable of compiling code into .NET library assemblies.
Note: Microsoft provides a free version of their development environment that can be
used to create RightEdge plugins. Visit http://msdn.microsoft.com/vstudio/express/ for
more information.
1. Launch your version of Visual Studio
2. Select New Project from the File Menu
3. Select Class Library from either the C# or Visual Basic project types.
Name the class library MyIndicator. Change the location to the desired folder.
4. Add a reference to RightEdge.Common.
5. Right click on the References node in the Solution Explorer and select Add
Reference... Click the Browse tab and navigate to the RightEdge program
directory (C:\Program Files\Yye Software\RightEdge is the default location).
Find the Common.dll assembly and double click each one of them to add them.
6. Begin indicator implementation.
There are three base classes that implement IIndicator which aid in implementing an
indicator. We'll briefly discuss the benefits of each of these base classes.
IndicatorBase
IndicatorBase is the simplest of all interfaces. This is implemented by an indicator that
does not need to look back at previous or support indicator chaining.
SeriesCalculatorBaseSimple
If an indicator is doing a simple calculation on its inputs, you may simply want to calculate
the value from the inputs every time the value is requested, instead of storing the entire
series of values. If this is the case, you can derive from this class and implement your
calculation in the Item indexer. This is the recommended base class when backward
lookups on previously calculated indicator values are not required.
SeriesCalculatorBaseWithValues
Implements base functionality for an ISeriesCalculator indicator that calculates and stores
it's value each time a new bar comes in. When deriving from this class, call the base
constructor with the number of inputs required, and implement the CalcNewValue and
Reset functions. Use this base class when access to previously calculated data is
required and may need to be changed or reset.
Let's implement this indicator using IndicatorBase. To keep the emphasis on
implementation as opposed to the details of the indicator itself, we'll implement the
average price indicator. Average price is a simple indicator that takes bar data and
returns the average of the High, Low and Close values. The math is simple:
averagePrice = (high + low + close) / 3.0;
Below is the indicator implemented. You can paste the contents right into your
environment.
© 2015 RightEdge Systems, LLC
Plugins & Services
251
C#
using System;
using System.Collections.Generic;
using System.Text;
using System.Drawing;
using RightEdge.Common;
namespace MyIndicator
{
[YYEIndicatorAttribute(System.Drawing.KnownColor.Black,
YYEIndicatorAttribute.EIndicatorGroup.Trend,
Name = "Average Price Indicator",
Description = "An average of the bar's high, low and closing prices",
Id = "{BE86C408-99C2-45bf-BC21-45D2B8623AD0}",
HelpText = "A simple indicator that takes bar data and returns the average of the H
[Serializable]
public class AveragePriceSample : IndicatorBase
{
public AveragePriceSample()
: base(true)
{
}
public override List CalcSeriesValues(IList bars)
{
return base.CalcSeriesValues(bars);
}
public override double CalcNextValue(BarData bar)
{
if (bar.EmptyBar)
{
return double.NaN;
}
return (bar.High + bar.Low + bar.Close) / 3.0;
}
}
}
A few items to note. First, the attributes at the top of the class declaration tell the
RightEdge user interface some specific details about this indicator. The first item is the
default color proposed to the user whenever they drag and drop this indicator to a chart
or System Designer. The next attribute is the group that the indicator will fall under in the
user interface. The description is a brief, one sentence bit of information about this
indicator. The Id is a unique identifier which allows this indicator to be identified even if
the name, version or other attributes are changed. The HelpText attribute is long text
describing this indicator in detail. It is recommended that you give an overview of the
indicator, its recommended uses and how to interpret the values produced.
Finally, the indicator plugin has been created successfully. Now it must be copied to the
RightEdge plugin directory. The plugin directory is located off of the main application
directory (specified during the installation). The directory is named "Plugins". After the
plugin has been copied to this directory, start RightEdge and the plugin, if implemented
properly, will be found and displayed in the proper place in the user interface. No further
© 2015 RightEdge Systems, LLC
252
RightEdge Help
installation is required.
See Also
Plugin Overview
Technical Indicator List
Indicator Pane
© 2015 RightEdge Systems, LLC
Optimization
16
Optimization
16.1
Optimization Overview
253
Optimization is used to test a system with certain variables changed across simulation
runs. Running the system with variable parameters or optimization parameters allows the
system developer to determine which values result in the most favorable system
performance.
Any value in the system can be used as an optimization value. Technical indicators are
usually the first candidates since many accept a number of numeric inputs. Other items
such as profit targets and stop loss values are also viable candidates.
To begin using optimization in RightEdge, a trading system must be open. In the Project
Properties, locate the System Parameters property.
RightEdge supports any number of parameters in this list. Each value is treated as a type
of double. Click the Add button to add a new empty parameter. Use the property grid on
the right to name this parameter and assign a default value.
Referencing Parameters
Once optimization parameters have been added to the project, they may be referenced in
© 2015 RightEdge Systems, LLC
254
RightEdge Help
code. Using the above parameter, stochBuyValue, we will only perform a buy if the
StochK indicator is below our optimization parameter.
C#
if (stochKValue < SystemParameters["stochBuyValue"])
{
// Perform buy here.
}
Visual Basic
If (stochKValue < SystemParameters.Item("stochBuyValue")) Then
' Perform buy here.
End If
See Also
Optimization Dialog
Optimization Output
Automating RightEdge
16.2
Optimization Output
Optimization is used to test a system with certain variables changed across simulation
runs. For more information, see the Optimization Overview topic.
Once optimization runs have been completed, a summary of each run is displayed in the
document area.
© 2015 RightEdge Systems, LLC
Optimization
255
Run #
Each run is sequentially numbered. That number is displayed here.
Parameter Value
In the sample above, there is a parameter named "adxThreshold". The parameter name is
shown in the column and the value of that parameter for each run is displayed in the cell
beneath.
Summary Items
The remaining items in the list are totals pulled from the system run. These are the values
for both long and short trades.
Double click any run shown to display the full System Results for the run.
See Also
Optimization Overview
Optimization Dialog
16.3
Optimization Dialog
Optimization is used to test a system with certain variables changed across simulation
runs. To run optimization, open or create a trading system. Use the System Parameters
© 2015 RightEdge Systems, LLC
256
RightEdge Help
in the Properties pane to create parameters used for optimization. For more information,
see the Optimization Overview topic.
Once the optimization parameters are set, select Optimize System from the System
menu.
Optimization Parameters
This is a list of the parameters set for this system. The values can be set by double
clicking the value. Set the value by clicking anywhere outside of that value's space.
Low Value
Each system is run starting from the lowest value. Specify this value for each parameter.
High Value
Optimization stops once the highest value is reached. Specify this value for each
parameter.
Step Size
This is the increment size for each optimization value. For example, if the low value is 1
and the high value is 11 with a step size of 2, the system will be run a total of six times.
Number of Steps
This is a calculated value based on all previous entries. This is the number of times the
system will be run for this optimization run.
See Also
Optimization Overview
Optimization Output
© 2015 RightEdge Systems, LLC
Technical Indicators
17
Technical Indicators
17.1
Technical Indicator Overview
257
Technical indicators are the very foundation of technical analysis. It may be prudent to
first answer the question of technical analysis and then delve into why technical
indicators are such an important piece. Technical analysis is one of the methods that is
used to help predict the future movement of an asset's price.
Technical analysis can be based on subjective chart patterns that reoccur. Some of the
most popular reoccurring chart patterns are the double top, double bottom and head and
shoulders. For example, the double top is simply a point where the prices seem to hit a
ceiling and bounce off of that ceiling only to hit the ceiling again in a relatively short
period of time. This is a sign to a chart reader that the buyers are drying up at the top
point and without the ability to break through the top, there is likely a good play to the
downside. A person holding a long position in this asset may want to consider selling their
holdings to find another play with strong technicals. A riskier speculator may want to take
a short position when the asset fails to break through the second peak.
Still another form of subjective technical analysis comes in the form of candle stick charts.
Most technical analysts prefer these charts to bar or line charts when representing price
data. Some technical traders believe that repeatable patterns exist within the
candlesticks themselves. These are known as candlestick patterns.
Subjective chart patterns are difficult to "train" a computer to see. Many of them are
conditional based on previous bars and other subjective items within the chart. There
have been efforts made to code these patterns in such a way that the computer can
identify them, however, it's not a perfect fit.
This makes technical indicators an automated system developers natural choice. An
indicator is a self contained algorithm that takes a series of values, performs some
computation and returns a single value. Based on the indicator author's direction, the
value of the indicator means something. While there is still room for subjective
interpretation, a single number is something that can easily be developed against to make
decisions.
The simplest of technical indicators is the simple moving average. A simple moving
average (SMA) takes the previous prices from an asset and performs a mathematical
average. Most of the time, the SMA uses the closing price of the asset in the calculation,
however, it is not forbidden to use other parts of the bar (open, high, low) for the
calculation.
Most technical indicators take input parameters. In the case of the simple moving
average, the parameter is simply number of bars to look back. For a fast moving average
line, a period parameter of five would generate lines that close in fairly close step with the
actual price. A period parameter of 200 would make the SMA line lag significantly. Some
simple technical analysis performed by some would be trend analysis. Since the 200
period SMA lags, a price above a rising 200 day SMA line would be considered bullish. A
line below a falling 200 period SMA would would be considered bearish.
© 2015 RightEdge Systems, LLC
258
17.2
RightEdge Help
Accumulation / Distribution
Accumulation Distribution is used to track the relationship between price and volume. A
bullish signal is given when the Accumulation/Distribution Line forms a positive divergence.
The accumulation distribution line can also be used to confirm the strength of the current
trend. If the line trends up during a bull market move, this will confirm a healthy trend. If
the line begin to trend down in conjunction with price action, this may be a clear signal
that the trend has ended.
See Also
Accumulation / Distribution Developer Help
17.3
Accumulation Swing Index
The accumulation swing index is a variation of the Swing Index indicator. This indicator is
typically used as a confirmation indicator, but considered more reliable in determining long
term trends than the plain Swing Index since it uses more than the last two bars.
The indicator values for ASI will vacillate around the 0 line when the price is not trending.
If the ASI is making higher highs in conjunction with the price, an upward trend may be
confirmed. Likewise, if the ASI is making lower lows in conjunction with with the price, this
may confirm a down trend.
See Also
Accumulation Swing Index Developer Help
17.4
Add Series
A utility indicator to add two existing indicator series together.
See Also
Add Series Developer Help
Subtract Series
Multiply Series
Divide Series
Shift Series
© 2015 RightEdge Systems, LLC
Technical Indicators
17.5
259
ADX Indicator
This set of indicators, called the Directional Movement system, include DI+, DI-, DX, ADX
and ADXR. These indicators were developed by Welles Wilder in his book "New Concepts in
Technical Trading Systems". Directional Index (DX) combines the DI+ and DI- to measure
the strength of a trend. The stronger the trend, the further the spread between the DI+
and DI- trend lines. ADX is an average, or smoothed version of DX.
See Also
ADX Developer Help
ADXR Indicator
DI+ Indicator
DI- Indicator
17.6
ADXR Indicator
This set of indicators, called the Directional Movement system, include DI+, DI-, DX, ADX
and ADXR. These indicators were developed by Welles Wilder in his book "New Concepts in
Technical Trading Systems". Directional Index (DX) combines the DI+ and DI- to measure
the strength of a trend. The stronger the trend, the further the spread between the DI+
and DI- trend lines.
ADXR is an average, or smoothed version of ADX. This version may cause less whipsaw
triggers, but a more lagged response.
See Also
ADXR Developer Help
ADX Indicator
DI+ Indicator
DI- Indicator
17.7
Aroon Down Indicator
The Aroon indicator was developed by Tushar Chande in 1995. Aroon is used to measure
the presence and strength of trends. The Aroon Up line and Aroon Down line oscillate
between -100 and 100. When the two lines are in close proximity, this indicates a
consolidation phase. When the up indicator (Aroon Up) is below 50, the current trend has
lost its upward momemtum. The the down indicator (Aroon Down) is below 50, this
indicates that a downward trend has lost its momentum.
See Also
Aroon Down Developer Help
© 2015 RightEdge Systems, LLC
260
RightEdge Help
Aroon Up Indicator
Aroon Oscillator Indicator
17.8
Aroon Up Indicator
The Aroon indicator was developed by Tushar Chande in 1995. Aroon is used to measure
the presence and strength of trends. The Aroon Up line and Aroon Down line oscillate
between -100 and 100. When the two lines are in close proximity, this indicates a
consolidation phase. When the up indicator (Aroon Up) is below 50, the current trend has
lost its upward momemtum. The the down indicator (Aroon Down) is below 50, this
indicates that a downward trend has lost its momentum.
See Also
Aroon Up Developer Help
Aroon Down Indicator
Aroon Oscillator Indicator
17.9
Aroon Oscillator
The Aroon indicator was developed by Tushar Chande in 1995. Aroon is used to measure
the presence and strength of trends. The Aroon Up line and Aroon Down line oscillate
between -100 and 100. The Aroon Oscillator is Aroon Up minus Aroon Down. A positive
value on the oscillator may indicate an upward trend and a negative reading may indicator
a bearish trend.
See Also
Aroon Oscillator Developer Help
Aroon Down Indicator
Aroon Oscillator Indicator
17.10 Average Price Indicator
A simple indicator that takes a bar and returns the average of the High, Low and Close
values.
See Also
Average Price Developer Help
© 2015 RightEdge Systems, LLC
Technical Indicators
261
17.11 Average True Range Indicator
Average true range is a volatility indicator. High ATR values are often correlated with high
volatility as prices bottom and there is a sell off. Low ATR values are often correlated with
low volatility as prices stabilize or move into a sideways channel prior to a possible
breakout.
See Also
Average True Range Developer Help
True Range Indicator
17.12 Balance of Power Indicator
Based on Igor Livshin's article in the August 2001 issue of Technical Analysis of Stocks
and Commodities. According to Livshin, "The balance of power (BOP) indicator measures
the strength of the bulls vs. bears by assessing the ability of each to push price to an
extreme level." Livshin recommends a 14-period moving average, though the number of
periods varies depending on the nature of the market and the time frame. A change in the
BOP trend serves as a warning signal and should be confirmed by a change in the price
direction.
See Also
Balance of Power Developer Help
17.13 Bollinger Band (Lower) Indicator
Bollinger Bands are a technical trading tool created by John Bollinger in the early 1980s.
They arose from the need for adaptive trading bands and the observation that volatility
was dynamic, not static as was widely believed at the time.
The purpose of Bollinger Bands is to provide a relative definition of high and low. By
definition prices are high at the upper band and low at the lower band. This definition can
aid in rigorous pattern recognition and is useful in comparing price action to the action of
indicators to arrive at systematic trading decisions.
In some cases, a penetration of the lower band could be considered an oversold condition
and a reversal may be forthcoming.
See Also
Bollinger Band (Lower) Developer Help
Bollinger Band (Upper)
© 2015 RightEdge Systems, LLC
262
RightEdge Help
17.14 Bollinger Band (Upper) Indicator
Bollinger Bands are a technical trading tool created by John Bollinger in the early 1980s.
They arose from the need for adaptive trading bands and the observation that volatility
was dynamic, not static as was widely believed at the time.
The purpose of Bollinger Bands is to provide a relative definition of high and low. By
definition prices are high at the upper band and low at the lower band. This definition can
aid in rigorous pattern recognition and is useful in comparing price action to the action of
indicators to arrive at systematic trading decisions.
In some cases, a penetration of the upper band could be considered an overbought
condition and a reversal may be forthcoming.
See Also
Bollinger Band (Upper) Developer Help
Bollinger Band (Lower)
17.15 Center of Gravity Oscillator Indicator
The Center of Gravity Oscillator, by John Ehlers, was first published in Technical Analysis
of Stock and Commodities in May 2002. Ehlers claims that this a zero lag oscillator. This
oscillator is to be used like an other oscillator. When the fast line crosses through the
bottom of the slow line, this indicates a long signal. When the fast line crosses under the
slow line, this indicates a sell or short signal. The "fast" line is simply the COG oscillator
offset.
See Also
Center of Gravity Oscillator Developer Help
17.16 Chaikin Money Flow Indicator
The Chaikin Money Flow indicator developed by Marc Chaikin, is used to confirm a bullish
or bearish trend. This indicator may also be useful to detect reversals when there is
divergence between the price and CMF line. Readings of less than 0 are considered
bearish. If a stock is in an uptrend with readings below 0, this may be a sign of weakness
or an end to the trend. Marc Chaikin considers a reading below -0.25 to be indicative of
strong selling pressure. Conversely, a reading above +0.25 is considered to be indicative
of strong buying pressure.
See Also
Chaikin Money Flow Developer Help
© 2015 RightEdge Systems, LLC
Technical Indicators
263
17.17 Chaikin Oscillator Indicator
Chaikin's oscillator is a volume indicator based on the Accumulation/Distribution indicator.
When there is a divergence between the indicator in the stock price, this may indicate
that a trend reversal in price is due. A falling price trend shown in conjunction with a
bullish divergence in the oscillator may be a sign that the falling trend is nearly over and
the price will reverse. The same is inversely true for a rising price and a falling reading for
the oscillator.
See Also
Chaikin Oscillator Developer Help
Accumulation / Distribution Indicator
17.18 Chaikin Volatility Indicator
Chaikin's volatility indicator compares the gap between high and low prices. If the values
are high, then prices are changing greatly during the periods. If the values are low, prices
are staying steady. High levels indicate market tops while low levels indicate the end of a
market bottom.
See Also
Chaikin Volatility Developer Help
17.19 Chande Momentum Indicator
The Chande Momentum Oscillator, developed by Tushar Chande was developed to capture
"pure momentum." The CMO is similar to the Relative Strength Index indicator in that it
measures both up and down price changes. The CMO values are confined to the -100 and
+100 range. This indicator is mainly used to determine extreme overbought or oversold
conditions. Tushar Chande identifies that any reading above +50 is overbought and any
reading below -50 as oversold.
See Also
Chande Momentum Developer Help
Relative Strength Index
17.20 Commodity Channel Index (CCI) Indicator
Developed by Donald Lambert, the Commodity Channel Index (CCI) was designed to
identify cyclical turns in commodities. The indicator measures the position of price in
relation to its moving average. The indicator may change direction when the trend is
about to change. Critical points are at +100 and -100. Conventional usage is to go long
© 2015 RightEdge Systems, LLC
264
RightEdge Help
if indicator turns up from -100 or below and to go short xif the indicator turns down from
+100 or above.
See Also
Commodity Channel (CCI) Developer Help
17.21 Commodity Selection Index (CSI) Indicator
The Commodity Selection Index (CSI) indicator was created by Welles Wilder to help
short-term traders select stocks. This indicator brings out commodities that have strong
trending and volatility characteristics. In theory, high CSI levels make the most money
the fastest.
See Also
Commodity Selection Index (CSI) Developer Help
17.22 Constant Series Indicator
The Constant indicator is a simple a way to draw a straight line on the chart at the
specified value or as an input to a trigger in the drag and drop interface.
See Also
Constant Series Developer Help
17.23 Detrended Price Oscillator (DPO) Indicator
The Detrended Price Oscillator (DPO) is used to identify short term cycles. It does so by
removing the long term price cycle, leaving the shorter term cycles. Since long term
cycles are made up of many shorter term cycles, this indicator can be used to capitalized
on shorter term trading. The oscillator is considered most effective using periods of 21
bars or less.
The general rules of thumb are to only open trades in the direction of the trend. Go long
when Detrended Price Oscillator crosses below zero and then turns back above. Go short
when Detrended Price Oscillator crosses above zero and then turns back below.
See Also
Detrended Price Oscillator (DPO) Developer Help
© 2015 RightEdge Systems, LLC
Technical Indicators
265
17.24 DI+ Indicator
This set of indicators, called the Directional Movement system, include DI+, DI-, DX, ADX
and ADXR. These indicators were developed by Welles Wilder in his book "New Concepts in
Technical Trading Systems". Directional Index (DX) combines the DI+ and DI- to measure
the strength of a trend. The stronger the trend, the further the spread between the DI+
and DI- trend lines.
Consider the DI+ to measure the percentage of upward movement and DI- to measure the
percentage of a downtrend. When the DI+ rises above the DI+, this can be considered a
bullish signal. A bearish signal occurs when DI+ falls below DI-.
See Also
DIPlus Developer Help
ADX Indicator
ADXR Indicator
DI- Indicator
17.25 DI- Indicator
This set of indicators, called the Directional Movement system, include DI+, DI-, DX, ADX
and ADXR. These indicators were developed by Welles Wilder in his book "New Concepts in
Technical Trading Systems". Directional Index (DX) combines the DI+ and DI- to measure
the strength of a trend. The stronger the trend, the further the spread between the DI+
and DI- trend lines.
Consider the DI+ to measure the percentage of upward movement and DI- to measure the
percentage of a downtrend. When the DI+ rises above the DI+, this can be considered a
bullish signal. A bearish signal occurs when DI+ falls below DI-.
See Also
DI- Developer Help
ADX Indicator
ADXR Indicator
DI+ Indicator
17.26 Directional Movement Indicator
This set of indicators, called the Directional Movement system, include DI+, DI-, DX, ADX
and ADXR. These indicators were developed by Welles Wilder in his book "New Concepts
in Technical Trading Systems". Consider the DI+ to measure the percentage of upward
movement and DI- to measure the percentage of a downtrend. When the DI+ rises above
the DI+, this can be considered a bullish signal. A bearish signal occurs when DI+ falls
below DI-.
© 2015 RightEdge Systems, LLC
266
RightEdge Help
See Also
Directional Movement Developer Help
ADX Indicator
ADXR Indicator
DI+ Indicator
DI- Indicator
17.27 Divide Series Indicator
A utility indicator to divide two existing indicator series.
See Also
Divide Series Developer Help
Add Series
Subtract Series
Multiply Series
Shift Series
17.28 Donchian Channel (Lower) Indicator
The Donchian Channel is a trend following breakout system. It is recommended to use the
Donchian Channel in trending markets, and as a result can perform poorly in sideways
markets. The signals derived from the Price Channel are based on the following basic
rules:
When price closes above the Donchian Channel, buy long and cover short
positions.
When price closes below the Donchian Channel, sell short and liquidate long
positions.
The Donchian Channel indicator is not meant to catch tops or bottoms, only trends.
Trend traders may want to extend the standard 4 week period to 8 weeks in order to wait
for significant trend signals, while others may shorten the period to a more sensitive 1 or 2
weeks for liquidation purposes.
See Also
Donchian Channel (Lower) Developer Help
Donchian Channel (Upper)
17.29 Donchian Channel (Upper) Indicator
The Donchian Channel is a trend following breakout system. It is recommended to use the
Donchian Channel in trending markets, and as a result can perform poorly in sideways
© 2015 RightEdge Systems, LLC
Technical Indicators
267
markets. The signals derived from the Price Channel are based on the following basic
rules:
When price closes above the Donchian Channel, buy long and cover short
positions.
When price closes below the Donchian Channel, sell short and liquidate long
positions.
The Donchian Channel indicator is not meant to catch tops or bottoms, only trends.
Trend traders may want to extend the standard 4 week period to 8 weeks in order to wait
for significant trend signals, while others may shorten the period to a more sensitive 1 or 2
weeks for liquidation purposes.
See Also
Donchian Channel (Upper) Developer Help
Donchian Channel (Lower)
17.30 Double Exponential Moving Average Indicator
DEMA was developed by Patrick Mulloy and published in the January 1994 of Technical
Analysis of Stocks and Commodities. Moving averages are known for their lag time and
the DEMA attempts to remedy this. The calculation consists of a single EMA and a double
EMA to smooth out and produce less "head fakes". According to Mr. Mulloy, a DEMA
smoothed MACD produces fewer, but more profitable signals as opposed to the traditional
EMA smoothed MACD.
See Also
Double Exponential Moving Average (DEMA) Indicator Developer Help
Exponential Moving Average (EMA) Indicator
Triple Exponential Moving Average (TEMA) Indicator
Moving Average Convergence/Divergence (MACD) Indicator
17.31 Dynamic Momentum Index (DMI) Indicator
The Dynamic Momentum Index (DMI) indicator was developed by Tushar Chande and
Stanley Kroll. DMI measures volatility. If the underlying asset is volatile, DMI increases its
own volatility. DMI, like RSI is considered overbought at readings of 70 or more and
oversold at reading of 30 or less. DMI is considered a leading indicator since it can be
ahead of RSI by a couple of bars when it reaches overbought or oversold levels. DMI can
be used to confirm trends and trade with them. For example, a steady and consistent
decrease in the price of the asset coupled with higher lows could be a sign to short sell
the lower high on the DMI.
See Also
Dynamic Momentum Index (DMI) Developer Help
© 2015 RightEdge Systems, LLC
268
RightEdge Help
17.32 Ease of Movement Indicator
The Ease of Movement indicator, designed by Richard Arms, highlights the relationship
between volume and price changes. Since most breakouts to the up or down side are
supposed to be confirmed by volume, using the Ease of Movement indicator will help
confirm those breakouts. A buy signal may be flagged when the indicator crosses the zero
line to the up side. The sell signal may be given when the indicator line crosses below the
zero line.
See Also
Ease of Movement Developer Help
17.33 Envelope (Lower) Indicator
Envelope bands are a simple way to find a "normal" trading range. The upper and lower
bands are typically used in conjunction with one another visualize if the current price is
trading at the high or low end of its range. A buy signal may be triggered when the price
penetrates the lower envelope and a sell or sell short signal may be generated when the
upper envelope has been penetrated. Envelopes are calculated by plotting a shifted
moving average. The average is shifted up at specified percent for the upper band and
shifted down at the specified percent for the lower band.
See Also
Envelope (Lower) Developer Help
Envelope (Upper)
17.34 Envelope (Upper) Indicator
Envelope bands are a simple way to find a "normal" trading range. The upper and lower
bands are typically used in conjunction with one another visualize if the current price is
trading at the high or low end of its range. A buy signal may be triggered when the price
penetrates the lower envelope and a sell or sell short signal may be generated when the
upper envelope has been penetrated. Envelopes are calculated by plotting a shifted
moving average. The average is shifted up at specified percent for the upper band and
shifted down at the specified percent for the lower band.
See Also
Envelope (Upper) Developer Help
Envelope (Lower)
© 2015 RightEdge Systems, LLC
Technical Indicators
269
17.35 Exponential Moving Average (EMA) Indicator
An exponential moving average is a form of a weighted moving average. To construct a
20 day exponential moving average you must first construct a 20 day simple moving
average. This simple moving average is the starting point for the exponential moving
average. Assume that the simple moving average value for day 20 is 42; the simple
moving average value for day 21 is 43; and the simple moving average value for day 21 is
44. We then subtract the day 20 moving average value from day 21 simple moving
average value and get a difference of 1.00. This value (1.00) is multiplied by an
exponent. In this case, the exponent is .1. We then add .1 to the simple moving average
value of day 20. The exponential moving average value of day 20 now becomes 42.100.
To calculate the exponent, divide 2 by the time period. In our case, we divided 2 by 20
to arrive at .1.
The exponential moving averages are believed to have higher sensitivity to the current
price action, which arguably is more relevant. The quicker signals may come at the risk of
more "false" signals. It is recommended that the trading system that utilizes moving
averages test with both the simple and exponential to see which one works out best.
See Also
Exponential Moving Average (EMA) Indicator Developer Help
Double Exponential Moving Average (DEMA) Indicator
Triple Exponential Moving Average (TEMA) Indicator
Moving Average Convergence/Divergence (MACD) Indicator
17.36 Forecast Oscillator Indicator
The Forecast Oscillator, by Tuschar Chande, is a percentage difference between the
forecast price. The forecast price is nothing more than a linear regression trend line and
the actual closing price. The indicator value is greater than zero when the forecast price
is greater than the actual price. The inverse is true when the indicator value is less than
zero. The unsmoothed value is very choppy and Chande recommends applying a three
period moving average as a trigger line.
See Also
Forecast Oscillator Developer Help
17.37 Historical Volatility Indicator
Volatility is one of the most important factors when pricing options. When volatility is
high, options premiums are relatively expensive; when volatility is low, options premiums
are relatively cheap.
Volatility is a measure of the amount and speed of price changes, regardless of directions.
"Historical Volatility is a measure of how volatile the underlying futures or options
contracts have been for the specified number of trading days prior to each observation
© 2015 RightEdge Systems, LLC
270
RightEdge Help
date in the data series. It is an annualized standard deviation of price changes expressed
as a percentage.
See Also
Historical Volatility Developer Help
17.38 Intraday Momentum Index (IMI) Indicator
The Intraday Momentum Index (IMI) indicator is an average of a period's upward price
changes to its downward price changes. Values above 70 indicate a potential price drop
in the future while values below 30 indicate a potential rise.
See Also
Intraday Momentum Index (IMI) Developer Help
17.39 Keltner Band (Lower)
Keltner Bands, also known as Keltner Channels, were developed by Chester Keltner and
introduced in his book "How To Make Money In Commodities". Keltner bands are similar to
Bollinger Bands, however, instead of using band violations as a signal to counter trend, he
intended the violation as a confirmation of a breakout to the upside or downside. A
penetration of the lower band was considered a short signal and a penetration of the
upper band is considered a long signal.
See Also
Keltner Band (Lower) Developer Help
Keltner (Upper)
17.40 Keltner Band (Upper)
Keltner Bands, also known as Keltner Channels, were developed by Chester Keltner and
introduced in his book "How To Make Money In Commodities". Keltner bands are similar to
Bollinger Bands, however, instead of using band violations as a signal to counter trend, he
intended the violation as a confirmation of a breakout to the upside or downside. A
penetration of the lower band was considered a short signal and a penetration of the
upper band is considered a long signal.
See Also
Keltner Band (Upper) Developer Help
Keltner (Lower)
© 2015 RightEdge Systems, LLC
Technical Indicators
271
17.41 Klinger Oscillator
A volume based indicator developed by Stephen J. Klinger. The indicator uses volume to
attempt to measure the flow of money in or out of a security. To interpret the KO, look
for divergence with the price to signal the coming end of a trend, or to indicate that
rising/falling prices are not forming a new trend. A buy signal may be indicated when the
oscillator value rises from below zero to cross above the trigger line. A sell signal may be
indicated when the oscillator value falls from its high and crosses below the trigger line.
See Also
Klinger Oscillator Developer Help
17.42 Linear Regression Indicator
The Linear Regression Indicator plots the end-point of a Linear Regression Trendline for
multiple Linear Regression Trendlines. This indicator shows where prices should be based
on statistical analysis.
See Also
Linear Regression Developer Help
Linear Regression Slope
Linear Regression Trendline
17.43 Linear Regression Slope Indicator
The Linear Regression Slope function returns the slope component of a linear regression
line of a field to time over a given number of periods. Linear Regression Slope is designed
to show how much one should expect prices to change per unit of time.
See Also
Linear Regression Slope Developer Help
Linear Regression
Linear Regression Trendline
17.44 Linear Regression Trend Line Indicator
The linear regression trendline plots through past prices using the "least squares" method.
The linear regression line can be used as a "mean reverting" indicator since the line is
plotting the best path through the price action. Surges up or down from the trend line
© 2015 RightEdge Systems, LLC
272
RightEdge Help
can be considered buy or short indicators in hopes that the price will revert to the mean.
See Also
Linear Regression Trend Line Developer Help
Linear Regression
Linear Regression Slope
17.45 MACD Indicator
There are two moving averages that make up MACD, the 12-day EMA is the faster and the
26-day EMA is the slower. Any price series can be used to form the moving averages,
although the closing series is preferred. Usually, a 9-day EMA of MACD is plotted along
side to act as a trigger line. A bullish crossover occurs when MACD moves above its 9day EMA and a bearish crossover occurs when MACD moves below its 9-day EMA.
See Also
Moving Average Convergence/Divergence (MACD) Indicator Developer Help
Exponetial Moving Average (EMA) Indicator
Double Exponential Moving Average (DEMA) Indicator
Triple Exponential Moving Average (TEMA) Indicator
17.46 Market Facilitation Index (MFI) Indicator
The Market Facilitation Index, created by Dr. Bill Williams, attempts to measure price
movement in relation to volume. The MFI and volume figures are compared to establish
four conditions. "Green" indicates a rise in volume over the previous period and a rise in
MFI as well. "Fade" shows a decrease in volume and MFI compared to the previous bar.
"Fake" indicators a drop in volume but a rise in MFI. "Squat" means that there has been
an increase in volume, but a decrease in MFI.
On a green day, you would want to have an open position in the same direction as the
trend. Fade may indicate a trendless market, but may also be a sign of a market where a
trend may be emerging soon. Fake is a condition to avoid trading in. This may be a
condition where no new outside money is being attracted at this time. Squat indicates a
heavier volume and since MFI does not follow, this may be an indication of a trend
reversal.
See Also
Market Facilitation Index (MFI) Developer Help
© 2015 RightEdge Systems, LLC
Technical Indicators
273
17.47 Mass Index Indicator
The Mass Index, created by Donald Dorsey, attempts to identify price reversals by
measuring the range between high and low prices over a given period. The well known
signal to watch for with this indicator is the "reversal bulge". This occurs when the Mass
Index (25 period) rises above 27 and falls back below 26.5. When the reversal bulge is
spotted and the EMA points downward, open a long position. If the EMA points upward,
open a short position.
See Also
Mass Index Developer Help
17.48 Median Price Indicator
Like the average price indicator, (high + low + close / 3), the median price attempts to
the midpoint of the price action. The median price differs in that it only calculates the
average between the high and low prices. Use this simple indicator to smooth the price
action.
See Also
Median Price Developer Help
Average Price Indicator
17.49 Momentum Indicator
Simply put, this indicator measures the amount of change in price over the specified time
period. Extreme momentum readings occur at the strongest point of the current trend.
Overbought and oversold levels are set separately for each security, based on the
performance of the indicator over past cycles. Use this indicator to determine when to go
long or short. When the trend changes to bullish and the momentum indicator crosses
above the zero line, it is time to consider a long position. The inverse is also true for
either closing a long or opening a short position.
See Also
Momemtum Developer Help
17.50 Money Flow Index Indicator
The Money Flow Index is a momentum indicator similar to Relative Strength Index (RSI)
except for the fact that it takes volume into consideration as opposed to just price
action. A couple of signals can be derived from the MFI. If a divergence is occuring
between the price and the Money Flow Index, a price reversal may be imminent. Like RSI,
© 2015 RightEdge Systems, LLC
274
RightEdge Help
80 or better is considered overbought and 20 is considered oversold. Watch for tops or
bottoms to occur within these ranges. This may be a sign that the trend is reversing.
See Also
Money Flow Index Developer Help
17.51 Multiply Series Indicator
A utility indicator to multiply two existing indicator series together.
See Also
Multiply Series Developer Help
Add Series
Subtract Series
Divide Series
Shift Series
17.52 Negative Volume Index (NVI) Indicator
The Negative Volume Index, by Norman Fosback, operates under the premise that "smart
money" is in action on "quiet days" and will determine the move before the crowd steps in.
Negative Volume Index crossing above its one year moving average may be the sign of a
new bull market. The author claims that there is a 95% possibility of a bull market when
the NVI is above its one year moving average.
See Also
Negative Volume Index (NVI) Developer Help
Positive Volume Index (PVI)
17.53 On Balance Volume Indicator
On Balance Volume (OBV) is an indicator developed by Joe Granville to represent the
running total of volume. It shows whether or not volume is flowing in or out compared to
the closing price. Volume is added to the indicator if closing price moves up and
subtracted if closing price moves down. No adjustment is made if closing price is
unchanged. A rising OBV may be indicative of an upward breakout, where conversely a
falling OBV may be indicative of a downward breakout. On Balance Volume is best used as
a confirmation indicator that is used in conjunction with other indicators.
See Also
On Balance Volume Developer Help
© 2015 RightEdge Systems, LLC
Technical Indicators
275
17.54 Parabolic SAR Indicator
Developed by Welles Wilder, the Parabolic SAR (Stop And Reversal) is used to set trailing
price stops. When the price rises above the SAR, you should close short positions. You
should close long positions when the price falls below the SAR. You should also note that
the current value of the SAR is today's stop level, not tomorrow's.
See Also
Parabolic SAR Developer Help
17.55 Performance Indicator
This indicator displays price movements as percentages. If the value of the indicator on
bar X is 5, this means that the value of the asset has increased 5% since the first bar in
the series. Conversely, a value of -5 would indicate a 5% drop in the asset price since
the first bar in the series.
This percentage is useful for displaying differences in two or more assets over a period of
time. This is a visual indicator that is not typically used to base trading decisions on.
See Also
Performance Developer Help
17.56 Positive Volume Index (PVI) Indicator
The Positive Volume Index, by Norman Fosback, operates under the premise that "smart
money" is in action on "quiet days" and will determine the move before the crowd steps in.
Positive Volume Index crossing above its one year moving average may be the sign of a
new bull market. The author claims that there is a 76% possibility of a bull market when
the PVI is above its one year moving average.
See Also
Positive Volume Index (PVI) Developer Help
Negative Volume Index (NVI)
17.57 Price and Volume Trend (PVT) Indicator
The Price and Volume Trend (PVT) indicator shows the balance between the supply and
demand of a stock. This indicator is similar to the On Balance Volume indicator.
© 2015 RightEdge Systems, LLC
276
RightEdge Help
See Also
Price and Volume Trend (PVT) Developer Help
17.58 Price Channel (Lower) Indicator
Price Channels, originally developed by Ralph Nelson Elliot, were originally used to signal
the completion of wave counts that were central to his Elliott Wave Theory. Price
channels are used to detect breakouts out of support or resistance lines. The upper
channel is drawn at the highest high of last N periods. The lower channel is drawn at the
lowest low of the last N periods. If the upper channel is penetrated, this may be a sign of
new buyers and further appreciation of the asset. A penetration of the lower channel may
be a sign of new selling and lower prices to come.
See Also
Price Channel (Lower) Developer Help
Price Channel (Upper)
17.59 Price Channel (Upper) Indicator
Price Channels, originally developed by Ralph Nelson Elliot, were originally used to signal
the completion of wave counts that were central to his Elliott Wave Theory. Price
channels are used to detect breakouts out of support or resistance lines. The upper
channel is drawn at the highest high of last N periods. The lower channel is drawn at the
lowest low of the last N periods. If the upper channel is penetrated, this may be a sign of
new buyers and further appreciation of the asset. A penetration of the lower channel may
be a sign of new selling and lower prices to come.
See Also
Price Channel (Upper) Developer Help
Price Channel (Lower)
17.60 Price Oscillator Indicator
This indicator displays the difference between two moving averages of the security's
price. The first input is called the "short term" moving average and the second moving
average is called "long term". When the short term moving average rises above the long
term moving average, this may be a sign to buy. When the short term moving average
crosses below the long term moving average, this may be an indicator to sell any holding,
or open a short position.
See Also
© 2015 RightEdge Systems, LLC
Technical Indicators
277
Price Oscillator Developer Help
17.61 Price Rate of Change Indicator
Like the Momentum Indicator, the Price Rate-of-Change (ROC) indicator measures the
amount of change in price over the specified time period. This indicator displays the
difference as a percentage. As the price increases, the rate-of-change will rise; as the
price falls, the rate-of-change will fall.
See Also
Price Rate of Change Developer Help
Momentum Indicator
17.62 Qstick Indicator
The Qstick indicator was developed by Tushar S. Chande and Stanley Kroll and is
described in their 1994 book The New Technical Trader. Qstick provides a way to quantify
candlesticks. The Qstick indicator is a moving average of the difference between open
and close prices. Qstick values below zero indicate a majority of black candlesticks (over
the time periods specified) and therefore a bearish bias for the security. Values above
zero indicate a majority of white candlesticks (over the time periods specified) and
therefore a bullish bias for the security.
See Also
Qstick Developer Help
17.63 Range Indicator
The Range indicator, developed by Jack Weinberg, is based on the idea that average high
to low prices versus average close to close prices may be a leading indication that a new
trend is emerging or that an existing trend is about to end. Use the Range indicator as a
confirmation indicator.
The range bound parameters are considered to be 20 and 80. If the range indicator reads
20 or below look for the possible emergence of a new trend. If the range indicator reads
80 or above, look for the signs of the existing trend to end.
See Also
Range Developer Help
© 2015 RightEdge Systems, LLC
278
RightEdge Help
17.64 Relative Momentum Index (RMI) Indicator
The Relative Momentum Index (RMI) indicator is a variation of the Relative Strength Index
(RSI) indicator. Like RSI, this indicator determines its values based on the upward and
downward price changes. &nbps;The difference in the two being that RSI compares the
current price to the price the day before, RMI compares the price to n days ago.
See Also
Relative Momentum Index (RMI) Developer Help
Relative Strength Index (RSI)
17.65 Relative Strength (RSI) Indicator
RSI was developed by J. Welles Wilder in 1978. It is an oscillating indicator where buy
signals are readings of 30 and below while sell signals are of 70 or greater. In very volatile
markets, 20 may be considered a buy and 80 a sell.
See Also
Relative Strength (RSI) Developer Help
17.66 Relative Vigor Index (RVI) Indicator
This is a trend following indicator that can confirm the general trend of the market. The
idea behind Relative Vigor Index is that the vigor of the move is established when the
prices end up at the close. To normalize the index to the daily trading range, divide the
change of price by the maximum range of prices for the day. The calculation consists of
dividing the close minus the open by the high minus the low. The number of periods
specified is the "smoothing" factor. A default of 10 is recommended. As with most trend
indicators, the higher number of periods, the less "whipsawing", but the worse the lag.
See Also
Relative Vigor Index (RVI) Developer Help
17.67 Relative Volatility Index Indicator
The Relative Volatility Index or RVI was developed by Donald Dorsey. RVI is simply an RSI
with a standard deviation over the last n periods. The RVI is helpful in determining the
direction of volatility. Use this in conjunction with momentum based indicators to confirm
or deny the existence of a trend.
Readings above 60 combined with an upward price trend may indicate a buy signal.
Readings below 40 with a downward price trend may indicate a sell or short sell situation.
© 2015 RightEdge Systems, LLC
Technical Indicators
279
See Also
Relative Volatility Index Developer Help
17.68 rsquared indicator
rsquared is defined as a statistical measure of how well a regression line approximates real
data points; an r-squared of 1.0 (100%) indicates a perfect fit. The closer rsquared is to
one, the closer prices have fit to the linear regression line. rsquared is used for
confirmation of a trend. Use this indicator in conjunction with momemtum indicators. If
the momemtum indicator indicates that an item is in overbought or oversold territory, use
rsquared to determine if the trend is in place, if not, a position contrary to the current
condition may be warranted.
See Also
rsquared Developer Help
17.69 Shift Series Indicator
A utility indicator that will shift an existing series the specified number of positions to the
left. The shift value can only be a negative number.
See Also
Shift Series Developer Help
Add Series
Subtract Series
Multiply Series
Shift Series
17.70 Simple Moving Average (SMA) Indicator
Moving averages are one of the oldest and most popular of technical analysis tools. A
simple moving average is calculated by adding together the closing prices of a financial
instrument over a certain number of days and then dividing the sum by the number of
days involved. So, for example, the seven day average for a share price would be
calculated by taking seven days worth of data, adding them together and dividing by
seven.
There are many ways of interpreting moving averages. The most basic is to treat a
change of direction in the moving average as a signal to buy or sell, so if the moving
average has been consistently rising and then it falls, that is a signal to sell.
The classical interpretation, used by most technical analysts, is to compare the moving
average with the price of the underlying asset and to plot them both on the same graph.
Before the share price rises above its moving average, buy the share; when it falls below
© 2015 RightEdge Systems, LLC
280
RightEdge Help
its moving average, sell the share. That is putting it in extremely simple terms, and for a
more sophisticated understanding, read one of the many books on the subject.
A technical analyst would normally also consider other types of indicator before making a
buy or sell decision.
See Also
SMA Crossovers
SMA Developer Help
Technical Indicator Overview
Technical Indicator List
17.71 Standard Deviation Indicator
Standard Deviation is the statistical measure of an assets volatility. Generally speaking,
lower the StdDev reading, the lower volatility of said asset. One can speculate that
markets tops or bottoms may be met with a significant up tick in volatility, where bases or
ranges may have lower volatility readings.
See Also
Standard Deviation Developer Help
Standard Deviation Channel (Lower)
Standard Deviation Channel (Upper)
17.72 Standard Deviation Channel (Lower) Indicator
The Standard Deviation Channel consists of two lines that run parallel to the Linear
Regression Trendline, one above and one below. The specified number of standard
deviations is used to determine the distance of the lines from the trendline. A trend turn
is expected if the prices stay outside the channel for a longer than usual.
See Also
Standard Deviation Channel (Lower) Developer Help
Standard Deviation
Standard Deviation Channel (Upper)
Linear Regression Trendline
17.73 Standard Deviation Channel (Upper) Indicator
The Standard Deviation Channel consists of two lines that run parallel to the Linear
Regression Trendline, one above and one below. The specified number of standard
deviations is used to determine the distance of the lines from the trendline. A trend turn
© 2015 RightEdge Systems, LLC
Technical Indicators
281
is expected if the prices stay outside the channel for a longer than usual.
See Also
Standard Deviation Channel (Upper) Developer Help
Standard Deviation
Standard Deviation Channel (Lower)
Linear Regression Trendline
17.74 Standard Error Band (Lower) Indicator
The standard error bands, developed by Jon Anderson of Equis International, are a set of
bands that attempt to show the trend and the volatility around the trend. Three plots are
produced by this indicator. The middle plot is the ending value of an x-period linear
regression line. The upper plot, the upper standard error band, is the result of adding two
standard errors to the ending value of the regression line. The lower plot, the lower
standard error band, is a result of subtracting two standard errors from the end value of
the linear regression line. Jon Anderson notes the following:
Tight bands are an indication of a strong trend. Prices tend to bounce between the bands
when the bands are wide. Tight bands followed by a widening of the bands may indicate
the exhaustion of a trend and a possible reversal.
See Also
Standard Error Band (Lower) Developer Help
Standard Error Band (Upper)
17.75 Standard Error Band (Upper) Indicator
The standard error bands, developed by Jon Anderson of Equis International, are a set of
bands that attempt to show the trend and the volatility around the trend. Three plots are
produced by this indicator. The middle plot is the ending value of an x-period linear
regression line. The upper plot, the upper standard error band, is the result of adding two
standard errors to the ending value of the regression line. The lower plot, the lower
standard error band, is a result of subtracting two standard errors from the end value of
the linear regression line. Jon Anderson notes the following:
Tight bands are an indication of a strong trend. Prices tend to bounce between the bands
when the bands are wide. Tight bands followed by a widening of the bands may indicate
the exhaustion of a trend and a possible reversal.
See Also
Standard Error Band (Upper) Developer Help
Standard Error Band (Lower)
© 2015 RightEdge Systems, LLC
282
RightEdge Help
17.76 Standard Error Indicator
Standard Error measures how closely prices congregate around a linear regression line.
The closer prices are to the linear regression line, the higher the r-squared value and the
stronger the trend. Typically, the larger the error the less reliable the trend as the price
has greater variance around the Linear Regression line, prices are volatile. Conversely,
the smaller the error, the more reliable the trend.
See Also
Standard Error Developer Help
Standard Error Channel (Lower)
Standard Error Channel (Upper)
Linear Regression Trendline
17.77 Standard Error Channel (Lower) Indicator
The Standard Error Channel indicator consists of two lines. These lines are based on the
number of standard error calcuations above and below the Linear Regression Trendline.
Use the channels to determine if the price has moved into "extreme" territories. Like most
bands, extreme price movements mean that the price has penetrated the upper or lower
band. If the price has moved outside of the bands, use other indicators to determine if a
reversal is imminent.
See Also
Standard Error Channel (Lower) Developer Help
Standard Error
Standard Error Channel (Upper)
Linear Regression Trendline
17.78 Standard Error Channel (Upper) Indicator
The Standard Error Channel indicator consists of two lines. These lines are based on the
number of standard error calcuations above and below the Linear Regression Trendline.
Use the channels to determine if the price has moved into "extreme" territories. Like most
bands, extreme price movements mean that the price has penetrated the upper or lower
band. If the price has moved outside of the bands, use other indicators to determine if a
reversal is imminent.
See Also
Standard Error Channel (Upper) Developer Help
Standard Error
Standard Error Channel (Lower)
Linear Regression Trendline
© 2015 RightEdge Systems, LLC
Technical Indicators
283
17.79 Stochastic %D (Slow) Indicator
The "raw" stochastic calculation is referred to as %K. It is raw because it is calculated
directly from the price and not smoothed. The raw value is very volatile, so it is typically
smoothed (through a moving average). This smoothed value is called %D. A long signal
occurs when the fast line crosses under the slow line below a reading of 20. A sell or
short sell signal occurs when the fast line crosses over the slow line above a reading of
80.
See Also
Stochastic
Stochastic
Stochastic
Stochastic
%D (Slow) Developer Help
%K (Fast)
Oscillator
RSI
17.80 Stochastic %K (Fast) Indicator
The "raw" stochastic calculation is referred to as %K. It is raw because it is calculated
directly from the price and not smoothed. The raw value is very volatile, so it is typically
smoothed (through a moving average). This smoothed value is called %D. A long signal
occurs when the fast line crosses under the slow line below a reading of 20. A sell or
short sell signal occurs when the fast line crosses over the slow line above a reading of
80.
See Also
Stochastic
Stochastic
Stochastic
Stochastic
%K (Fast) Developer Help
%D (Slow)
Oscillator
RSI
17.81 Stochastic Momentum Index Indicator
The Stochastic Momentum Index (SMI) indicator, created by William Blau, is very similar to
the Stochastic Oscillator indicator. This indicator calculates where the close is relative to
the midpoint of the recent high/low range. If the close is greater than the midpoint, the
indicator is above zero and vice versa.
See Also
Stochastic Momentum Index (SMI) Developer Help
© 2015 RightEdge Systems, LLC
284
RightEdge Help
17.82 Stochastic Oscillator Indicator
The Stochastic Oscillator Technical Indicator compares where a security's price closed
relative to its price range over a given time period. The "raw" value is referred to as %K.
It is raw because it is calculated directly from the price and not smoothed. The raw value
is very volatile, so it is typically smoothed (through a moving average). This smoothed
value is called %D. A long signal occurs when the fast line crosses under the slow line
below a reading of 20. A sell or short sell signal occurs when the fast line crosses over
the slow line above a reading of 80.
See Also
Stochastic
Stochastic
Stochastic
Stochastic
Oscillator Developer Help
%K (Fast)
%D (Slow)
RSI
17.83 Stochastic RSI Indicator
Developed by Tuschar Chande and Stanley Kroll, StochRSI is an oscillator that measures
the level of RSI relative to its range, over a set period of time. The indicator uses RSI as
the foundation and applies to it the formula behind Stochastics. The result is an oscillator
that fluctuates between 0 and 1. This oscillator provides a bit more sensitivity to the
standard RSI.
See Also
StochRSI Developer Help
Stochastic %K (Fast)
Stochastic %D (Slow)
Stochastic Oscillator
17.84 Subtract Series Indicator
A utility indicator to subtracting two existing indicator series from one another.
See Also
Subtract Series Developer Help
Add Series
Multiply Series
Divide Series
Shift Series
© 2015 RightEdge Systems, LLC
Technical Indicators
285
17.85 Swing Index Indicator
The Swing Index, by Welles Wilder, was developed to provide a line that decreases the
noise that is price movements. The end result is a single line that represents true
strength and direction of the market. The Swing Index is fairly volatile on its own, it is
recommended that the Accumulated Swing Index be used for real signals.
See Also
Swing Index Developer Help
Accumulation Swing Index
17.86 Time Series Forecast Indicator
The Time Series Forecast indicator uses statistical analysis to predict a future value. This
indicator is a composition of the Linear Regression Indicator and the Linear Regression
Slope. Use this indicator to forecast the next periods price.
See Also
Time Series Forecast Developer Help
Linear Regression
Linear Regression Slope
17.87 Tirone Levels (Center) Indicator
Developed by John Tirone, the Tirone Levels Indicator consists of horizontal lines that help
you recognize support and resistance levels based on a series of prices.
The center line is the calculation that the upper and lower levels use. It is calculated by
taking the difference between the highest high and the lowest low for the asset price over
a period of time and dividing it by 2.
See Also
Tirone Levels (Center) Developer Help
Tirone Levels (Upper)
Tirone Levels (Lower)
17.88 Tirone Levels (Lower) Indicator
Developed by John Tirone, the Tirone Levels Indicator consists of horizontal lines that help
you recognize support and resistance levels based on a series of prices.
The lower level indicates support.
© 2015 RightEdge Systems, LLC
286
RightEdge Help
See Also
Tirone Levels (Lower) Developer Help
Tirone Levels (Upper)
Tirone Levels (Center)
17.89 Tirone Levels (Upper) Indicator
Developed by John Tirone, the Tirone Levels Indicator consists of horizontal lines that help
you recognize support and resistance levels based on a series of prices.
The upper level indicates resistance.
See Also
Tirone Levels (Upper) Developer Help
Tirone Levels (Lower)
Tirone Levels (Center)
17.90 Triangular Moving Average (TMA) Indicator
A triangular moving average is a form of a weighted moving average. Unlike an
exponential moving average, the triangular moving average assigns a majority of the
weight to the middle portion of the data.
See Also
Triangular Moving Average (TMA) Indicator Developer Help
Simple Moving Average (SMA) Indicator
Weighted Moving Average (WMA) Indicator
Exponential Moving Average (EMA) Indicator
Double Exponential Moving Average (DEMA) Indicator
Triple Exponential Moving Average (TEMA) Indicator
17.91 TEMA Indicator
The Triple Exponential Moving Average was developed by Patrick Mulloy and published in
the January 1994 of Technical Analysis of Stocks and Commodities. Moving averages are
known for their lag time and the TEMA attempts to remedy this. The calculation consists
of a single EMA and a double EMA to smooth out and produce less "head fakes".
According to Mr. Mulloy, a TEMA smoothed MACD produces fewer, but more profitable
signals as opposed to the traditional EMA smoothed MACD.
See Also
© 2015 RightEdge Systems, LLC
Technical Indicators
287
Triple Exponential Moving Average (TEMA) Indicator Developer Help
Exponential Moving Average (EMA) Indicator
Double Exponential Moving Average (DEMA) Indicator
Moving Average Convergence/Divergence (MACD) Indicator
17.92 TRIX Indicator
TRIX was developed in the early 1980's by Jack Hutson, an editor for Technical Analysis of
Stocks and Commodities magazine. This momentum indicator shows the rate-of-change of
a triple exponentially smoothed moving average.
See Also
TRIX Developer Help
17.93 True Range Indicator
True Range is
1. The
2. The
3. The
This indicator
defined as the largest of the following:
distance from today's high to today's low.
distance from yesterday's close to today's high.
distance from yesterday's close to today's low.
is a raw calculation used to calculate average true range (ATR).
See Also
True Range Developer Help
Average True Range Indicator
17.94 Ultimate Oscillator Indicator
Developed by Larry Williams to address the problems experienced with most oscillators
when used over different lengths of time. The Ultimate Oscillator uses the weighted sums
of three oscillators to represent short, intermediate and long term trends.
When the oscillator falls below 30, this is considered the oversold area and a reading of 70
or higher is considered the overbought area.
See Also
Ultimate Oscillator Developer Help
© 2015 RightEdge Systems, LLC
288
RightEdge Help
17.95 Variable Moving Average (VMA) Indicator
The variable moving average is an exponential moving average that adjusts the smoothing
percentage based on the volatility of the price data. The Variable Moving Average is used
to account for volatility or lack thereof as the case may be. In times of low volatility, the
moving average time period will be shorter to be more sensitive for when the trend breaks.
In more volatile times, the moving average time period will be longer which ideally will
filter out the choppiness.
The Variable Moving Average is also known as the VIDYA Indicator.
See Also
Variable Moving Average (VMA) Indicator Developer Help
Simple Moving Average (SMA) Indicator
Triangular Moving Average (TMA) Indicator
Exponential Moving Average (EMA) Indicator
Double Exponential Moving Average (DEMA) Indicator
Triple Exponential Moving Average (TEMA) Indicator
17.96 Vertical Horizontal Filter (VHF) Indicator
The Vertical Horizontal Filter (VHF) was devloped by Adam White to help determine if the
current market is in a trending phase or a congestion phase. There are three different
ways of interpreting the VHF:
A high VHF means that the degree of trending is high and Trend Indicators will be more
accurate. Rising and falling VHF values indicate that a trending or congestion phase is
developing, respectively. And, the start of a trend will be preceded by low values and its
end preceded by high values.
See Also
Vertical Horizontal Filter (VHF) Developer Help
17.97 Volume Adjusted Moving Average Indicator
The volume adjusted moving average indicator, by Dick Arms, assigns the majority of the
weight to the days with the most volume.
See Also
Volume Adjusted Moving Average Indicator Developer Help
Simple Moving Average (SMA) Indicator
Triangular Moving Average (TMA) Indicator
Exponential Moving Average (EMA) Indicator
Double Exponential Moving Average (DEMA) Indicator
Triple Exponential Moving Average (TEMA) Indicator
© 2015 RightEdge Systems, LLC
Technical Indicators
289
17.98 Volume Oscillator Indicator
The volume oscillator measures the difference between a specified long and short moving
average. A rising volume with rising prices signals a growing trend.
See Also
Volume Oscillator Developer Help
17.99 Volume Rate of Change Indicator
The volume rate of change is the indicator that shows whether or not a volume trend is
developing in either an up or down direction. Most analysts use this indicator in
conjunction with a price indicator. A spike in the volume rate of change may confirm a
price indicator signal.
See Also
Volume Rate of Change Developer Help
17.100Weighted Close Indicator
Like the average price indicator, (high + low + close / 3), the weighted close attempts to
show the midpoint of the price action. The weighted close differs in that it puts more
emphasis on the closing price.
See Also
Weighted Close Developer Help
Average Price Indicator
17.101Weighted Moving Average (WMA) Indicator
A weighted moving average assigns greater weight to the most recent data. The
weighting is calculated from the sum of periods. For example, take a 10 period moving
average. For an SMA, the weighting of the current bar would be 10% (1 / 10). For an
EMA, the weight of the current bar would be about 18.18% (2 / [10 + 1]). For a weighted
moving average, the weight of the current bar would be about 18.2% (10 / [(10 * 11) /
2]).
See Also
© 2015 RightEdge Systems, LLC
290
RightEdge Help
Weighted Moving Average (WMA) Indicator Developer Help
Simple Moving Average (SMA) Indicator
Triangular Moving Average (WMA) Indicator
Exponential Moving Average (EMA) Indicator
Double Exponential Moving Average (DEMA) Indicator
Triple Exponential Moving Average (TEMA) Indicator
17.102Widner Band (Lower) Indicator
These projection bands were developed by Mel Widner, Ph.D. They were originally
introduced in the July 1995 issue of Technical Analysis of Stocks and Commodities
magazine. This band set is used as most others (i.e. Bollinger bands) whereby the plotted
prices give a clue as to whether the current price is relatively low or high. Prices plotted
at the lower end of the band or prices that penetrate the lower band may indicate overly
pessimistic prices and a correction or reversion to mean may be in order. The inverse is
true if prices are plotted on the upper end of the band.
See Also
Widner Band (Lower) Developer Help
Widner Band (Upper)
Widner Oscillator
17.103Widner Band (Upper) Indicator
These projection bands were developed by Mel Widner, Ph.D. They were originally
introduced in the July 1995 issue of Technical Analysis of Stocks and Commodities
magazine. This band set is used as most others (i.e. Bollinger bands) whereby the plotted
prices give a clue as to whether the current price is relatively low or high. Prices plotted
at the lower end of the band or prices that penetrate the lower band may indicate overly
pessimistic prices and a correction or reversion to mean may be in order. The inverse is
true if prices are plotted on the upper end of the band.
See Also
Widner Band (Upper) Developer Help
Widner Band (Lower)
Widner Oscillator
17.104Widner Oscillator Indicator
These projection bands were developed by Mel Widner, Ph.D. They were originally
introduced in the July 1995 issue of Technical Analysis of Stocks and Commodities
magazine. This band set is used as most others (i.e. Bollinger bands) whereby the plotted
prices give a clue as to whether the current price is relatively low or high. Prices plotted
at the lower end of the band or prices that penetrate the lower band may indicate overly
© 2015 RightEdge Systems, LLC
Technical Indicators
291
pessimistic prices and a correction or reversion to mean may be in order. The inverse is
true if prices are plotted on the upper end of the band.
See Also
Widner Oscillator Developer Help
Widner Band (Lower)
Widner Band (Upper)
17.105Wilders Smoothing Indicator
Created by Welles Wilder, the Wilder's Smoothing indicator is similar to the Exponential
Moving Average. It responds slowly to price changes compared to other moving averages.
Wilder's Smoothing is used as a part of RSI.
See Also
Wilders Smoothing Developer Help
Exponential Moving Average (EMA)
Relative Strength Index (RSI)
17.106Williams %R Indicator
This indicator was developed by Larry Williams to identify overbought and oversold
conditions. Williams %R is similar to other oscillators, particularly the stochastic oscillator,
except for the fact that it oscillates in a negative range. Readings between -80 and -100
indicate that the item may be oversold and to watch for a potential reversal. Readings
between 0 and -20 indicate that the item may be overbought and that it might be a good
time to watch for a selling point.
See Also
Williams %R Developer Help
17.107Williams Accumulation / Distribution Indicator
This indicator is similar in nature to Accumulation/Distribution except for the fact that it's
based on true range values instead of simply OHLC. Also, the traditional Accumulation/
Distribution factors volume into the calculation, where the Williams's version does not.
Williams recommends paying attention to this indicator in the following situations:
When there is a bullish divergence between the indicator and the price of the asset, this
may be interpreted as a signal to go long. If there is a bearish divergence between the
indicator and the price of the asset, this may be interpreted as a signal to go short.
© 2015 RightEdge Systems, LLC
292
RightEdge Help
See Also
Williams Accumulation / Distribution Developer Help
Accumulation / Distribution
17.108Zig Zag Indicator
Zig Zag connects price fluctuations on a chart. Based on the minimum percentage
change, straight lines will be drawn connecting these points on the chart when the price
moves the specified percentage. A point is not plotted until the minimum percentage
change is reached.
The Zig Zag indicator is typically used to identify potential Elliot Wave formations.
See Also
ZigZag Developer Help
© 2015 RightEdge Systems, LLC
Risk Evaluators
18
Risk Evaluators
18.1
Payoff Ratio
293
The payoff ratio is simply the system's average profit per trade divided by the average
loss per trade. The higher the payoff ratio, the better the system.
See Also
Sharpe Ratio
Profit Factor
Recovery Factor
Risk Adjusted Return
Risk Assessment Options
18.2
Profit Factor
The profit factor is the system's gross profit divided by the gross loss. This calculation
indicates how many dollars are won for every dollar lost. Profit factors of around 2.0 are
ideal. High readings on the profit factor (for example, readings above 3.0) might be over
optimized.
See Also
Sharpe Ratio
Payoff Ratio
Recovery Factor
Risk Adjusted Return
Risk Assessment Options
18.3
Recovery Factor
This value helps gauge how a system recovers from drawdowns. The recovery factor is
calculated by taking the system's absolute value of net profit and dividing it by the
maximum drawdown. This value should exceed the value of the Buy & Hold Recovery
Factor.
See Also
Sharpe Ratio
Payoff Ratio
Profit Factor
Risk Adjusted Return
Risk Assessment Options
© 2015 RightEdge Systems, LLC
294
18.4
RightEdge Help
Risk Adjusted Return
This value measures the amount of risk taken on in relation to the amount returned. Also
known as the "return per risk unit". The calculation takes the system's annual percentage
return (APR) and divides it by the average exposure percentage.
See Also
Sharpe Ratio
Payoff Ratio
Profit Factor
Recovery Factor
Risk Assessment Options
18.5
Sharpe Ratio
The Sharpe Ratio, developed by William F. Sharpe, is used to measure risk/reward
efficiency within a portfolio or trading strategy. The calculation uses the standard
deviation of returns to determine how "risky" a portfolio is. The higher the Sharpe Ratio
value, the better the risk for return the portfolio is. A Sharpe ratio value around or
greater than 2 is considered excellent. It is generally advised that anything below 1
should not be considered.
See Also
Payoff Ratio
Profit Factor
Recovery Factor
Risk Adjusted Return
Risk Assessment Options
© 2015 RightEdge Systems, LLC
Glossary of Terms
19
Glossary of Terms
19.1
Futures
295
An established contract that gives the person the obligation to buy or sell a certain
amount of a commodity or index at a certain date.
19.2
Asset Class
The name of an asset category. Assets classes include stocks, bonds, cash, real estate,
etc.
19.3
Strike Price
Sometimes refered to as the "striking price" or "exercise price", it is the specified price on
an option contract at which the contract may be exercised.
19.4
Forex
An acronym for Foreign Exchange market. This over-the-counter market is where
currencies are traded.
19.5
Exchange
The company or organization that provides the market for stocks, options, futures and
currencies.
19.6
APR
The increase or decrease of an investment over the time span of one year represented as
a percentage.
19.7
Backtesting
A systematic or mechanical approach aimed at testing a trading strategy against historical
data. The tester creates a hypothetical portfolio and applies technical indicators against
this hypothetical portfolio. Positions are opened and closed based on the system rules
and profit and loss is accounted for.
Backtesting is used to quickly determine if a trading idea is viable where if the same idea
was applied in real time, it could potentially take years to answer the same question.
However, it is very important to note that backtesting results are no indication of
future performance.
© 2015 RightEdge Systems, LLC
296
RightEdge Help
See Also
Trading System Overview
New Trading System
Trading System Pane
19.8
Buy & Hold
Buy and hold is an investment strategy where an underlying asset is purchased and held
with strong speculation that the underlying asset will perform exceptionally well over the
long term regardless of short term volatility. This is a popular strategy given the fact that
the U.S. stock market, namely the S&P 500 index has returned around 11-13% over the
last 50 years excluding dividends. Buying and holding also minimizes trading costs such as
commissions and taxation.
Long
Short Selling
19.9
C#
Pronounced "See Sharp" is an object-oriented programming language created by Microsoft
and first introduced as part of their .NET initiative. C# is a widely supported language
which has syntax and structure that is very similar to Java and C++.
C# is a modern, general purpose language that is very well suited for developing very
complex systems all the way down to small functions.
RightEdge currently supports the 2.0 version of the C# language as distributed in the
Microsoft.NET Framework v2.0. As a result, RightEdge has support for advanced language
features introduced in v2.0 such as generics, anonymous methods and partial classes.
For more information about the 2.0 version of the C# language, visit The C# Language.
See Also
Visual Basic.NET
New Trading System
Trading System Pane
19.10 Drawdown
Drawdown is the amount of capital that you could've lost at any given point.
Example: If a position is opened for $2,000, the market moves sharply lower and at the
end of the day the $2,000 position is now worth $1,000. This has given the system a
drawdown of 50%. When analyzing the results of a system, pay attention to drawdown.
© 2015 RightEdge Systems, LLC
Glossary of Terms
297
If drawdown is 90%, but exposure is 1%, that is reasonably tolerable. If your exposure is
90% and your drawdown is 30-40%, that's a sign that the system has the potential to be
down a lot of money at any given point.
See Also
Analyzing System Results
MFE
MAE
Exposure
19.11 Exposure
Exposure is the amount of your capital exposed to the market. For example, if you have
$10,000 and you open a position for $2,000, you are at 20% exposure. If you open
another position for $4,000, your exposure is 40%.
See Also
Analyzing System Results
MFE
MAE
Drawdown
19.12 Initial Margin
Typically used for futures contracts, this is the percentage of the overall contract value
that must be paid from the investor's own funds.
19.13 Limit Order
An order submitted to a broker to buy or sell a security or contract at a specific price.
There are typically two types of limit orders, limit orders that are good for the life of the
trading and then cancelled and there are also limits orders that are good until they are
cancelled (known as GTC) by the person submitting the order.
19.14 Long Position
Taking a long position, or going long involves buying or obtaining an actual position in an
underlying asset. This is the opposite of holding a short position or being short.
See Also
Short Selling
Buy and Hold
© 2015 RightEdge Systems, LLC
298
RightEdge Help
19.15 MAE
MAE is the abbreviation for maximum adverse excursion. Made famous by John Sweeney,
the MAE for each trade is defined as the lowest low of the open profit within the trade. If
a long trade went down to a penny a share, the MAE percentage would be 99%.
Conversely, if the long trade never went below the purchase price, the MAE would be 0.
This calculation can be used in conjunction with drawdown to help determine how much
the trade or strategy goes against before it goes for.
See Also
Analyzing System Results
MFE
Drawdown
19.16 Maintenance Margin
The minimum amount of equity allowed in a margin account. This is usually less than the
initial margin.
19.17 Margin
Funds available on loan from a broker to purchase securities, options or futures contracts.
19.18 MFE
MFE is the abbreviation for maximum favorable excursion. Made famous by John Sweeney,
the MFE for each trade is defined as the highest high of the open profit within the trade.
If a long trade was established at $50 and closed at $60, but the stock had gone up to
$100, the MFE is 100%.
See Also
Analyzing System Results
MAE
Drawdown
19.19 OHLC Charts - Definition
This is an abbreviated name for "Open, High, Low, Close" chart. This is a chart style
where each price point mentioned is noted.
© 2015 RightEdge Systems, LLC
Glossary of Terms
299
The chart above points out some of the basic features of the OHLC charts.
The "up" days (where the close is higher than the open) is the lighter of the two lines and
the "down" days are represented with darker lines. The high for the day is the highest
point of the line, where the low price of the day is the lowest point of the line. The
opening price is represented by the horizontal tick that faces to the left and the closing
price is represented by the horizontal tick that faces to the right.
See Also
Candlestick Charts
Candlestick Chart Patterns
Line Charts
Bar Charts
19.20 Option
The right, but not the obligation, to buy or short sell a specific amount of a given stock,
commodity, currency, or index, at a specified price during a specified period of time. The
buyer of a call option has the right to buy shares of the underlying asset at the specified
price and the buyer of a put option has the right to short sell the shares of the underlying
asset at the specified price.
19.21 Profit Target
Profit targets are orders that are placed after a position is opened. This is typically set as
a percentage of the opening price. For example, if 100 shares of stock XYZ was
purchased at 50, if a profit target of 10% is set in the trading system, an order is sent to
close the position when the price of XYZ reaches 55. To set a profit target within a
trading system, review the Setting a Profit Target topic.
See Also
Analyzing System Results
Setting a Profit Target
© 2015 RightEdge Systems, LLC
300
RightEdge Help
19.22 Short Selling
Short selling, selling short or "shorting" is a way to profit from the falling price of the
underlying asset. This is accomplished by selling, or borrowing shares or contracts of an
asset that is not currently owned. Since the asset is sold, an account will be credited
with the current selling price. However, the short seller must return the borrowed asset
at a later date. This is known as covering the short position.
For the short seller to profit, ideally the short position is covered when the price of the
underlying asset is at a price that is less than what it was sold for. The short seller can
buy the asset back, thereby becoming flat and pocket the difference.
Short selling is considered risky by most for two reasons. First, it is possible to lose more
than 100% of your account short selling. Since it is not possible for an asset price to go
below 0, the long position taker cannot lose more than 100% of the initial investment.
However, it is possible for any asset to more than double, therefore, making it possible for
a short seller to lose more than 100% of the initial investment.
The second problem is that since an asset is borrowed from the broker, the broker
typically charges interest on the borrowed asset. Not only will the position have to move
in the right direction, but it will have to move faster than the interest rate charged by the
broker to be profitable.
19.23 Stock
A certificate that represents ownership in a corporation.
19.24 Stop Loss
Stop loss orders are orders that are placed after a position is opened. This is typically set
as a percentage of the opening price. For example, if 100 shares of stock XYZ was
purchased at 50, if a stop loss of 10% is set in the trading system, an order is sent to
close the position when the price of XYZ reaches 45. To set a stop loss within a trading
system, review the Setting a Stop Loss topic.
See Also
Analyzing System Results
Setting a Stop Loss
19.25 Symbols
A symbol is a representation of a complete and fully identifiable trading item. A complete
symbol for a stock is simply its ticker symbol. A complete symbol for a futures contract
consists of a root symbol (i.e. ES) and an expiration date. While an option symbol would
consist of a root symbol, strike price, contract type (put or call) and expiration date.
Symbols are grouped into Watchlists. These groupings can be used to collect live data,
© 2015 RightEdge Systems, LLC
Glossary of Terms
301
backtest as a complete portfolio or run live systems.
See Also
Setup a Watchlist
19.26 Timeout
Timeout orders are unique in that they are not actually submitted to the broker. They are
handled internally by RightEdge.
When a timeout value is set, RightEdge keeps track of the number of bars that the
position has been open. Once the number of bars specified has been reached, RightEdge
will submit a market order to close the position at the open of the next bar.
Note: The order is submitted to close any open position when the timeout is hit
regardless of if the position is profitable or not.
See Also
Analyzing System Results
Setting a Timeout
19.27 Visual Basic.NET
Visual Basic.NET is the next generation of the popular Visual Basic compiler by Microsoft.
Visual Basic.NET is designed to extend the ease of development provided Visual Basic into
the .NET Framework. While the syntax in Visual Basic.NET is very similar to that of the
classic Visual Basic, these languages are not compatible.
RightEdge supports the latest released version of Visual Basic, commonly referred to as
Visual Basic 2005. As a result, RightEdge supports new language features such as XML
comment to produce automatic documentation, partial classes, nullable types, generics
and partial classes.
For general information about Visual Basic 2005, visit the Visual Basic Developer Center at
Microsoft.
See Also
C#
New Trading System
Trading System Pane
© 2015 RightEdge Systems, LLC
Index
Index
-AAnalyzing System Results
53, 139
Automating RightEdge
67
-BBacktesting
124
System Results
Bar Data
Editor
80
53, 139
-CChart Objects
177
Arc
214
Archimedes Spiral
180
Arrow Line
181
Asynchronous Linear Regression Channel
Circle
184
Cross Channel
186
Downtrend Channel
187
Ellipse
189
Equal Channel
191
Equal Cycle Line
192
Fan
194
Fibonacci Circle
195
Fibonacci Cycle Line
197
Fibonacci Fan
198
Horizontal Line
200
Hyperbolic Spiral
201
Image
203
Label
204
Line
205
Linear Regression Channel
211
Linear Regression Line
212
List
207
Lituus Spiral
208
Logarithmic Spiral
209
Multi Arc
214
Open Linear Regression Line
215
Pane
82
Parabolic Spiral
217
© 2015 RightEdge Systems, LLC
183
Parallelogram
219
Percent Line
220
Rectangle
222
Rectangle Band
223
Rectangle Price
225
Rounded Rectangle
226
Sine Object
228
Square Cycle Line
229
Standard Channel
231
Standard Error Channel
232
Symmetry Line
234
Text
236
Triangle
238
Up/Down Trend Channel
239
Uptrend Channel
241
Vertical Line
243
Charting
Chart Colors
107
Chart Options
106
Overview
22, 163
Saved Charts
147
Charts
Detaching Charts
99
Open Live Charts
171
Showing Real Time Charts
171
Stacking Charts
175
Configuring
121, 157
Chart Colors
107
Chart Options
106
Services
121, 157
Watchlists
118
-DData Import
130
Data Sources
121, 157
default optimization plugin
246
Definitions
Annual Percentage Return
295
APR
295
Asset Class
295
Backtesting
295
Bar Chart
172
Buy and Hold
296
C#
296
Candlestick Chart
173
Drawdown
296
Exchange
295
303
304
RightEdge Help
Definitions
Exposure
297
Forex
295
Futures
295
Initial Margin
297
Limit Order
297
Line Chart
174
Long Position
297
MAE
298
Maintenance Margin
298
Margin
298
Maximum Adverse Excursion
298
Maximum Favorable Excursion
298
MFE
298
OHLC Charts
298
Open/High/Low/Close Charts
298
Options
299
Payoff Ratio
293
Profit Factor
293
Profit Target
299
Recovery Factor
293
Risk Adjusted Return
294
Sharpe Ratio
294
Short Position
300
Simulation
295
Stock
300
Stop Loss
300
Strike Price
295
Symbols
300
Timeout
301
Visual Basic
301
Drag and Drop
System Components Pane
81
-EEditor
Editor Options
109
Using the Editor
92
Examples
Creating an Indicator
250
-GGetting Started
11
-HHistorical Volatility
269
-IIDE
31, 64
Importing Data
130
Indicators
61
Accumulation / Distribution
258
Accumulation Swing Index
258
Add Series
258
ADX 259
ADXR
259
Aroon Down
259
Aroon Oscillator
260
Aroon Up
260
Average Price
260
Average True Range
261
Balance of Power
261
Bollinger Band Lower
261
Bollinger Band Upper
262
Center of Gravity Oscillator
262
Chaikin Money Flow
262
Chaikin Oscillator
263
Chaikin Volatility
263
Chande Momentum
263
Commodity Channel
263
Commodity Selection Index
264
Constant Series
264
DEMA
267
Detrended Price Oscillator
264
DI265
DI+
265
Directional Movement
265
Divide Series
266
DMI 267
Donchian Channel (Lower)
266
Donchian Channel (Upper)
266
Double Exponential Moving Average
DPO
264
Dynamic Momentum Index
267
Ease of Movement
268
EMA
269
Envelope (Lower)
268
Envelope (Upper)
268
267
© 2015 RightEdge Systems, LLC
Index
Indicators
61
Exponential Moving Average
269
Forecast Oscillator
269
Historical Volatility
269
Keltner Channel (Lower)
270
Keltner Channel (Upper)
270
Klinger Oscillator
271
Linear Regression
271
Linear Regression (Slope)
271
Linear Regression Trend Line
271
MACD
272
Market Facilitation Index
272
Mass Index
273
Median Price
273
MFI 272
Momentum
273
Money Flow Index
273
Moving Average Convergence/Divergence
272
Multiply Series
274
Overview
257
Parabolic SAR
275
Performance
275
Positive Volume Index
275
Price and Volume Trend
275
Price Channel (Lower)
276
Price Channel (Upper)
276
Price Oscillator
276
Price ROC
277
Projection Band (Lower)
290
Projection Band (Upper)
290
PVI 275
PVT 275
QStick
277
Range
277
Relative Momentum Index
278
Relative Strength Index
278
Relative Vigor Index
278
Relative Volatility Index
278
RMI 278
RSI 278
rsquared
279
Shift Series
279
Simple Moving Average
279
SMA
279
SMI 283
Standard Deviation
280
Standard Deviation Channel (Lower)
280
Standard Deviation Channel (Upper)
280
© 2015 RightEdge Systems, LLC
Standard Error
282
Standard Error Band (Lower)
281
Standard Error Band (Upper)
281
Standard Error Channel (Lower)
282
Standard Error Channel (Upper)
282
Stochastic %D
283
Stochastic %K
283
Stochastic Momentum Index
283
Stochastic Oscillator
284
StochRSI 284
Subtract Series
284
Swing Index
285
TEMA
286
Time Series
285
Tirone Levels (Center)
285
Tirone Levels (Lower)
285
Tirone Levels (Upper)
286
TMA
286
Triangular Moving Average
286
Triple Exponential Moving Average
286
TRIX 287
True Range
287
Ultimate Oscillator
287
Variable Moving Average
288
Vertical Horizontal Filter
288
VHF
288
VIDYA
288
Volume Adjusted Moving Average
288
Volume Oscillator
289
Volume Rate of Change
289
Weighted Close
289
Weighted Moving Average
289
Widner Band (Lower)
290
Widner Band (Upper)
290
Widner Oscillator
290
Wilders Smoothing
291
Williams %R
291
Williams Accumulation / Distribution
291
WMA
289
Zig Zag
292
Integrated Development Environment
31, 64
-LLive Data
Capturing
148
Configuring Services
Pane
84
121, 157
305
306
RightEdge Help
Live System
Starting
129
Live System Charts
127
-NNew Trading System dialog
116
-S-
-OOptimization
Optimization Dialog
255
Optimization Output
254
Overview
125, 253
Options (Program)
104
Chart Colors
107
Chart Options
106
Editor
109
General Options
104, 111
Research Options
110
Risk Assessment
111
-PPanes
Build Output
90
Chart Objects
82
Indicator
77
Live Data
84
Live System
86
Output
89
Properties
88
System Components
81
Trading System
72
Watchlist
69
Plugin Development
246
Creating an Indicator
250
Profit Target
299
Setting
153
-RRealtime Data
Capturing
148
Configuring Services
Realtime System
Starting
129
Risk Assessment
Options
111
Payoff Ratio
293
Profit Factor
293
Recovery Factor
293
Risk Adjusted Return
294
Sharpe Ratio
294
121, 157
Samples
Creating an Indicator
250
Saved Charts
147
Services
121, 157
Configuring
121, 157
Modifying
161
Simple Moving Average
Crossover
279
Overview
279
Simulated Broker
151
Simulation
124
System Results
53, 139
Stop Loss
300
Setting
154
Symbols
300
System Charts
127
System Development
Backtesting
124
Build Output
90
Output
89
Simulated Broker
151
System Results
53, 139
-TTechnical Indicators
Indicator List
61
Indicator Overview
257
Indicator Pane
77
Timeout
301
Setting
151
Trading System Development
Backtesting
124
Build Output
90
Output
89
Simulated Broker
151
Trading Systems
© 2015 RightEdge Systems, LLC
Index
Trading Systems
Profit Target
153
Properties
100
Stop Loss
154
System Components Pane
Timeout
151
Trading System Pane
72
Tutorials
Creating an Indicator
250
-UUsing RightEdge
Detaching Charts
99
Environment
31, 64
Floating Documents
99
IDE
31, 64
Live Charts
171
Overview
31, 64
Stacking Charts
175
-WWatchlists
Pane
69
Setup
118
© 2015 RightEdge Systems, LLC
81
307