1
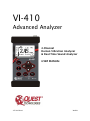
VI-410
Advanced Analyzer
4-Channel
Human Vibration Analyzer
& Real-Time Sound Analyzer
USER MANUAL
072-043 RevA
VI-410
Copyright
This document is copyrighted by Quest Technologies, Inc. Permission is
hereby granted to copy and distribute this manual provided that this
Copyright Page is included. This grant does not include permission to
modify the manual’s text or illustrations in any way.
This manual may not be translated without obtaining permission in
advance.
Trademarks
•
Quest Technologies, the Quest logo, and QuestSuite Professional II
are registered trademarks of Quest Technologies Incorporated. All
rights are reserved.
•
Microsoft and Windows are registered trademarks of Microsoft, Inc.
Updates
In the interests of continuous product improvements, Quest Technologies
reserves the right to make changes to product specifications without notice.
To understand the latest updates that have been implemented into this
product and to download the most current version of this user manual, visit
our web site at www.quest-technologies.com.
Copyright © 2008 Quest Technologies, Inc.
072-043 RevA
VI-410
i
Contents
CONTENTS
Contents
CHAPTER 1: INTRODUCTION.................................................................................................................. 1
What is human vibration? ....................................................................................................................... 1
What to measure?.................................................................................................................................... 2
How to measure?..................................................................................................................................... 3
Transducer .................................................................................................................................... 3
Direction of measurement HAV ............................................................................................................... 3
Threshold and Exposure values for HAV................................................................................................. 4
Direction of Measurement for WBV ......................................................................................................... 5
Threshold and exposure values for WBV ................................................................................................ 6
Exposure Assessment Steps ................................................................................................................... 7
Understanding what data is stored .......................................................................................................... 8
Summary data............................................................................................................................... 8
Time history data........................................................................................................................... 8
Frequency analysis and filters....................................................................................................... 8
QuestSuite Professional II ...................................................................................................................... 9
A Look at QuestSuite Professional II ....................................................................................................... 9
My Instruments............................................................................................................................ 10
Tree Nodes ................................................................................................................................. 10
Explanation of features in QSP-II................................................................................................ 11
CHAPTER 2: GETTING STARTED ......................................................................................................... 13
Checking the equipment ....................................................................................................................... 13
Equipment for hand arm study .............................................................................................................. 14
Equipment for whole body study ........................................................................................................... 15
Turning on the VI-410 ........................................................................................................................... 16
Warm up screen..................................................................................................................................... 16
Start-up screen components.................................................................................................................. 16
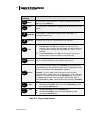
Display and keypad............................................................................................................................... 18
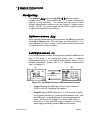
Navigating .............................................................................................................................................. 20
Up/Down arrows.......................................................................................................................... 20
Left/Right arrows ......................................................................................................................... 20
Menu Navigation ......................................................................................................................... 21
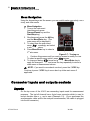
Connector inputs and outputs sockets.................................................................................................. 21
Inputs ..................................................................................................................................................... 21
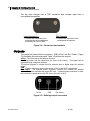
Outputs .................................................................................................................................................. 22
Checking battery power ......................................................................................................................... 23
Installing the batteries ............................................................................................................................ 24
Understanding Memory Storage ............................................................................................................ 24
CHAPTER 3: SETTING UP THE VI-410 .................................................................................................. 25
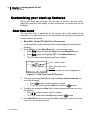
Customizing your start-up features ....................................................................................................... 26
Real time clock....................................................................................................................................... 26
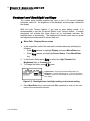
Contrast and backlight settings.............................................................................................................. 27
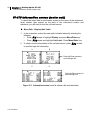
VI-410 information screen (meter unit) .................................................................................................. 28
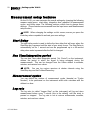
Measurement setup features ................................................................................................................ 29
Start delay.............................................................................................................................................. 29
Run Time/Integration period .................................................................................................................. 29
Measurement cycles .............................................................................................................................. 29
072-043 RevA
VI-410
ii
Contents
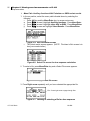
Log rate ....................................................................................................................................... 29
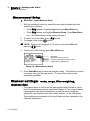
Measurement setup ............................................................................................................................... 30
Channel settings: mode, range, filter weighting, response time .......................................................... 30
Mode (vibration or sound) ...................................................................................................................... 31
Range .................................................................................................................................................... 31
Filter ....................................................................................................................................................... 31
RMS detector ......................................................................................................................................... 31
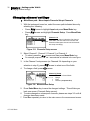
Changing channel settings..................................................................................................................... 32
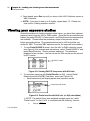
Saving logged items.............................................................................................................................. 33
Time history data ................................................................................................................................... 33
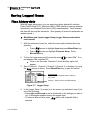
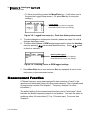
Measurement Function ......................................................................................................................... 34
Selecting 1/1 or 1/3 octave band analysis ............................................................................................. 35
RMS data logging........................................................................................................................ 35
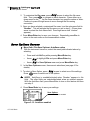
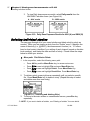
Save options ......................................................................................................................................... 37
Setting autosave, statistics, spectrum saving & replace ........................................................................ 37
AutoSave..................................................................................................................................... 37
Statistic saving ............................................................................................................................ 37
RAM File ..................................................................................................................................... 37
Spectrum saving: minimum and maximum ................................................................................ 38
Replace a file .............................................................................................................................. 38
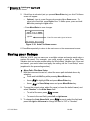
Saving measurements each run/stop session ....................................................................................... 38
Save options screen .............................................................................................................................. 39
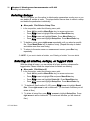
Saving your setups ............................................................................................................................... 40
Saving filters .......................................................................................................................................... 41
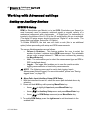
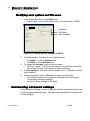
Working with advanced settings ........................................................................................................... 42
Setting up auxiliary devices ................................................................................................................... 42
RPM/RPS setup .......................................................................................................................... 42
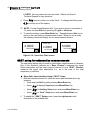
SEAT setup for attenuation measurements ................................................................................ 43
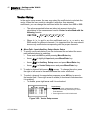
Vector setup ................................................................................................................................ 45
HAV/WBV dose setup ................................................................................................................. 46
Reference level ...................................................................................................................................... 47
Acceleration ................................................................................................................................ 47
Velocity........................................................................................................................................ 47
Displacement .............................................................................................................................. 47
Setting input: linear or exponential........................................................................................................ 48
Statistical levels ..................................................................................................................................... 49
Filter coefficients for 1/1 and 1/3 octave analysis .................................................................................. 50
User filter setup ........................................................................................................................... 50
Setting display options .......................................................................................................................... 51
Customizing measurement results on the display ................................................................................. 51
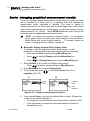
Scale: changing graphical measurement results .................................................................................. 54
Spectrum parameters ............................................................................................................................ 55
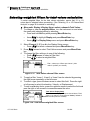
Selecting weighted filters for total values calculation............................................................................. 57
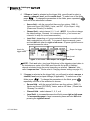
Trigger setup options ............................................................................................................................. 58
Slope+ or Slope- ......................................................................................................................... 58
Level+ or Level- .......................................................................................................................... 58
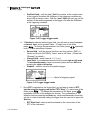
Logger ......................................................................................................................................... 58
Setting trigger......................................................................................................................................... 59
Metric or non-metric settings.................................................................................................................. 62
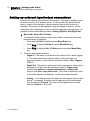
Setting up external input/output connections ......................................................................................... 63
Auto on……………………………………………………………………………………………………………64
CHAPTER 4: CALIBRATION................................................................................................................... 65
Performing a field vibration calibration.................................................................................................. 65
072-043 RevA
VI-410
iii
Contents
Conducting a vibration calibration for VLM ............................................................................................ 66
Assembly for Channel 3 (or Z axis)............................................................................................. 66
Assembly for Channels 1-2 (or X and Y axes) ............................................................................ 66
Running a vibration calibration.................................................................................................... 67
Calibrating by certificate on VI-410 ........................................................................................................ 68
Calibrating by certificate using QSP-II ........................................................................................ 69
Performing field calibration for sound ................................................................................................... 70
Attaching calibrator for a sound study.................................................................................................... 70
Running a sound calibration........................................................................................................ 71
Viewing last calibration ......................................................................................................................... 73
Calibration History.................................................................................................................................. 73
CHAPTER 5: RUNNING MEASUREMENTS ........................................................................................... 75
About vibration ....................................................................................................................................... 75
Taking measurements ........................................................................................................................... 76
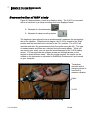
Demonstration of HAV study.................................................................................................................. 77
Placement of accelerometer for HAV..................................................................................................... 78
Attaching the accelerometer for HAV study ........................................................................................... 78
Mounting block and hose clamp scenario ................................................................................... 78
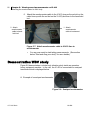
Demonstration WBV study .................................................................................................................... 80
Placement of transducer for WBV.......................................................................................................... 81
Attaching the accelerometer for WBV study .......................................................................................... 81
Measuring ............................................................................................................................................. 82
Start and stop your study ....................................................................................................................... 82
Start, pause, and stop your study .......................................................................................................... 82
Viewing measurement results ............................................................................................................... 83
1-channel measurement view ................................................................................................................ 83
Navigating .............................................................................................................................................. 84
4-channels measurement view .............................................................................................................. 84
Spectrum view ....................................................................................................................................... 85
Statistics view ........................................................................................................................................ 86
Logger view............................................................................................................................................ 86
Viewing filter analysis data during your study ........................................................................................ 86
Screen icons ......................................................................................................................................... 87
Battery indicator ..................................................................................................................................... 87
Computer indicator................................................................................................................................. 88
Antenna indicator ................................................................................................................................... 88
Loudspeaker indicator............................................................................................................................ 88
Envelope indicator ................................................................................................................................. 89
Bell (overload) Indicator ......................................................................................................................... 89
Timer indicator ....................................................................................................................................... 89
Arrow Indicator....................................................................................................................................... 90
Underrange ............................................................................................................................................ 90
CHAPTER 6: LOADING AND VIEWING SAVED MEASUREMENTS ................................................... 91
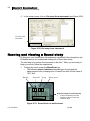
Loading or retrieving your measurement results................................................................................... 91
View saved studies ................................................................................................................................ 91
Navigating through stored data screens ................................................................................................ 92
HAV/WBV dose exposure and standards .............................................................................................. 93
Exposure values .................................................................................................................................... 94
Loading/selecting exposure dose values .................................................................................... 94
Viewing your exposure studies ............................................................................................................. 96
Deleting individual studies ..................................................................................................................... 97
072-043 RevA
VI-410
iv
Contents
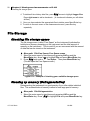
File storage ........................................................................................................................................... 99
Checking file storage space................................................................................................................... 99
Cleaning up memory (Defragmentation)................................................................................................ 99
Reviewing your saved studies & settings............................................................................................ 100
Catalog................................................................................................................................................. 100
CHAPTER 7: At a glance: HAV, WBV & Sound Studies ................................................................... 101
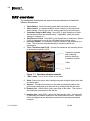
HAV overview...................................................................................................................................... 102
WBV overview..................................................................................................................................... 103
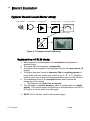
Sound overview .................................................................................................................................. 104
CHAPTER 8: MEASURING SOUND ..................................................................................................... 105
Basics of sound measurement............................................................................................................ 105
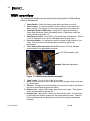
Typical sound level meter study........................................................................................................... 106
Explanation of SLM study ......................................................................................................... 106
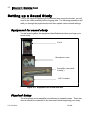
Equipment for sound study .................................................................................................................. 107
Physical setup...................................................................................................................................... 107
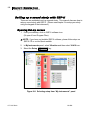
Setting up a sound study with QSP-II .................................................................................................. 109
Opening Set-up screen ............................................................................................................. 109
Customizing global settings ................................................................................................................. 113
Enabling frequency analysis ..................................................................................................... 113
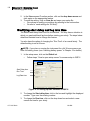
Modifying start delay and log rate time ..................................................................................... 114
Working with save options & file naming ............................................................................................. 115
Customizing advanced settings ........................................................................................................... 116
External input/output ................................................................................................................. 117
Disable vibration level mode ................................................................................................................ 118
Working with trigger mode for SL data................................................................................................. 118
Slope+ or Slope- ....................................................................................................................... 119
Level+ or Level- ........................................................................................................................ 119
Logger ....................................................................................................................................... 119
Setting trigger mode for SL study ........................................................................................................ 119
Signal Source selectable options............................................................................................................. 120
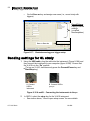
Sending settings for SL study ............................................................................................................. 121
Running and viewing a sound study ................................................................................................... 123
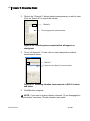
Stopping or pausing a SLM study ....................................................................................................... 124
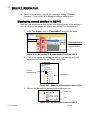
Retrieving data for SLM ............................................................................................................ 125
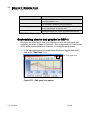
Displaying sound studies in QSP-II........................................................................................... 126
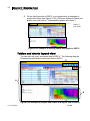
Tables and charts layout view................................................................................................... 127
Customizing charts and graphs in QSP-II ................................................................................. 128
CHAPTER 9: QSP-II............................................................................................................................... 131
Communicating and downloading data............................................................................................... 131
Working with Set-up features .............................................................................................................. 132
Channel (x, y, z) measurement setup .................................................................................................. 133
Global settings ..................................................................................................................................... 135
Measurement function............................................................................................................... 135
Measurement setup .................................................................................................................. 135
Working with Advanced setup features............................................................................................... 137
Advanced settings in QSP-II ................................................................................................................ 137
Setting up Triggering in QSP-II ............................................................................................................ 138
Slope+ or Slope- ....................................................................................................................... 138
Level+ or Level- ........................................................................................................................ 139
Logger ....................................................................................................................................... 140
072-043 RevA
VI-410
v
Contents
Working with the Vibration dose functions ........................................................................................... 141
Setting instrument standard and exposure time........................................................................ 141
Sending Settings from QSP-II to VI400Pro.......................................................................................... 142
Get setup from instrument ................................................................................................................... 143
Data..................................................................................................................................................... 143
Retrieve data from VI-410 to QSP-II .................................................................................................... 143
Viewing studies in QSP-II .................................................................................................................... 145
Tables and charts layout view.............................................................................................................. 147
Appendix A………………………………………………………………………………………………………. ..A-1
Appendix B…………………………………………………………………………………………………………B-1
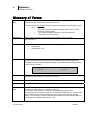
Appendix C: Glossary of terms …………………………………………………………………………………C-1
Figures
Figure 1-1: Hand-arm vibration vector coordinate systems (in accordance with ISO standards) ............... 4
Figure 1-2: Defined direction of whole-body measurement ........................................................................ 5
Figure 1-3: 1/3 octave band filter chart (in QSP-II only).............................................................................. 9
Figure 1-4: FFT band filter example (in QSP-II only) .................................................................................. 9
Figure 1-5: Explanation of Tree Nodes and My Instruments in QSP-II..................................................... 10
Figure 1-6: Displays the main log-on screen for Vibration in QSP-II software.......................................... 11
Figure 2-1: Example of equipment for HAV .............................................................................................. 14
Figure 2-2: Example of equipment for WBV ............................................................................................. 15
Figure 2-3: Warm up screen ..................................................................................................................... 16
Figure 2-4: Start-up screen ....................................................................................................................... 16
Figure 2-5: VI-410 keypad ........................................................................................................................ 18
Figure 2-6: Left/Right arrows and Measurement screens......................................................................... 20
Figure 2-7: Turning on .............................................................................................................................. 21
Figure 2-8: Connector input sockets ......................................................................................................... 22
Figure 2-9: Defining output connectors..................................................................................................... 22
Figure 2-10: Power Supply menu ............................................................................................................. 23
Figure 2-11: Power Supply screens.......................................................................................................... 23
Figure 2-12: Illustration of installing batteries ............................................................................................ 24
Figure 3-1: Real Time Clock (RTC) screen............................................................................................... 26
Figure 3-2: Backlight timer, backlight setting, and contrast setting........................................................... 27
Figure 3-3: Information screen (serial & software #’s and standards) ...................................................... 28
Figure 3-4: Measurement Setup ............................................................................................................... 30
Figure 3-5: Channels Setup screen .......................................................................................................... 32
Figure 3-6: Measurement Setup ............................................................................................................... 32
Figure 3-7: Logger Setup .......................................................................................................................... 33
Figure 3-8: Logged item setup (i.e., Peak time history value saved) ........................................................ 34
Figure 3-9: Enabling Vector or RPM logged settings................................................................................ 34
Figure 3-10: 1/1 octave band, 1/3 octave, sound, or level meter.............................................................. 35
Figure 3-11: Selecting 1/1 octave setup .................................................................................................... 35
Figure 3-12: 1/1 octave setup and channel selection ................................................................................ 36
Figure 3-13: Selecting RMS data item with 1/1 or 1/3 enabled................................................................. 36
Figure 3-14: Save screen........................................................................................................................... 38
Figure 3-15: AutoSave enabled ................................................................................................................ 39
Figure 3-16: Auto File Name screen ......................................................................................................... 40
Figure 3-17: Auto File Name screen ......................................................................................................... 41
Figure 3-18: Save User Filter screen ........................................................................................................ 41
Figure 3-19: Save User Filter screen ........................................................................................................ 43
Figure 3-20: Auxiliary screen (A) and Seat Setup screen (B) ................................................................... 44
072-043 RevA
VI-410
vi
Figures
Figure 3-21: Results from “SEAT” measurements.................................................................................... 44
Figure 3-22: Vector Setup screen ............................................................................................................. 45
Figure 3-23: HAV/WBV Dose setup screen .............................................................................................. 46
Figure 3-24: Selecting/Viewing reference level (acc., vel., or dis.) ............................................................ 48
Figure 3-25: Selecting Linear or Exponential for Input/Detector Type ...................................................... 49
Figure 3-26: Viewing or selecting statistical levels.................................................................................... 49
Figure 3-27: Viewing or selecting statistical levels.................................................................................... 50
Figure 3-28: Applying filters for 1/1 or 1/3 measurements ........................................................................ 51
Figure 3-29: Viewing or selecting user filters ............................................................................................ 51
Figure 3-30: Defining what appears on the VI-410 screen during a vibration study ................................. 52
Figure 3-31: Setting Measurement results for VI-410 ............................................................................... 52
Figure 3-32: Logged items measurement screen – no results message…………………......................... 53
Figure 3-33: Viewing or selecting scale options........................................................................................ 54
Figure 3-34: Example of scales for vibration mode................................................................................... 55
Figure 3-35: Display setup screen ............................................................................................................ 56
Figure 3-37: Total Values channel filter screen ........................................................................................ 57
Figure 3-38: Total Values weighted filter screen........................................................................................ 57
Figure 3-39: Level + and Slope+ for trigger modes ................................................................................... 60
Figure 3-40: Logger trigger mode .............................................................................................................. 61
Figure 3-41: Logger trigger mode .............................................................................................................. 61
Figure 3-42: Metric/Non-Metric settings..................................................................................................... 62
Figure 3-43: Logger trigger ........................................................................................................................ 64
Figure 3-44: Auto on…………………………………………………………………………………………….….64
Figure 4-1: Attaching accelerometer to calibrator ..................................................................................... 66
Figure 4-2: Attaching accelerometer cable to instrument ......................................................................... 66
Figure 4-3: HAV vector coordinates in accordance with ISO standards ................................................... 67
Figure 4-4: Example of calibration screen for vibration study ................................................................... 67
Figure 4-5: Calibration by sensitivity ......................................................................................................... 69
Figure 4-6: Example of setting calibration by sensitivity in QSP-II............................................................ 70
Figure 4-7: Connecting the calibrator and calibrator adapter.................................................................... 71
Figure 4-8: Attaching calibrator, preamp, and mic to VI-410 .................................................................... 71
Figure 4-9: Calibration by Measurement for Channel 4 ............................................................................ 72
Figure 4-10: Example of calibration screen for sound study...................................................................... 72
Figure 4-11: Calibration history screens .................................................................................................... 73
Figure 5-1: Harmonic vibration.................................................................................................................. 76
Figure 5-2: Random Vibration (from a circular saw study)........................................................................ 76
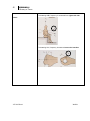
Figure 5-3: Example of how to conduct HAV study .................................................................................. 77
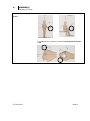
Figure 5-4: Attaching mounting block to accelerometer............................................................................ 78
Figure 5-5: Slide mounting block and accelerometer on hose clamp ....................................................... 79
Figure 5-6: Tighten hose clamp and accelerometer to tool....................................................................... 79
Figure 5-7: Attach accelerometer cable to VI-410 then to accelerometer ................................................ 80
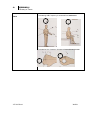
Figure 5-8: Seat-pad accelerometer ......................................................................................................... 80
Figure 5-9: WBV example inside cab of heavy equipment machine........................................................ 81
Figure 5-10: Vibration level run mode screen ........................................................................................... 82
Figure 5-11: Example of taking measurements in one measurement view .............................................. 84
Figure 5-12: Four-channels measurement results screen ........................................................................ 85
Figure 5-13: Spectrum view ...................................................................................................................... 85
Figure 5-14: Statistics view ....................................................................................................................... 86
Figure 5-15: Logger view .......................................................................................................................... 86
Figure 5-16 Display with all screen indicators........................................................................................... 87
Figure 5-17: Battery indicator.................................................................................................................... 87
Figure 5-18: Battery indicator.................................................................................................................... 88
Figure 5-19: “Antenna” (“Tree”) indicator .................................................................................................. 88
Figure 5-20: Run mode icon (or loudspeaker icon)................................................................................... 88
072-043 RevA
VI-410
vii
Figures
Figure 5-21: Display with “Envelope” (a) and “Bell” (b) icons ................................................................... 89
Figure 5-22: Display with Timer (A) and Arrow (B) icons.......................................................................... 89
Figure 5-23: 1-channel screen (A) and 4-channel screen (B)................................................................... 90
Figure 6-1: Loading files ........................................................................................................................... 92
Figure 6-2: HAV/WBV dose screen .......................................................................................................... 93
Figure 6-3: Selecting EAV/ELV Dose standards....................................................................................... 94
Figure 6-4: HAV calculator screen ............................................................................................................ 95
Figure 6-5: Select File screen for dose exposure calculation ................................................................... 95
Figure 6-6: “Empty” select file screen ....................................................................................................... 95
Figure 6-7: Loading or selecting a file for dose exposure ......................................................................... 95
Figure 6-8: Viewing EAV/ ELV exposure with HAV calc. ........................................................................... 96
Figure 6-9: Partial results with HAV calc. (or A(8) calculation) .................................................................. 96
Figure 6-10: Daily Dose Exposure Results for HAV (A) and WBV (B)....................................................... 97
Figure 6-11: Selecting and deleting file(s) ................................................................................................. 97
Figure 6-12: Example of checking your available storage space.............................................................. 99
Figure 6-13: Defragment screen ............................................................................................................. 100
Figure 6-14: Catalogue screen lists saved files and file size .................................................................. 100
Figure 7-1: Hand-arm vibration example ................................................................................................ 102
Figure 7-2: Whole-body vibration example ............................................................................................. 103
Figure 8-1: Example of basic SLM study ................................................................................................ 106
Figure 8-2: Equipment for sound level test ............................................................................................. 107
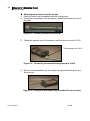
Figure 8-3: Connect preamp to microphone ........................................................................................... 108
Figure 8-4: Connecting the assembled mic/preamp to VI-410................................................................ 108
Figure 8-5: Example of instrument fully assembled for sound study ...................................................... 108
Figure 8-6: Selecting setup from “My instruments” panel ....................................................................... 109
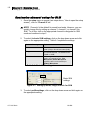
Figure 8-7: Setting up mode, range, and mic. for SLM .......................................................................... 110
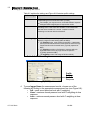
Figure 8-8: Setting up SLM profiles ....................................................................................................... 111
Figure 8-9: Setting up SLM profiles ....................................................................................................... 112
Figure 8-10: Setting up calibration and activating filters ......................................................................... 112
Figure 8-11: Setting up frequency analysis measurement...................................................................... 113
Figure 8-12: Setting up time elements in QSP-II .................................................................................... 114
Figure 8-13: Setting up time elements in QSP-II .................................................................................... 116
Figure 8-14: Setting up mode & channel for SLM................................................................................... 117
Figure 8-15: Changing settings for channels 1-3 .................................................................................... 118
Figure 8-16: Defining trigger settings for SLM in QSP-II......................................................................... 120
Figure 8-17: Illustrates saving your trigger setup................................................................................... 121
Figure 8-18 A and B: Connecting the instruments to the pc ................................................................ 121
Figure 8-19: Send setup key................................................................................................................... 122
Figure 8-20: Get setup from instrument .................................................................................................. 123
Figure 8-21: Sound level run mode screen............................................................................................. 123
Figure 8-22: “Four measurement view” during SL study......................................................................... 124
Figure 8-23: Viewing 1/3 octave band during a sound study .................................................................. 124
Figure 8-24: Retrieve data key for SLM study ........................................................................................ 125
Figure 8-25: Example of retrieve data dialog box .................................................................................. 125
Figure 8-26: Accessing SLM, downloaded files from QSP-II ................................................................... 126
Figure 8-27: Example of Downloaded sound files ................................................................................... 126
Figure 8-28: Selecting sound files in QSP-II ............................................................................................ 126
Figure 8-29: Example of viewing charts and graphs in QSP-II ................................................................ 127
Figure 8-30: Example of Graphs and Charts SLM layout view in QSP-II ................................................ 127
Figure 8-31: Edit panel icon option ......................................................................................................... 128
Figure 8-32: Selecting measurements which will appear on chart/graph ............................................... 129
Figure 8-33: Disabling vibration measurements in QSP-II’s charts and tables..................................... 129
Figure 9-1: Connecting VI410 to PC/Laptop ........................................................................................... 132
Figure 9-2: Selecting VI-410 in QSP-II.................................................................................................... 132
072-043 RevA
VI-410
viii
Figures
Figure 9-3: Explanation of channels setup for HAV/WBV study ............................................................. 133
Figure 9-4: Selecting Global settings during setup ................................................................................. 136
Figure 9-5: Explaining Advanced setup tab for HAV............................................................................... 137
Figure 9-6: Example of setting the trigger for “slope+” mode ................................................................. 138
Figure 9-7: Example of where stop time is set for triggering mode......................................................... 139
Figure 9-8: Trigger setting with Level+ mode ......................................................................................... 139
Figure 9-9: Trigger setting with logger mode .......................................................................................... 140
Figure 9-10: Defining exposure time and instrument standard ................................................................ 141
Figure 9-11: Connecting the instrument (A) to the pc (B) ........................................................................ 142
Figure 9-12: Sending setup to/from instrument....................................................................................... 142
Figure 9-13: Get setup from instrument .................................................................................................. 143
Figure 9-14: Retrieve data key in QSP-II ................................................................................................ 144
Figure 9-15: Retrieve data dialog box..................................................................................................... 144
Figure 9-16: Accessing your studies/sessions from QSP-II.................................................................... 145
Figure 9-17: Downloaded studies ........................................................................................................... 146
Figure 9-18: Viewing your results in charts and graphs.......................................................................... 146
Figure 9-19: Example of QSP-II measurement results (layout view) ...................................................... 147
Tables
Table 1-1:
Table 1-2:
Table 1-3:
Table 1-4:
Table 1-5:
Table 1-6:
Table 2-1:
Table 8-1:
Table 8-2:
Table 8-3:
Table 8-4:
Table 9-1:
HAV Threshold levels defined by ISO 5349 .............................................................................. 4
ANSI S3.34 standard for Total Aeq Duration Limits. ................................................................. 4
EU directive 2002/44/EC standards for HAV ............................................................................. 5
WBV Threshold levels defined by ISO 2631.............................................................................. 6
ISO standards for WBV TLV’s ................................................................................................... 6
EU directive 2002/44/EC standards for WBV ............................................................................ 6
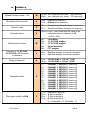
Startup screen defined............................................................................................................. 17
Basic SLM settings ................................................................................................................ 110
Profile settings ....................................................................................................................... 111
selecting signal source for trigger setup ................................................................................ 120
Explanation of graphs and charts layout view ...................................................................... 128
Explanation of HAV or WBV setup options............................................................................ 134
072-043 RevA
VI-410
1
Chapter 1 - Introduction
Threshold and Exposure values for HAV42BTables
CHAPTER
1
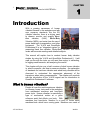
Introduction
With a growing awareness of human
vibration hazards in the workplace and with
new exposure standards like the EU
vibration directive, there is a driving need
to observe, monitor, and quantify HandArm
vibration,
(HAV),
Whole-Body
Vibration (WBV), and noise from the use of
power hand tools, transportation, and other
equipment. The VI-410 and QuestSuite
Professional II is an “integrated system” to
measuring Hand Arm vibration, Whole-Body vibration, and sound
levels with accurate readings and detailed analysis.
This manual will explain how to conduct human body vibration
studies by using the VI-410 and QuestSuite Professional II. It will
walk you through the tools you will need from setup, to calibrating,
to logging measurements, and analyzing the results.
This chapter will give you a brief overview of what human vibration
is, what to measure, and how to measure vibration. An explanation
of standards for hand arm vibration and whole body vibration will be
discussed to understand the appropriate placement of the
transducer when taking measurements. The chapter will conclude
with the introduction of the VI-410 keypad and an introduction to
QuestSuite Professional II software.
What is human vibration?
People all over the world experience vibration
in subways, buses, trains and in the workplace
from mechanical machines and hand-held
power tools. Human vibration is essentially a
type of mechanical motion at a given
reference point that effects your body. With
machines and hand-tools, vibration is a result of forces inside
machines/tools which have moving parts. Machines are made of
072-043 RevA
VI-410
2
Chapter 1 - Introduction
What to measure?
parts with different moving reference points with various frequencies
and amplitudes.
The effects of hand-arm vibration can be as
damaging as loss of feeling in your fingers and
joints, also known as hand arm vibration
syndrome, which is a degradation of blood vessels
and nerves. Some experts believe that once an
individual begins to lose feeling and experience
numbing in his/her hands that there is no real cure
for these adverse effects.
For whole-body vibration, also referred to as head-to-toe, vibration
the effects over a period of years can be
as damaging as hand-arm vibration
syndrome. In whole-body exposure,
individual(s) will experience back trauma
with severe low back pain and possibly
lumbar disc damage.
Due to the severe effects which vibration can have
on the physical condition of people, standard
committees were formed around the world to
provide threshold levels and limit exposure level
guidelines to help reduce the effects of vibration
on the human body.
What to measure?
Three main standards or guides exist in America which are:
American National Standards Institute (ANSI S.34:1987 guide),
American Conference of Governmental Industrial Hygiene
(Threshold Limit values defined ACGIH-TLV), and the National
Institute for Occupational Safety and Heath ( NIOSH, 1986). There
are two international organizations which define guidelines which
are: International Standards Organization (ISO 5349;1986 guide)
and the European communities directives for hand arm vibration
(HAV) and whole body vibration (WBV).
From the standard boards noted above, human vibration is
characterized by magnitude, frequency, duration and direction. (For
a detailed look at measurement calculations see Chapter 6, “About
Measurements”.)
072-043 RevA
VI-410
3
Chapter 1 - Introduction
How to measure?
How to measure?
With the help of the VI-410 and QuestSuite Professional II software,
you can quickly set-up the instrument, run studies on human
vibration levels, combine representative samples, and analyze the
results with exposure time calculator, time history detail, and realtime frequency analysis. The advantages of using the software with
the instrument are the ease and usage of a quick setup and the
capability of viewing the results in a graphical format including
designing personalized charts, tables, and graphs. This advanced
software will also print customized reports and enable you to export
the data into other software programs (i.e., Microsoft Excel).
Transducer
A small device, called either a transducer or an accelerometer, is
used to measure acceleration from the hand-held tool, mechanical
machine, or device in question. For hand-arm vibration, a
transducer is mounted to a device (i.e., hand tool) and then
connected to the VI-410 to record the measurements. For wholebody vibration, a seat-pad transducer (or seat-pad accelerometer) is
placed on the seat of a vibrating object (seat of heavy equipment or
aviation seat) and connected to the VI-410. The VI-410 is then
ready to “Start” or run a study. The measurements and the data are
then sent to QuestSuite Professional II for analysis of the data or
are viewed directly on the instrument. (See Chapter 7, “Taking
Measurements” for visual images of this process.)
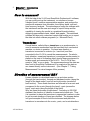
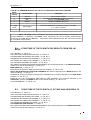
Direction of measurement HAV
Human vibration is calculated based on up and down motion
(through the hand motion), forward and backward motion (along the
length of the hand motion), and left and right motion (across the
hand motion). These three directions are referred to as an axis and
correspond to the x-axis (through the hand), y-axis (across the
hand), and z-axis (along the length of the hand).
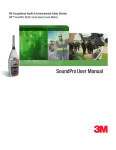
Why are these three axes of importance? According to ISO 5341
standard, the direction of vibration is measured at each axis. Thus,
it is important to place the transducer in appropriate location in order
to get accurate readings of hand arm vibration. The diagram below
is a good example of how to hold the instrument and place the
transducer in accordance to the x-axis, y-axis, and z-axis directions.
072-043 RevA
VI-410
4
Chapter 1 - Introduction
✍
NOTE: The VI-410 and QSP-II will compute the average of the
three axes (called tri-axial) in the vector sum measurement.
According to the ISO standards, the vector sum can be used to
determine the effects of vibration. Thus, the placement of the
transducer when mounted for a study is not of concern unless you
are evaluating vibration for engineering controls.
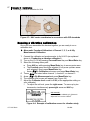
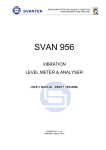
Direction for X, Y, & Z
X-axis – through the hand
Y-axis – across the hand
Z-axis – along the length of the
hand-arm
Figure 1-1: Hand-arm vibration vector coordinate systems (in
accordance with ISO standards)
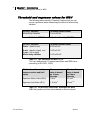
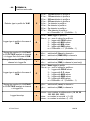
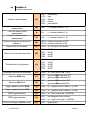
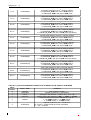
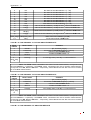
Threshold and Exposure values for HAV
The American National Standards Institute (ANSI), International
Standards Organization (ISO), and European Community Directive
(EU) uniformly maintain exposure guidelines for hand-arm vibration
and are recommended for determining the magnitude of the
measured vibration. To access these copyrighted standards, the
ISO and ANSI standards can be purchased from www.jso.org or
www.ansi.org. The EU directive can be accessed by the following
website: http://europa.eu.int/eur-lex/en/ or http://europa.eu.int/eurlex/pri/en/oj/dat/2002/l_177/l_17720020706en00130019.pdf.
The following tables can be used as a guidance when measuring
vibration.
ISO standard
Hand-Arm Vibration
Measurement
5 Hz to 1500 Hz
Table 1-1: HAV Threshold levels defined by ISO 5349
Total daily exposure duration
4 hours and less than 8 hours
2 hours and less than 4 hours
1 hour and less than
Max Frequency-weighted RMS Xh, Yh, or Zh
where the dominant RMS axis value shall not
exceed the following:
2
4 m/s
2
6 m/s
2
8 m/s
Less than an hour
12m/s
2
Table 1-2: ANSI S3.34 standard for Total Aeq Duration Limits.
072-043 RevA
VI-410
5
Chapter 1 - Introduction
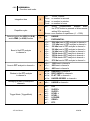
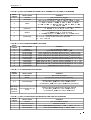
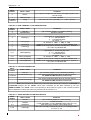
Direction of Measurement for WBV
The following standard is based on the dominant weighted RMS
value of the three axes. This standard requires weighted vibration
measurement and filter analysis (or spectrum analysis) of each axis
to determine daily exposure.
EU directive defines daily
Measurement value is based on
exposure action and limit values
8-hour intervals
Exposure Action Value (EAV)
2.5 m/s2
Exposure Limit Value (ELV)
5.0 m/s2
Table 1-3: EU directive 2002/44/EC standards for HAV
(Daily action and limit values based on 8-hour interval)
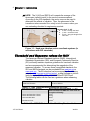
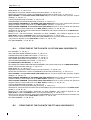
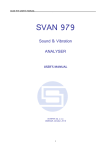
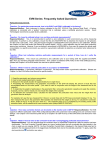
Direction of Measurement for WBV
Whole-body vibration (WBV) is a form of mechanical vibration
transmitted through a supporting surface to the body such as a
heavy equipment operator will detect vibration through the seat of
the vehicle to his/her spine. The diagrams below indicate the
direction of the axes for a person standing or sitting. The x-axis is
through the body, the y-axis is across the body and the z-axis is up
and down the body.
Figure 1-2: Defined direction of whole-body measurement
072-043 RevA
VI-410
6
Chapter 1 - Introduction
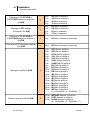
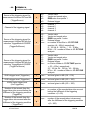
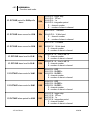
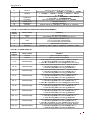
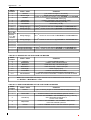
Threshold and exposure values for WBV
Threshold and exposure values for WBV
The following tables identify Threshold Levels which you can
use as a guidance when determining the effects of whole body
vibration.
ISO 2631 standard
Whole Body Vibration
Threshold Measurement
1 Hz to 80 Hz
Table 1-4: WBV Threshold levels defined by ISO 2631
ISO 2631 standard
Z axis – (head to toe)
Threshold Measurement
4 HZ to 8 HZ
X axis - (back to chest) and
Y axis - (left to right)
Whole-body vibration
1 HZ to 2 HZ
1 HZ to 80 HZ
Table 1-5: ISO standards for WBV TLV’s
TLV’s are defined with 1/3 octave band filters and RMS value
(according to ISO 2631, 2003)
EU directive defines daily
exposure action and limit
values
Exposure Action Value (EAV)
Measurement
value is based
on 8-hour
intervals
.5 m/s2
Vibration Dose
Value is based
on 8-hour
intervals
9.1 m/s1.75
Exposure Limit Value (ELV)
1.15 m/s2
21 m/s1.75
Table 1-6: EU directive 2002/44/EC standards for WBV
WBV daily action and limit values based on 8-hour interval
072-043 RevA
VI-410
7
Chapter 1 - Introduction
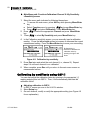
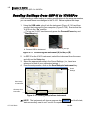
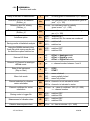
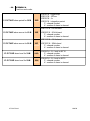
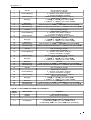
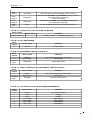
Exposure Assessment Steps
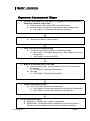
Exposure Assessment Steps
6.
1.
Perform a task-based work flow analysis of exposure to hand-arm vibration,
whole-body vibration, and/or noise.
Observe areas of HAV and/or WBV in your environment.
Jot down areas of concern for human vibration and/or sound issues.
See chapter 1 for threshold and exposure guidelines.
2.
Select tasks to be measured.
Create a list of what you will be testing.
3.
Setup VI-410 for your vibration testing.
Customize user setup for hand-arm or whole-body testing.
See Chapter 3 for vibration testing set-up. See Chapter 8 for Sound
testing setup.
See Chapter 9 to setup with QSP-II.
4.
Measure acceleration rates of each task.
Connect accelerometer , mounting device (for HAV only), and meter to
tool/machine.
See Chapter 5 “Running Measurements”.
Run tests.
See Chapter 5 “Running Measurements”.
5.
Analyze measurement results.
View Time History data and/or Summary data.
See Chapter 9 to view measurements with QuestSuite Professional II.
See Chapter 6 to view measurements on the instrument.
Develop corrective actions.
Engineering: redesign tools, changes in workstation.
Administrative: job sharing/rotations, redefinition of job functions, reduce
duration from tool/equipment, and/or implement medical surveillance.
072-043 RevA
VI-410
8
Understanding what data is stored
When you are running studies on human vibration and/or sound,
three types of data are stored: Summary data, Time History data,
and Frequency Analysis.
Summary data
Summary data computes the averages of the whole run. For
instance, the summary of vibration dose value calculates the overall
VDV value instead of reporting specific measurements that are time
stamped.
Time history data
Time history data is also referred as “logged data” which plots
measurement values in second by second, minute by minute, or
hour by hour intervals (this is dependent on your settings).
Generally, time history data will save selected measurements at
fixed intervals during a study.
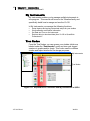
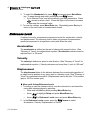
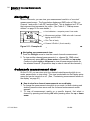
Frequency analysis and filters
With vibration, you may have a situation of measuring mechanical
shocks with short durations. In order to understand the effects of
this vibration, it is necessary to isolate the vibration and look at the
frequency components.
By applying a frequency analysis filter, this will only pass parts of
the vibration signal which are contained in a narrow frequency band.
The pass band of the filter moves across the frequency range and
computes a separate vibration reading for each band.
On the VI-410, there are three frequency analysis options: full
octave (1/1) band filter, 1/3 octave band filter and Fast Fourier
Transform (FFT) filter. In a 1/1 octave band filter, there are eleven
octave bands across the instrument’s bandwidth. With a 1/3 octave
band filter, there are
thirty-three-octave bands across the
instrument’s bandwidth (see Figure 1-3). With FFT, this has a full
frequency spectrum.
072-043 RevA
VI-410
9
Chapter 1 - Introduction
A Look at QuestSuite Professional II
Each bar
indicates a
band of
frequency.
Figure 1-3: 1/3 octave band filter chart (in QSP-II only)
Each bar
indicates a
band of
frequency.
Figure 1-4: FFT band filter example (in QSP-II only)
QuestSuite Professional II
With the VI-410, you have the option of purchasing the QuestSuite
Professional II software with the instrument. This manual will detail
how to use QuestSuite Professional II software with the sound
testing (see Chapter 9).
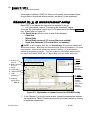
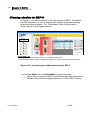
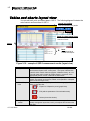
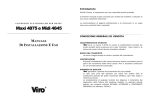
A Look at QuestSuite Professional II
With QuestSuite Professional II software (QSP-II), you can quickly,
set-up the VI-410 with the appropriate mode, range, calibration,
profile, filter, and logged items, retrieve the data from the
instrument, view the measured results (also referred to as “files” on
the instrument”), and print out customized reports from your pc.
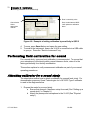
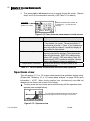
In Figure 1-5, QSP-II is divided into two sections: My Instruments
and Tree Nodes.
072-043 RevA
VI-410
10
Chapter 1 - Introduction
A Look at QuestSuite Professional II
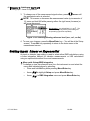
My Instruments
My Instruments enables you to manage multiple instruments in
one program. This manual will focus on the Vibration family and
specifically detail how to mange and use the VI-410.
In My Instruments you manage the following functions:
•
•
•
•
Setup features and saving customized setups for your studies
Store calibration certification information
Set Data and Time on the instrument
Retrieve data (or download data) from VI-410 to QuestSuite
Professional II.
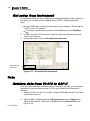
Tree Nodes
From the Tree Nodes, you can access your studies (which are
labeled under the “Downloaded” node) and view your logged
sessions in graphs and/or charts. This is also used to combine
studies and export studies for file storage purposes.
My Instruments
Tree Nodes
Figure 1-5: Explanation of Tree Nodes and My Instruments in QSP-II
072-043 RevA
VI-410
11
Chapter 1 - Introduction
A Look at QuestSuite Professional II
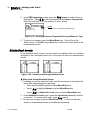
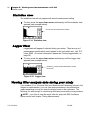
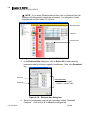
Explanation of features in QSP-II
You will want to familiarize yourself with the main components
of QSP-II. Below describes the sections in relation to taking
vibration readings and for setup purposes.
My Instruments
Select a meter and then use it to retrieve data, setup
parameters, and set date and time.
My Data
A section of the
screen (called
“pane”) used to view
your saved sessions.
Node
An expandable filing system in
which you can access subnodes (i.e., downloaded node
expanded out will show your
logged data. in “VIB” folder)
VI-410
Select instrument in
order to work with
set-up, logged data,
and retrieve data.
Meter Functionality
Retrieve Data, Setup,
Clear Memory, and set
Date-Time, etc.
072-043 RevA
Figure 1-6: Displays the main log-on screen for
Vibration in QSP-II software
VI-410
12
This page left blank intentionally
072-043 RevA
VI-410
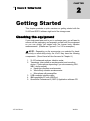
CHAPTER
13
Chapter 2- Getting Started
2
Getting Started
This chapter provides a quick overview on getting started with the
VI-410 and QSP-II software right out of the storage case.
Checking the equipment
If your instrument was sent to you in a storage case, you will want to
remove all the packaging and acquaint yourself with the equipment
so you can quickly get started with the human body vibration
measurements. (Please see Figures 2-1 or 2-2 for examples.)
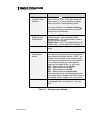
✍
NOTE: Depending on the accessories you selected for handarm study or whole-body study, the VI-410 may have the following
components. (Sound Level will be discussed in Chapter 8.)
1. VI-410 advanced analyzer vibration meter.
2. Transducer (also called an accelerometer) and mounting
device. (Three options depending if you are measuring HAV,
WBV, and/or sound):
a. Hand-Arm vibration accelerometer
b. Whole-Body vibration accelerometer
c. Microphone with preamplifier
3. USB computer interface cable.
4. IBM-compatible PC with USB Port.
5. QuestSuite Professional II (QSP II) Application software CD.
072-043 RevA
VI-410
14
Chapter 2- Getting Started
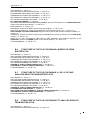
Equipment for hand arm study
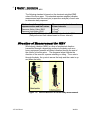
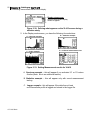
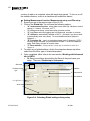
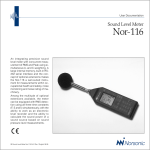
Equipment for hand arm study
With hand arm studies, there are four types of mounting devices
used to secure the accelerometer snuggly to a hand-held tool or
mechanical machine which are:
(A) Clamp and mounting block
A
(B) Stud mounting
B
(C) Mounting pads
C
(D) T-handle
D
The diagram below displays equipment for HAV study.
VI-410
USB
cable
Accelerometer
Accelerometer
cable
QSP-I
software
Clamp and
mounting device
Figure 2-1: Example of equipment for HAV
072-043 RevA
VI-410
15
Chapter 2- Getting Started
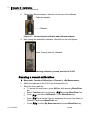
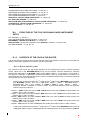
Equipment for whole body study
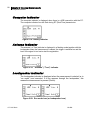
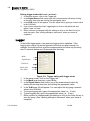
Equipment for whole body study
With whole-body vibration study, there is one accelerometer used to
measure the effects of vibration which is the seat-pad accelerometer.
As explained in Chapter 6, the accelerometer is located in the middle
and enclosed inside the disk shaped seat-pad object.
The diagram below displays equipment for a study using the
mounting block and clamp to fasten the accelerometer to a handheld tool.
VI-410
USB
cable
Accelerometer
cable
Seat-pad
accelerometer
QSP II software
Figure 2-2: Example of equipment for WBV
072-043 RevA
VI-410
16
Chapter 2- Getting Started
Turning on the VI-410
Turning on the VI-410
The VI-410 is equipped to start, pause, resume, and stop. To
turn on the instrument, simultaneously press Start key
Stop
and Proceed key .
Pause
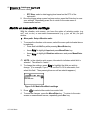
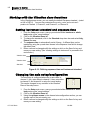
Warm up screen
The initial warm-up screen will display the name of the instrument
and then a warm up screen will appear with a sixty second
countdown. You can press the Esc key to view the start up screen
immediately.
WARM UP TIME
47s
<ESC> to skip
Figure 2-3: Warm up screen
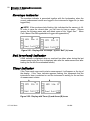
Start-up screen components
The start-up screen displays a battery indicator and a 1-channel
measurement screen. (No measurements are displayed at this point
until you begin logging data), vertical scale (to the left of the screen),
and the current time (called real-time clock).
✍
NOTE: The start-up screen will display the previously viewed
measurement screen from the last time you turned off the instrument
which could be the 1-channel measurement screen, 4-channel
measurement screen, statistics screen, or data logging screen (see
the next section “Measurement views” for more information).
A – Screen indicators
B – Measurement type, delayed time,
Weighted filter
C – Measurement scale
D – Indicates 1-channel, 1-profile screen
E - Real-time clock
Figure 2-4: Start-up screen
072-043 RevA
VI-410
17
Chapter 2- Getting Started
Turning on the VI-410
Startup screen
Explanation
A. Battery and
computer screen
indicators
The battery icon
indicates the amount of
power to the instrument. Three bars indicate full
battery supply. For more information on battery
power, see section “checking battery power.”
The second indicator is a computer indicator
which displays when the instrument is powered
through the pc via USB cable.
Logged item – RMS (Root Mean Square) displays
the measurement value calculated at RMS.
Response time – “1s” indicates data is setup to
log at one second intervals.
Weighted filter – “HP1” is the applied filter for the
vibration study. (This is explained in Chapters 3 ).
C. Measurement scale A vertical scale representing the measurement
results.
B. Logged item,
Response time,
Weighted filter
D. Channel-1/Profile-1 The one-channel measurement screen displays
measurement
each channel’s measurement’s (and each profile if
screen
setup) results on individual screens. (NOTE: you
can also view 4-channels on one screen as well.)
The following measurement views are viewable in
the one-channel screen (up to three different
setups can be created for the x, y, and z axis):
C1P1 ~ default reference to the X-Axis.
C2P1 ~ default reference to Y-Axis.
C3P1 ~ default reference to Z-Axis
C4P1 ~ default reference to sound mode
These channels can be customized during set-up.
See Channel setup in Chapter 9 for QSP-II users or
see Channel setup in Chapter 3 for VI-410 users.
E. Clock
The clock displays the current time. For information
on changing the time, see Chapter 3, “real time
clock”.
Table 2-1: Startup screen defined
072-043 RevA
VI-410
18
Chapter 2- Getting Started
Display and keypad
Display and keypad
The instrument’s user interface consists of the display, the keypad,
the selection keys, the connection ports at the top and the bottom of
the instrument.
The display is used view menu options and measurement results.
The backlight ☼ feature is used to illuminate the display in dark or
hard to see environments. (The views, measurements, and icon
indicators are explained in more detail in “Chapter 6, Taking
Measurements”).
The keypad has five dedicated keys which are color coded in red
and white to distinguish between two different functions on one key.
To activate the feature in the color red, you press the Altf key first
and then press the appropriate corresponding key. For example to
access the menu for setup and viewing of file storage (etc.),
simultaneously press Menu/Enter key and Altf key. This enables
the “menu” to appear on the VI-410 screen.
Display
Selection keys
Up/Down arrows
Left/Right arrows
Menu/Enter
Proceed/Pause
Backlight ☼/
Escape key
Altf key
Start /Stop
Figure 2-5: VI-410 keypad
072-043 RevA
VI-410
19
Chapter 2- Getting Started
Display and keypad
Keypad
functions
Menu
Enter
Menu
Enter
✸
Menu
Enter
Esc
Backlight
✸
Escape
Esc
Altf
Altf
Proceed
Proceed
Pause
Explanation of keypad options
The Menu key enables you to access all of the menus and features in
the main menu of the instrument. To select, simultaneously press the
Altf key and the Menu key.
The Enter key is used to select sub-menu lists, and/or change features
in the sub-menus. (Please see “navigating through the menus” for more
details.)
The Backlight illuminates the display on the VI-410 and is used in dark
environments. To illuminate the display screen, press Altf + ☼
(backlight indicator icon).
Similar to an undo icon, Escape enables you to move back one level or
“escapes” you out of your current sub-menus or elements.
The Alternative mode key has two functions:.
1. First function of the Altf key is similar to a Shift key on a pc
keyboard. When pressing and holding Altf , all features appearing
in the color red on the keypad are accessible (I.e., Menu, ☼, and
proceed).
2. The second function of the Altf is to move to the very top of a
sub-menu list or move to the bottom of a sub-menu list.
Simultaneously pressing the Proceed key and the Altf key enables the
user to continue measuring human vibration and/or sound.
Pause is used when you are recording human vibration and/or sound.
You can take a sample reading (press Start/Stop key), pause the test
(press Pause key), and start the test again when it is appropriate to take
another measurement (press Proceed key +Altf key).
Proceed
Pause
Pause
Start
Stop
Start
Start
Stop
Stop
Example: You are a safety control manager and you are taking
measurements on vibration with your employee who is using a powered
hand-tool. The worker sands the wood. (Start/Stop key). Turns off the
tool (Pause key) and then turns it on again to sand another piece of
wood (Proceed key +Altf). She/he finishes her/his sanding. (Start/Stop
key).)
Start is used to start a logged session and/or power on the instrument.
•
To Power on the VI-410, press and hold the Start/Stop key while
pressing Proceed/Pause key.
Stop is used to stop a logged session and/or power off the instrument.
•
To Stop recording, press the Start/Stop key.
•
To Turn-off the VI410, press and hold the Pause key while
pressing the Start/Stop key.
Table 2-2: Keypad explanation
072-043 RevA
VI-410
20
Chapter 2- Getting Started
Display and keypad
Navigating
The up/down
keys and right/left
keys are used to
navigate through the menu options and modify menu settings and
features on the instrument. The arrows are also used to select
different measurement results as you are logging or viewing stored
studies. (NOTE: the arrow images will be used to explain up/down
or right/left procedures in this manual.)
Altf
Up/Down arrows
When viewing measurements, hold and press the Altf key and press
either up or down arrow. This will toggle you through the X, Y, Z
axes (denoted as Chan1, Chan2, Chan3) and Sound (default is set
to Chan4 which is an add-on option).
Left/Right arrows
In the measurement screens, simultaneously press the Altf key and
right or left arrow, it will change the screen from a 1-channel
measurement screen to a 4-channel measurement screen (For a
detailed explanation, please refer to “4- channels measurement
view” in Chapter 5.)
B
A
Press
to toggle
through views
Figure 2-6: Left/Right arrows and Measurement screens
072-043 RevA
•
Image A displays the RMS value of the X-axis (Channel 1
Profile 1) with HP1 weighted filter applied.
•
Image B displays RMS values for X, Y, Z and sound channels
in one screen denoted as “4-channel measurement view”. with
the RMS value. Image B displays 3 channel measurement
views (Vector sum on Channel 1 or X-axis, RMS value on
channel 2 or Y-axis, and RMS value on channel 3 or Z-axis)
when toggling views by pressing Altf and right arrow
VI-410
21
Chapter 2- Getting Started
Connector inputs and outputs sockets
Menu Navigation
Using the keypad keys and the arrows, you can quickly setup your study, run a
study, and view results.
¾ Menu Navigation
1. Turn on the instrument
(simultaneously press
Proceed/Pause key and the
Start/Stop key).
2. Simultaneously press the Altf key
and the Menu/Enter key. (The
main menu will be displayed.)
3. To select from the main menu,
arrow
accordingly and select
a sub-menu feature.
4. Press Menu/Enter key to select a
nd
2 sub-menu.
Figure 2-7: Turning on
Continue this process until you reach a screen to modify or view.
To select a specific menu option, press
arrows.
5. To change a feature use arrow and press the Menu/Enter key to
apply the changed feature and press Esc key repeatedly to return to
main menu or measurement screen.
•
✍ NOTE: if you want to move back one level, press the ☼/ESC key.
Continue to press ☼/ESC key to move back up to the main menu if
applicable.
Connector inputs and outputs sockets
Inputs
On the top cover of the VI-410 are connecting inputs used for measurement
purposes. The top left channel has a 4-pin Lemo connector which is used to
record vibration from x, y, and z axes (Channels 1-3). (If you purchased the
accelerometer cable and/or the seat-pad accelerometer, this cable is plugged
into the left connector.)
072-043 RevA
VI-410
22
Chapter 2- Getting Started
Connector inputs and outputs sockets
The top right channel has a TNC connector and accepts input from a
microphone preamplifier.
Lemo Channels 1-3
• Connect the instrument to the
accelerometer for recording and
measuring for HAV or WBV.
TNC Channel 4
• Connect the instrument to the
preamp and microphone
Figure 2-8: Connector input sockets
Outputs
The meter has three bottom connectors: USB, AC/Int. and Ext. Power. Figure
1-9 illustrates the connectors and Table 1-9 defines the outputs.
AC/Int - The AC/Int has a dual purpose function:
An analog output with the signal from the input of the analog. This signal can be
registered using a magnetic recorder.
The second purpose is a digital input for external input or digital output for external
trigger.
USB - External connector used to connect the VI-410 to the QSP-II software/pc.
Ext. Power - The external power connector connects the external AC adapter
(110V/230V) which furnishes the proper DC level. If external power connector is used,
the instrument is powered from the DC source (from 6V to 24V).
AC/Int
USB
Ext. Power
Figure 2-9: Defining output connectors
072-043 RevA
VI-410
23
Chapter 2- Getting Started
Connector inputs and outputs sockets
Checking battery power
It is a good practice to check the battery power before you begin
logging/testing. The VI-410 uses four AA batteries, which will last for about
eight hours as long as the backlight is not turned on. (This will decrease by
20% with the backlight illuminated.)
Other optional power options are four AA rechargeable batteries, USB power,
or an external power battery pack (available as an add-on feature).
¾
Checking the battery power via the battery indicator
In the start-up screen, a battery icon
provides a visual display of
the battery supply. If all three bars are shaded, the battery is at full
power.
•
¾
Menu Path: Display>Power Supply
1. Turn on the meter by pressing Proceed/Pause key and Menu/Enter
key.
Figure 2-10: Power Supply menu
2. Select the menu path indicated above by selecting the following:
•
Press Altf key and the Menu/Enter key, to access main menu.
•
Arrow down to highlight Display menu and press Menu/Enter key.
•
Arrow down to highlight Battery. Press Menu/Enter key.
3. The Battery screen will display one of the battery power screens displayed
in Figure 2-10. (This is dependent on how your instrument is powered.)
Figure 2-11: Power Supply screens
4. Press Menu/Enter key to save and press Esc repeatedly to return to the main
menu or the measurement screen.
072-043 RevA
VI-410
24
Chapter 2- Getting Started
Connector inputs and outputs sockets
Installing the batteries
With the back of the instrument in your hand, pull the bottom black casing off of
the instrument. Unscrew the two black knurled nuts and load the batteries as
displayed in Figure 2-12.
B
B. Battery location
Load 2 x AA’s with
the negative side up
A
A
A. Battery fasteners
Unscrew to install
batteries
C
C. Battery location
Load 2 x AA’s
with the positive
side up
Figure 2-12: Illustration of installing batteries
Understanding Memory Storage
All available measurement results can be stored in the internal FLASH type
memory of the instrument (32 MB). The capacity of the available memory is
equal to 32 MB and is divided between logger (15 728 156 bytes) and results
and setup settings (16 121 360 bytes).
The internal memory of the instrument is divided into two separate parts. One
part is dedicated for saving the results and setup files and its size is equal to
16 121 360 bytes. The second part is used for saving the data logging files and
its size is equal to 15 728 156 bytes. To save a result file the user has to
choose either, Auto Save feature (see “Save Options” on page 37) or Save
Setup (see “Saving your setups” on page 40).
072-043 RevA
VI-410
CHAPTER
25
3
Chapter 3: Setting-up the VI-410
Setting-up the VI-410
This chapter covers the features and steps to setup the VI-410 via the
instrument screens. (If you are using QSP-II, it is recommended to setup the
instrument via the “Setup” key in the VI-410 family of instruments. Please see
Chapter 9 for QSP-II details.)
;
TIP: if you would like to quickly move from the uppermost menu selection
or the lowest menu selection in a list of options, press and hold either the
up/down arrow and press the Altf key. It will shift the selector position to the
highest or lowest selection in the menu.
The following five bullet points detail how to customize your setup to ensure
customized studies.
072-043 RevA
•
Customizing start-up features – explains how to setup the real-time
clock, screen contrast, and setting the backlight feature.
•
Working with Measurement setup - describes the global features
related to the start delay time, run time, and setting the log rate.
•
Working with the Channels setup- discusses how to customize the
mode, range, the response time, and the weighting for each axis
(called “channel” on the instrument).
•
Working with Loggers setup - a detailed look at how to select the
appropriate measurements (i.e., rms), customize the measured results
of x-axis (channel 1), y-axis (channel 2), and z-axis (channel 3)
•
Working with filters - an explanation of setting the various analysis
filters.
•
Setting Trigger mode - an explanation and procedures for setting the
triggering modes.
•
Working with the save setup features - an explanation to save your
setups, load setups, and how to save logged sessions.
•
Working with the advanced global settings - an explanation of the
advanced features on the VI-410 instrument.
VI-410
26
Chapter 3 - Setting-up the VI-410
Real time clock
Customizing your start-up features
During your initial start-up phase, you will want to set the “real time clock”,
adjust the contrast of the display to your environment, and learn how set the
backlight.
Real time clock
The real time clock is positioned on the bottom right of the display of the
instrument. It is used when you are running studies and recording the effects of
human vibration and sound.
¾
Menu Path: Setup>RTC>Real Time Clock screen
1. In the on position, select the menu path indicated above by selecting the
following:
2. Press Altf key and the Menu/Enter key, to access main menu.
•
Press
arrows to highlight Setup and press Menu/Enter key.
•
Press
arrows and highlight RTC. Press Menu/Enter key.
•
The RTC data screen appears (see Figure below).
Time: (24-hour clock)
Date: (day-month-year)
To edit
Press and hold Alf while pressing left/right arrow
Figure 3-1: Real Time Clock (RTC) screen
3. To select and change Time fields, listed as hours:minutes:seconds, do
one of the following:
•
Press
arrows to select a field to change.
•
To change, press and hold Altf while pressing
arrows.
4. To select and change the Date fields, listed as day-month-year, do one of
the following:
•
Press
arrows to select a field to change.
•
To change, press and hold Altf while pressing
arrows.
5. Press Menu/Enter key to save and press Esc repeatedly to return to the main
menu or the measurement screen.
072-043 RevA
VI-410
27
Chapter 3 – Manual setup with VI-410
Contrast and Backlight settings
Contrast and Backlight settings
The screen setup window enables the user to set a 30 second backlight
automatic switch off , the brightness of the backlight and the proper contrast of
the display.
With the Light Timeout feature, if you wish to save battery power, it is
recommended to use the 30-second (Back) Light Timeout feature. A simple
checkmark will activate this timer where as no checkmark indicates the
backlight timer is deactivated. The backlight will activate each time you press
the keypad proceeding each 30 second time out.
¾
Menu Path: Display>Screen setup
1. In the on position, select the menu path indicated above by selecting the
following:
•
Press
arrows to highlight Display and press Menu/Enter key.
•
Press
arrows and highlight Screen Setup. Press Menu/Enter
key.
2. In the Screen Setup press
to select the Light Timeout field,
Brightness field, or Contrast field.
3. To change the fields, press
arrows.
Light timeout – sets a 30 second backlight switch off
Brightness – press& hold left/right to +/- level for backlight
Contrast – press and hold left/right to adjust the grayness of
your display
Figure 3-2: Backlight timer, backlight setting, and contrast setting
4. Press Menu/Enter key to save and press Esc repeatedly to return to the main
menu or the measurement screen.
072-043 RevA
VI-410
28
Chapter 3 - Setting-up the VI-410
VI-410 information screen (meter unit)
VI-410 information screen (meter unit)
To check the meter label or information screen for the name of the instrument,
serial number (also posted on the back of the instrument) version and
standards, you will want to visit the unit label screen.
¾
Menu Path: Display>Unit Label
1. In the on position, select the menu path indicated above by selecting the
following:
•
Press
arrows to highlight Display and press Menu/Enter key.
•
Press
arrows and highlight Unit Label. Press Menu/Enter key.
2. To check view the information in the unit label screen, press
to scroll through the information.
A
arrows
B
Press Up/Down arrows to
scroll through info.
C
D
Press Up/Down arrows to
scroll through info.
Figure 3-3: Information screen (serial & software #’s and standards)
072-043 RevA
VI-410
29
Chapter 3 - Setting-up the VI-410
Start Delay
Measurement setup features
On the VI-410, you can customize the overall settings by changing the following
measure setup menu: start delay, integration time, repetition of measurement
cycles, and buffer steps. The following sections outline how to change these
settings. (These features are accessed from the Input menu and Measurement
setup screen.)
✍
NOTE: When changing the settings on this screen, ensure you press the
Enter key when completed to activate your new settings.
Start Delay
The start delay mode is used to define the time delay that will occur when the
Start/Stop key is pressed until the start of your study occurs. The Start Delay is
automatically set for 1 second and can be programmed up to a 60-second
delay when enter is pressed after the field is changed.
Run Time/Integration period
The run time, also called integration period (“Int. Period”) on the instrument,
defines the period in which the signal is being averaged during the
measurements. This can be changed from the 8-hour default to seconds,
minutes, and various hour values.
✍ NOTE: You can log various sessions at shorter intervals using the
Start/Stop key and the Proceed/Pause key.
Measurement cycles
You can define the number of measurement cycles (denoted as “Cycles
Number”) to be performed on the instrument which also coincides with the
defined run time.
Log rate
The log rate (or called “Logger Step” on the instrument) will log and store
measurement values every 1 minute (this is the default) until the study is
paused or stopped. The log rate is set at various milliseconds, seconds,
minutes, and one-hour values.
072-043 RevA
VI-410
30
Chapter 3 - Setting-up the VI-410
Measurement Setup
Measurement Setup
¾
Menu Path: Input>Measure Setup
1. With the instrument turned on, select the menu path indicated above by
selecting the following:
•
Press
arrows to highlight Input and press Menu/Enter key.
•
Press
arrows and highlight Measure Setup. Press Menu/Enter
key. (The Measurement setup screen will open.)
2. To select one of the fields, press
3. To change a field, press
arrows.
✍
arrows.
NOTE: To move by increments of 10, press and hold the Altf while
pressing
arrows.
4. To save any of the settings, press Menu/Enter key.
Start delay
Integration period (run time)
Cycles number (measurement cycles)
Logger Step (Log Rate time)
Figure 3-4: Measurement Setup
5. Press Enter/Menu key to save the changed setting. This will take you back
one screen menu (to the Input menu). To return to the main screen,
repeatedly press Esc.
Channel settings:
mode, range, filter weighting,
response time
The channel setup is used to set the appropriate vibration levels or sound
level (for sound measurements please see Chapter 8). For human vibration
measurements, the channel parameters include the mode, range, the
weight filter, and response time (also called “detector” on the instrument).
These features are accessed via the Input Menu and then selectable in the
Channels Setup menu.
072-043 RevA
VI-410
31
Chapter 3 - Setting-up the VI-410
Mode (vibration or sound)
Mode (vibration or sound)
The selectable fields include either vibration or sound testing. In the case of
vibration mode, the user selects the range, an optional weighted filter (filter)
and response time (also called detector time constant).
In the case of sound mode, it is possible to set parameters for microphone
(microphone correction) and to set parameters in profiles (PROFILE y).
Range
To measure acceleration, the range is determined by the following two ranges:
17.8 m/s2 or 316 m/s2
Filter
Frequency filters provide detailed results to identify the causes of vibration and
enable you to develop corrective engineering and administrate changes. You
have the following options:
wh- weighted filter for hand-arm studies.
HP - The following three types of high pass filters are used to measure
acceleration.
HP1 (range 1HZ to 20 kHZ), HP3 (range 3.5 HZ to 20 kHZ), HP10 (range 10
HZ to 20 kHZ)
Velocity measurements -The following three types of digital filters are used to
measure velocity:
Vel1, Vel10, VelMF
Displacement measurements - The following three types of digital filters are
used to measure displacement.
Dil1, Dil3, Dil10
Human vibration measurements-The following are variations of digital filters to
measure human vibration:
W-Bxy, W-Bz, H-A, W-Bc, KB, Wk, Wd, Wc, Wj
RMS Detector
The RMS detector can be set at the following intervals in the VLM mode: 100
ms, 125 ms, 200 ms, 500 ms, 1.0 s, 2.0 s, 5.0 s, and 10 s.
072-043 RevA
VI-410
32
Chapter 3 - Setting-up the VI-410
Changing channel settings
Changing channel settings
Main Menu path: Menu>Input>Channels Setup>Channel x
¾
1. With the instrument turned on, select the menu path indicated above by
selecting the following:
•
Press
arrows to highlight Input and press Menu/Enter key.
•
Press
key.
arrows and highlight Channels Setup. Press Menu/Enter
Channels 1-4
To setup each channel, select the first channel,
make edits, and then return to this screen and
select the subsequent channel until all channels
are setup accordingly
Figure 3-5: Channels Setup screen
2. Select Channel 1, Channel 2, Channel 3, or Channel 4.
• To select, press the
arrows and then press Menu/Enter key.
•
For example purposes, Channel 1 was selected as indicated in the next figure.
3. In the Channel 1 setup screen (or Channels 2-4 depending on your
selection in step 2), press
4. To change a field, press
arrows to select one of the fields.
arrows.
Channel (1) Setup
•
Vibration or Sound Mode
•
Range
•
Filter
•
Detector (response time)
Figure 3-6: Measurement Setup
5. Press Enter/Menu key to save the changed settings. This will take you
back one screen (Channels Setup screen).
6. To make changes on subsequent channels, please see steps 3-5 until all
changes have been made.
7. Press Esc repeatedly to return to the main menu or the measurement screen.
072-043 RevA
VI-410
33
Chapter 3 - Setting-up the VI-410
Time history data
Saving Logged Items
Time history data
With the logger setup menu, you can save time history data which includes
Peak, Peak-to-Peak (P-P), Maximum (MAX), RMS (similar to average vibration
calculation), and Vibration Dose Value (VDV) measurements. Once selected,
this data will store on the instrument. (See glossary of terms for explanation on
measurements.).
¾
Main Menu path: Input>Logger Setup>Logger Setup screen>select
each channel
1. With the instrument turned on, select the menu path indicated above by
selecting:
•
Press
arrows to highlight Input and press Menu/Enter key.
•
Press
arrows and highlight Channels Setup. Press
Menu/Enter key.
2. To turn the logger setup on/off, press the arrow
to select “On”. If no
text appears, this indicates Off.
•
Once in the On mode, Channels 1-4 and Auxiliary option will
appear.
3. Select Channel 1, Channel 2, Channel 3, Channel 4, or Auxiliary, by using
the
arrows to select. Press Menu/Enter key to open the screen.
Logger Setup
To enable, press right/left arrow to switch to
“On” mode
Auxiliary – Storing Vector and RPM settings
Figure 3-7: Logger Setup
4. In the Logger Setup (1) screen (or in the screen you selected in step 3) do
one of the following:
• Press right or left arrow to add a checkmark to the settings you wish to
log. (A checkmark enables storing the logged item.)
• To select a different field, press
arrow until a specific field is
selected.
072-043 RevA
VI-410
34
Chapter 3 - Setting-up the VI-410
Time history data
•
To Save your settings, press the Menu/Enter key. (It will return you to
the previous Logger setup screen.) (Or press Esc key to undo your
settings.)
Logger Setup
Select by pressing up/down to highlight.
Press Menu/Enter to save your settings.
Figure 3-8: Logged item setup (i.e., Peak time history value saved)
5. To make changes on subsequent channels, please see steps 3-4 until all
changes have been made.
6. To select either Vector or RPM measurement results, select the Auxiliary
menu by pressing
arrows and Menu/Enter key . Press
arrows
to check or uncheck.
Auxiliary data logging
Select by pressing up/down to highlight.
Press Menu/Enter to save your settings.
Figure 3-9: Enabling Vector or RPM logged settings
7. Press Menu/Enter key to save and press Esc key repeatedly to return to the
main menu or the measurement screen.
Measurement Function
A Filtered frequency range captures specific data (noted as a “band” in the
spectrum and attenuates (drops off) other measurements. This is typically used
for engineering controls (See chapter 1, “Frequency Analysis” for more
information.)
The default setting for the measurement function is set to “level meter” which
indicates the filtered frequency analysis is not enabled. You have the option to
enable as either full octave band (1/1) or 1/3 octave band. For sound, see
Chapter 8.
072-043 RevA
VI-410
35
Chapter 3 - Setting-up the VI-410
Selecting 1/1 or 1/3 octave band analysis
Selecting 1/1 or 1/3 octave band analysis
¾
Menu Path: Function>Meas. Function >Measurement function screen
1. With the instrument turned on, select the menu path indicated above by
selecting:
•
Press and hold Altf key while pressing Menu/Enter key.
•
•
Press
arrows to highlight Function and press Menu/Enter key.
Press
arrows and highlight Measur. Function and press
Menu/Enter key.
2. To select a measurement function, press
arrows to select one of the
settings. Press
arrow to select one of the options.
Asterisk indicates which mode is selected
Select by pressing up/down to highlight option.
Press right or left arrow to place a checkmark
Figure 3-10: 1/1 octave band, 1/3 octave, sound, or level meter
✍
NOTE: When selecting either 1/1 or 1/3 octave band, an asterisk indicates
if it is activated.
3. Press Menu/Enter key to save the changed settings.
✍
NOTE: If you set either 1/1 or 1/3 octave band analysis, this will now
appear in the Input menu.
4. Press Esc key repeatedly to return to the main menu or the measurement
screen.
RMS data logging
Once 1/1 or 1/3 octave band analysis is selected as the measuring function,
you have the option of activating RMS data logging. To activate this feature,
ensure you followed the section above before beginning.
Figure 3-11: Selecting 1/1 octave setup
072-043 RevA
VI-410
36
Chapter 3 - Setting-up the VI-410
Selecting 1/1 or 1/3 octave band analysis
¾ Menu Path: Input>1/1 Octave Setup >Channel x (1-4)>Spectrum (x) (1-4)
1. With the instrument turned on, select the menu path indicated above by
selecting:
•
Press and hold Altf key while pressing Menu/Enter key.
•
Arrow
to highlight Input and press Menu/ Enter key.
•
Arrow
key.
to select 1/1 or 1/3 Octave Setup and press Menu/Enter
Figure 3-12: 1/1 octave setup and channel selection
2. To setup RMS filter, press Channel 1, Channel 2, Channel 3, or Channel 4
by pressing
arrows and press Menu/Enter key.
3. To enable, press
arrow in the Enabled field.
•
Press the down arrow to move to the Logger field.
•
To select RMS, press
•
To save this setting, press Menu/Enter key.
•
To return to the main screen, continue to press Menu/Enter or Esc
key.
arrow until RMS appears.
Spectrum (1)
Enabled: press left/right arrow to add checkmark
Logger: To activate RMS as a logged item, press
right/left arrow when the cursor is on this field. (Press
Menu/Enter to save)
Figure 3-13: Selecting RMS data item with 1/1 or 1/3 enabled
4. Press Menu/Enter key to save and press Esc repeatedly to return to the main
menu or the measurement screen.
072-043 RevA
VI-410
37
Chapter 3 - Setting-up the VI-410
Setting Autosave, statistics, spectrum saving & replace
Save Options
There are three methods for saving your logged sessions. The first method is
to save your files in the Logger Setup and choose which measurements to
store as time history data (For more details, please see “Saving logged items”,
on page 33.)
The second method, and recommended for people who would like to view the
sessions in QSP-II (such as a pc), is saving your files in the File main menu
under Save submenu. Below explains how to Autosave and also explains the
Save options on the VI-410.
The third method is to save each study as needed. For example, you would
access the save menu and save each time before you run a
study/measurements.
Setting Autosave, statistics, spectrum saving & replace
AutoSave
You can quickly turn on/off AutoSave on the instrument. This will save the
measurement results as a file in the instruments memory (which is also referred
to as “RAM file”). The default is set to “off”.
✍ NOTE: When changing the AutoSave feature, you may get an error
message stating that the integration period is too short. The “integration
period” (or “run time” setting”) must be set to a minimum of 10-second run-time
intervals. The default is set at 1-second intervals. (For more details on
changing the run time or “integration period”, please see “Measurement Setup”
on page 34.)
Statistic saving
Additionally, in the Save options screen, you can save statistical data. Below
explains how to enable these features.
RAM File
Saves data in a “RAM” file storage partition of the internal memory.
072-043 RevA
VI-410
38
Chapter 3 - Setting-up the VI-410
Saving measurements each run/stop session
Spectrum saving: minimum and maximum
•
•
Minimum Spectrum – This setting is used to save the lowest values of the
instantaneous spectrum.
Maximum Spectrum – This setting is used to save the highest values of the
instantaneous spectrum.
✍
NOTE: these settings are calculated with a 100-milliseconds period, which
occurred during the Run Time (also referred to as “integration period”
which is set by the following menu path: Menu>Input>Measurement
Setup>Int. Period. For more information, please see “Measurement
Setup”, on page 38.
Replace a file
If activated, the “replace” feature will automatically save and replace (or overwrite) a file when the naming convention is the same for a saved file or a saved
setup.
Saving measurements each run/stop session
With the save feature, you may wish to control when the measurements are
saved and when they are not saved. To apply the save feature, first run a
measurement/study. Then if you want to save the data, you would navigate to
the File menu and select the Save menu. The file will store in the internal
memory (See Appendix B for file formats) and can be loaded and viewed (See
Chapter 6) on the VI-410 or in QSP-II software.
¾ Menu Path: File>Save
1. With the instrument turned on, select the menu path indicated above by
selecting:
•
Press and hold Altf key while pressing Menu/Enter key.
•
Arrow
to highlight File and press Menu/Enter key.
•
Arrow
to select Save and press Menu/Enter key.
File name
To customize the name, press up/down arrow
to select an alpha or numeric character
Auto name: To assign the file name field,
ensure the Auto name field is switched to
“number” as the field category.
Figure 3-14: Save screen
072-043 RevA
VI-410
39
Chapter 3 - Setting-up the VI-410
Save Options Screen
2. To customize the file name, press
arrows to select the file name
field. Then, press
to navigate to each character . Press either up or
down arrow to change the file name character to a specific number or letter.
Continue to press the right arrow to move through the file naming
convention.
3. Once you have selected a customized file name, turn the auto name field to
“Number”. This will activate the file name you set in step 2. (Press down
arrow to select the Auto Name field. Press right arrow until “number”
appears.)
4. Press Menu/Enter key to save your changes. Repeatedly press Esc to
return to the main menu or the measurement screen.
Save Options Screen
¾ Menu Path: File>Save Options> AutoSave option
1. With the instrument turned on, select the menu path indicated above by
selecting:
•
Press and hold Altf key while pressing Menu/Enter key.
•
Arrow
to highlight File and press Menu/Enter key.
•
Arrow
to Save Options menu and press Menu/Enter key.
2. In the Save Options screen, there are six selections (see page 41 for
details).
3. To select a Save Option, press
arrows to select one of the settings.
Press
arrow to select one of the options.
✍
NOTE: AutoSave is enabled/activated when “Number” appears in this
field. The other fields are selected/activated when an asterisk appears.
With the AutoSave field, press Menu/Enter to turn on this feature and then
see step 5.
4. Press Menu/Enter key to save your settings.
Save Options
• Auto Save feature enabled
Figure 3-15: AutoSave enabled
072-043 RevA
VI-410
40
Chapter 3 - Setting-up the VI-410
Save Options Screen
5. If AutoSave is activated (and you pressed Menu/Enter key), an Auto File Name
screen will appear.
•
Optional: type in a new file name by pressing Up or Down arrow. To
move to the next field, press Right arrow. To add a space, press and hold
Altf while pressing the right arrow.
• Press Menu/Enter to save changes.
@HAV1
Enter File name with right or left arrow
Figure 3-16: Auto File Name screen
6. Press Esc repeatedly to return to the main menu or the measurement screen.
Saving your Setups
With the VI-410, you can save one or multiple setups and assign each setup a
custom file name. For example, you could create a setup for a Hand Arm
Vibration test and create another setup for Whole Body Vibration test. Once set
and saved, you would select and apply the setting via the “Load Setup” menu
(explained in the proceeding section).
¾ Menu Path: File>Save Setup
1. With the instrument turned on, select the menu path indicated above by
selecting:
•
Press and hold Altf key while pressing Menu/Enter key.
•
Arrow
to highlight File and press Menu/Enter key.
•
Arrow
to Save Setup menu and press Menu/Enter key.
2. To save the current setup, add a file name (or leave the default name) and
select “Number” in the Auto Name field.
•
To add a file name, press
arrows.
•
To move to the next field, press left or right arrow.
3. To change the Auto Name field, press
arrows to select the field and
press the right or left arrow to change the field to “Off” or “Number”.
072-043 RevA
VI-410
41
Chapter 3 - Setting-up the VI-410
Saving filters
✍
NOTE: In the Auto Name field, “Number” signifies that the instrument will
save the setup with the designated file name displayed in the File Name
field.
Save Setup
• Add a file name and ensure “Number”
appears in the Auto Name field. Press
Menu/Enter key to save the newly named
setup.
Figure 3-17: Auto File Name screen
4. To save your changes, press Menu/Enter key. (If you do not wish to save
your changes, press Esc key.)
5. To save the settings, press Menu/Enter key. Repeatedly press Esc key to
return to the menu or measurement screen.
Saving filters
To enable or disable firmware filter options, you will want to visit the setup
options screen.
¾ Menu Path: File>Setup Options
1. With the instrument turned on, select the menu path indicated above by
selecting:
•
Press and hold Altf key while pressing Menu/Enter key.
•
Arrow
to highlight File and press Menu/Enter key.
•
Arrow
to Setup Options menu and press Menu/Enter key.
2. To save user filters, press the right arrow to add a checkmark. (To disable,
press the right arrow again to uncheck.)
User filter option – select to save
Figure 3-18: Save User Filter screen
3. To save the settings, press Menu/Enter key. Repeatedly press Esc key to
return to the menu or measurement screen.
072-043 RevA
VI-410
42
Chapter 3 - Setting-up the VI-410
Setting up Auxiliary Devices
Working with Advanced settings
Setting up Auxiliary Devices
RPM/RPS Setup
RPM (or Revolutions per Minute) or to test RPS (Revolutions per Second) is
most commonly used to measure rotational speed or angular velocity of a
mechanical component with a tachometer. A Digital Input (or tachometer) is
inserted in the bottom of the VI-410 in the I/O socket before the run is activated.
(The digital I/O setup screen should be setup as “Digital In” as the mode. The
menu path is as follows: Setup>Ext. I/O Setup.)
To Enable RPM/RPS, the end user will need a code (this is an additional
option) before proceeding with setup and RPM measurements.
The screen fields/parameters are as follows:
•
Pulses or Rotations - This feature enables the user to select the
number of pulses / rotations during RPM measurement. The selectable
values cover a range between1 – 360 and are confirmed by pressing
the Menu/Enter key.
•
Unit – The unit enables you to select the measurement type as RPM or
RPS (as defined above).
•
Logger – The logger field enables you to save the results as data
logging measurements or time history measurements.
✍
NOTE: The following menu must be set to data logging: Input>
Measurement Setup>Logger( For more information, please see “Saving
logged items”, on page 33).
¾ Menu Path: Input>Auxiliary Setup>RPM Setup
1. With the instrument turned on, select the menu path indicated above by
selecting:
2. Press and hold Altf key while pressing Menu/Enter key.
•
Arrow
to highlight Input and press Menu/Enter key.
•
Arrow
to Auxiliary Setup menu and press Menu/Enter key.
•
Arrow
to RPM Setup menu and press Menu/Enter key.
3. To enable RPM Setup, press the right arrow to add checkmark in the
enabled field.
072-043 RevA
VI-410
43
Chapter 3 - Setting-up the VI-410
Setting up Auxiliary Devices
✍ NOTE: this may require an end-user code. Please call Quest’s
Technical Support for any questions.
4. Press
arrows to select one of the fields. To change the fields, press
to select one of the options.
✍
NOTE: For the Pulses/Rotation field, if you wish to move in increments of
10, press and hold Altf while pressing the right or left arrow.
5. To save the settings, press Menu/Enter key. Repeatedly press Esc key to
return to the main menu or measurement screen. When you run a study,
the following results will display for one-measurement screens:
MIN rpm
2.0000
ROTATION
MAX rpm
4.0000
ROTATION
ROT
5.0000
ROTATION
Figure 3-19: Save User Filter screen
SEAT setup for attenuation measurements
The seat setup option may be used for attenuation measurements of vibration.
One of the channels (referred as a “Base Channel”) measures the signal
before attenuation and the other channel (referred to as a “SEAT” Channel)
measures the signal after attenuation (i.e., as in the case of the seat
suspension in vehicles).
¾ Menu Path: Input>Auxiliary Setup>”SEAT” Setup
1. With the instrument turned on, select the menu path indicated above by
selecting:
•
Press and hold Altf key while pressing Menu/Enter key.
•
Arrow
to highlight Input and press Menu/Enter key.
•
Arrow
to Auxiliary Setup menu and press Menu/Enter key.
•
Arrow
to “Seat” Setup menu and press Menu/Enter key.
2. To enable the “SEAT” Setup screen, press the right arrow to add
checkmark in the enabled field.
072-043 RevA
VI-410
44
Chapter 3 - Setting-up the VI-410
Setting up Auxiliary Devices
3. For the “SEAT” Channel setup (measures after attenuation) and Base
Channel setup (measures before attenuation), select a corresponding
channel.
•
Press
arrows to select Seat Channel field. Press
arrow to
select a specific channel. NOTE: Remember with the default settings,
Channel 1 corresponds with the x-axis, Channel 2 corresponds with the
y-axis, and Channel 3 corresponds with the z-axis.
B
A
SEAT Setup
Choose appropriate
x,y, and z-axis for the
“Seat” and “Base”
measurements.
Figure 3-20: Auxiliary screen (A) and Seat Setup screen (B)
4. When you run a study (explained in Running Measurements- Chapter 5) the
following results will appear:
•
The “SEAT” result is presented in one-measurement screen. It is
calculated by dividing RMS result from the “Seat Channel” field by the
RMS result from the “Base Channel” field.
•
Additionally, if VDV result is available for filters selected in Channels
Setup screen, the SEAT result is calculated by dividing VDV result from
“Seat Channel field” by VDV result from the “Base Channel” field.
Figure 3-21: Results from “SEAT” measurements
072-043 RevA
VI-410
45
Chapter 3 - Setting-up the VI-410
Setting up Auxiliary Devices
Vector Setup
In the vector setup screen, the user may select the coefficients to calculate the
vector. When the user needs to calculate it with other than standard
coefficients, you can change the coefficient within the values from 0.00 to 2.00.
•
The values presented below are taken into account during the
calculations of the measurement results. Vector is calculated with the
following formula:
VECTOR = k 1x 12 + k 2 x 22 + k 3 x 23 + k 4 x 24
•
Where k1, k2, k3 and k4 are the coefficients and x1, x2, x3 and x4 are
RMS results for different channels. It is important that the user should
choose only coefficients corresponding with the proper channels.
¾ Menu Path: Input>Auxiliary Setup>Vector Setup
1. To modify vector calculations, turn the instrument on and select the menu
path indicated above by selecting:
•
Press and hold Altf key while pressing Menu/Enter key.
•
Arrow
to highlight Input and press Menu/Enter key.
•
Arrow
to Auxiliary Setup menu and press Menu/Enter key.
•
Arrow
to Vector Setup menu and press Menu/Enter key.
2. To select a channel field press
arrows. To change the value, press
the right or left arrow to increase/decrease the vector coefficient.
3. To select a channel for computation purposes, press Altf key to move to
the bracket field. Press right arrow to enable (a checkmark indicates when
it is enabled).
•
To disable, press right arrow until it is unchecked.
Vector Setup
• To select a vector measurement, select a
specific channel and press Altf key to move
to the brackets.
• Press right arrow to add a checkmark.
Figure 3-22: Vector Setup screen
072-043 RevA
VI-410
46
Chapter 3 - Setting-up the VI-410
Setting up Auxiliary Devices
HAV/WBV Dose Setup
With the Dose Setup screen, you have the following options:
•
Exposure Time –enables the user to set the desired value of the
exposure time that is used for the calculation HAV/WBV DOSE results.
The selectable values range from one hour (00h01) to 24 hours
(24h00).
•
X, Y, Z-Axis fields – enables the user to edit the Channels 1-4 and
filters if desired.
•
Standards field – you have the option of applying standards from the
following countries: United Kingdom, Italy, Poland, French, or a
custom “User” standard.
¾ Menu Path: Input>Auxiliary Setup>HAV/WBV Dose Setup
1. To modify HAV or WBV Dose setup, turn the instrument on and select the
menu path indicated above by selecting:
•
Press and hold Altf key while pressing Menu/Enter key.
•
Arrow
to highlight Input and press Menu/Enter key.
•
Arrow
to Auxiliary Setup menu and press Menu/Enter key.
•
Arrow
key.
to HAV/WBV Dose Setup menu and press Menu/Enter
2. To enable the HAV or WBV Dose calculation, add a checkmark to the
“Enabled” field by pressing the right arrow. To select an alternative field,
press the
arrows.
3. To change the Exposure Time, press the right arrow to increase by
increments of 1. To increase by increase of 10, press Altf and then press
the right arrow repeatedly until the appropriate time value appears.
4. To move to the axis settings, press
arrows. To change the
channels, press the right arrow repeatedly until the appropriate channel is
selected.
HAV/WBV Dose
• Check to enable this function.
• Axes setup
• Standards – select this feature and
press enter to view your options
Figure 3-23: HAV/WBV Dose setup screen
072-043 RevA
VI-410
47
Chapter 3 - Setting-up the VI-410
Reference Level
5. To select the Standards field, press
arrows and press Menu/Enter
key. To page through and select a standard press
arrows.
•
If you selected “User” and will be defining your own parameters. Press
arrows to select a field. Press the right or left arrows to increase
or decrease the numerical value.
6. To save the settings, press Menu/Enter key. Repeatedly press Esc key to
return to the main menu or measurement screen.
Reference Level
A reference level for measurement signals can be set for acceleration, velocity,
and displacement. The reference level is taken into account if measurement
results are expressed in a logarithmic scale (with dB as the units).
Acceleration
The acceleration is defined as the rate of change with respect to time. (See
“Glossary of Terms” for mathematical equation.) Acceleration reference can be
adjusted from l to 100 µm/s2.
Velocity
The velocity is defined as speed in one direction. (See “Glossary of Terms” for
mathematical equation.) Velocity reference can be set from 1 nm/s to 100 nm/s1.
Displacement
The displacement refers to the distance between the normal resting position of
an object and its position at any given time in a vibration cycle. (See “Glossary of
Terms” for mathematical equation.) Displacement can be set from 1 Pico meters
(pm) to 100 Pico meters (pm).
¾ Menu path: Setup>Reference Levels
1. To change or view the reference level, turn the instrument on and select the
menu path indicated above by selecting:
•
Press and hold Altf key while pressing Menu/Enter key.
•
Arrow
to highlight Setup and press Menu/Enter key.
•
Arrow
to Reference Levels menu and press Menu/Enter key.
2. In the Reference Levels screen, press the
arrows to select
Acceleration, Velocity, Displacement, or Sound.
072-043 RevA
VI-410
48
Chapter 3 - Setting-up the VI-410
Setting input: Linear or Exponential
3. To change one of the measurement signal values, press
arrow until
the appropriate value is selected.
✍ NOTE: To increase or decrease the measurement value by increments of
10, press and hold Altf while pressing either the right arrow (increase) or
left arrow (decrease).
2
Acceleration - the default field is “1 µm/s . The
field was changed by pressing and holding Altf
and pressing right arrow repeatedly.
Figure 3-24: Selecting/Viewing reference level (acc., vel., or dis.)
4. To save your changes, press the Menu/Enter key. (You will be at the Setup
screen.) Press Esc key repeatedly to return to the main menu or the
measurement screen.
Setting input: Linear or Exponential
An input or detector type setting is used to select either RMS calculations using
a linear integration method for vibration measurements or LEQ calculations
using an exponential method for sound measurements.
¾ Menu path: Setup>RMS Integration
1. To change or view the reference level, turn the instrument on and select the
menu path indicated above by selecting:
•
Press and hold Altf key while pressing Menu/Enter key.
072-043 RevA
•
Arrow
to highlight Setup and press Menu/Enter key.
•
Arrow
to RMS Integration menu and press Menu/Enter key
VI-410
49
Chapter 3 - Setting-up the VI-410
Statistical levels
2. In the RMS Integration screen, press the
arrows to select Linear or
Exponential. Press
to add a checkmark in the Linear or Exponential
fields (the checkmark denotes enabled or active mode).
Linear
Default is set for vibration measurements
Figure 3-25: Selecting Linear or Exponential for Input/Detector Type
3. To save your changes, press the Menu/Enter key. (You will be at the
Setup screen.) Press Esc key repeatedly to return to the main menu or the
measurement screen.
Statistical levels
In the statistical levels screen, one can select ten statistics from one hundred
calculated in the instrument which will in the same file with the measurement
results.
Figure 3-26: Viewing or selecting statistical levels
¾ Menu path: Setup>Statistical Levels
1. To change or view the statistical levels, turn the instrument on and select the
menu path indicated above by selecting:
•
Press and hold Altf key while pressing Menu/Enter key.
•
Arrow
to highlight Setup and press Menu/Enter key.
•
Arrow
to Statistical Levels menu and press Menu/Enter key.
2. In the Statistical Levels screen, press the right arrow repeatedly to select
a new level. To change other levels, press
arrows.
3. To save your changes, press the Menu/Enter key. To return to the main
screen or measurement screen, press Esc key repeatedly.
072-043 RevA
VI-410
50
Chapter 3 - Setting-up the VI-410
Filter coefficients for 1/1 and 1/3 octave analysis
Filter coefficients for 1/1 and 1/3 octave analysis
User filter setup
Filter coefficients (or “weighting factor”) can be modified for 1/1 or 1/3 octave
band analysis measurements for vibration or sound studies. If you are applying
filters in the band measurements, the measurement results will add these to the
total values of the x, y, and z-axis.
Optional settings in the User Filters screen:
•
Mode field – used to select either vibration or sound studies.
•
Filter field – used to select specific axis or channel in order to view or
apply coefficients. For example, for vibration channels one through
three correspond with “vuser1, vuser2, and vuser3”. For sound,
“suser1, suser2, and suser3” are the corresponding channels.
•
View field – used to view the octave band user filter coefficient settings
(if applied).
•
Edit field– to enable filter coefficients (or “weighting factors” as
referenced in the ISO standards), this feature is selected and values
are assigned by pressing the right/left arrows. (Please see sample
screen below). The range is from 0.8 Hz to 20 kHz.
Figure 3-27: Viewing or selecting statistical levels
Clear field– used to clear or delete any applied filters (set in the Edit
field).
¾ Menu path: Setup>User Filters and coefficients
1. To change or view User Filters, turn the instrument on and select the
menu path indicated above by selecting:
•
Press and hold Altf key while pressing Menu/Enter key.
•
072-043 RevA
•
Arrow
to highlight Setup and press Menu/Enter key.
•
Arrow
to User Filters menu and press Menu/Enter key.
VI-410
51
Chapter 3 - Setting-up the VI-410
Customizing measurement results on the display
2. In the Spectrum Based screen, select the appropriate mode by pressing
the right arrow to switch between vibration and sound.
VUSER1– corresponds with channel 1 for filter settings
Figure 3-28: Applying filters for 1/1 or 1/3 measurements
3. Select a Filter for channel 1, channel 2, or channel 3 (corresponding with
vuser 1, vuser2, vuser3) by pressing the down arrow until selected. Press
Right arrow repeatedly to select the appropriate channel.
4. To edit or view the settings in this screen, press Down arrow repeatedly to
select the Edit field and press Menu/Enter key.
5. To change the Edit VUser1 screen, press
arrow to select the
appropriate field. Press
repeatedly to select the appropriate filter
coefficient.
To change the filter coefficient, press the right arrow
repeatedly to select a specific value.
Figure 3-29: Viewing or selecting user filters
6. To save your changes, press the Menu/Enter key. To return to the main
screen or measurement screen, press Esc key repeatedly.
Setting Display options
Customizing measurement results on the display
Before you begin logging data, you can set different displays to view on the
instrument during your study. A One-Channel measurement view will always
appear on the display during run mode. You have the following optional
measurement screens to select: Spectrum (for 1/1 or 1/3 octave studies only),
Statistics (for sound measurement testing), Logger (Time history data), and 4view (4-channels on one screen).
1. From the main screen of the instrument, select the following menu options
by using the up/down arrows to highlight and press Menu/Enter key to
select: Display>Display Mode> Display Mode screen.
072-043 RevA
VI-410
52
Chapter 3 - Setting-up the VI-410
Customizing measurement results on the display
Display setup screen
Select measurement display
modes to appear
Figure 3-30: Defining what appears on the VI-410 screen during a
vibration study
2. In the Display mode screen, you have the following four selections:
A – spectrum example
C – logger example
B – statistics example
D – 4-channel measurement view
Figure 3-31: Setting Measurement results for VI-410
A. Spectrum example – this will appear if you activated 1/1 or 1/3 octave
studies (Note: this is an additional feature.)
B. Statistics example – this will appear only with sound measurement
testing.
C. Logger example – this will appear if the data from at least
one channel/one profile is logged and stored in the logger file.
072-043 RevA
VI-410
53
Chapter 3 - Setting-up the VI-410
Customizing measurement results on the display
✍
NOTE: If the logger position is switched on but
there was nothing stored in the logger’s file (when
selecting logged items in the Logger Setup screen
PEAK, P–P, MAX, RMS or VDV in the case of VM)
then the VI-410 will display NO RESULTS. For
more details on setting up these features, please
see “Saving logged items”, on page 33.
Figure 3-32: Logged items measurement screen – no results
message
D. 4-channel measurement view – Channels 1-4 (or x,y, z-axis and
sound channel will appear all on one screen). To view each channels
measurements, press and hold Altf while pressing right or left arrow.
To move to an alternative channel (or axis), press and hold Altf while
pressing up/down arrow. This will move you through the channel
selections.
3. Press
arrows to select one of the four display mode options and
press
arrow to activate (a checkmark appears) or de-activate (no
checkmark).
4. Press Menu/Enter key to save the settings. Press Esc key until you return
to the main screen.
072-043 RevA
VI-410
54
Chapter 3 - Setting-up the VI-410
Scale: changing graphical measurement results
Scale: changing graphical measurement results
As you are viewing vibration measurement results during run mode, the scale
can be modified to a linear scale or a logarithm scale that displays the
measurement results expressed in decibels. (The scale is applied to
measurement results for time history data (from the logger menu) and spectra
data (from the spectrum menu).) In this screen, you can also setting a zooming
feature referred to as “X-Zoom”. The X–ZOOM enables the user to change the
horizontal axis in the spectrum measurement results.
✍
NOTE: this feature only applies to vibration studies. To set vibration
mode, please follow this menu path: Input>Channels Setup>Channel x,
Mode (Mode field should display vibration).
To change, please see
section, “Changing channel settings”, on page 32.
¾ Menu path: Display >Display Setup> Display Scale
1. To change or view the display channel for each channel, turn the
instrument on and select the menu path indicated above by selecting:
•
Press and hold Altf key while pressing Menu/Enter key.
•
Arrow
to highlight Display and press Menu/Enter key.
•
Arrow
to Display Setup menu and press Menu/Enter key.
2. Select Channel 1, 2, 3, or 4 in the Display Setup screen.
•
Press
to select a channel and press Menu/Enter key.
3. Press Menu/Enter key to select Display Scale.
4. For the Scale field, press
to select either Linear (See “A”) or
Logarithm (See “B”).
A
B
Linear
scale
Logarithm
scale
Zoom
capability
Figure 3-33: Viewing or selecting scale options
5. If you selected Linear, you have one optional field to modify. (Please skip
to step 6 if you selected logarithm.)
•
To change the zooming function, press down arrow to select the field.
•
Press right arrow to increase the zoom and press the left arrow to
decrease the zoom.
072-043 RevA
VI-410
55
Chapter 3 - Setting-up the VI-410
Spectrum parameters
6. If you selected Logarithm, you have the following two options:
•
To change the dynamic (vertical axis) field, press the down arrow to
select the field and press right or left arrow to select specific range. (In
the case of the vertical axis field, the user can double, four times and
eight times expansion (as the default the vertical axis corresponds to
80 dB, after expansion it corresponds to 40 dB, 20 dB and 10 dB –
respectively.)
•
To change the x-zoon field, press the down arrow to select and press
right arrow to select the appropriate value. (This feature enables the
user to change the horizontal axis in the SPECTRUM presentation
mode.)
7. To change the other channel settings, repeat steps 2-6 and then proceed to
step 8.
8. To save your changes, press Menu/Enter key. To return to the main screen
or measurement screen, press Esc key repeatedly.
✍
NOTE: When you run a study, the following measurement scales will
display for vibration mode.
A
B
Figure 3-34: Example of scales for vibration mode
Spectrum parameters
For the spectrum display results, you can select vibration settings to appear as
Averaged, Instantaneous, Maximum, or Minimum with either acceleration,
velocity, or displacement as the type. For sound studies, RMS is the only
selection and Averaged, Instantaneous, Maximum, or Minimum are the
viewable selections. Below explains how to change the spectrum parameters.
¾ Menu path: Display >Display Setup> Select a channel>Spectrum View
1. To change or view the display channel for each channel, turn the
instrument on and select the menu path indicated above by selecting:
•
Press and hold Altf key while pressing Menu/Enter key.
•
Arrow
to highlight Display and press Menu/Enter key.
•
Arrow
to Display Setup menu and press Menu/Enter key.
2. Select Channel 1, 2, 3, or 4 in the Display Setup screen.
072-043 RevA
VI-410
56
Chapter 3 - Setting-up the VI-410
Spectrum parameters
•
Press
to select a channel and press Menu/Enter key.
Figure 3-35: Display setup screen
3. Press
arrows to select Spectrum View menu and press
Menu/Enter key.
✍
NOTE: if you selected channel 1, the screen will display “Spectrum View
(1)”. Thus, the menu will indicate which channel you selected proceeding
Spectrum View.
Spectrum View (1) – indicates channel 1
View – select appropriate measurement
Type – select acceleration, velocity, or displacement
Filter – select a filter if applicable
Figure 3-36: Spectrum channels screen
4. To change the Spectrum View screen, press one of the following:
•
To select a field, press
arrows. To change the field, press
arrow.
✍
NOTE: for vibration or sound filters, you have the option of setting up to
three profiles per channel. (denoted as “Vuser1” for vibration profile 1
results and “Suer1” for sound study profile 1 results.)
5. To change the other Channels’ display, repeat steps 2 – 4 and then
proceed to step 6.
6. To save your changes, press Menu/Enter key. To return to the main
screen or measurement screen, press Esc key repeatedly.
072-043 RevA
VI-410
57
Chapter 3 - Setting-up the VI-410
Selecting weighted filters for total values calculation
Selecting weighted filters for total values calculation
To select weighted filters for the total values calculation, ensure that 1/1 or 1/3
octave band is selected before proceeding. (See “Selecting 1/1 or 1/3 Octave Band
Analysis” on page 35 for details on activating.)
¾ Menu path: Display >Display Setup> select a channel>Total Values
1. To change or view the weighted filters, turn the instrument on and select
the menu path indicated above by selecting:
•
Press and hold Altf key while pressing Menu/Enter key.
•
Arrow
to highlight Display and press Menu/Enter key.
•
Arrow
to Display Setup menu and press Menu/Enter key.
2. Select Channel 1, 2, 3, or 4 in the Display Setup screen.
•
Press
to select a channel and press Menu/Enter key.
3. Press
arrows to select Total Values screen and press Menu/Enter
key.
4. To change the filter settings, do one of the following:
•
Press
arrows to select a Filter field.
•
Press
to select a weighted filter.
Filter – select up to 3 filters per channel. (Also
called 3 “profiles” per channel.)
Figure 3-37: Total Values channel filter screen
5. To apply a filter, Vuser 1, Vuser2, or Vuser3 can be selected by pressing
the right arrow repeatedly or the left arrow.
6. To select a type, press the down arrow to select this field. Press the right
or left arrows to select Acceleration, Velocity, or Displacement.
7. To add a calibration factor, press the up/down arrows to select the field and
pres the right or left arrows to increase/decrease the value.
Total Values Display Setup
This indicates multiple profiles per channel where “Total
Value 1” on channel 1 is the same as X-axis (if default of
channel setup was not modified).
Figure 3-38: Total Values weighted filter screen
072-043 RevA
VI-410
58
Chapter 3 - Setting-up the VI-410
Trigger setup options
8. To change the other channel’s weighted filters (for total values calculation),
please repeat steps 2-4 and then proceed to step 6.
9. To save your changes, press Menu/Enter key. To return to the main
screen or measurement screen, press Esc key repeatedly.
Trigger setup options
The trigger can be used to automatically start a study based on setting the
“Slope+ or Slope-”, “Level+ or Level-”, “Logger”, “Gradient”, or “RTC” settings.
Note: When activating the triggering mode for vibration level studies, the
“triggering signal” is the signal coming from the RMS detector of the first
channel.
Slope+ or SlopeWhen the Slope+ mode is selected, the measurement starts when the signal
increases past a specified signal source (i.e., vector value) and a specified
vibration value (referred to as the “level” field). It will continue to store
measurement values until the “run time” (also called integration time) is reached or
if you manually stop the study. The default for the “run time” value is set at 8
hours.
When the Slope- mode is selected, the measurement starts when the signal
decreases past a specified signal source and a specified vibration value and will
continue to store measurement values until run time is reached or if you manually
stop the study.
Level+ or LevelWhen the Level + mode is set, the triggering condition is checked each second; the
measurement is saved only when the signal is greater than the signal source level
and in any other cases the measurement result is not stored.
When the Level - mode is set, the triggering condition is checked each second; the
measurement is saved only when the signal is less than the signal source level and
in any other cases the measurement result is not stored.
Logger
In the logger trigger mode, a pre and post logging rate is specified. If the
logging rate is set at 15 second intervals for the pre and post intervals, for
example, the instrument will look at all the measurements and store only the
study time 15 seconds before and 15 seconds after the study.
072-043 RevA
VI-410
59
Chapter 3 - Setting-up the VI-410
Setting Trigger
Gradient
If GRAD + is selected, in each second of the measurement the triggering
condition is checked; the measurement is registered only when the signal has
the greater level than this determined in the level and the speed of the signal
changes is not less than that selected in the gradient. In the other case the
measurement result is skipped.
RTC
When Real Time Clock (RTC) is selected, the trigger condition is the time set
in the real time clock screen (see “real time clock” on page 26 for more details.)
The measurement is repeated when a time value is inputted in the RTC Step
field. The number of repetition is equal to the cycle number. (The default
setting is set to infinite. Please refer to menu path: Input>Measurement
Setup>Cycle Number for more details.)
✍
NOTE: Once the RTC triggers are setup, you must press the Start/Stop
key and the measurement will be triggered on time selected in
RTC START.
Setting Trigger
¾
Menu path: Input>Trigger Setup> Trigger Setup screen
1. To access the trigger screen, select the menu path indicated above by
selecting:
•
Press and hold Altf key while pressing Menu/Enter key.
•
Arrow
to highlight Input and press Menu/Enter key.
•
Arrow
key.
to highlight Trigger setup menu and press Menu/Enter
2. To activate the trigger setup screen, press the right arrow repeatedly until
the appropriate Trigger field is selected. (For information on these fields
see “Trigger setup options” above.)
3. Depending on your selection in step 2, please select one of the following
and then see step 8. :
•
To setup Slope or Level triggers, please see step 4.
•
To setup Data Logging triggers, please see step 5.
•
To setup Gradient triggers, please see step 6.
•
To setup Real Time Clock triggers, please see step 7.
072-043 RevA
VI-410
60
Chapter 3 - Setting-up the VI-410
Setting Trigger
4. If Slope or Level is selected as the trigger field, you will want to select a
source, a channel, level, and the vector level. To select one of the fields,
press
. To change the parameters in the fields, press repeatedly
until one of the selections is chosen.
•
Source field – with the source field there are four options: RMS (1),
Vector and Sound (VEC/SND), Vector, and EXT. IO (for Slope+/- only).
(Please see “Glossary” for details.)
•
Channel field – select channel 1, 2, 3, or 4. (NOTE: if you did not change
the default settings, Channels 1-4 correspond with x, y, and z-axes and
channel 4 is setup for sound measurements.)
•
Level field – depending on if you are selecting vibration or sound the level
field is selectable as m/s2 or dB. To increase in large increments, press
and hold Altf with either the right or left arrow. Or press right/left arrow to
increase/decrease the value.
Level+ for
trigger mode
Slope+ for trigger
Level
Figure 3-39: Level + and Slope+ for trigger modes
✍
NOTE: The Level value (see Level field above) of the triggering signal refers to
the instantaneous value of the RMS result from the first profile in selected
channel calculated during the period depending on selected “detector” (also
called “response time”. Please refer to Changing channel settings on page 32.)
5. If Logger is selected as the trigger field, you will want to select a source, a
channel, level, and pre/post settings (if applicable). To select one of the
fields, press
. To change the parameters in the fields, press
repeatedly until one of the selections is chosen.
072-043 RevA
•
Source field – with the source field there are four options: RMS (1),
Vector and Sound (VEC/SND), Vector, and an HZ value. (Please see
“Glossary” for details.)
•
Channel field – select channel 1, 2, 3, or 4
•
Level field– to increase/decrease level field, press right or left arrow.
To increase/decrease in large increments, press and hold Altf while
pressing the right/left arrow.
VI-410
61
Chapter 3 - Setting-up the VI-410
Setting Trigger
•
Pre/Post fields – with the “pre” field, the number of the results saved
in the logger’s file before the fulfillment of the triggering condition can
be set with a numeric value. With the “post” field, the user can set the
number of the results registered in the logger’s file after the fulfillment
of the triggering condition.
Figure 3-40: Logger trigger mode
6. If Gradient is selected as the trigger field, you will want to select a source,
a channel, level, and a gradient value. To select one of the fields,
press
. To change the parameters in the fields, press
repeatedly
until one of the selections is chosen.
•
•
•
•
Source field – with the source field there are four options: RMS (1),
Vector and Sound (VEC/SND), Vector, and an HZ value. (Please see
“Glossary” for details.)
Channel field - select channel 1, 2, 3, or 4
Level field– to increase/decrease level field, press right or left arrow.
To increase/decrease in large increments, press and hold Altf while
pressing the right or left arrow.
Gradient – select a value for the gradient trigger.
Speed of triggering signal
Figure 3-41: Logger trigger mode
7. Once RTC is selected as the trigger field, you will want to select a RTC
start time and the logging rate (called “RTC Step”). To select one of the
fields, press
. To change the parameters in the fields, press
repeatedly until one of the selections is chosen. The confirmation of the
selection requires pressing the Enter key, which simultaneously closes the
sub-list. In order to activate waiting for trigger time the user has to press the
Start key.
•
072-043 RevA
RTC Start field– select a start time based on the current time in the
RTC of the instrument.
VI-410
62
Chapter 3 - Setting-up the VI-410
Metric or non-metric settings
RTC Step- select a data logging time based on the RTC of the
instrument.
8. Once the trigger setup screen has been setup, press the Enter key to save
your settings. Repeatedly press Esc to return to the main menu or
measurement screen
•
Metric or non-metric settings
With the vibration units screen, you have the option of selecting metric (e.g.
m/s2, m/s, m etc.) or non-metric measurements (e.g. g, ips, mil etc.) for your
studies.
¾
Menu path: Setup>Vibration units
1. To access the vibration units screen, select the menu path indicated above
by selecting:
•
Press and hold Altf key while pressing Menu/Enter key.
✍
•
Arrow
to highlight Input and press Menu/Enter key.
•
Arrow
key.
to highlight Vibration units menu and press Menu/Enter
NOTE: in the vibration units screen, the asterisk indicates which field is
selected. The default is “metric”.
2. To change the settings, press
to highlight the field you wish to
change. (For example, if you wish to set the VI-410 to non-metric, first
select this field. Then press right arrow until an asterisk appears.)
Figure 3-42: Metric/Non-Metric settings
3. Press
to select either metric/non-metric field.
4. To save the changes, press the Menu/Enter key. To return to the main
screen or measurement screen, repeatedly press Esc key.
072-043 RevA
VI-410
63
Chapter 3 - Setting-up the VI-410
Setting up external input/output connections
Setting up external input/output connections
External I/O refers to external device connections. This feature enables a user
to connect the VI-410 to another device. On this socket, the signal from the
input or output of the analogue / digital converter (before the correction) is
available. This signal can be registered using the magnetic recorder, can be
observed on the oscilloscope or can be used for triggering measurements. It is
possible to select three different modes: Analog, Digital In, and Digital Out.
¾ Menu path: Setup>Ext. I/O Setup
1. To access the External device connections screen, select the menu path
indicated above by selecting:
•
Press and hold Altf key while pressing Menu/Enter key.
•
Arrow
to highlight Setup and press Menu/Enter key.
•
Arrow
key.
to highlight Ext. I/O Setup menu and press Menu/Enter
2. There are three mode functions:
•
Digital In - The meter is connected to the output device, which triggers
it. The measurements are started, when on this input there is a
triggering impulse. In this mode the instrument works in Ext. Triggers
function.
072-043 RevA
•
Digital Out - The meter is connected to the output device, which has to
be triggered. In this mode the instrument works in Trigger pulse
function (with positive or negative polarization) or alarm pulse
function (with low or high active level). This mode is especially useful
in the multi-channel, simultaneous, synchronized measurements.
•
Analog – In the Analog mode, the meter can send signals to the output
device. For example, the signal can be observed on the oscilloscope
from the selected Channel. The user has the opportunity to choose
between Channel 1, 2, 3, or 4.
VI-410
64
Chapter 4 - Setting-up the VI-410
3. To change the Mode, Function, or Channel fields, press
to highlight
the field you wish to change. Then press the right arrow repeatedly until
the appropriate value is displayed.
•
The figure below displays some of the output selections including
digital output (A), digital input (B), and analog (C).
A
B
C
Figure 3-43: Logger trigger
4. To save your changes, press Menu/Enter key. To return to the main menu,
press Esc continuously until you are at the menu screen or the
measurement screen
Auto on features
The Auto on or “Timer” feature enables you to program the VI-410 to start a test
on a specific day, a specific time, and with an optional repeat time feature.
Below explains how to setup the parameters.
1.
To access the main menu, press and hold Atlf and press Menu/Enter
key.
2.
Press
arrows to select Setup and press Menu/Enter key.
3.
Press
arrows to select Timer and press Menu/Enter key. (The
timer window will open.)
4.
To set the fields, press
arrows to select a field and press right/left
arrows to change the value of the fields.
5.
Press Menu/Enter key to save your setting. Press Esc repeatedly to
return to the main menu.
“Single” indicates the timer will only
run once. “Regular” indicates the
instrument will repeat and run in 24
hours.
Figure 3-44: Auto on screen
✍ NOTE: once activated, a flashing timer (or clock) icon will appear at the top
of your screen.
072-043 RevA
VI-410
CHAPTER
65
4
Chapter 4 - Calibration
Calibration
Before beginning your vibration or sound studies, a pre-calibration is
recommended as well as a post-calibration on each channel following your
study.
Why should you perform a pre and post calibration? The instrument can be
affected by changes in altitude, barometric pressure, and humidity. Depending
on where the VI-410 is stored and where you take the measurements, these
factors can change the instrument’s readings. When you are finished with your
studies, it is important to quickly re-calibrate incase the instrument was
mishandled or any changes in temperature, altitude, or barometric pressure
changed.
For human vibration studies, you calibrate each channel in the field with a
calibrated vibration source. An optional hand-held shaker calibrator may be
included in your start-up kit. This calibrator will be explained in the “conducting
a vibration calibration” section.
For sound studies, a sound calibrator is used to detect a fixed frequency and
sound level. An explanation and diagram will detail how to perform a pre a post
sound calibrator test in “conducting a sound calibration” section.
Performing a field vibration calibration
On the VI-410, there are two methods to calibrate.
•
By measurement - this entails connecting a calibrator to the VI-410 and
turning it on for the output to stabilize. Once the desired frequency and
amplitude has been reached, this is entered into the meter (or in QSP-II).
•
By sensitivity - the process of verifying the instrument’s calibrated
measurement indicated on the instrument’s certification papers. (Typically,
the instrument is calibrated before it is shipped.)
072-043 RevA
VI-410
66
Chapter 4 - Calibration
Conducting a vibration calibration for VLM
Conducting a vibration calibration for VLM
On a handheld Shaker Calibrator, this produces a known vibration acceleration
rate and frequency. By connecting the accelerometer to the calibrator and then
to the VI-410, you can verify and adjust calibration while you are in the field.
Each channel (or axis) should be calibrated in order to meet the appropriate
standards.
Assembly for Channel 3 (or Z axis)
1. Attach the accelerometer to the calibrator. Ensure the threaded pin is
inserted into the calibrator first before attaching this to the accelerometer.
Attach the accelerometer
to the calibrator by twisting
it on until it fits snuggly.
Figure 4-1: Attaching accelerometer to calibrator
2. Attach the accelerometer cable to the accelerometer and then to the
instrument.
Figure 4-2: Attaching accelerometer cable to instrument
Assembly for Channels 1-2 (or X and Y axes)
The steps are similar to calibrating the z-axis; however, instead of threading the
accelerometer on the top of the shaker, the threaded screw on top of the
calibrator is removed. A small piece of beeswax is then positioned firmly in its
place. The accelerometer is positioned in accordance with ISO standards for
the X and Y axis (as displayed in Figure 4-3) in relation to the calibrator. Then,
the cable is connected to the accelerometer.
072-043 RevA
VI-410
67
Chapter 4 - Calibration
Conducting a vibration calibration for VLM
Figure 4-3: HAV vector coordinates in accordance with ISO standards
Running a vibration calibration
Once you have assembled the devices together you are ready to run a
calibration test.
¾ Menu path: Function>Calibration> >Channel 1, 2, 3, or 4 >By
Measurement>Calibration
1. Connect the calibrator and accelerometer to the VI-410 (as explained
above in “Conducting a vibration calibration”).
2. Turn on the VI-410 by pressing Proceed/Pause key and Menu/Enter key.
3. Select the following menu path:
Press Altf key while pressing Menu/Enter key to access main menu.
The Function menu should be selected (if not press up/down arrow
until selected). Next, press Menu/Enter key.
•
Arrow
to Calibration sub-menu and press Menu/Enter key.
Arrow
and select either channel 1, channel 2, or channel 3.
Arrow
to By Measurement and press Menu/Enter key.
The calibrator level screen will appear (see Figure 4-4).
Adjust the Calibrator level screen to 9.89 (or the appropriate setting on
your calibrator).
•
To adjust the cal level, press the right arrow. To move up by ten
increments, simultaneously press right arrow and Altf key.
•
•
4.
5.
6.
7.
Cal. Level (4)
Indicates you are calibrating for Channel 4.
2
Adjust the Cal. Level to 9.89m/s
Figure 4-4: Example of calibration screen for vibration study
072-043 RevA
VI-410
68
Chapter 4 - Calibration
Calibrating by certificate on VI-410
8. Turn on the calibrator.
9. Start the VI-410 by pressing Start/Stop key.
The meter will flash “Calibration” with a 5 second delay countdown,
then “Calibration Measure”, and then display “Calibration Result”.
10. Once the Calibration Result is displayed, press the Menu/Enter key to
store the new calibration level.
•
✍
NOTE: the “Calibration result” is displayed as the RMS value for the
channel you selected (such as channel 1).
11. To calibrate each of the axes (or channels) for vibration study, press Esc
twice until you return to the Channel selection screen and then repeat steps
4-10.
12. Once all channels are calibrated, press Esc key repeatedly to return to the
main menu or the measurement menu.
✍
NOTE: It is recommended to repeat the calibration measurement few times.
The obtained results should be almost the same (with ±0.1 dB difference). The
reasons for the unstable results are as follows: the calibrator is not properly
attached to the instrument, there are external disturbances, or the calibrator or
the measurement channel (the microphone, the preamplifier or the instrument
itself) are damaged.
Calibrating by certificate on VI-410
It is recommended to calibrate by taking measurement with a field calibrator for
accurate onsite readings, which was discussed above in “Running a vibration
calibration.”
You also can send the VI-410 to Quest Technologies for factory calibration to
ensure the instrument is setup correctly with the appropriate calibration.
Your third option is to calibrate the instrument by inputting values from the
instrument’s calibration card/certificate. This is completed by following the
steps below.
072-043 RevA
VI-410
69
Chapter 4 - Calibration
Calibrating by certificate on VI-410
¾
Main Menu path: Function>Calibration>Channel X >By Sensitivity
>Sensitivity screen
1. Select the menu path indicated by following these steps:
To access the main menu, press Altf key while pressing Menu/Enter
key.
•
Select Function menu by pressing
and press Menu/Enter key.
•
Press
and select Calibration. Press Menu/Enter key.
2. Press
to select the appropriate Channel and press Menu/Enter
key.
3. Press
to select By Sensitivity and press Menu/Enter key.
•
4. In the Calibration sensitivity screen, you can manually input a calibration
reading. Press the left or right arrows to increase or decrease the current
measurement setting. Press the Menu/Enter key to save your new setting.
A
By Sensitivity (1):
Increase or decrease the
calibration value by
pressing the right or left
arrow.
Figure 4-5: Calibration by sensitivity
5. Press Esc twice and select the next channel (i.e., channel 2). Repeat
steps 2-4 until each channel is re- calibrated.
6. When complete, press Esc until you return to the main menu screen or
measurement screen.
Calibrating by certificate using QSP-II
You can also adjust the calibration factor by entering in the appropriate “g”
reading and plug this into QSP-II. Then, it will automatically calculate the
calibration factor.
¾
1.
2.
3.
072-043 RevA
Adjusting calibration in QSP-II
In QSP-II, ensure you are on the VI-410’s window.
Select Setup key.
On each channel, modify or verify the appropriate setting (see Figure 4-5
for an explanation)
VI-410
70
Chapter 4 - Calibration
Attaching calibrator for a sound study
Enter in sensitivity value
Channel tabs
Select
appropriate
channel
Press recalculate and QSPII will update the calibration
factor
Figure 4-6: Example of setting calibration by sensitivity in QSP-II
4. To save, press Save As key and name the new setting.
5. To send to the instrument, ensure the VI-410 is connected via a USB cable
to your pc. Press the “Send to Instrument” key.
Performing field calibration for sound
For a sound study, a pre and post calibration is recommended. To ensure that
your microphone is functioning within normal tolerance limits, return it to the
factory periodically for a factory recalibration.
This section explains to verify measurement calibration as part of your normal
operating procedures.
Attaching calibrator for a sound study
The steps below outline how to attach a calibrator for a sound level study. For
demonstration purposes, Quest Technologies Inc’s QC10/20 Type 2 calibrator
is used in the diagrams below.
1. Prepare the meter for a sound study.
a. Ensure that channel 4 has been setup for sound (See “Setting up a
sound study” in Chapter 8.)
b. Attach the preamp and microphone to the VI-410 (See “Physical
setup”).
072-043 RevA
VI-410
71
Chapter 4 - Calibration
Attaching calibrator for a sound study
2. Taking the calibrator adapter, slide this into the top of the calibrator.
Calibrator adapter
Calibrator
Figure 4-7: Connecting the calibrator and calibrator adapter
3. Next, taking the assembled calibrator, slide this into the microphone.
Preamp with mic. attached
Figure 4-8: Attaching calibrator, preamp, and mic to VI-410
Running a sound calibration
¾
Menu path: Function>Calibration> >Channel x >By Measurement
6. Attach the calibrator to the VI-410 (as illustrated above).
7. Select the menu path by:
•
To access the main menu, press Altf key while pressing Menu/Enter
key.
•
Select Function menu by pressing
and press Menu/Enter key.
•
Press
and select Calibration. Press Menu/Enter key.
•
•
072-043 RevA
Press
to select the Channel designated for sound (the default is
Channel 1) and press Menu/Enter key.
Press
to select By Measurement and press Menu/Enter key
VI-410
72
Chapter 4 - Calibration
Attaching calibrator for a sound study
Figure 4-9: Calibration by Measurement for Channel 4
2.
In the calibration level screen, adjust the Calibrator level (4) to 114db (or
the appropriate setting on your calibrator).
•
To adjust the cal level, press the right arrow. To move up by ten
increments, simultaneously press right arrow and Altf .
Cal. Level (4)
Adjust the cal. Level to 114db
Figure 4-10: Example of calibration screen for sound study
3. Turn on the calibrator.
4. Start the VI-410 by pressing Start/Stop key.
•
The meter will flash “Calibration” with a 5-second delay countdown.
•
It will then flash “Calibration Measure” with a LEQ measurement and a
value.
•
Once completed, it will display “Calibration Result” with a LEQ result
value.
5. Once the calibration result is displayed, press the Menu/Enter key to store
the new calibration level.
a. NOTE: the “Calibration result” is the calibrator factor in LEQ
measurement value.
6. To verify the calibration level, continue to press the escape key until you
return to the main display.
•
If you are not on channel 4, press the up arrow until channel 4 is
displayed.
7. Press the start/stop key to run a study. The meter should be within ±0.1 dB
difference of the calibrated level.
072-043 RevA
VI-410
73
Chapter 4 - Calibration
Calibration History
Viewing last calibration
Calibration History
In calibration history screen, you can view up to 10 last calibration records.
¾
To access the calibration history screen, follow below:
Menu path: Function>Calibration> >Channel x >Calibration history
Figure 4-11: Calibration history screens
1. Select the Calibration history screen.
•
To access the main menu, press Altf key while pressing Menu/Enter
key.
•
Select Function menu by pressing
and press Menu/Enter key.
•
Press
and select Calibration. Press Menu/Enter key.
Press
to select the appropriate channel and press Menu/Enter
key.
•
Press
to select By Calibration History and press Menu/Enter
key.
2. The opened Calibration history screen contains a list of last calibration
records. Each calibration is described by the method of how it was
performed either by sensitivity or by measurement. It includes the date and
time of the performed calibration measurement, the obtained calibration
factor, and the calibration result.
•
Figure 4-12: Calibration history with previous 2 cal. records
✍ NOTE: if calibration measurements were not performed (such as channel 4
for sound studies), a calibration history screen appears stating “calibration
history is empty”.
072-043 RevA
VI-410
74
Chapter 4 - Calibration
This page left blank intentionally
072-043 RevA
VI-410
75 Chapter 5 - Running Measurements
About Vibration
CHAPTER
5
Running Measurements
Assuming you are acquainted with the VI-410’s physical features (chapter 2),
have customized your setup (see chapters 3) features, and calibrated your
instrument (see chapter 4), you are now ready to run your measurements
This chapter will explain placing the VI-410 in your environment, and then guide
you through running and viewing your results.
•
Overview of vibration and overview of taking measurements
•
Understanding Measurement results - brief explanation of a onemeasurement view, four-channel measurement view and an
explanation of screen icons/indicators.
•
A demonstration of hand-arm vibration study and a demonstration of
whole-body vibration study
•
How to mount and place the transducer (also called accelerometer) to
the object/machine
•
Steps on running a logging session
•
Steps on how to run a study, pause a study, and run another study
(trigger on/trigger off).
About Vibration
Vibration measurement is determined by the amplitude (or magnitude) of the
source, frequency, and the duration and direction of the oscillating source.
The Amplitude (or magnitude) is measured by a constantly changing weighted
signal from the accelerometer to the vibration meter and it converts the logged
data into an “average” value at a fixed frequency, typically once per second.
This “average” is actually computed as the square root of the average (mean)
of the squares of the vibration samples and is called RMS. According to the
standards boards, such as ISO and ANSI, the RMS is a useful value because it
demonstrates the overall vibration damage potential.
072-043 RevA
VI-410
76 Chapter 5 - Running Measurements
Taking Measurements
Taking Measurements
Depending on how the vibration is affecting the human body, this resonance
frequency is analyzed in various measurements. Peak-to-Peak measurement
and Peak measurements are also highly valued measurements. The figure
below displays two types of human vibration. The harmonic, also called
periodic, is vibration that is made up of continuous exposure elements.
Random vibration does not repeat itself so in the case of a compactor on a
construction site hitting pot holes in a dirt road, this would be an example of
random vibration.
Peak level
RMS level
Time
Peak to Peak
Time
Average
level
Figure 5-1: Harmonic vibration
Example of time history measurements: Peak level of vibration, Peak to
Peak level, and RMS level which demonstrates the Average level and Time
to calculate RMS level.
RMS level
Figure 5-2: Random Vibration (from a circular saw study)
Illustrated is the RMS Level (3.86 m/s2)
072-043 RevA
VI-410
77
Chapter 5- Running Measurements
Demonstration of HAV study
Demonstration of HAV study
Figure 5-3 demonstrates a hand arm vibration study. The VI-410 is connected
with to a tranducer by a clamp mounting device as displayed below.
Example of a Accelerometer
Example of clamp mounting device
The tranducer (also referred to as an accelerometer) measures the acceleration
rate of the vibration. When the study begins, the VI-410 is turned to the “Start”
position and the hand-held tool is turned to the “On” position. The VI-410 will
calculate and store the measurements from the worker using the drill. The type
of measurements and filters are selected during the setup phase. While you
are running your study, you can view the measurements on the VI-410 display
screen. You can also use the up/down arrows and left/right arrows on the
keypad to select different views. After the logged session, the results can be
viewed on the instrument or uploaded to QuestSuite Professional II and viewed
on your computer.
Transducer
mounted with a
clamping device to
hand-tool to
measure vibration
Cable
VI-410
Figure 5-3: Example of how to conduct HAV study
072-043 RevA
VI-410
78
Chapter 5: Viewing saved measurements on VI-410
Placement of accelerometer for HAV
Placement of accelerometer for HAV
In figure 5-3, notice the placement of the accelerometer to the clamping device.
In order to gather accurate vibration readings, the accelerometer should be
placed as close as possible to where the worker holds the tool without
hindering his/her safety or interfering with his/her work. The accelerometer and
mounting device should be tightened snugly to the tool; so, you obtain accurate
readings when running your vibration session.
In chapter 1, we discussed the direction of measurement for HAV (see figure 11 for reference). As you are measuring vibration, ensure the accelerometer is
placed in the appropriate direction in accordance with the ISO standards (see
Figure 1-1).
Attaching the accelerometer for HAV study
Depending on which device you ordered, the mounting of the accelerometer is
a couple easy steps.
Mounting block and hose clamp scenario
¾ How to attach the accelerometer to the device for vibration study?
1. Place the screw inside the mounting block.
2. Take the accelerometer (which has a female thread) and twist this into the
screw (male thread) on the mounting block using the hex-driver tool (see
illustration below)
Accelerometer
Mounting block
and screw
Hex-driver tool
Figure 5-4: Attaching mounting block to accelerometer
072-043 RevA
VI-410
79
Chapter 5: Viewing saved measurements on VI-410
Attaching the accelerometer for HAV study
3. Slide the attached accelerometer with the mounting block onto the
hose clamp. The beveled side must be turned toward inside of clamp
so beveled side will clamp directly to the hand-held tool.
Beveled side facing
towards inside of clamp
Figure 5-5: slide mounting block and accelerometer on hose clamp
4. Fasten the accelerometer oriented in accordance to the x, y, z-axis if
you are concerned with engineering controls. If your study is for health
and safety monitoring the standards prescribe the use vector sum on
the dominant axis (which calculates the tri-axial average) and the
orientation of the accelerometer is not of a concern.
5. Slide the clamp hose around the hand-held tool and securely tighten
the screw with a screw driver.
Tightening screw
Figure 5-6: Tighten hose clamp and accelerometer to tool
072-043 RevA
VI-410
80
Chapter 5: Viewing saved measurements on VI-410
Attaching the accelerometer for HAV study
6. Attach the accelerometer cable to the VI-410 (ensure the red dot on the
cable lines up with the red dot on the VI-410) and then to the hand-held
tool.
1. Attach
accelerometer
cable to instrument
2. Attach
accelerometer
cable to handheld tool
Figure 5-7: Attach accelerometer cable to VI-410 then to
accelerometer
•
You are now ready to start taking measurements. (See section
below “Start and stop your study” for more details.)
Demonstration WBV study
Figure 5-9 demonstrates a whole body vibration study inside an opeartors
heavy equipment machine. In the cab, the VI-410 is connected to a seat-pad
transducer which is displayed below.
Example of a seat-pad accelerometer
Figure 5-8: Seat-pad accelerometer
072-043 RevA
VI-410
81
Chapter 5: Viewing saved measurements on VI-410
Placement of Transducer for WBV
The tranducer (also referred to as an accelerometer) measures the acceleration
rate of the vibration. When the study
begins, the VI-410 is turned to the “Start”
position and the operator in the machine
continues his/her normal operation of the
heavy equipment machine. The VI-410
will calculate and store the vibration
measurements while he/she is working.
The type of measurements and filters are
selected during the setup phase. After the logged session, the results can be
viewed on the instrument or uploaded to QuestSuite Professional II and viewed
on your computer.
VI-410 mounted in cab
Seat-pad transducer
Figure 5-9: WBV example inside cab of heavy equipment machine
Placement of Transducer for WBV
In the middle of the seat-pad acceleromeeter, a label indicates the x-axis, yaxis, and z-axis. The placement of the accelerometer should be placed parallel
to the ISO standards defined in Chapter 1 as “direction of measurement for
WBV”, on page 5.
Attaching the accelerometer for WBV study
For Whole body vibration study, there are two quick steps to follow.
1. Place the seat-pad accelerometer on the seat. Ensure the positioning of
the x-axis, y-axis, and z-axis is appropriate to ISO direction standards.
072-043 RevA
VI-410
82
Chapter 5: Viewing saved measurements on VI-410
Start and Stop your study
2. Plug the cable from the seat-pad into the VI-410. (Example: mount the VI410 to something stable inside the machine.)
a. You are now ready to start taking measurements.
Measuring
Start and Stop your study
By this point, you should have a good understanding of the setup features you
programmed into the instrument as well as how to read the VI-410 during your
study. The following details the couple of steps to start and stop your study.
¾
1.
2.
Starting and stopping
Turn on the VI-410 by simultaneously pressing the Proceed/Pause key and
Start/Stop key.
Press the Start/Stop key to enable the “run mode”. The run indicator will
appear along with a measurement value.
Run indicator
Figure 5-10: Vibration level run mode screen
a.
b.
c.
3.
Press the right/left arrows to view various measurement results.
Press the up/down arrows to view 4-channel measurement view.
If you enabled spectrum and/or plot mode press the up/down arrow again,
and these graphical views of the measurements will appear.
To stop your study, press the Start/Stop key again.
a. You can now download (or export) the data to QSP-II or view the results on
the VI-410. (See the Chapter 6 for details on viewing results on the VI-410
and Chapter 9 for details on QSP-II results.)
Start, Pause, and Stop your study
Some studies for human vibration are conducted by starting a study and then
pausing while the hand-tool or machine is turned on or off. In these types of “trigger
on” “trigger off” examples, the start and pause is used and saved as “studies” in
QSP-II. If Start/Pause is pressed again and proceeded by a Stop, the summary of
the Start to Stop data is stored as a “session” in QSP-II. Please see Chapter 9,
“Downloading”, for more details.
072-043 RevA
VI-410
83
Chapter 5: Viewing saved measurements on VI-410
1-channel measurement view
¾ Using Pause mode during a study
1. Turn on the VI-410 by simultaneously pressing the Proceed/Pause key
and Start/Stop key.
2. Press the Start/Stop key to run the study.
3. To Pause your study, press the Proceed/Pause key. The Run indicator
will flash in the pause mode. To resume, simultaneously press Altf and
Proceed/Pause key.
4. To stop the study, press the Start/Stop key again. (It will state that it is
saving the file.)
✍
NOTE: You will want to run your study for at least the duration of your log
rate time (this was selected during your setup. The default is set to one
minute.) To view this setting in QSP-II, look under the Global tab in the
Settings screen. The log rate field indicates your minimal time to log a
vibration measurement.
• On the VI-410, select to the following menu path: Input>Measure Setup>
in the Measure setup screen. The “Logger” feature indicates the amount
of time. (i.e., 1m indicates 1 minute).
Viewing measurement results
After you have stopped your data logging, the measurement results will
automatically appear as your primary display.
✍
NOTE: depending on which displays you selected in Chapter 3, “Setting
display options”, on page 51, the following views may/may not appear.
1-channel measurement view
One channel measurement view will automatically display as you are taking
measurements. You can page through this “one channel measurement
view”, by clicking the right/left arrows.
072-043 RevA
VI-410
84
Chapter 5- Running Measurements
Navigating
Navigating
While in run mode, you can view your measurement results in a “one view”
measurement screen. The figure below displays an RMS value of 158mg on
Channel 1 and profile 1 with HP1 weighed filter. This is displayed as C1P1 on
the instrument and represents the x-axis. (See Table 2-1, “Startup screen
defined” on page 16 for more details.)
a. Icon indicators – computer power & run mode
b. Measurement settings- RMS value with 1-second
logging and HP1 filter
c. Run Time of study
d. Channel 1/Profile 1 (X-axis results)
Figure 5-11: Example of taking measurements in one measurement view
¾ Navigating one measurement view
1. Press the left/right arrow to view the current channels measurement.
2. To view another channel measurements (i.e., channel 2’s RMS value)
simultaneously press Altf and down arrow or Press Altf and up arrow.
Continue to press right or left arrow to view all measurement results for
the selected channel. (Repeat this step in order to view all the channels.)
4-channels measurement view
On the VI-410, you can view up to four channels simultaneously while in run
mode, pause mode, or stop mode. This view is selectable via the Display setup
menu and can be turned on or off. (See, “Customizing measurement results on
the display” on page 51.)
¾ How to view four channel measurements on one display
1. To change the measurement view while in run mode (or when viewing past
studies) press the down arrow until the 4-channel measurement screen
appears.
2. To view all measurement results on a specific channel, first select a
channel by pressing and holding Altf while pressing either the up or down
arrow.
072-043 RevA
VI-410
85
Chapter 5- Running Measurements
Spectrum view
3.
Then press right or left arrow to move (or toggle) through the results. (Repeat
step 2 and 3 to view alternative channels.) (See Table 5-1 for details).
11 (x-axis)
Indicates channel1/
profile 1 (or x-axis)
RMS and measurement results for
4 channels (x, y, z-axes and slm
channel)
Figure 5-12: Four-channels measurement results screen
Four channel screen view
Explanation
A. Channel indicator
“11” - channel indicator references the first position
“1” as channel 1(or x-axis). The second position “1”
is referenced as profile 1. (Note: if you created more
than one profile per channel, it would also display all
the profiles for each channel.
RMS is the calculation based on the root mean
square (computes the average). The measurement
type will cycle through: RMS, VDV (vibration dose
value), VEC (vector) , CRF (crest factor), Peak, P-P
(peak-to-peak), MTVV (maximum transient vibration
value) (See glossary of terms for definitions.)
Indicates the amount of vibration based on the
measurement type.
B. Measurement type
C. Measurement Calculation
Table 5-1: Four-channels measurement results screen explained
Spectrum view
This will appear if 1/1 or 1/3 octave measurement was activated during setup.
(Please see “Selecting 1/1 or 1/3 octave band analysis” on page 35 for more
information.) NOTE: When viewing graphical data, simultaneously press Altf and
down arrow and the bars will increase on the display.
¾
To view, press the up or down arrow continuously until the spectrum view
appears (see example below).
To view different measurements across the bands,
press the right arrow to move right or vice/versa.
Figure 5-13: Spectrum view
072-043 RevA
VI-410
86
Chapter 5: Viewing saved measurements on VI-410
Statistics view
Statistics view
The statistics view will only appear with sound measurement testing.
¾
To view, press the up or down arrow continuously until the statistics view
appears (see example below).
Sound channel measurement results
Figure 5-14: Statistics view
Logger View
Logged data will appear if selected during your setup. There are up to 4
measurement results which could appear in this view which are: Lpk, P-P,
Lmax, RMS. (For more information, please see “Saving logged items, on
page 33.)
¾
To view, press the up or down arrow continuously until the logger view
appears (see example below).
Channel 1 (x-axis) Peak measurement results:
2
83.2 mm/s
Figure 5-15: Logger view
Viewing filter analysis data during your study
If you enabled 1/1 or 1/3 octave filter (see “Measurement Parameters” above in this
chapter to enable/disable.), you can view these parameters in two different bar
graphs depending on how you setup the display mode on the instrument. The
following is a walk through on customizing the display mode while running sessions.
✍ NOTE: if you plan to view the results after the study with QSP-II software,
please see the next chapter “Taking Measurements”.
072-043 RevA
VI-410
87
Chapter 5: Viewing saved measurements on VI-410
Battery indicator
Screen icons
The VI-410 is equipped with several display or screen icons, which will appear
under specific operating conditions. The following is a summary of all
indicators/icons that appear on the top of the display. These include “Battery”,
“Computer”, “Antenna” (“Tree”), “Loudspeaker”, “Envelope”, “Bell”, “Timer” and
“Arrows”).
Screen indicators
Figure 5-16 Display with all screen indicators
Battery indicator
The battery indicator/icon is displayed when the instrument is powered from
internal batteries. (If externally powered, no battery indicator will appear.) The
icon indicates the battery power (If three bars appear, this represents a fullypowered instrument, two bars indicates half the battery life, and one bar
indicates a quarter of the battery life.)
✍
NOTE: When voltage of batteries is too low, the icon will flash. It is highly
recommended to plug in an external power cord (USB cable) or insert new
batteries. If the instrument is powered off, the last setup is stored and it will
appear when the instrument is powered back on.
Figure 5-17: Battery indicator
072-043 RevA
VI-410
88
Chapter 5- Running Measurements
Computer indicator
Computer indicator
The computer indicator is displayed when there is a USB connection with the PC.
The computer indicator/icon will flash during RT (Real-Time) transmission.
Figure 5-18: Battery indicator
Antenna indicator
The antenna ( or Tree) indicator is displayed in a flashing mode together with the
loudspeaker when the measurement is started, the trigger is switched on and the
level of the signal is too low to start the registration.
Figure 5-19: “Antenna” (“Tree”) indicator
Loudspeaker indicator
The loudspeaker indicator is displayed when the measurement is started (or in
“run mode”) and executed. If a line appears through the loudspeaker, this
means the measurement is paused (Pause).
Figure 5-20: Run mode icon (or loudspeaker icon)
072-043 RevA
VI-410
89
Chapter 5- Running Measurements
Envelope indicator
Envelope indicator
The envelope indicator is presented together with the loudspeaker when the
current measurement results are logged in the instrument’s logger file (or data
logged files).
✍ NOTE: If the envelope starts flashing, this indicates that the memory is full.
In order to save the current data, you will have to free up space. (Please
access the following menu path and delete some of the “logger files”: Menu
Path: Menu>File>Defragmentation>Logger defragmentation)
a) b)
Figure 5-21: Display with “Envelope” (a) and “Bell” (b) icons
Bell (overload) Indicator
A Bell indicator is displayed when an overload has taken place during the last
measurement cycle (the icon is displayed also after the measurement and after
loading the file with the overloaded results).
Timer indicator
If the Timer mode was used to start a measurement, it will appear on the top of
the display. If the Timer indicator appears flashing, this represents that the
instrument’s timer is switched on and the instrument is waiting for the set time
of measurement criteria.
A
B
Figure 5-22: Display with Timer (A) and Arrow (B) icons
072-043 RevA
VI-410
90
Chapter 5- Running Measurements
Arrow Indicator
Arrow Indicator
Arrows will flash after pressing the Altf key when the 2nd Function
is selected in the Altf mode (Menu Path: Menu>Setup>Altf mode>Altf>2nd
FUN). This indicates that other push-keys have second or third meaning (For
example, you may have changed the keypad settings for the Altf key. If this is
the case, the arrows will flash when the new keys are pressed.)
Underrange
In the case of a sound test when the level of the measured signal is too low in
relation to the measuring range (when the level of the input signal is under the
linearity of the range declared in App. C, called “Underrange”) a vertical arrow
will appear in the 4-channel screen. If you are viewing the one-channel screen,
the verbiage “Underrange” will appear on the bottom of the display.
A
B
Underrange
Arrows
Underrange
Figure 5-23: 1-channel screen (A) and 4-channel screen (B)
Figure 5-23 explained: Underrange displays when the level of the signal is
too low during the measurements of the sound. “UnderRange” text will appear
on the bottom of the display (a) and the arrows directed down in 4 CHANNELS
mode (b) will also appear to indicate underrange condition.
072-043 RevA
VI-410
91
CHAPTER
Chapter 6- Loading and viewing saved measurements
6
Loading and viewing saved
measurements
After taking measurements and storing your data (See “Save Options”, on page
37), you can view time history data, summary data, and frequency analysis
results either on the display of the VI-410 or in QuestSuite Professional II
software (if purchased). This chapter will address how to view measurements
from the VI-410. It will also explain saving, loading, and clearing the stored files
(referred as the “buffer” in the Appendix B).
Loading or retrieving your measurement results
Once you have loaded and viewed your results, you can save the data in QSPII for future analysis and reporting purposes (explained towards the end of this
chapter). Additionally, it is recommended to clear the files in order to free up
memory space in the VI-410 (see “deleting files” in this chapter).
View saved studies
¾
Menu Path: File>Load File
1. In the on position, select the menu path indicated above by selecting the
following:
•
Press Altf key and the Menu/Enter key, to access main menu.
•
Press
arrows to highlight File and press Menu/Enter key.
072-043 RevA
•
Press
arrows and highlight Load File. Press Menu/Enter key.
•
The Load file screen appears (see Figure below)
VI-410
92
Chapter 6: Loading and viewing saved measurements
Navigating through stored data screens
2. Understanding the Load file screen:
a. Line 1 and Line 2 indicate file storage with an assigned file number.
The files will save chronologically until cleared. (i.e., file “1” out of “12”
files).
b. Line 3 indicates the type of measurement mode (level meter for
vibration or sound, 1/1 octave, 1/3 octave or FFT) and then displays the
setup for channels 1-4. For example, “VVVS” represents vibration data
on channels 1-3 and sound data on channel 4.
c. Line 4 indicates if you logged data and provides you with the file name.
✍ NOTE: if you did not turn on data logging and select measurement
values, such as RMS and Peak, a file name will not appear after the
Logger Name.
d. Line 5 and Line 6 display the date and time of the measurements (or
session/study) and the file size.
A
B
Line 1 & 2
Line 3
Line 4
Line 5 & 6
Figure 6-1: Loading files
3.
4.
To select and load a file, press right or left arrow to page through the
saved files (if more than “1/1”). To load the file, press Menu/Enter key.
The VI-410 will state the name of the file and if it loaded ok.
Press Esc repeatedly until you are viewing the loaded (or retrieved) file
(session/study).
Navigating through stored data screens
As discussed in Chapter 5, you can navigate through channels’ time
history measurements by pressing the right/left arrows. To view data
on a different channel, press the up or down arrows and the channel
(or axis) will change. For more information on viewing your
measurements, please see “Viewing measurement results”, on page
83.
072-043 RevA
VI-410
93
Chapter 6: Viewing saved measurements on VI-410
HAV/WBV dose exposure and standards
HAV/WBV dose exposure and standards
If you wish to view HAV/WBV dose calculations (i.e., daily exposure results),
ensure that your VI-410 has the appropriate settings.
¾
Menu Path: Input>Auxiliary setup>HAV/WBV Dose setup
1. In the on position, select the menu path indicated above by selecting the
following:
•
Press Altf key and the Menu/Enter key, to access main menu.
•
Press
arrows to highlight Input and press Menu/Enter key.
•
Press
arrows and highlight Auxiliary setup . Press Menu/Enter key.
•
Press
arrows and highlight HAV/WBV Dose setup. Press
Menu/Enter key.
•
2.
The HAV/WBV Dose screen appears.
If this feature is not already “enabled”, press right arrow until it is checked.
(The checkmark in the “enable” field indicates the dose setup is activated.)
3. Optional: to change the exposure time press
arrows to highlight this
field. Press right arrow repeatedly to increase the time value, or press left
arrow repeatedly to decrease the time value.
✍ NOTE: To increase/decrease by 30-minute increments, press and hold
Altf with either right or left arrow keys.
HAV/WBV Dose – “enabled” (or activated)
Exposure Time – can be changed for calc. purposes
Standards – highlight and press enter to view
standards settings.
Figure 6-2: HAV/WBV dose screen
072-043 RevA
VI-410
94
Chapter 6: Loading and viewing saved measurements
Exposure values
4. Optional: to change the Standards for HAV/WBV dose exposure
calculation, highlight standards field and press Menu/Enter key.
User – enables you
to add customized
standard settings
Figure 6-3: Selecting EAV/ELV Dose standards
•
The default standards setting is “U.K.”. You have four optional standards
including: Italy, Poland, France, and a customizable “User setting”.
•
To select a new standard, press right/left arrow to page through the
settings. (If you select “User” as the standard setting, press down arrow
to highlight the field you wish to change. Then press left/right arrow
repeatedly to set a new value.)
•
To apply the new standard, press menu/enter key. (Or to return to the
previous screen, press Esc key).
5. Press Esc repeatedly to return to the main screen.
Exposure values
With the VI-410, you can select saved studies, load them into either a hand-arm
calculator or a whole-body calculator and then view the exposure action values
and exposure limit values. (Note: ensure you have “enabled” HAV/WBV Dose
calculation. See “HAV/WBV dose exposure and standards”, on page 93).
Loading/Selecting exposure dose values
You can load up to six studies in the exposure calculator and then view the
results with the following options:
•
•
•
Partial EAV/ELV
Partial Results
Daily Results
The steps below explain how to select the study(ies) and then explain how to
view the exposure results.
072-043 RevA
VI-410
95
Chapter 6: Viewing saved measurements on VI-410
Exposure values
¾
Menu Path: Auxiliary functions>HAV Calculator or /WBV >select results
1. In the on position, select the menu path indicated above by selecting the
following:
Press Altf key and the Menu/Enter key, to access main menu.
Press
arrows & highlight Auxiliary functions . Press Menu/Enter.
Press
arrows & highlight either HAV or WBV. Press Menu/Enter.
Press
arrows and highlight Select Results. Press Menu/Enter.
•
•
•
•
Figure 6-4: HAV calculator screen
•
The Select results screen appears. (NOTE: The intent of this screen is to
load your saved studies.)
Figure 6-5: Select File screen for dose exposure calculation
2. To select a file, press Menu/Enter key and a Select File screen appears.
Figure 6-6: “Empty” select file screen
3. Press Right arrow repeatedly until you have selected the appropriate file.
File – Press right arrow to page through files.
Figure 6-7: Loading or selecting a file for dose exposure
072-043 RevA
VI-410
96
Chapter 6: Loading and viewing saved measurements
Exposure values
4. Once loaded, press Esc key until you return to the HAV Calculator screen or
WBV Calculator.
✍ NOTE: if you want to load up to 6 studies, repeat steps 1-3. Please see
next section “Viewing exposure studies”.
Viewing your exposure studies
As mentioned above in loading exposure dose values, you have three optional
exposure result views for HAV or WBV studies. Once the files are selected and
loaded, the partial EAV/ELV, Partial results, and Daily Exposure measurements
are available. Please follow the preliminary steps in the previous section
before proceeding below. (The examples below are for HAV but will be very
similar for WBV. To access WBV exposure results, the steps will be the same.)
1. To view Partial EAV/ELV screen, from the HAV or WBV calculator screen
(see Figure 6-4 for example and instructions), select “Partial EAV/ELV” and
press Menu/Enter key. Screen contents explained: The results are
displayed in two columns – the first column for EAV results and the second
for ELV results.
EAV/ELV results
Figure 6-8: Viewing EAV/ ELV exposure with HAV calc.
2. To view dose exposure with Partial Results (or A(8) ), select Partial
Results from the HAV/WBV Calculator menu (see Figure 6-4).
•
Each loaded study will display partial dose exposure results.
Partial exposure results
Figure 6-9: Partial results with HAV calc. (or A(8) calculation)
✍ NOTE: The partial 8-hour time-weighted average exposure, called
“Partial results” on the VI-410, is calculated with the following formula:
•
072-043 RevA
Aeq x √(T/T0)
VI-410
97
Chapter 6: Viewing saved measurements on VI-410
Deleting individual studies
3. To view Daily dose exposure results, select Daily results from the
HAV/WBV Calculator menu (see Figure 6-4).
A – HAV results
B – WBV results
Figure 6-10: Daily Dose Exposure Results for HAV (A) and WBV (B)
Deleting individual studies
You can page through all of your saved studies and delete study by study as
needed. When you are viewing a study from the “Delete” menu, it displays the
name of the study (i.e., @VIB21), the measurement function (i.e., 1/1 octave
band or level meter), identifies if you setting of each channel (sound or vibration
level readings), and states the date and time of study. Please follow the steps
below to delete your studies.
¾
Menu path: File>Delete> Delete
1. In the on position, select the following menu path:
•
Press Altf key and the Menu/Enter key, to access main menu.
•
Press
arrows to highlight File and press Menu/Enter key.
•
Press
arrows and highlight Delete. Press Menu/Enter key.
•
Press
arrows and highlight Result files. Press Menu/Enter key.
2. To delete a study, press right arrow repeatedly until you select a specific
file. Press Menu/Enter key to delete a study. (Repeat this step to select
and delete more than one study.)
Figure 6-11: Selecting and deleting file(s)
3. To return to the main screen or measurement screen, press Esc key
repeatedly.
✍ NOTE:
072-043 RevA
If you want to delete all studies, see “Deleting all studies” for more details.
VI-410
98
Chapter 6: Viewing saved measurements on VI-410
Deleting individual studies
Deleting Setups
The VI-410 gives you the option to delete setup parameters one-by-one or you
can delete all setups at once. The steps below discuss how to select a setup
and delete the parameters individually.
¾
Menu path: File>Delete> Setup Files
1. In the on position, select the following menu path:
•
Press Altf key and the Menu/Enter key, to access main menu.
•
Press
arrows to highlight File and press Menu/Enter key.
•
Press
arrows and highlight Delete. Press Menu/Enter key.
•
Press
arrows and highlight Setup files. Press Menu/Enter key.
2. To delete a setup, press right arrow repeatedly until you select a specific
file. Press Menu/Enter key to delete a study. (Repeat this step to select
and delete more than one study.)
3. To return to the main screen or measurement screen, press Esc key
repeatedly.
✍ NOTE:
If you want to delete all studies, see “Deleting all studies” for more details.
Deleting all studies, setups, or logged data
With the delete all menu, you can delete all of your studies, setups and/or
logged data. Please follow the steps below for details on deleting.
¾
Menu path: File>Delete All
1. In the on position, select the following menu path:
•
Press Altf key and the Menu/Enter key, to access main menu.
•
Press
arrows to highlight File and press Menu/Enter key.
•
Press
arrows and highlight Delete All. Press Menu/Enter key.
•
Press
arrows and highlight Setup files. Press Menu/Enter key.
2. To delete all files from the VI-410, press
arrows to highlight Result
files. Press right arrow to add a checkmark . (A checkmark indicates you will
delete all files.)
3. To delete all setup files, press
arrows to highlight Setup files. Press
right arrow to add a checkmark . (A checkmark indicates you will delete all
files.)
072-043 RevA
VI-410
99
Chapter 6: Viewing saved measurements on VI-410
Checking file storage space
4. To delete all time history data files, press
arrows to highlight Logger files.
Press right arrow to add a checkmark . (A checkmark indicates you will delete
all files.)
5. Once you have selected the appropriate files to delete, press Menu/Enter key.
6. To return to the main menu or the measurement screen, press Esc key
repeatedly.
File Storage
Checking file storage space
The file storage menu (called “Free Space” on the instrument) indicates the
total bytes of memory remaining on the instrument and the total amount of
memory on the instrument. This is useful if you are concerned with the amount
of data that can be stored on the instrument.
¾ Menu path: File>Free Space> Free Space screen
1. Select the main menu by simultaneously pressing Altf key and the
Menu/Enter key. Arrow
to highlight File and press Menu/Enter key.
2. Press
arrow and select Free Space. Then press Menu/Enter key.
(This will open the Free Space screen.).
Figure 6-12: Example of checking your available storage space
Cleaning up memory (Defragmentation)
Defragmenting the instrument is a good practice if you often delete individual
files. This creates blocks of memory instead of one large pool of memory.
¾ Menu path: File>Defragmentation
1. Select the main menu by simultaneously pressing Altf key and the
Menu/Enter key. Press
to highlight File and press Menu/Enter key.
072-043 RevA
VI-410
100
Chapter 7
2.
Press
to highlight Defragmentation and press Menu/Enter key.
Figure 6-13: Defragment screen
3.
4.
5.
Press right or left arrow to select Yes to defragment.
Press Menu/Enter key to confirm defragmentation.
When complete, it will state “defragment complete press any key to continue”.
•
Press Esc key repeatedly to return to the main menu.
Reviewing your saved studies & settings
You may want to view a listing of all of your saved studies. You can either view the
“Catalogue” submenu the “Load” submenu or the “Delete” submenu. These three
menus contain the same screen information while you are viewing the contents. The
main difference between the three submenus is with the Delete submenu, you can also
delete your files. The load files enables you to also view exposure dose results.
Catalog
With the catalog menu, you can review the settings of your saved studies and also view
the file size.
¾
1.
2.
Menu path: File>Catalog
Select the main menu by simultaneously pressing Altf key and the Menu/Enter key.
Press
arrow to highlight File and press Menu/Enter key.
Press Up or Down arrow to highlight Catalog and press Menu/Enter key.
Total files displayed
2 out of 10
File size displayed
Figure 6-14: Catalog screen lists saved files and file size
3.
072-043 RevA
If you have more than one study saved, press the right arrow to page through the
catalog. Once completed, press the Esc key repeatedly to return to the main
screen or the measurement screen.
VI-410
CHAPTER
101
7
Chapter 7
At a glance:
HAV, WBV & Sound Studies
In the beginning chapters, the manual discussed basic vibration concepts, and
then progressed to vibration setup, running a study, and viewing your
study/session results. This chapter is a high-level look at running a hand-arm,
vibration study, a whole-body vibration study, or sound study. Please refer to
the subsequent chapters for specific steps.
Process Flow: Human Vibration and Sound instructional guide
•
•
•
Intro. to Human Vibration (Chapter 1)
Getting Started (Chapter 2)
Vibration Setup (Chapter 3)
•
•
072-043 RevA
•
•
•
Calibrating vibration and sound (Chapter 4)
Taking measurements (chapter 5)
Loading & viewing measurements(Chapter 6)
Start to Finish progression when running Hand-Arm Vibration ,
Whole-body Vibration and Sound studies (chapter 5)
Measuring sound (Chapter 8)
VI-410
102
Chapter 7
HAV overview
HAV overview
The checkpoints listed below are typical study procedures for a Hand-Arm
Vibration Assessment.
1.
2.
3.
4.
5.
6.
Check Battery: Check the battery power before and after your study.
Clear memory: It is recommended to clear the memory of the instrument
before starting. (This will give you full memory capacity on the instrument.)
Customize Setup for HAV study: Using QSP-II, apply Hand-Arm or HandArm Advanced (filters are enabled) setup. If applicable, modify the saved
settings for channels 1-3.
Send Setup to VI-410: Using QSP-II, click Send Setup to Instrument. (Ensure
VI-410 is connected to your pc via USB cable before sending setup.)
Inform the Worker: It is important to notify the worker of the purpose of your
study. This will prevent misunderstanding of monitoring his/her job
performance.
Place Transducer and VI-410: Connect the transducer and mounting device
to the hand tool and the VI-410.
Transducer mounted
with a clamping
device to hand-tool
to measure vibration
Cable
VI-410
Figure 7-1: Hand-arm vibration example
7.
“Start” mode: Turn VI-410 to “Start” or run mode.
8.
Work: Ensure the person who is being surveyed is doing the kind of work that
is normally done.
9. Observe: Throughout the study you may want to periodically observe the
person and measurements on the meter to avoid tampering with the study.
10. Remove Unit: After the HAV study, press Stop on the meter. Then remove
the transducer and meter from the test site.
11. Analyze data: Using QSP-II, retrieve the files from the meter. View the data
by accessing the vibration studies from the downloaded tree node. Panels of
charts and graphs can be added and customized for reporting and analysis
purposes.
072-043 RevA
VI-410
103
Chapter 7
WBV overview
WBV overview
The checkpoints listed below are typical study techniques for a Whole-Body
Vibration Assessment.
1.
2.
3.
4.
5.
6.
Check Battery: Check the battery power before and after your study.
Clear memory: It is recommended to clear the memory of the instrument
before starting. (This will give you full memory capacity on the instrument.)
Customize Setup for WBV study: Using QSP-II, apply Whole-Body or
Whole-Body Advanced (filters are enabled) setup. If applicable, modify the
saved settings for channels 1-3.
Send Setup to VI-410: Using QSP-II, click Send Setup to Instrument. (Ensure
VI-410 is connected to your pc via USB cable before sending setup.)
Inform the Worker: It is important to notify the worker of the purpose of your
study. This will prevent misunderstanding of monitoring his/her job
performance.
Place Seat pad accelerometer and VI-410: Mount VI-410 and seat-pad
accelerometer in the appropriate work area.
VI-410 mounted in cab
Seat-pad transducer
Figure 7-2: Whole-body vibration example
7.
8.
“Start” mode: Turn VI-410 to “Start” or run mode.
Work: Ensure the person who is being surveyed is doing the kind of work that
is normally done.
9. Observe: Throughout the study/workday you may want to stop by and observe
the person and measurements on the meter.
10. Remove Unit: After the WBV study, press Stop on the meter. Then remove
meter and seat-pad from the test site.
11. Analyze data: Using QSP-II, retrieve the files from the meter. View the data
by accessing the vibration studies from the downloaded tree node. Panels of
charts and graphs can be added and customized for reporting and analysis
purposes.
072-043 RevA
VI-410
104
Chapter 7
Sound overview
Sound overview
The steps outlined below explain the overall process for a sound study.
1.
2.
Check Battery: Check the battery power before and after your study.
Clear memory: It is recommended to clear the memory of the instrument
before starting. (This will give you full memory capacity on the instrument.)
3. Customize Setup for sound study: Using QSP-II, switch to channel 4 setup
and select SLM for the mode type. If applicable, modify the settings such as:
range (130db), response time (Slow), and filter weighting (A).
4. Send Setup to VI-410: Using QSP-II, click Send Setup to Instrument. (Ensure
VI-410 is connected to your pc via USB cable before sending setup.)
5. Calibrate: Calibrate channel 4 before and check for the calibration for
accuracy after the study. The instrument should not change more than 0.5db
from the original calibration level.
6. Inform the Worker: It is important to notify the worker of the purpose of your
study. This will prevent misunderstanding of monitoring his/her job
performance.
7. Place Microphone and VI-410 in the field: Attach the microphone and preamplifier to the meter. Place this in the field.
8. “Start” mode: Turn VI-410 to “Start” or run mode.
9. Work: Ensure the sound study is setup correctly by observing the
measurements on the display during the study.
10. Remove Unit: After the HAV study, press Stop on the meter. Then remove
the transducer and meter from the test site.
11. Analyze data: Using QSP-II, retrieve the files from the meter. View the data
using graphs and charts.
072-043 RevA
VI-410
CHAPTER
105
8
Chapter 8
Measuring Sound
This chapter will discuss how to run a sound study and include the following
areas:
¾
Customizing your setup options for a sound level study using Quest Suite
Professional II software. It will explain how to setup SLM using the VI410.
¾
Running a sound study.
¾
Viewing your sound study results in QSP-II and on the instrument.
Basics of Sound Measurement
A sound level meter (SLM) is a device which measures sound and produces
measurement readings from the sound pressure. Figure 8-1 illustrates the
basic flow of an electrical signal moving through a sound level meter. It
addresses how the range control, frequency filter, and the response choice
(Fast, Slow, or Impulse) affect the sound level reading.
072-043 RevA
VI-410
106
Chapter 8– Measuring Sound
Basics of Sound Measurement
Typical Sound Level Meter study
Sound pressure
(1) Microphone
(2) Amplifier
(5) Fast/Slow
(3) Range Control
(4) Frequency Filter
(6) Digital readout Display
F
S
Figure 8-1: Example of basic SLM study
Explanation of SLM study
1. When exposed to sound pressure, the microphone will generate an
electrical signal.
2. This signal will be increased by a preamplifier.
3. The signal is then regulated to an applicable level by the range control (dB
Range).
4. The signal than goes through a frequency filter or weighting system. In
many SLM’s, this filter system may consist of an “A”, “B”, or “C” weighting
network, which may or may not be bypassed with a linear (or LIN) function.
5. The subsequent circuit is the response circuit, which controls the
dampening of the readout.
•
The responses are Slow, Fast, or Impulse.
6. The last stage is a readout display by either an analog meter or a digital
display. The readout may be monitored by an external device via an AC or
DC output, or can be stored in a data logger.
✍ NOTE: The VI-410 has a built-in internal data logger.
072-043 RevA
VI-410
107
Chapter 8 – Measuring Sound
Equipment for sound study
Setting up a Sound Study
If this is the first time operating the instrument as a sound level meter, you will
need to do a little assembly before logging data. The following procedures will
walk you through the physical setup and then explain various sound settings.
Equipment for sound study
You will want to gather the equipment identified below before you begin your
sound study.
VI-410
Microphone in case
Preamplifier (also called
“Preamp”)
QSP-II software
Figure 8-2: Equipment for sound level test
Physical Setup
The microphone and preamplifier are delivered in separate cases. These two
devices should be connected to the instrument before beginning your study.
072-043 RevA
VI-410
108
Chapter 8 – Measuring Sound
Physical Setup
¾
Attaching the microphone to the preamp
1. Carefully remove the microphone from the carrying case.
2. Thread the microphone on the preamp by twisting the microphone until it
fits tightly.
Figure 8-3: Connect preamp to microphone
3. Taking the opposite end of the preamp, twist this device onto the VI-410.
Twist preamp onto VI-410
Figure 8-4: Connecting the assembled mic/preamp to VI-410
4. Once it is fully assembled, you are ready to program the settings for your
Sound study.
Figure 8-5: Example of instrument fully assembled for sound study
072-043 RevA
VI-410
109
Chapter 8 – Measuring Sound
Setting up a sound study with QSP-II
Setting up a sound study with QSP-II
There are two methods to set up a sound study. This manual discuses how to
setup a sound study with QSP-II. (Please see chapter 3 to setup your study
using the keypad of the instrument.)
Opening Set-up screen
1. From your desktop, click on QSP-II software icon.
(Or open it from Program Files).
✍ NOTE: if you have not installed QSP-II software, please follow steps on
QSP-II CD or on the Quest website.
2. In My Instruments panel, select Vibration and then select VI-410 icon.
3. Select the Setup
key.
Figure 8-6: Selecting setup from “My instruments” panel
072-043 RevA
VI-410
110
Chapter 8 – Measuring Sound
Setting up a sound study with QSP-II
Customize channel setup for SLM
1. Once the setup menu is opened (see steps above, “How to open the setup
screen”), click on “Channel 4” tab.
✍
NOTE: Channel 4 is the default for sound level mode. However, you can
quickly change this by setting up channel 1, channel 2, or channel 3 for
SLM. To do this, click on the appropriate channel to designate for SLM
mode and continue to step 2.
2. To select the basic SLM settings, click on the drop down arrow and click
again on the appropriate setting. Table 8-1 explains the settings.
Basic SLM settings
Explanation
Mode
The mode is either for Vibration level
meter (VLM) or Sound level meter (SLM).
The range represents the highest level for
your sound level test. The selections are
105dB or 130dB.
Different types of microphones can be
used in your test which are: Free
Microphone, Diffuse Microphone
(typically used in room acoustics) or
Outdoor Microphone
Range
Mic. Correction
Table 8-1: Basic SLM settings
Basic SLM
settings
Figure 8-7: setting up mode, range, and mic. for SLM
3. To select profile settings, click on the drop down arrow and click again on
the appropriate setting.
072-043 RevA
VI-410
111
Chapter 8 – Measuring Sound
Setting up a sound study with QSP-II
Table 8-2 explains the settings and Figure 8-8 illustrates profile settings.
Profile settings
Explanation
Profile
Profile is a feature that enables you to define up to three
profiles/settings for the sound level meter (or VLM).
• For example, you may want to run a test with different response
settings and filter weightings and compare the results.
The response determines how quickly the unit responds to
fluctuating sound. Fast has a time constant of 125 milliseconds.
Slow has a time constant of 1 second. Impulse is used for
measuring loud sounds with short durations.
Response
Filter Weighting
“A”, “C”, and “Z” are standard frequency filters that cover the
frequency range of human hearing (20Hz to 20kHz).
• “A” weighting is the most commonly used filter. It attenuates
the frequencies below several hundred hertz as well as the high
frequencies above six thousand hertz. (Typically reported as
dBA.)
• “C” weighting provides a flat frequency response with only
slight attenuation of the very high and low frequencies.
(Typically reported as dBC.)
• “Z” weighting covers a flat range of 20Hz to 20kHz.)
Table 8-2: Profile settings
Figure 8-8: setting up SLM profiles
Profile
Settings
Profile
Response
4. To save logged items for measurement results, choose one of the
following by clicking in the appropriate measurement box (see Figure 8-9):
•
Lpk ~ peak sound pressure level with C-weighting
•
Lmax ~ maximum sound pressure level with C-weighting at slow
response.
•
Lmin ~ minimum sound pressure level with C-weighting at slow
response.
072-043 RevA
VI-410
112
Chapter 8 – Measuring Sound
Setting up a sound study with QSP-II
•
RMS ~ average sound pressure level with C-weighting at slow
response.
Logged Items
Select measurements to
save for analysis after
your study.
Figure 8-9: Setting up SLM profiles
5. To enter calibration level, type in the calibration sensitivity. Click on the
recalculate key to adjust the calibration factor.
6. To apply filters, ensure under “Global” tab that 1/1, 1/3, or fft is enabled.
(See “How to customize global and advanced settings” for details).
•
Select the appropriate filter weighting by checking “enabled”. Then
choose a filter weighting (i.e., HP).
Saved Setups
Calibration section
Filters
• To activate, click
“enabled” checkbox.
• Select a filter weighting
• Select “RMS”
checkbox to save
measurement values in
Figure 8-10: Setting up calibration and activating filters
7. To save these settings, click on Save As and name your setup file. It will
automatically add to the “Saved Setup” section.
•
To continue to modify your sound settings, refer to the next section.
✍ NOTE: you can modify your Saved Settings, by clicking on the file name,
making changes, and saving the changes.
•
Or to continue modifying setup features, please refer to the next
section.
072-043 RevA
VI-410
113
Chapter 8 – Measuring Sound
Customizing global settings
Customizing global settings
In the global tab, you have the option of enabling a filtered frequency such as:
1/1 octave band filter, 1/3 octave band filter, FFT, or leave the default setting as
“level meter”. You also can modify the following features:
•
•
•
•
•
•
Changing the beginning delay time of your study (called “start delay”)
Changing the overall length of the studies “run time”
Modifying the logging rate time of your study (also called buffer time). If set
at 1 minute, the study will store measurements at one minute intervals.
Changing Autosave mode to store or not store measurements.
Changing the name of your study. The default is set as “VIBX”. Each file
saves in numeric order and starts in the following sequence unless
modified: VIB0, VIB1, VIB2 and continues to increase numerically.
Enabling or disabling Save Statistics feature.
Enabling frequency analysis
As explained above, you have three options for frequency analysis
measurements which are: 1/1, 1/3, and FFT. The steps below outline how to
enable this feature.
1. In the setup menu, click on the Global tab.
•
Follow steps, “How to open setup screen” to access setup in QSP-II.
Enabling frequency
analysis
Figure 8-11: Setting up frequency analysis measurement
072-043 RevA
VI-410
114
Chapter 8 – Measuring Sound
Customizing global settings
2. In the Measurement Function section, click on the drop down arrow and
click again on the appropriate feature.
3. To save the setting, click on Save As and name your setup file.
•
Or continue to modify your settings by referring to the next section.
•
Or refer to “send settings for SL study”.
Modifying start delay and log rate time
The default start delay time is set for one second. You may have a situation in
which you need additional lag time before starting your study. The steps below
detail and illustrate how to change this feature.
You also have the option of changing the “Run Time” of an overall study. The
default setting is set at 8 hours.
✍
NOTE: if you plan on running the instrument for a full 8 hours ensure you
have full battery power (see “checking battery power” in Chapter 2 for details).
1. In the setup menu, click on the Global tab.
•
Follow steps, “How to open setup screen” to access setup in QSP-II.
Start Delay time
Run Time
Log Rate time
Figure 8-12: setting up time elements in QSP-II
2. To change the Start delay time, click in the box and highlight the displayed
number. Type over the existing number.
3. To change the Run time, click on the drop down box and select a new
overall run time for your study.
072-043 RevA
VI-410
115
Chapter 8 – Measuring Sound
Working with Save options & File Naming
4. To change the Log rate time, click on the drop down box and select an
alternative interval.
5. To save the setting, click on Save As and name your setup file.
•
Or continue to modify your settings by referring to the next section,
“Working with save options and file naming.”
•
Or refer to “Send settings for SL study”.
Working with Save options & File Naming
The VI-410 is automatically setup to save studies. This can be disabled by a
quick click of your mouse. In the file section of QSP-II, you also can enable or
disable the “save statistics” feature.
In addition to the save features, you also have the ability to change the file
name of each study. The default for all studies is set as “VIB” and it
automatically increases by 1. Without changing the default file name, the first
file would save as “VIB0”, the second study would save as “VIB1” and would
repeat this pattern.
It is recommended to change the file name to “Sound” or something that
equates to a sound test. Then, the program will automatically save in the
following format: Sound0, Sound1, Sound2, Sound3; and so on.
072-043 RevA
VI-410
116
Chapter 8 – Measuring Sound
Customizing advanced settings
Modifying save options and file name
1. In the setup menu, click on the Global tab.
•
Follow steps, “How to open setup screen” to access setup in QSP-II.
AutoSave
File Name
Save statistics
Figure 8-13: Setting up time elements in QSP-II
2. To disable/enable, Autosave do one of the following:
•
To disable ~ uncheck Autosave box
•
To enable ~ check Autosave box
3. To change the file name, type in a new file name.
•
Such as: “sound”. The first file will save as “Sound0” the second file
will save as “Sound1” and continue to save numerically.
4. To save statistics, click in the “Save Statistics” box. To disable, uncheck
“save statistics”.
5. To save the setting, click on Save As and name your setup file.
•
Or continue to modify your settings by referring to the next section,
“Customizing advanced settings”.
•
Or refer to “Send settings for SL study”.
Customizing advanced settings
In the advanced settings, you can change the external input/output device type
and select appropriate input type. The steps below detail how to change each
of these settings.
072-043 RevA
VI-410
117
Chapter 8 – Measuring Sound
Customizing advanced settings
✍
NOTE: Vector Coefficient is displayed in the Advanced tab. This is only
applicable for vibration calculations when determining the vector sum. Thus,
the advanced tab will not be discussed in this chapter.
External Input/Output
External I/O refers to external device connections. This feature enables a user
to connect the VI-410 to another device such as a recorder.
1. In the setup screen, click on the Advanced tab.
2. In the external I/O section, click on the mode drop down box and select
one of the following:
•
Analog - AC output can be observed on an oscilloscope.
•
Digital In - can be used for an external trigger.
•
Digital Out - can be used as a trigger pulse.
3. In the channel drop down box, select the appropriate channel for external
device.
✍
NOTE: Channel 4 is the default for sound channel. If you changed this in
your setup (explained in “Customize channel setup for SLM”), you would select
that channel number.
4. In the input section, click on the drop down box and select either linear or
exponential.
5. To save the setting, click on Save As and name your setup file.
External I/O
Mode
Channel
Input
Figure 8-14: Setting up mode & channel for SLM
072-043 RevA
VI-410
118
Chapter 8 – Measuring Sound
Disable vibration level mode
Disable vibration level mode
You may want to disable vibration level readings on channels 1-3 before you
begin your sound study. If you choose to leave the default vibration settings,
then during a sound study the meter will display measurement values on
channels 1-3 as well as measurement values on channel 4.
1. Open QSP-II and select VI-410 from My Instruments panel.
2. Click on the appropriate device in the VI-410 listing, and then click Setup.
3. In the Setup box, click on Channel 1. Uncheck the measurement values in
the Logged Items section.
Channel tabs
*Select each
tab to disable
logged items
Logged items
*Uncheck
Figure 8-15: Changing settings for channels 1-3
4. Click on Channel two and uncheck Logged items.
5. Click on Channel three and uncheck Logged items.
6. Click Save As to rename your setup or click on the Save settings file and
then Rename the saved setting.
Working with Trigger mode for SL study
The instrument can be set to operate in a trigger mode. Triggering can take the
place of the manual use of Starting a study (Start/Stop key) and Stopping a
study (Start/Stop key). It can also be used to monitor runs with specific sound
pressure levels in relation to set points.
072-043 RevA
VI-410
119
Chapter 8– Measuring Sound
Basics of Sound Measurement
Slope+ or Slope•
When the Slope+ mode is selected, the measurement starts when the signal
increases past a specified signal source (i.e., vector/sound value) and a
specified sound level (also called SLM level). It will continue to store
measurement values until the “run time” (also called integration time) is reached
or if you manually stop the study. The default for the “run time” value is set at 8
hours
•
When the Slope- mode is selected, the measurement starts when the signal
decreases past a specified signal source and a specified vibration/sound value
and will continue to store measurement values until run time is reached or if you
manually stop the study.
Level+ or Level•
When the Level + mode is set, the triggering condition is checked each second;
the measurement is saved only when the signal is greater than the signal source
level and in any other cases the measurement result is not stored.
•
When the Level - mode is set, the triggering condition is checked each second;
the measurement is saved only when the signal is less than the signal source
level and in any other cases the measurement result is not stored.
Logger
In the Logger trigger mode, a pre and post logging rate is specified. If the
logging rate is set at 15 second intervals for the pre and post intervals, for
example, the logger will look at all the measurements and store only the study
time 15 seconds before and 15 seconds after the study.
Setting Trigger mode for SL study
1. In the setup screen, verify that channel 4 is setup for your sound study.
•
•
072-043 RevA
If you saved a sound setup, click on sound setup then proceed to step 2.
If you did not save a sound setup, setup channel 4 with the appropriate
settings. Then, Save the setup by selecting Save As key (lower righthand side of screen). Type in a new setup name and click Ok.
VI-410
120
Chapter 8 – Measuring Sound
Setting Trigger mode for SL study
2. Click on the Trigger tab. Select a mode, signal source, a channel (channel
4 indicates Sound study), select a value for SLM level. Delete the VLM
level. (See Figure 8-16 and Table 8-3 for explanation.)
Trigger tab
Use drop down
arrows & select
Mode
Signal Source
Channel
Type in a value
SLM level
Delete value
c.
d.
e.
f.
g.
Figure 8-16: Defining trigger settings for SLM in QSP-II
h.
Trigger
i. Modes
Slope +/j.
k.
l.
Level +/m.
n.
Logger
o.
p.
q.
r.
s.
Signal Source selectable options
•
•
Vector and Sound
Maximum
•
•
Vector and Sound
Maximum
1. Select Signal source option
•
Vector and Sound
•
Maximum
•
Measurement value
2. Type in a Pre or Post value for the buffer test such as, 15
seconds before a study and 15 seconds after a study.
Table 8-3: selecting signal source for trigger setup
3. Save your setup by either updating your current “saved setups” file. (To
save current setup, click on the file, in saved settings and select Save key.)
072-043 RevA
VI-410
121
Chapter 8 – Measuring Sound
Setting Trigger mode for SL study
•
Or click Save as key and assign new name (i.e., sound study with
triggers)
Saved Setups
Listing of saved
settings
(or called
files/templates)
Save or Save As
Figure 8-17: illustrates saving your trigger setup
Sending settings for SL study
1. Using the USB cable, plug the cable into the instrument (Figure 8-18A) and
then connect the instrument to your computer (figure 8-18B). Ensure that
the VI-410 is in the “On” position.
• (To turn on VI-410, simultaneously press the Proceed/Pause key and
Start/Stop key.)
t.
u.
A. Connect
USB to
instrument
B. Connect USB to
your pc
Figure 8-18 A and B: Connecting the instruments to the pc
2.
In QSP-II, select the setup key for the VI-410 instrument.
See section above, “How to open setup screen” for more details.
•
072-043 RevA
VI-410
122
Chapter 8 – Measuring Sound
Setting Trigger mode for SL study
Send setup to instrument
Figure 8-19: Send setup key
3. Select the appropriate Sound setup in the Saved Settings (see Figure 8-17).
4. From the setup screen, click on the Send Setup to Instrument key.
✍
NOTE: The software screen will show a progress bar
state, “data successfully sent to unit” once it is complete.
and it will
Get setup from instrument
Once all of your settings have been selected and saved, you can send the
parameters to the instrument.
1. Using the USB cable, connect the instrument to your computer. Ensure
that the VI-410 is in the “On” position.
• To activate, simultaneously press the Proceed/Pause key and
Start/Stop key.
2. In QSP-II for the VI-410 instrument, select the instrument from the menu
and click on the Setup key.
•
See section above, “How to open setup screen” for more details.
072-043 RevA
VI-410
123
Chapter 8– Measuring Sound
Running and viewing a Sound study
3. In the setup screen, click on Get setup from instrument (see Figure 8-20).
Get setup from
instrument
Figure 8-20: Get setup from instrument
Running and viewing a Sound study
By this point, you should have the instrument connected to the microphone (as
illustrated above) and customized settings for a Sound level study.
The next step is to position the instrument in the field. When you are ready to
begin your study, follow the steps below.
1. To begin the study, press the Menu/Enter key.
•
The following screen indicators describe type of study and the
measurement value is displayed on Channel four with a Peak value of
120.7 dbA.
Warning
Run mode
Saving
Battery power
Graphical image of sound intensity
•
If all the increments in bar are
shaded you are at or over the
maximum level.
Figure 8-21: Sound level run mode screen
072-043 RevA
VI-410
124
Chapter 8 – Measuring Sound
Setting Trigger mode for SL study
2. To page through different time history values, press the right/left arrows.
3. To view 4 measurements on one screen, press the down arrow until three
measurements are displayed.
42: SPL
•
Indicates channel four
value in profile 2
43: SPL
•
Indicates channel 4
value in profile 3
Figure 8-22: “Four measurement view” during SL study
✍
NOTE: If you did not define additional setups for your channel 4 sound
study (called profiles), then the measurement values displayed in “channel 42”
and “channel 43” will display the same value as “channel 41”.
4. To view frequency analysis filter, press the down arrow until you see a
graphical view of the spectrum appear. (Note: this has to be applied before
you start your study. Please reference, “Enabling frequency analysis” for setup
explanation.)
Figure 8-23: Viewing 1/3 octave band during a sound study
Stopping or Pausing a SLM study
While you are running a study, you can either pause a study and then start it
again (also called trigger on or trigger off) or stop your study.
After running your sound studies, you are ready to take the stored data from the
instrument and send it to QSP-II.
072-043 RevA
VI-410
125
Chapter 8 – Measuring Sound
Setting Trigger mode for SL study
Retrieving Data for SLM
1. While the VI-410 is in the “on” position, plug the USB cable into the VI-410
and then, connect this to your pc.
2. Open up QSP-II software and under My Instruments click on Vibration,
click on VI-410, select the proper unit from the Device Name list, then
select Retrieve Data.
My Instruments
Vibration
Retrieve Data
Figure 8-24: Retrieve data key for SLM study
3. In the Retrieve Data dialog box, click on Select All and then click on the
Download key.
•
Or check the appropriate studies and then select Download key.
Select to close
Select All
Refresh
Sound study files
• Shows all of your logged
studies (i.e., @sound0,
@sound1, @sound2, etc)
Download
Figure 8-25: Example of retrieving data from QSP-II
072-043 RevA
VI-410
126
Chapter 8 – Measuring Sound
Setting Trigger mode for SL study
4. Once it is downloaded, you will get a message stating “Download
Complete”. Click on the “X” to close the retrieve dialogue box.
Displaying sound studies in QSP-II
Now that your studies have been moved from the instrument to the software,
you can view various graphs and charts using Quest Suite Professional II.
1. In the Tree Nodes, click on “Downloaded” to expand the node.
Downloaded Node
Expand to view your
logged sessions.
Figure 8-26: Accessing SLM, downloaded files from QSP-II
2. Click on the appropriate study you wish to view and the study will
expand out to Sound file and “Meter Config” files.
Click to
expand study
Sound files
Figure 8-27: Example of Downloaded sound files
3. Click on the file which is indicated with a red book icon
Sound file
File
Figure 8-28: Selecting sound files in QSP-II
072-043 RevA
VI-410
127
Chapter 8 – Measuring Sound
Setting Trigger mode for SL study
4. On the right-hand side of QSP-II, your logged study is displayed in
graphs and charts (see Figure 11-29). (For more details on Charts and
graphs, see next section, “Understanding graphs and charts”).
Name of
your study
Figure 8-29: Example of viewing charts and graphs in QSP-II
Tables and charts layout view
You can add, edit, print, and export data in QSP-II. The following diagram
illustrates the main features and menu bars in QSP-II.
D
C
A
B
Figure 8-30: Example of Graphs and Charts SLM layout view in QSP-II
072-043 RevA
VI-410
128
Chapter 8 – Measuring Sound
Setting Trigger mode for SL study
Graphs & Charts layout view
Explanation
A. Layout
The layout is divided into panels which can be customized in
“manage templates” icon.
The standard layout has four panels on each screen which
can be added or deleted by using the Add icon.
Used to enlarge or hide the chart or graph (also called
panel), Edit the data, or close the view.
Used to add tables or charts, arrange tables or charts,
manage the layout view, lock it, print reports and help files.
B. Panel
C. Chart & Graph icons
D.
Layout icons
Table 8-4: Explanation of graphs and charts layout view
Customizing charts and graphs in QSP-II
Once you are in the layout view, you may have to click on each panel and
customize the chart or graph to channel 4. This is dependant on if you turned
off the buffer measurements on channels 1-3 during the setup phase.
1. In the appropriate panel (example below illustrates “logged data chart”),
click on the “Edit Panel” icon.
Edit panel icon
Figure 8-31: Edit panel icon option
072-043 RevA
VI-410
129
Chapter 8- Measuring Sound
2. Click on the “Channel 4” tab and select measurements you wish to view.
(Click on “Select All” to view all the values.)
Channel 4
Check appropriate measurements
Figure 8- 32: Selecting measurements which will appear on
chart/graph
3. To turn off channel’s 1-3 data, click on each channel and uncheck
measurement values.
Channel 1
Uncheck each channel’s measurements
Figure 8-33: Disabling vibration measurements in QSP-II’s charts
and tables
4. Click Ok when complete.
✍
NOTE: If you want to ensure vibration channels 1-3 are disengaged for
sound studies, see above, “Disable vibration level mode”.
072-043 RevA
VI-410
130
Chapter 8- Measuring Sound
This page left blank intentionally
072-043 RevA
VI-410
CHAPTER
131
9
Chapter 9 – QSP-II
Setting Trigger mode for SL study
QSP-II
In three easy to follow sections, this chapter will guide you through
communicating, setting up options for HAV or WBV study(ies), and explain how
to send the setup features to the instrument.
✍ NOTE: For information on manually setting up the instrument without help
of QSP-II, please follow the procedures in Chapter 3.
•
Communicating with QSP-II and your pc - steps and diagrams
detailing how to connect and add QSP-II.
•
Working with the set-up features - an explanation of setting up and
saving your settings.
•
Sending settings to instrument - details how to send your setup
features to the instrument.
•
Retrieving and downloading data - explains how to retrieve data
and review the results from the downloaded node in charts and graphs.
Communicating and downloading data
If you haven’t downloaded QSP-II software, please follow the instructions on
the CD. Once installed, you will want to gather the USB cable and the VI-410.
¾ Connecting the VI-410 to your pc
1. Turn on the VI-410.
•
Simultaneously press Proceed/Pause key and Start/Stop key.
2. Connect USB port to your pc. (See “B” in Figure 9-1).
072-043 RevA
VI-410
132
Chapter 9- QSP-II
Working with Set-up features
3. Connect the USB cable to the VI-410 (See “C” in Figure 3-2).
B
C
Figure 9-1: Connecting VI410 to PC/Laptop
A. Power on VI400-Pro. B. Connect USB to pc
C. Connect USB from pc to VI-410
4. Open QSP-II software from your desktop. (Double-click QSP-II icon.)
5. In My Instruments, click on Vibration key and then click on VI-410 key. It
will automatically load the instrument into the VI-410 section of the screen.
VI410
Vibration Key
Setup
Figure 9-2: Selecting VI-410 in QSP-II
Working with Set-up features
Now that you have installed the QSP-II software and connected the instrument
to your pc, you are ready to work with the setup screens in QSP-II. The
072-043 RevA
VI-410
133
Chapter 9– QSP-II
Channel (x, y, z) measurement setup
advantage to working in QSP-II is that you can quickly save multiple setups,
access them in the saved settings screen, and send it to the instrument.
Channel (x, y, z) measurement setup
Open QSP-II and ensure the instrument is attached to the pc.
•
For more details, refer to “Connecting the Instrument” above.
From the “My Instruments” view in the VI-410 panel select the Setup
key. Please refer to Figure 9-3.
In the Saved Setups section, click on one of the following:
•
Hand Arm
•
Whole Body
•
Whole Body advanced (1/3 octave filters are enabled)
•
Hand Arm Advanced (1/3 octave filters are enabled)
✍
NOTE: In this example, there are four Saved Setups for hand arm vibration and
whole body vibration. With Hand arm advanced setup, filters are enabled for 1/3 octave
band analysis. Likewise with whole body advanced settings, 1/3 octave band is
enabled for engineering analysis. If you do not plan to use the filter analysis option,
you would select either “Hand Arm” or “Whole Body” from the saved setups box.
I. Saved
setups
Saved
settings
created for
HAV and
WBV studies.
A. Channel 1-4
screens
B. Mode- vibration
or sound
C. Range
D. Profile
E. Response time
F. Filter
(weighting)
H. Filter
(weighting)
First select
“enable”
checkbox
Then, select
specific
weighting
G. Selecting
logging items
Save as
Figure 9-3: Explanation of channels setup for HAV/WBV study
1. In the Channel 1 (or x-axis) setup screen, choose the appropriate features
(as explained in Table 9-1below) by using the drop down arrows or clicking
in applicable checkboxes.
072-043 RevA
VI-410
134
Chapter 9– QSP-II
Channel (x, y, z) measurement setup
To change channels 2-4 setup options, click on each channel screen and
select the appropriate features (see “A” in Figure 9-3 above).
2. To continue changing setup features, please see next section, “Setting up
global settings”.
3. Or to save settings, click on Save As key and name your new setup.
Then see, “Send setup to instrument” for the next step.
The following table explains the measurement selections, logging options, and
filter options used to setup WBV or HAV testing (Sound testing is discussed in
Chapter 8).
Setup Channel
screen
A. Channel tab
B. Mode
C. Range
D. Mic. Connection
E. Profile section
Explanation
Used to customize each channel (also called “axis”) with various features.
The default is set where channel 1 is equivalent to x-axis, channel 2 is the
equivalent to y-axis, channel 3 is equivalent to z-axis, and channel 4 is
equivalent to sound level mode.
Select either Vibration level meter (referred to as VLM) or Sound Level meter
(SLM) for your study.
The range is determined by two settings:
2
2
17.8 m/s or 316 m/s
•
To select Range, click on the drop down arrow and click on the
appropriate setting.
Used in Sound Level Measurement only (Discussed in Chapter 8).
You can create up to three profiles per channel by setting different Detect
/Response time and/or different Filters.
1. Profile ~ The profile mode enables you to select profile 1, 2, and/or 3 for a
complex study of up to 3 profiles per channel. For example, you may want to
study the vibration on channels 1-3 with a weighting value of HP and also
weighting value of Wk
• To select Profile, click on the drop down arrow and click on the
appropriate profile.
2. Detect (Response Time) ~ enables you to detect vibration in seconds or
milliseconds. You have the following options:
100 ms, 125 ms, 200ms, 500 ms or
1s, 2s, 5s, 10s
• To select Detect, click on the drop down arrow and click on the
appropriate response time.
3. Filter (Weighting) ~ used for different types of vibration analysis. (Please
see Appendix A for explanation of the types of filter weightings)
• To select Filter, ensure that you have selected either HAV advanced or
WBV advanced . In the channel tab, click on the drop down arrow and
select a filter. Continue to click on each channel and apply a filter and
weighting as needed.
Table 9-1: Explanation of HAV or WBV setup options
072-043 RevA
VI-410
135
Chapter 9- QSP-II
Working with Set-up features
Setup Channel
screen
F. Logged items
G. Calibration
H. Filter section
(for octave
band analysis)
I. Saved Settings
Explanation
You can setup logged items (also called “Logger” on the instrument) to display
the following measurements:
• Lpk, RMS, P-P, Lmax, or VDV
¾ To select Logged items click in the checkboxes to activate. (A
checkmark indicates “activated” .)
Once each channel is calibrated in the field (see Chapter 4 for details), the
calibration value is entered into this field.
Frequency filters provide detailed results to identify the causes of vibration
and enable you to develop corrective engineering and administrate changes.
¾ To enable a filter, click on either the hand arm advanced or whole
body advanced under saved settings (see figure 3-5 for reference of
Saved Settings). Next, click in the Enable filters box and select a type
of filter from the drop down box.
Saved templates for HAV or WBV studies which can be modified to fit your
study (ies).
Table 9-1: Explanation of HAV or WBV setup options (Continued)
Global settings
Once you have selected the channel settings (or chose one of the “saved
settings” templates), the next step is to view or modify the “global settings”
screen.
Measurement function
When selecting the measurement function, you have the option of selecting
“Level Meter”, for vibration testing or sound testing, “”1/1”, “1/3”, or “FFT”. This
feature will apply to all of the channels. (Please refer to “A” in Figure 9-4).
Measurement setup
The optional features in the measurement setup section include selecting the
start delay time before a run/test, run time, and data logging rate (also called
“logger step time”). (Please refer to “B” in Figure 9-4).
File Saving and Statistics
Under file option, the default setting for saving files is automatically set for
auto-saving. The default study will save as “Vib” and chronologically increase
with 1 through Infiniti. (For example, if you saved 4 studies, QSP-II would
automatically save the files as “VIB”, “VIB1, “VIB2, “VIB3”). You can rename
the file by typing in up to 5 characters. QSP-II will then rename the file and
072-043 RevA
VI-410
136
Chapter 9– QSP-II
Global settings
continue to add on a numerical value with each study saved. To turn on or off
the statistics feature, a click in a checkbox will enable this feature.
¾ Setting Measurement function, Measurement setup, and File setup
1. Ensure you are in the setup screen of the VI-410.
2. Click on the Global tab. You will have the following options:
•
•
•
•
•
•
“A” measurement function: select either Level meter (for vibration or sound
testing), 1/1 octave, 1/3 octave, or FFT.
“B” measurement setup: select start delay time and run time
“C” Log Time: select the logging rate in milliseconds, seconds, or minutes.
“D” Autosave: automatically enabled in QSP-II. (Uncheck if you do not wish
to automatically save every study. For more details see Save Options in
Chapter 3.)
“E” Customize file : type in a customized name (up to 5 character). QSP-II
will then assign the name you provided and will add “1” to the first character
string. Each study will save in numeric order.
“F” Save statistics: Saving statistics is used only for sound level meter (See
Chapter 8).
3. To select any of global settings, click in the drop down boxes and either
select from the list or type in a value/characters.
4. Once completed, either refer to the next section, Working with Advanced
tab in QSP-II.
•
Or Save your settings by selecting the Save As key and name your
setup. Then see, Send setup to instrument.
Global tab
D. AutoSave
B. Measurement
type
E. Customize file
F. Save statistics
C. Log Time
Send setup to instrument
Figure 9-4: Selecting Global settings during setup
072-043 RevA
VI-410
137
Chapter 9– QSP-II
Advanced settings in QSP-II
Working with Advanced setup features
•
Working with Advanced tab in QSP-II - this includes defining the reference
level setup, external input or external output feature, input type, and
explaining the vector coefficient option.
•
Working with Trigger Mode- an explanation of the triggering function and
how to set the various settings.
•
Working with the Vibration dose functions - an explanation of how to
change the default European standards. It will also explain how to customize
the naming convention of the x-axis, y-axis, and z-axis.
Advanced settings in QSP-II
Below explains how to customized advanced settings including changing the
reference level, selecting an external input/output mode, selecting linear or
exponential, and changing vector coefficient (if applicable).
1. From the VI-410 setup key, click on the Advanced tab.
2. In the Advanced screen, either type in the appropriate setting or select one
of the drop down choices.
3. When completed, either save your settings and send to the instrument or
see the next section, “Triggering”.
Advanced setup
Reference level
Vector coefficient
External I/O
Input
Figure 9-5: Explaining Advanced setup tab for HAV
072-043 RevA
VI-410
138
Chapter 9– QSP-II
Setting up Triggering in QSP-II
Setting up Triggering in QSP-II
The instrument can be set to operate in a trigger mode. Triggering can take the
place of the manual use of Starting a study (Start/Stop key) and Stopping a study
(Start/Stop key). It can also be used to monitor runs with specific vibration values
or sound pressure levels in relation to set points. (Please see Chapter 3,
“Triggering” for description of selectable fields.)
✍ NOTE: When activating the triggering mode for vibration level studies, the “triggering
signal” is the signal coming form the RMS detector of the first channel.
Slope+ or SlopeWhen the Slope+ mode is selected, the measurement starts when the signal
increases past a specified signal source (i.e., vector value) and a specified
vibration value (also called VLM level). It will continue to store measurement
values until the “run time” (also called integration time) is reached or if you
manually stop the study. The default for the “run time” value is set at 8 hours (see
Figures 3-13 and 3-14 below)
When the Slope- mode is selected, the measurement starts when the signal
decreases past a specified signal source and a specified vibration value and will
continue store measurement values until run time is reached or if you manually
stop the study.
The figure below displays an example of selecting “Slope+” as the triggering mode,
selection of “maximum” measurement value for the signal source, and the vibration
level as “8” for HAV study. In essence, this example demonstrates if the maximum
value exceeds 8 m/s2 for HAV study, then the instrument would begin storing that
specific data.
Trigger tab
Mode
Signal Source
VLM level
Figure 9-6:
072-043 RevA
Example of setting the trigger for “slope+” mode
VI-410
139
Chapter 9 – QSP-II and VLM
Setting up Triggering in QSP-II
Global Tab
“Run Time”
•
Also called “integration time” which
identifies stop time for your study
Figure 9-7: Example of where stop time is set for triggering mode
Setting Slope+ or Slope– in the trigger mode
1. In the setup screen, click on the Trigger tab.
2. In the Mode drop down box, select either Slope + or Slope -.
3. In the Signal Source field, select one of the measurement values by clicking on the
drop down box and clicking the appropriate value.
4. In the VLM mode, 80 will appear. You can adjust this by typing a numeric value in
the VLM field.
5. If you want to adjust the “stop” triggering time, click on the global tab, and select a
new “run time” (see Figure 3-14 above).
6. Either continue to change/modify the settings or click on the Save As key to save
the setup. (See “sending settings to instrument” when your setup is complete.)
Level+ or Level•
When the Level + mode is set, the triggering condition is checked each second; the
measurement is saved only when the signal is greater than the signal source level
and in any other cases the measurement result is not stored.
•
When the Level - mode is set, the triggering condition is checked each second; the
measurement is saved only when the signal is less than the signal source level and
in any other cases the measurement result is not stored.
Trigger tab
Mode
Signal Source
Saved
settings
VLM level
Saved As
Figure 9-8: Trigger setting with Level+ mode
072-043 RevA
VI-410
140
Chapter 9– QSP-II
Setting up Triggering in QSP-II
Setting trigger mode with Level + or Level –
1. In the setup screen, click on the Trigger tab.
2. In the Signal Source field, select one of the measurement values by clicking
on the drop down box and clicking the appropriate value.
3. In the VLM mode, 80 will appear. You can adjust this by typing a numeric value
in the VLM field.
4. If you want to adjust the “stop” triggering time, click on the global tab, and
select a new “run time”.
5. Either continue to change/modify the settings or click on the Save As key to
save the setup. (See “ending settings to instrument” when your setup is
complete.)
Logger
In the buffer trigger mode, a pre and post logging rate is specified. If the
logging rate is set at 15 second intervals for the pre and post intervals, for
example, the buffer will look at all the measurements and store only the study
time 15 seconds before and 15 seconds after the study.
Mode
Signal Source
VLM level
Before (Pre)
After (Post)
Figure 9-9: Trigger setting with logger mode
1. In the setup screen, click on the Trigger tab.
2. In the Mode drop down box, select Buffer.
3. In the Signal Source field, select one of the measurement values by
clicking on the drop down box and clicking the appropriate value.
4. In the VLM mode, 80 will appear. You can adjust this by typing a numeric
value in the VLM field.
5. To set pre logging rate, type in the appropriate value (i.e., 15 sec.)
6. To post logging rate, type in the appropriate value (i.e., 15 sec).
7. Either continue to change/modify the settings or click on the Save As key to
save the setup. (See “sending settings to instrument” when your setup is
complete.)
072-043 RevA
VI-410
141
Chapter 9– QSP-II
Working with the Vibration dose functions
Working with the Vibration dose functions
In the Vibration dose screen, you can modify the default European standard, (noted
as UK in QSP-II). You can also customize the x-axis, y-axis, and z-axis as it
pertains to Channel 1, Channel 2, and Channel 3, or Channel 4.
Setting instrument standard and exposure time
1.
2.
3.
4.
5.
From the Setup main menu, ensure you selected either hand arm or whole
body setup under “saved settings”.
Click on the Vibration Dose tab.
To change the standards, click in the Standard drop down box and select Italy,
Poland, or user.
The exposure time is automatically set at 8 hours. A different time can be
inputted by using the up and down arrows in the Exposure time field to change
the default time.
Either continue to change/modify the settings or click on the Save As key and
name your new setting. (See “sending settings to instrument” to proceed to the
next section.)
Vibration dose
Vibration dose
Standard
Figure 9-10: Defining exposure time and instrument standard
Changing the axis setup/configuration
The axis setup is configured where the x-axis refers to
channel 1, the y-axis refers to channel 2, the z-axis refers
to channel 3, and channel 4 is setup for sound testing.
This can be changed to any variation in the Vibration
Dose of the setup menu.
1.
2.
3.
4.
072-043 RevA
From the Setup main menu, ensure you selected either hand arm or whole
body setup under “saved settings”.
Click on the Vibration Dose tab.
Using the up/down arrows in the channel axis configuration section, you can
change each of the axis one by one.
Either continue to change/modify the settings or click on the Save As key and
name your new setting.
VI-410
142
Chapter 9– QSP-II
Sending Settings from QSP-II to VI400Pro
Sending Settings from QSP-II to VI400Pro
After selecting a saved setting or making modifications to the setup parameters,
you can send these new changes to the VI-410. Below explains the steps.
1. Using the USB cable, plug it into the instrument (Figure 9-11A) and then
connect the instrument to your computer (Figure 9-11B). Ensure that the
VI-410 is in the “On” position.
• (To turn on VI-410, simultaneously press the Proceed/Pause key and
Start/Stop key.)
A. Connect USB to instrument
B. Connect USB to your pc
Figure 9-11: Connecting the instrument (A) to the pc (B)
2. In QSP-II for the VI-410 instrument, select the instrument from the menu
and click on the Setup key.
3. Select the appropriate setup in the Saved Settings. (i.e., hand arm
advanced or one of your customized setups.)
4. From the setup screen, click on the Send Setup to Instrument key.
Saved
Settings
Send setup
to instrument
Get setup from
instrument
Figure 9-12: Sending setup to/from instrument
✍
072-043 RevA
NOTE: The instrument will show a progress bar
“data successfully sent to unit” once it is complete.
and it will state,
VI-410
143
Chapter 9– QSP-II
Get setup from instrument
Get setup from instrument
As mentioned above, you can customize your setup parameters and then when you
are ready, you can then pull the modified setup to QSP-II. Below explains the
steps.
1. Using the USB cable, connect the instrument to your computer. Ensure that the
VI-410 is in the “On” position.
• (To activate, simultaneously press the Proceed/Pause key and Start/Stop
key.)
2. In QSP-II for the VI-410 instrument, select the instrument from the menu and
click on the Setup key.
3. In the setup screen, click on Get setup from instrument
Get setup from
instrument
Figure 9-13: Get setup from instrument
Data
Retrieve data from VI-410 to QSP-II
Once you have conducted a vibration study (or studies) in the field, you can retrieve
the data (or export the data) from the VI-410 to your QuestSuite Professional II
software.
1. While the VI-410 is in the “On” position, plug the USB cable into the VI-410 and
connect this to your pc.
2.
072-043 RevA
Open up QSP-II software and under My Instruments click on Vibration (for
vibration instruments). Then click on VI-410 and select Retrieve Data (see
Figure 9-14).
VI-410
144
Chapter 9– QSP-II
Retrieve data from VI-410 to QSP-II
✍
NOTE: If you select Vibration tab and then click on Retrieve Data, the
software will automatically detect the instrument. It is optional to choose
Vibration tab and then select VI-410 icon.
My Instruments
Vibration
Retrieve Data
Figure 9-14: Retrieve data key in QSP-II
3. In the Retrieve Data dialog box, click on Select All or select specific
instrument data by clicking in specific checkboxes. Next, click Download
key.
Select All
Download
Instrument Data
• Shows all of your logged
studies (i.e., @VIB2, VIB3)
Figure 9-15: Retrieve data dialog box
4. Once it is downloaded, you will get a message stating “Download
Complete”. Click on the “X” to close the dialogue box.
072-043 RevA
VI-410
145
Chapter 9– QSP-II
Viewing studies in QSP-II
Viewing studies in QSP-II
In Chapter 1, you were introduced to the logon screen of QSP-II. Remember
that “My Instruments” is used to manage your vibration instrument including
setup and retrieving studies. The “Downloaded” Node (left-hand side of
screen) lists all of your logged sessions.
Downloaded node
• Click on Downloaded and then click the “+” to expand the tree view.
• It will reveal the Session, Meter configuration (same as your set-up parameters), and Study data
Figure 9-16: Accessing your studies/sessions from QSP-II
1. In the Tree Nodes, click on Downloaded to expand the node.
•
Ensure that you “retrieved data” or downloaded data from instrument to
software. (See “Retrieved logged data from VI-410 to QSP-II” above).
072-043 RevA
VI-410
146
Chapter 9– QSP-II
Viewing studies in QSP-II
2. Click on the appropriate session you wish to view. (The session will
expand out into studies.) If you want to view the study level, click on the
session (yellow folder) and it will expand into a study. (A red book icon
indicates a study).
Session ( a summary of all of the study data) (if you only
have one study under the session node the results are
the same.) (run/stop data)
Study (details run/pause data)
Figure 9-17: Downloaded studies
3. On the right-hand side of QSP-II, your data is displayed in graphs and
charts. (For more details see online help in QSP-II.)
Name of your
data
Figure 9-18: Viewing your results in charts and graphs
072-043 RevA
VI-410
147
Chapter 9 – QSP-II and VLM
Tables and charts layout view
Tables and charts layout view
You can add, edit, print, and export data in QSP-II. The following diagram illustrates the
main features and menu bars in QSP-II.
Layout icon toolbar
D
Used to customize your panels.
C
Panel (or chart/graph) icons
Used to expand, collapse, and
customize values.
Layout
A
B
Panel
Also referred to as
“Charts and Graphs”
Figure 9-19: example of QSP-II measurement results (layout view)
Graphs & Charts
A. Layout
B. Panel
C. Chart & Graph
icons
D. Layout icon
toolbar
072-043 RevA
Explanation of layout view
QSP-II is divided into two panes (or sections). One is the layout view
and the second pane is the “control pane”. The layout is divided into
“panels” which contain charts and graphs, calibration history, etc. You
can add charts and/or graphs (by adding panels), move them in the
appropriate position, and/or customize the data values.
For the VI-410, the standard layout (or default template) has three
panels. The panels can be moved, edited, and expanded or collapsed.
(see “Chart and Graph icons)
Used to enlarge or hide a panel (also called chart or graph), edit the
data, or close the view.
; Expand or Collapse the panel (graph/chart)
;
Edit (edit the parameters of the selected screen)
;
Delete (closes the window)
This toolbar is used to add tables and/or charts, arrange tables or
charts, manage the layout view, lock it, print reports and access to the
help files.
VI-410
-1-
APPENDIX A
Functions and codes
APPENDIX A
REMOTE CONTROL
Only one serial interface, new, relatively fast, the USB in version 1.1 is used in VI-410
instrument. This interface enables one to control remotely the unit. It works with
12 MHz clock. Its speed is relatively high and it ensures the common usage of USB in
all Personal Computers produced nowadays.
The functions which are developed in order to control data flow in the serial interface
ensure:
•
bi-directional data transmission,
•
remote control of the instrument.
The user, in order to programme the serial interface, has to:
1. send "the function code",
2. send an appropriate data file or
3. receive a data file.
A.1.
Input / output transmission types
The following basic input / output transmission types (called functions) are available:
#1 input / output of the control setting codes,
#2 output of the measurement data in the sound level meter (SLM) or vibration level
meter (VLM) mode,
#3 output of the measurement data in 1/1 OCTAVE or 1/3 OCTAVE mode,
#4 read out the data file from the internal Flash-disc and/or the special file located in
the RAM memory,
#5 read out the statistical analysis results,
#6 remote setting of the user filters,
#7 special control functions,
#9 send the setup file to the internal Flash-disc.
072-045 RevA
VI-410
-2-
APPENDIX A
Functions and codes
A.2.
Function #1 – input / output of the control setting codes
Function #1 enables the user to send the control setting codes to the instrument and
read out a file of the current control state. A list of the control setting codes is given in
Tab. A.1.
The format of #1 is defined as follows:
#1,Xccc,Xccc,(...),Xccc; or
#1,Xccc,X?,Xccc,(...),X?,Xccc; where:
X - the group code, ccc - the code value,
X? - the request to send the current X code setting.
The instrument will output a control settings file for all requests X? in the following
format:
#1,Xccc,Xccc,(...),Xccc;
In order to read out all current control settings the user should send to the device the
following characters:
#1;The instrument will output a control settings file in the format:
#1,Xccc,Xccc,(...),Xccc;
Example: The following sequence of characters:
#1,U958,N4000,Z0:1,Z0:2,Z0:3,Z1:4,M3,Y1000,Xa1,Xv1,Xd1,XA0,XR0,S0;
means that:
- the Quest VI-410 is investigated (U958),
- the unit’s number is 4000 (N4000),
- the Vibration Level Mode is selected in channel 1 (Z0:1),
- the Vibration Level Mode is selected in channel 2 (Z0:2),
- the Vibration Level Mode is selected in channel 3 (Z0:3),
- the Sound Level Mode is selected in channel 4 (Z1:4),
- the 1/3 OCTAVE analyzer function is selected (M3),
- the measurement start delay is equal to 1000 milliseconds (Y1000),
- the reference level for acceleration measurement is set to 1 µms-2 (Xa1),
- the reference level for velocity measurement is set to 1 nms-1 (Xv1),
- the reference level for displacement measurement is set to 1 pm (Xd1),
- the AutoSave option is switched off (XA0),
- the RAM file will not be created (XR0),
- the instrument is in the STOP state (S0).
072-045 RevA
VI-410
-3-
APPENDIX A
Functions and codes
Note: All bytes of that transmission are ASCII characters.
Note: Any setting can be changed only when the instrument is in
the STOP state (S0).
A.3. Function #2 – read-out of the measurement results in SLM
or VLM Mode
Function #2 enables one to read out the current measurement data in the SLM
or VLM Mode.
Notice: This function can also be programmed while measurements are
taking
place.
In this case, the RMS values measured after entering #2 function will be sent out.
#2 function has a format defined as follows:
#2,p,X?,X?,X?,(...),X?;
where:
X - the code of the result,
p - the number of the results set
0 – for reading vibration dose results
1, 2, 3,.., 12 – for reading profile results
(calculated from the formulae: ChannelNumber + 4 * (ProfileNumber - 1)
Notice: After entering the STOP condition, #2 function is no longer active
and has to be reprogrammed in order to read-out successive measurements.
072-045 RevA
VI-410
-4-
APPENDIX A
Functions and codes
The instrument will send the values of the results in the format defined as
follows:
#2,p,Xccc,Xccc,Xccc,(...),Xccc;
(where p - the number of the results set)
#2,?;
(when the results are not available).
or
The codes of the results in the case of SLM mode are defined as follows:
T
time of the measurement (ccc – value in seconds);
V
the overload flag (ccc equals to 0 or 1);
P
the PEAK value (ccc – the value in dB);
M
the MAX value (ccc – the value in dB);
N
the MIN value (ccc – the value in dB);
S
the SPL value (ccc – the value in dB);
R
the LEQ value (ccc – the value in dB);
U
the SEL result (ccc – the value in dB);
B(k) the Lden result (ccc – the value in dB);
Y
the Ltm3 result (ccc – the value in dB);
Z
the Ltm5 result (ccc – the value in dB);
L(nn) the value L of the nn statistics (ccc – the value in dB).
Notice: The value displayed on the screen during the result’s
presentation will be sent out from the instrument in the case when after the X code the
nn is not given.
Notice: For profiles 2 and 3 the L(nn) result is not calculated.
Notice: The presented above order of the measurement results sent out
by the instrument does not depend on the order of the characters sent to the unit.
Notice: In the case of Lden, the value k placed in the parenthesis after
the code B, denotes the kind of the currently measured result. The kind of the Lden
072-045 RevA
VI-410
-5-
APPENDIX A
Functions and codes
result depends on the time during which the measurements were performed (d
denotes
day,
e
denotes
evening
and
n
denotes
night).
The corresponding values of k parameter and the kind of the measured Lden result
are presented below:
k=1
Ld result,
k=2
Le result,
k=3
Lde result,
k=4
Ln result,
k=5
Lnd result,
k=6
Len result,
k=7
Lden result.
Example: After sending to the instrument the string:
#2,1,T?,V?,B?,P?,M?,R?,L50?;
one should receive the following answer:
#2,1,T3,V0,P66.91,M64.55,R61.70,B(2)66.70,L(50)54.95;
The codes of the results in the case of SOUND DOSIMETER mode are defined
as follows:
T
time of the measurement (ccc – value in seconds);
V
the overload flag (ccc equals to 0 or 1);
P
the PEAK value (ccc – the value in dB);
M
the MAX value (ccc – the value in dB);
N
the MIN value (ccc – the value in dB);
S
the SPL value (ccc – the value in dB);
D
the DOSE value (ccc – the value in %);
d
the DOSE8h value (ccc – the value in %);
A
the LAV value (ccc – the value in dB);
R
the LEQ value (ccc – the value in dB);
U
the SEL result (ccc – the value in dB);
u
the SEL8 value (ccc – the value in dB);
E
the E value (ccc – the value in Pa2h);
e
the E8h value (ccc – the value in Pa2h);
I
the LEPd value (ccc – the value in dB);
J
the PSEL value (ccc – the value in dB);
Y
the Ltm3 result (ccc – the value in dB);
Z
the Ltm5 result (ccc – the value in dB);
L(nn) the value L of the nn statistics (ccc – the value in dB).
The codes of the results in the case of VLM mode are defined as follows:
072-045 RevA
VI-410
-6-
APPENDIX A
Functions and codes
T
V
P
Q
M
R
H
v
time of the measurement (ccc – value in seconds);
the overload flag (ccc equals to 0 or 1);
the P–P value (ccc – the value in dB);
the PEAK value (ccc – the value in dB);
the MTVV value (ccc – the value in dB);
the RMS value (ccc – the value in dB);
the VDV value (ccc – the value in dB);
the VEC value (ccc – the value in dB).
Example: After sending to the instrument the string:
#2,1,T?,V?,P?,R?;
one should receive the following answer:
#2,1,T3,V0,P76.92,R64.50;
The codes of the results in the case of Vibration Dose mode are defined as
follows:
a
the Current Dose value (ccc – the value in dB);
b
the Daily Dose value (ccc – the value in dB);
c
the Current Exposure value (ccc – the value in dB);
f
the Daily Exposure value (ccc – the value in dB);
g
the EAV Time value (ccc – value in seconds);
h
time left to reach EAV value (ccc – value in seconds);
i
the ELV Time value (ccc – value in seconds);
j
time left to reach ELV value (ccc – value in seconds).
Example: After sending to the instrument the string:
#2,0,c?,f?,g?,h?;
one should receive the following answer:
#2,0,c-27.89,f-13.44,g172800,h172800,i172800,j172800;
Notice: All bytes of that transmission are ASCII characters.
A.4. Function #3 – read-out of the measurement results in
1/1 OCTAVE and 1/3 OCTAVE Mode
072-045 RevA
VI-410
-7-
APPENDIX A
Functions and codes
Function #3 enables one to read out the current measurement data in
1/1 OCTAVE, 1/3 OCTAVE.
#3 function format is defined as follows:
#3,n;
where: n – the number of channel (1, 2, 3, or 4)
The device will respond, sending the last measured spectrum (when in STOP
state) or currently measured spectrum (in RUN state) in the following format:
#3,n;<Status Byte> <LSB of the transmission counter> <MSB
transmission counter> <data byte> (...) <data byte>
of
the
Status Byte gives the information about the current state of the instrument.
D7
D6
D5
where:
D7 = 1
D6 = 1
D5 = 0
=1
D0 to D4
D4
D3
D2
D1
D0
denotes "overload indicator",
denotes "averaged spectrum",
the instantaneous current result (RUN State),
the final result (STOP State),
reserved bits.
Note: The measurement result is coded in binary form as dB•100 (e.g.
34.5 dB is sent as binary number 3450).
A.5. Function #4 – read-out of the data file from the internal
Flash-disc and/or the special file located in the RAM memory
Function #4 enables the user to read-out the data file from the internal Flashdisc
memory.
The data file formats are given in Appendix B.
#4 function formats are defined as follows:
#4,0,\;
the file containing the catalogue,
072-045 RevA
VI-410
-8-
APPENDIX A
Functions and codes
#4,1,FILE NAME;
setup,
#4,1,FILE NAME,addr;
setup,
#4,2,Bnnn;
#4,3;
(RAMfile),
where:
FILE NAME
addr
disc memory,
Nnn
RAMfile
the file containing the measurement results or saved
the file containing the measurement results or saved
the logger file,
the special file contained in the RAM memory
not longer than eight-character name,
is the logical address of the file in the internal Flashthe number of the logerr file (one or more digits depends on requirements).
the special name for the file contained in the RAM
memory, may be used also with the format:
#4,1,RAMfile;
Notice: The "\" character is the obligatory catalogue file name (it
must
be
sent
to the instrument).
The device will respond sending the specified file/catalogue in the following
format:
#4,k;<4 bytes giving the file size (in binary form)><data byte>...<data
byte>
where character k corresponds to the file type:
0 for the file containing the catalogue,
1 for the file containing the measurement results or saved setup,
2 for the file containing the logger.
All data words are sent as <LSB>,<MSB>.
send:
When an error is detected in the file specification or data, the instrument will
#4,?;
The catalogue of the files is a set of the records containing 16 words (16 bits
each). Each record describes one file saved in the instrument’s Flash-disc. The
record structure is as follows:
words 0 - 3 8 character file name,
072-045 RevA
VI-410
-9-
APPENDIX A
Functions and codes
word 4
file type (binary number),
word 5
reserved,
word 6
least significant word of the file size,
word 7
most significant word of the file size,
word 8
least significant word of the file logical address,
word 9
most significant word of the file logical address,
word 10
measurement start date,
word 11
measurement start time,
words 12 - 15 reserved.
For loggers and the RAMfile the logical address is always set to 0. For files
containing saved setup measurement start date and time are always set to 0.
Notice: If the DEFRAGMENTATION function is performed after the read
out of the files catalogue the logical addresses of the files could be wrong.
The measurement start date is coded as a word with bits:
b15 ... b3 b2 b1 b0
where:
b15 b14 b13 b12 b11 b10 b9 is a year minus 2000.
b8 b7 b6 b5
is a month (1..12),
b4 b3 b2 b1 b0
is a day (1..31).
The measurement start time is coded as number of seconds counted from
00:00:00 divided by 2.
The structure of the files containing the measurement results, saved setups
and/or files containing logger results is described in details in Appendix B.
A.6.
Function #5 – read-out of the statistical analysis results
Function #5 enables one to read out the statistical analysis results. This
function is available only for channels in sound level meter mode.
#5 function format is defined as follows:
#5,p;
where:
p
072-045 RevA
the number of the channel (1, 2, 3 or 4)
VI-410
- 10 - APPENDIX A
Functions and codes
or the number of channel plus 4 (5, 6, 7 or 8) for the read
out
of
the
statistics
in 1/1 OCTAVE or 1/3 OCTAVE analysis.
Notice: Statistical analysis is always performed in profile 1.
The device will respond, sending the current statistics in the following format:
#5,p;<Status Byte> <LSB of the transmission counter> <MSB of the
transmission
counter>
<NofClasses><BottomClass><ClassWidth><Counter of the class> (...)
<Counter of the class>
Status Byte gives the information about the current state of the instrument.
D7
D6
where:
D7 = 1
D6 = 1
D5 = 0
=1
D0 to D4
D5
D4
D3
D2
D1
D0
denotes "overload indicator",
reserved,
the instantaneous current result (RUN State),
the final result (STOP State),
reserved bits.
Notice: There is not any succeeding transmission in the case when the
Status Byte is equal to 0.
The transmission counter is a two-byte word denoting the number of the
remaining bytes to be transmitted. Its value is calculated from the formulae:
Transmission counter = 6+n * (4 * the number of the classes in the histogram)
where:
n the number of the transmitted histograms. For p = 1, 2, 3 or 4 only one
histogram is transmitted (n = 1). For p between 5 and 8 the number of the
transmitted
histograms
depends
on
the measurement function and
− in the case of 1/1 OCTAVE analysis n is equal to the number of the
analysis results (NOct – cf. App. B) plus the number of the TOTAL
values for this type of analysis (NOctTot);
072-045 RevA
VI-410
- 11 -
APPENDIX A
Functions and codes
−
in the case of 1/3 OCTAVE analysis n is equal to the number of the
analysis results (NTer – cf. App. B) plus the number of the TOTAL
values for this type of analysis (NTerTot);
NofClasses is a two-byte word denoting the number of classes in the
histogram.
BottomClass is a two-byte word denoting the lower limit of the first class (*10
dB).
ClassWidth is a two-byte word denoting the width of the class (*10 dB).
Counter of the class is a four-byte word containing the number of the
measurements
belonging
to the current class.
Notice: The bytes in the words are sent according to the scheme
<LSByte>..<MSByte>.
A.7.
Function #6 – remote setting of the user filters
Function #6 enables one to send to the instrument the coefficients of the user
filters.
In the available formats description of #6 functions the following symbols are used:
type
- 0 for the vibration filters,
- 1 for the acoustic filters,
- filter names given by the user,
- real type value, expressed in [dB],
- integer type value (number of the coefficient in the
name, name1, name2
v
first
user filter),
pos
- integer type value (Total value number),
avd
- for the vibration filters: 0 - Acc, 1- Vel, 2 - Dil,
- for the acoustic filters this parameter is always equal
to 0,
cal
- the calibration coefficient given as the real number
expressed in [dB].
chn
- channel number (1, 2, 3 or 4).
072-045 RevA
VI-410
- 12 - APPENDIX A
Functions and codes
#6 function formats are defined as follows:
#6,type,L;
This function returns the list of the defined (existing in the instrument) filters in
the following format: #6,type,n,name1, ... ,namen;
#6,type,W,name,v,v,...,v;
This function sets the coefficients of the new user filter named as name. The
name parameter should be unique (in the instrument there is not any other filter
with the same name, otherwise it will be an error). The function answers in the
format: #6;
#6,type,R,name;
This function returns the coefficients of the user filter named as name. If the
name filter does not exist, an error occurs. The function returns in the following
format: #6,type,n,v1,v2, ... ,vn;
#6,type,D,name;
This function deletes from the instrument the user filter named as name. If the
name filter does not exist, an error occurs. The function answers in the format: #6;
#6,type,S,name,v,v,...,v;
This function sets the user filter named as name. If the name filter already
exists, its coefficients are redefined. If the name filter does not exist, filter is
created. The function answers in the format: #6;
#6,type,C,name,first,v,v,...,v;
This function sets the coefficients in the user filter named as name starting from
the
first
position.
If the name filter does not exist, an error occurs. The function answers in the
format: #6;
#6,type,N, name1, name2;
This function changes the name of the user filter from name1 to name2. The
function
answers
in the format: #6;
#6,type,@,chn,L;
072-045 RevA
VI-410
- 13 -
APPENDIX A
Functions and codes
This function returns the names of the user filters, assigned to the channel chn
consecutive
TOTAL
values,
in
the
following
format:
#6,type,chn,3,name1,name2,name3;
#6,type,@,chn,pos,?;
This function returns the description record of the user filter assigned to the pos
TOTAL
value
of channel chn in the following format: #6,type,@,chn,pos,name,avd,cal; (the
description record contains: the name of the filter, its type and the calibration
coefficient).
#6,type,@,chn,pos,*;
This function recovers the predefined filter for the pos TOTAL value of channel
chn
and
returns
the following format: #6,type,@,chn,pos,name,avd,cal;
#6,type,@,chn,pos,name,avd,cal;
This function sets the description record of the user filter assigned to the pos
TOTAL
value
of channel chn in the following format: #6,type,@,chn,pos,name,avd,cal;
The returned parameters: name, avd and cal are set in the description record
after
the
execution
of the function. In the case of an error they can differ from the current parameters
of the function.
Notice: In the case of an error all these functions return the following
sequence
of the characters: #6?;
A.8.
Function #7 – special control functions
Function #7 enables the user to perform special control functions. Some of
them should be used with the extreme care.
#7 function formats are defined as follows:
#7,CB;
072-045 RevA
VI-410
- 14 - APPENDIX A
Functions and codes
This function clears the internal logger memory - all logger files will be deleted.
The function returns #7,CB; This function is not accepted while the instrument is in
the RUN state.
#7,BF;
This function returns logger memory free space in the format:
#7,BF,ddddd; (ddddd - number of bytes in decimal format).
#7,BN;
This function returns the number of logger files created to the current time in
the format: #7,BN,ddddd; (ddddd - number of logger files in decimal format).
#7,RT;
This function returns current real time clock settings in the format:
#7,RT,hh,mm,ss,DD,MM,YYYY;
where hh:mm:ss denotes the time and DD/MM/YYYY gives the date.
#7,RT,hh,mm,ss,DD,MM,YYYY;
This function sets the current real time clock and returns the following
sequence of characters: #7,RT;
#7,AS;
This function returns current real time and date settings for the AutoStart
function in the format: #7,AS,e,hh,mm,ss,DD; where e=1 if AutoStart function is
switched ON or 0 if it is switched OFF, hh:mm:ss gives the time and DD gives the
day for the current date.
#7,AS,e,hh,mm,DD;
This function uses the given time and date settings for AutoStart function and
returns the following sequence of characters: #7,AS;
#7,SS;
This function saves the current settings of the instrument in the EEPROM
memory. The function returns the following sequence of characters: #7,SS;
This function is not accepted and not performed while the instrument is in the
RUN state.
072-045 RevA
VI-410
- 15 -
APPENDIX A
Functions and codes
#7,DA;
This function deletes all files containing measurement results and instrument’s
settings
from
the internal flash memory. The function returns the following sequence of
characters: #7,DA;
This function is not accepted and not performed while the instrument is in the
RUN state.
#7,DF;
This function deletes all files containing measurement results from the internal
flash
memory.
The function returns the following sequence of characters: #7,DF;
This function is not accepted and not performed while the instrument is in the
RUN state.
#7,DF,fileName;
This function deletes file named fileName containing measurement results from
the internal flash memory. The function returns the following sequence of
characters: #7,DF;
This function is not accepted and not performed while the instrument is in the
RUN state.
#7,DF,fileName<iAddr;
This function deletes file located at internal address iAddr containing
measurement
results
from
the internal flash memory. The function returns the following sequence of
characters: #7,DF;
This function is not accepted and not performed while the instrument is in the
RUN state.
#7,DS;
This function deletes all files containing instrument’s settings from the internal
flash
memory.
The function returns the following sequence of characters: #7,DS;
This function is not accepted and not performed while the instrument is in the
RUN state.
#7,DS,fileName;
072-045 RevA
VI-410
- 16 - APPENDIX A
Functions and codes
This function deletes file named fileName containing instrument's settings from
the internal flash memory. The function returns the following sequence of
characters: #7,DS;
This function is not accepted and not performed while the instrument is in the
RUN state.
#7,DS,fileName<iAddr;
This function deletes file containing instrument's settings located at internal
address
iAddr
from
the internal flash memory. The function returns the following sequence of
characters: #7,DS;
This function is not accepted and not performed while the instrument is in the
RUN state.
#7,AN,FName;
This function sets the name of the file for the Autosave function as the Fname.
The given name has to start with the ‘@’ character and contain no more than 8
characters.
The
function
returns
the following sequence of characters: #7,AN;
This function is not accepted and not performed while the instrument is in the
RUN state.
#7,AN;
This function returns current file name used by Autosave function in the format:
#7,AN,Fname;.
This function is not accepted and not performed while the instrument is in the
RUN state.
#7,AV;
This function returns analyzer firmware version in the format
#7,AV,XX.XX.XXC; where XX.XX.XX is firmware version, C – firmware
subversion.
#7,BS;
This function returns battery charge level in the format #7,BS,nn; where nn is a
percent value. When battery state is not available (i.e. unit is powered from
external
source)
function
returns:
#7,BS,-1;.
072-045 RevA
VI-410
- 17 -
APPENDIX A
Functions and codes
Notice: For the unknown function and/or in the case of the other error, all
these functions return the following sequence of characters: #7,?;
A.9.
Function #9 – writing setup files to the internal Flash-disc
Function #9 allows uploading files containing instrument setup to the internal
Flash-disc.
The function expects files in format described in Appendix B, paragraph B.9.
Function should be used with extreme care.
The #9 function format is defined as follows:
#9,2,Len,<data byte> ... <data byte>
where:
Len - length of transferred file in bytes as ASCII,
<data byte> - byte of data in binary form.
Function responds with “#9,1;” on success and with “#9,0;” on failure.
A.10. Control setting codes
The control setting codes used in the VI-410 instrument (starting from the
internal software version 3.6.1) are given in the table below.
Table A.1. Control setting codes
Group name
Group
code
Unit type
U
U958
Serial number
N
Nxxxx (read only)
072-045 RevA
Code description
(read only)
VI-410
- 18 - APPENDIX A
Functions and codes
Software version number * 100
W
WLxxx xxx - Meter version numb. * 100 (read only)
Wxxx xxx - Analyzer vers. numb. * 100 (read only)
Microphone field correction
H
H0:n - Free field in channel n
H1:n - Diffuse field in channel n
Channel mode
Z
Z0:n Z1:n -
Calibration factor
Q
Qnnnn:c nnnn - real number with the value of the
calibration factor for channel c in dB
∈(-99.9 ÷ 99.9)
Measurement function
M
M1 M2 M3 M4 M6 -
Level Meter
1/1 OCTAVE analyzer
1/3 OCTAVE analyzer
Sound dosimeter
FFT analyzer
Execution of 1/1 OCTAVE,
1/3 OCTAVE or FFT analysis
in channel n
e
e0:n e1:n -
Spectrum analysis in channel n disabled
Spectrum analysis in channel n enabled
Range of channel n
R
R1:n - 105 dB (SLM) or 17.8 ms-2 (VLM)
R2:n - 130 dB (SLM) or 316 ms-2 (VLM)
P
P1 P2 P3 P4 P5 P6 P7 P8 P9 P10P11 P12 -
CHANNEL 1, PROFILE 1 (read only)
CHANNEL 2, PROFILE 1 (read only)
CHANNEL 3, PROFILE 1 (read only)
CHANNEL 4, PROFILE 1 (read only)
CHANNEL 1, PROFILE 2 (read only)
CHANNEL 2, PROFILE 2 (read only)
CHANNEL 3, PROFILE 2 (read only)
CHANNEL 4, PROFILE 2 (read only)
CHANNEL 1, PROFILE 3 (read only)
CHANNEL 2, PROFILE 3 (read only)
CHANNEL 3, PROFILE 3 (read only)
CHANNEL 4, PROFILE 3 (read only)
F1:m
F2:m
F3:m
F4:m
LIN filter for profile m
A filter for profile m
C filter for profile m
G filter for profile m
m = ChannelNo + 4 * (ProfileNo – 1)
Displayed results
Filter type in profile for SLM
072-045 RevA
F
Vibration Level Meter/Analyzer for channel n
Sound Level Meter / Analyzer for channel n
VI-410
- 19 -
APPENDIX A
Functions and codes
f
f0:n f1:n f2:n f3:n -
HP filter in channel n
LIN filter in channel n
A filter in channel n
C filter in channel n
Filter type in FFT analysis
in channel n for SLM
j
j0:n j1:n j2:n j3:n -
HP filter in channel n
LIN filter in channel n
A filter in channel n
C filter in channel n
Filter type in 1/1 OCTAVE or
1/3 OCTAVE analysis in channel n
for VLM
i
i0:n -
HP filter in channel n (read only)
Filter type in FFT analysis in channel
n for VLM
k
k0:n -
HP filter in channel n (read only)
I1:m
I2:m
I3:m
I4:m
I5:m
I6:m
I7:m
I8:m
I9:m
I10:m
I15:m
I16:m
I17:m
I18:m
I19:m
I20:m
I21:m
I22:m
I23:m
HP1 filter for profile m
HP3 filter for profile m
HP10 filter for profile m
Vel1 filter for profile m
Vel3 filter for profile m
Vel10 filter for profile m
VelMF filter for profile m
Dil1 filter for profile m
Dil3 filter for profile m
Dil10 filter for profile m
KB filter for profile m
Wk filter for profile m
Wd filter for profile m
Wc filter for profile m
Wj filter for profile m
Wm filter for profile m
Wh filter for profile m
Wg filter for profile m
Wb filter for profile m
m = ChannelNo + 4 * (ProfileNo – 1)
Filter type in 1/1 OCTAVE or
1/3 OCTAVE analysis in channel n
for SLM
Filter type in profile for VLM
Detector type in profile for SLM
072-045 RevA
I
C
C0:m - IMPULSE detector in profile m
C1:m - FAST detector in profile m
C2:m - SLOW detector in profile m
m = ChannelNo + 4 * (ProfileNo – 1)
VI-410
- 20 - APPENDIX A
Functions and codes
Detector type in profile for VLM
E
E0:m E1:m E2:m E3:m E4:m E5:m E6:m E7:m -
100 ms detector in profile m
125 ms detector in profile m
200 ms detector in profile m
500 ms detector in profile m
1 s detector in profile m
2 s detector in profile m
5 s detector in profile m
10 s detector in profile m
m = ChannelNo + 4 * (ProfileNo – 1)
Logger type in profile in the case of
SLM
B
B0:m - None logger in profile m
Bxx:m - xx – sum of values for profile m:
1 – logger with PEAK values
2 – logger with MAX values
4 – logger with MIN values
8 – logger with RMS values
m = ChannelNo + 4 * (ProfileNo – 1)
Storing the results of 1/1 OCTAVE
or 1/3 OCTAVE analysis in channel
n in logger file in the case of SLM
b
b0:n b4:n -
switched off (None) in channel n
switched on (RMS/LEQ) in channel n
Storing the results of FFT analysis in
channel n in logger file
v
v0:n v4:n -
switched off (none) in channel n
switched on (RMS) in channel n (read only)
Logger type in profile in the case of
VLM
G
G0:m - None logger in profile
Gxx:m - xx – sum of values for profile m:
1 – logger with PEAK values
2 – logger with P–P values
4 – logger with MAX values
8 – logger with RMS values
16 – logger with VDV values
m = ChannelNo + 4 * (ProfileNo – 1)
Storing the results of 1/1 OCTAVE
or 1/3 OCTAVE analysis in channel
n in logger file
g
g0:n g4:n -
d
dnnnn - nnnn number in milliseconds ∈(10, 20, 50,
100, 200, 500, 1000)
dnns - nn number in seconds ∈(1 ÷ 60)
dnnm - nn number in minutes ∈(1 ÷ 60)
Logger time step
072-045 RevA
switched off (none) in channel n
switched on (RMS) in channel n
VI-410
- 21 -
APPENDIX A
Functions and codes
Integration time
D
D0
Dnns
Dnnm
Dnnh
“infinite” number
nn number in seconds
nn number in minutes
nn number in hours
K0 Repetition cycle
K
infinity
(measurement
stopped
when
the STOP button is pressed or when remote
setting S0 is received)
Knnnn - nnnn number of repetitions ∈(1 ÷ 1000)
Detector type in the LEQ (for SLM)
and/or RMS (for VLM) function
L
L0 L1 -
LINEAR
EXPONENTIAL
Band of the FFT analysis
in channel n
r
r1:n r2:n r3:n r4:n r5:n r6:n r7:n r8:n r9:n -
22.4 kHz band of FFT analysis in channel n
11.2 kHz band of FFT analysis in channel n
5.6 kHz band of FFT analysis in channel n
2.8 kHz band of FFT analysis in channel n
1.4 kHz band of FFT analysis in channel n
700 Hz band of FFT analysis in channel n
350 Hz band of FFT analysis in channel n
175 Hz band of FFT analysis in channel n
87.5 Hz band of FFT analysis in channel n
Lines in FFT analysis in channel n
u
u0:n u1:n u2:n -
1920 lines in channel n
960 lines in channel n
480 lines in channel n
Window in the FFT analysis
in channel n
w
w0:n w1:n w2:n w3:n -
HANNING in channel n
RECTANGLE in channel n
FLAT TOP in channel n
KAISER–BESSEL in channel n
Averaging in the FFT analysis in
channel n
a
a0:n -
LINEAR in channel n
m
m0 m1 m2 m3 m4 m5 m6 m7 -
OFF
SLOPE +
SLOPE –
LEVEL +
LEVEL –
LOGGER
GRAD +
RTC
Trigger Mode (TriggerMode)
072-045 RevA
VI-410
- 22 - APPENDIX A
Functions and codes
s
s0 s1 s2 s3 -
Vector value
Vector and sound value
RMS value from profile 1
External trigger
c
c1 c2 c3 c4 -
channel 1
channel 2
channel 3
channel 4
o
o0 o1 o2 o3 onn -
Vector value
Vector and sound value
RMS from profile 1 value
External trigger
nn number of the filter in 1/1 OCTAVE
spectra ∈(8 ÷ NOct), respectively:
8 - 125 Hz, 9 - 250 Hz, ..., 15 - 16 kHz;
NOct = 15 - number of filters in 1/1 OCTAVE
analysis
Source of the triggering signal for
measurement function M3 with the
selection TriggerMode=LOGGER
(TriggerTerSource)
t
t0 t1 t2 t3 tnn -
Vector value
Vector and sound value
RMS from profile 1 value
External trigger
nn filter’s number in 1/3 OCTAVE spectra
∈ (23 ÷ NTer), respectively:
23 - 125 Hz, 24 - 160 Hz, , 45 - 20 kHz;
NTer = 45 - number of filters in 1/3 OCTAVE
analysis
SLM’s trigger level (TriggerLev)
l
Ixxx -
xxx level given in dB ∈(24 ÷ 136)
VLM’s trigger level (TriggerLev)
n
nxxx - xxx level given in dB ∈(60 ÷ 200)
VLM’s vector trigger level
(VecTriggerLev)
h
hxxx - xxx level given in dB ∈(60 ÷ 200)
Number of the records from the
logger taken into account before the
fulfillment of the triggering condition
(TriggerPre)
p
Number of the records from the
logger taken into account after the
fulfillment of the triggering condition
(TriggerPost)
q
Source of the triggering signal for
measurement functions: M1 and M6
(TriggerSource)
Channel of the triggering signal
Source of the triggering signal for
measurement function M2 with the
selection TriggerMode=LOGGER
(TriggerOctSource)
072-045 RevA
pnn -
nn number of the records taken into account
before the fulfillment of the triggering
condition ∈(0 ÷ 20)
qnn -
number of the records taken into account
after the fulfillment of the triggering condition
∈(0 ÷ 200)
VI-410
- 23 -
APPENDIX A
Functions and codes
nn delay given in milliseconds ∈(0 ÷ 60000)
Delay in the start of measurement
Y
Ynn
Reference level for acceleration
(RefLev_a)
Xa
Xannn nnn reference level for acceleration given in
µms-2 ∈(1 ÷ 100)
Reference level for velocity
(RefLev_v)
Xv
Xvnnn nnn reference level for velocity
given in nms-1 ∈(1 ÷ 100)
Reference level for displacement
(RefLev_d)
Xd
Xdnnn nnn reference level for displacement given in
pm ∈(1 ÷ 100)
AutoSave option
XA
XA0 XA1 -
switched OFF
switched ON, file names are numbered
Saving results of statistical analysis
XS
XS0 XS1 -
switched off
switched on
Using the RAMfile instead of the
flash disk while storing results with
the AutoSave option switched on
XR
XR0 XR1 -
switched OFF
switched ON
External I/O Mode
x
x0 x1 x2 -
AC/Int. in Analogue mode
AC/Int. in Digital In mode
AC/Int. in Digital Out mode
External I/O Channel for analogue
AC/Int. mode
y
yn -
n - channel number between 1 and 4
State of the instrument
(Stop or Start)
S
S0 S1 -
STOP
START
Menu lock mode
Xb
Xb0 Xb1 Xb2 -
menu unlocked
menu partially locked
menu fully locked
Channel selection for vibration
vector calculation
XB
XB0:n - channel n is not included in vector
XB1:n - channel n is included in vector
Channel coefficient for vector
calculation
XC
XCxx:n - xx - value of coefficient *100 ∈(0 ÷ 200)
- n - channel number
Storing vector in logger file
XD
XD0 XD1 -
switched OFF
switched ON
Measurement of vibration dose
XE
XE0 XE1 -
switched OFF
switched ON
Vibration dose exposure time
XF
XFnn
nn - time in minutes ∈(0 ÷ 1440)
072-045 RevA
VI-410
- 24 - APPENDIX A
Functions and codes
XG
XG0 XG1 XG2 XG3 XG4 -
Great Britain
Italy
Poland
French
user defined
XH
XHn
n - channel number (1..4)
XI
XIn
n - channel number (1..4)
XJ
XJn
n - channel number (1..4)
Outdoor microphone correction for
channel n
XK
XK0:n - outdoor correction is OFF
XK1:n - outdoor correction is ON
Expose time for dosimeter
XL
XLnn
nn - time given in minutes
XM
XM0 XM1 XM2 XM3 -
80 dB
84 dB
85 dB
90 dB
Threshold level for dosimeter
XN
XN0 XN1 XN2 XN3 XN4 -
none
75 dB
80 dB
85 dB
90 dB
Exchange Rate level for dosimeter
XO
XOnn
nn - level given in dB ∈ [2,5]
Spectrum MAX store
XT
XT0
XT1
spectrum MAX switched OFF
spectrum MAX switched ON
Spectrum MIN store
Xt
Xt0
Xt1
spectrum MIN switched OFF
spectrum MIN switched ON
Trigger gradient level for SLM
Xg
Xgnn - nn – gradient level in dB/ms ∈ [1,100]
Trigger gradient level for VLM
Xh
Xgnn - nn – gradient level in dB/ms ∈ [1,100]
RTC trigger start time
Xr
Xrnn - nn – time in seconds ∈ [0,86399]
RTC trigger step time
Xs
Xs0 - use integration time for step
Xsnn - nn – step in seconds ∈ [1,86400]
Funtion for Digital In AC/Int. mode
XP
XP0 -
Vibration dose standard
X axis for vibration dose
measurement
Y axis for vibration dose
measurement
Z axis for vibration dose
measurement
Criterion Time level for dosimeter
072-045 RevA
trigger pulse
VI-410
- 25 -
APPENDIX A
Functions and codes
Funtion for Digital Out AC/Int. mode
XQ
XQ0 - trigger pulse
XQ1 - alarm pulse
AC/Int. polarization
XU
XU0 XU1 -
positive
negative
AC/Int. active level
XV
XV0 XV1 -
active low
active high
Vector alarm mode
Xc
Xc0:0 - OFF
Xc1:0 - SLOPE +
Xc2:0 - SLOPE –
Vector alarm step
Xe
Xe0:0 Xe1:0 Xe2:0 Xe3:0 -
Vector alarm level
Xf
Xfnnn:0 - nnn alarm level in dB*10
Xi
Xi0:P:K - OFF
Xi1:P:K - SLOPE +
Xi2:P:K - SLOPE –
P - profile number
K - number of alarm in profile
Xj
Xj0:P:K - OFF
Xj1:P:K - SLOPE +
Xj2:P:K - SLOPE –
P - profile number
K - number of alarm in profile
Xk
Xk0:P:K - logger step
Xk1:P:K - 100 ms
Xk2:P:K - 1 s
Xk3:P:K - integration period
P - profile number
K - number of alarm in profile
Xl
Xl0:P:K - logger step
Xl1:P:K - 100 ms
Xl2:P:K - 1 s
Xl3:P:K - integration period
P - profile number
K - number of alarm in profile
Profile alarm mode for VLM
Profile alarm mode for SLM
Integration period for VLM profile
alarm
Integration period for SLM profile
alarm
072-045 RevA
logger step
100 ms
1s
integration period
VI-410
- 26 - APPENDIX A
Functions and codes
Xm
Xm1:P:K - PEAK
Xm2:P:K - P–P
Xm3:P:K - MAX
Xm4:P:K - MIN
Xm5:P:K - RMS
Xm6:P:K - VDV
P - profile number
K - number of alarm in profile
Profile alarm source for SLM
Xn
Xn7:P:K - PEAK
Xn8:P:K - MAX
Xn9:P:K - MIN
Xm10:P:K - RMS
P - profile number
K - number of alarm in
Profile alarm level for VLM
Xo
XoN:P:K - N – level in dB*10
P - profile number
K - number of alarm in
Profile alarm level for SLM
Xp
XpN:P:K - N – level in dB*10
P - profile number
K - number of alarm in
Profile alarm source for VLM
1/1 OCTAVE alarm mode for VLM
1/1 OCTAVE alarm mode for SLM
1/1 OCTAVE period for VLM profile
alarm
072-045 RevA
XXa
XXa0:P:K - OFF
XXa1:P:K - SLOPE +
XXa2:P:K - SLOPE –
P - channel number
K - number of alarm in channel
XXb
XXb0:P:K - OFF
XXb1:P:K - SLOPE +
XXb2:P:K - SLOPE –
P - channel number
K - number of alarm in channel
XXc
XXc0:P:K - logger step
XXc1:P:K - 100 ms
XXc2:P:K - 1 s
XXc3:P:K - integration period
P - channel number
K - number of alarm in channel
VI-410
- 27 -
APPENDIX A
Functions and codes
XXd
XXd0:P:K - logger step
XXd1:P:K - 100 ms
XXd2:P:K - 1 s
XXd3:P:K - integration period
P - channel number
K - number of alarm in channel
XXe
XXe11:P:K - 1 Hz band
...
XXe25:P:K - 16 kHz band
P - channel number
K - number of alarm in channel
1/1 OCTAVE alarm source for SLM
XXf
XXf11:P:K - 1 Hz band
...
XXf25:P:K - 16 kHz band
P - channel number
K - number of alarm in channel
1/1 OCTAVE alarm level for VLM
XXg
XXgN:P:K - N – level in dB*10
P - channel number
K - number of alarm in channel
1/1 OCTAVE alarm level for SLM
XXh
XXhN:P:K - N – level in dB*10
P - channel number
K - number of alarm in channel
XXA
XXA0:P:K - OFF
XXA1:P:K - SLOPE +
XXA2:P:K - SLOPE –
P - channel number
K - number of alarm in channel
XXB
XXB0:P:K - OFF
XXB1:P:K - SLOPE +
XXB2:P:K - SLOPE –
P - channel number
K - number of alarm in channel
XXC
XXC0:P:K - logger step
XXC1:P:K - 100 ms
XXC2:P:K - 1 s
XXC3:P:K - integration period
P - channel number
K - number of alarm in channel
1/1 OCTAVE period for SLM profile
alarm
1/1 OCTAVE alarm source for VLM
1/3 OCTAVE alarm mode for VLM
1/3 OCTAVE alarm mode for SLM
1/3 OCTAVE alarm period for VLM
072-045 RevA
VI-410
- 28 - APPENDIX A
Functions and codes
XXD0:P:K - logger step
XXD1:P:K - 100 ms
XXD2:P:K - 1s
XXD3:P:K - integration period
P - channel number
K - number of alarm in channel
XXE11:P:K - 0.8 Hz band
...
XXE55:P:K - 20 kHz band
P - channel number
K - number of alarm in channel
XXF11:P:K - 0.8 Hz band
...
XXF55:P:K - 20kHz band
P - channel number
K - number of alarm in channel
1/3 OCTAVE alarm period for SLM
XXD
1/3 OCTAVE alarm source for VLM
XXE
1/3 OCTAVE alarm source for SLM
XXF
1/3 OCTAVE alarm level for VLM
XXG
XXGN:P:K - N – level in dB*10
P - channel number
K - number of alarm in channel
1/3 OCTAVE alarm level for SLM
XXH
XXHN:P:K - N – level in dB*10
P - channel number
K - number of alarm in channel
072-045 RevA
VI-410
Appendix B -1-
B. DATA FILE STRUCTURES
B.1.
STRUCTURE OF THE VI-410 PRO FILE
Each file containing data from the VI-4xx Pro instrument consists of several groups of words. In the
case of the VI-410 PRO there are some different types of files that contain:
• the measurement results from the Level Meter mode (cf. App. B.2);
• the results from 1/1 OCTAVE analysis (cf. App. B.3);
• the results from 1/3 OCTAVE analysis (cf. App. B.4);
• the results from the FFT analysis (cf. App. B.5);
• the results from the Level Meter mode stored in the file in the instrument’s buffer (cf. App. B.6 and
App. B.10);
• the results from 1/1 OCTAVE or 1/3 OCTAVE analysis stored in the file in the instrument’s buffer (cf.
App. B.7 and App. B.10);
• the results from the FFT analysis stored in the file in the instrument’s buffer (cf. App. B.8 and
App. B.10);
• the setup data of the instrument (cf. App.B.9);
•
•
•
Each file has the following elements:
a file header (cf. Tab. B.1.1);
the unit and internal software specification (cf. Tab. B.1.2);
the marker for the end of the file (cf. Tab. B.1.25).
The other elements of the file structure are not obligatory for each file type stated above. They
depend on the file type (LM, 1/1 OCTAVE, 1/3 OCTAVE or FFT analysis, file from the buffer, setup file).
These elements are as follows:
• the parameters and global settings, common for all channels (cf. Tab. B.1.3);
• the hardware settings for channels (cf. Tab. B.1.4);
• the software settings for channels (cf. Tab. B.1.5);
• the VECTOR measurement settings (cf. Tab. B.1.6);
• the 1/1 OCTAVE or 1/3 OCTAVE analysis header (cf. Tab. B.1.7);
• the hand-arm and whole-body vibration dose measurement settings (cf. Tab. B.1.9);
• the main results (cf. Tab. B.1.10);
• the selected statistical levels in channels (cf. Tab. B.1.11);
• the results coming from 1/1 OCTAVE analysis (cf. Tab. B.1.12);
• the results coming from 1/3 OCTAVE analysis (cf. Tab. B.1.13);
• the totals description in 1/1 octave or 1/3 octave analysis (cf. Tab. B.1.16);
• the user defined filter description (cf. Tab. B.1.17);
• the header of the FFT analysis (cf. Tab. B.1.8);
• the results of the FFT analysis (cf. Tab. B.1.14);
• the header of the statistical analysis (cf. Tab. B.1.18);
• the results of the statistical analysis (cf. Tab. B.1.19);
• the statistical analysis results the made in 1/1 OCTAVE or 1/3 OCTAVE mode (cf. Tab. B.1.20);
• the buffer header (cf. Tab. B.1.22);
• the 1/1 OCTAVE or 1/3 OCTAVE buffer header (cf. Tab. B.1.23);
• the data stored during the measurements in the buffer (cf. Tab. B.1.24);
• the setup data of the instrument (cf. Tab. B.1.26);
• the user defined filters (cf. Tab. B.1.27);
• the results coming from rotation measurements (cf. Tab. B.1.34);
• the SEAT measurements settings (cf. Tab. B.1.36);
• the Max results coming from 1/1 OCTAVE analysis (cf. Tab. B.1.37);
• the Min results coming from 1/1 OCTAVE analysis (cf. Tab. B.1.38);
• the Max results coming from 1/3 OCTAVE analysis (cf. Tab. B.1.39);
• the Min results coming from 1/3 OCTAVE analysis (cf. Tab. B.1.40).
Below, all file structure groups are described separately in Tab. B.1.1 ÷ Tab. B.1.40. The format
used in the columns, named Comment with the square parenthesis ( [xx, yy] ), means the contents of
B−
1
Appendix B
-2-
the word with xx is the most significant byte (MSB) and yy the least significant byte (LSB) of the word.
The format 0xnnnn means that the nnnn is four-digit number in hexadecimal form.
B−
2
Appendix B -3-
Table B.1.1. FILE HEADER
Word
number
0
Name / Value
Comment
0xnn01
[01, nn=header_length]
file or buffer name (8 characters)
if the name starts with two '@' characters, following 6 bytes contain
measurement date and time coded as BCD (each saved digit is
increased by one)
0x0000 - file containing results from buffer’s file
0x01nn - file containing measurements results
0x0200 - file containing instrument’s setup data
1..4
FileName
5
FileType
6
7
8..11
CurrentDate
CurrentTime
AssBufFileName
file creation date
file creation time
name of the associated buffer or file (8 bytes)
Table B.1.2. UNIT AND SOFTWARE SPECIFICATION
Word
number
0
1
2
3
4
5
6
7
Name / Value
Comment
0xnn02
UnitNumber
UnitType
SoftwareVersion
SoftwareIssueDate
UnitSubtype
FilesystemVersion
LevelMeterVersion
[02, nn=specification_length]
unit number
unit type: 958
software version * 100
software issue date
unit subtype: 1
filesystem version * 100
meter software version * 100
Table B.1.3. PARAMETERS AND GLOBAL SETTINGS
Word
number
0
1
2
0xnn04
CycleStartDate
CycleStartTime
3
DeviceFunction
4
UnitFlags
Name / Value
Comment
[04, nn=block_length]
measurement cycle start date
measurement cycle start time
1 - LEVEL METER, 2 - 1/1 OCTAVE analyser,
3 - 1/3 OCTAVE analyser, 4 - sound DOSEMETER,
6 - FFT analyser
flags word (16 bits): b15 ... b3 b2 b1 b0
b0 - if set to 1: calibration coefficient is used
b1 - if set to 1: overload occurred
b2 - if set to 1: "Human vibrations" excluded (0 - means "Human
vibrations" included and then VDV result is present)
b5,b4,b3: type of the result Result[p][7] (p = 1,2,3,4)
000 - Lden result is not available
001 - Ld result
010 - Le result
011 - Lde result
100 - Ln result
101 - Lnd result
110 - Len result
111 - Lden result
th
b6 - if set to 1: overload occurred in the 4 channel
rd
b7 - if set to 1: overload occurred in the 3 channel
nd
b8 - if set to 1: overload occurred in the 2 channel
st
b9 - if set to 1: overload occurred in the 1 channel
b10, ..., b15 - reserved
B−
3
Appendix B
-4-
5
RepCycle
6
StartDelay
7..8
IntTimeSec
9
TriggerChannel
10
TriggerMode
11
TriggerSource
12
TriggerLev
13
VecTriggerLev
14
TriggerPre
15
TriggerPost
16
17
18
19
20
21
22
23
24
LeqInt
Reserved
RefLev_a
RefLev_v
RefLev_d
NofChannels
NofProfiles
NotSpect
LowesTerFreq
25
CalibrType
26
27
28
29
30
31
32
33
34
35
CalibrDate
CalibrTime
TriggerGrad
DoseExposureTime
DoseCriterionLev
DoseTresholdLev
DoseExchangeRate
RPM_On
RPM_Pulse
RPM_Buffer
CycleMeasurementStar
tDate
CycleMeasurementStar
tTime
36
37..38
0 - infinity
nnnn - number of repetitions ∈(1 ÷ 1000)
start delay time specified in milliseconds ∈(1 ÷ 60000)
0 - infinity
integration time specified in seconds
source channel of the triggering signal:
st
th
0 (the 1 channel) .. 3 (the 4 channel)
trigger mode: 0 - OFF, 1 - SLOPE +, 2 - SLOPE -,
3 - LEVEL +, 4 - LEVEL -, 5 - BUFFER, 6 - GRADIENT +, 7 - RTC
source of the triggering signal:
0 - the VEC result
1 - the VEC result and RMS(1) result from selected channel
2 - the RMS(1) result from the selected channel
3 - the External trigger
in the case of 1/1 OCTAVE analyser:
nn - number of 1/1 OCTAVE filter ∈(8 ÷ NOct)
in the case of 1/3 OCTAVE analyser
nn - number of TOTAL LIN result (48)
level of triggering:
24..136 dB in the case of source channel set in Sound Meter mode,
60..200 dB in the case of source channel in Vibration Meter mode
level of triggering for VEC result: 60..200 dB
number of the records taken into account before the fulfilment of the
triggering condition ∈(1 ÷ 20)
number of the records taken into account after the fulfilment of the
triggering condition ∈(1 ÷ 200)
detector's type in the LEQ function: 0 - LINEAR, 1 - EXPONENT.
reserved
-2
reference level for acceleration given in µms ∈(1 ÷ 100)
-1
reference level for velocity given in nms ∈(1 ÷ 100)
reference level for displacement given in pm ∈(1 ÷ 100)
number of channels (4)
number of profiles (12)
number of spectrum (4)
the lowest possible 1/3 octave frequency (*100Hz)
calibration type: 0 - calibration not performed
1 - calibration by measurement
2 - calibration by sensitivity
date of the last calibration
time of the last calibration
the gradient level for gradiend trigger mode
exposure time for dosemeter function (min.)
Criterion level (*100dB)
Threshold level (*100dB)
Exchange Rate (dB)
RPM measurement: 0 - switched off; 1 - switched on
Pulses per rotation ∈(1 ÷ 360)
RPM results buffering: 0 - switched off; 1 - switched on
measure start date
measure start time
Table B.1.4. HARDWARE SETTINGS FOR CHANNELS
Word
number
0
Name / Value
Comment
0xnn05
[05, nn=block_length]
B−
4
Appendix B -5-
1
0x0706
2
ChannelMode[1]
3
CalibrFactor[1]
4
Range[1]
5
6
7
Reserved
MicFieldCorr[1]
MicOutdoor[1]
8
0x0706
9
ChannelMode[2]
10
CalibrFactor[2]
11
Range[2]
12
13
14
Reserved
MicFieldCorr[2]
MicOutdoor[2]
15
0x0706
16
ChannelMode[3]
17
CalibrFactor[3]
18
Range[3]
19
20
21
Reserved
MicFieldCorr[3]
MicOutdoor[3]
22
0x0706
23
ChannelMode[4]
24
CalibrFactor[4]
25
Range[4]
26
27
28
Reserved
MicFieldCorr[4]
MicOutdoor[4]
[06, 07=subblock_length]
st
mode of the 1 channel
0 - Vibration Level Meter / Analyser
1 - Sound Level Meter / Analyser
st
calibration factor (*10 dB) in the 1 channel
st
range in the 1 channel
1 - 105 dB, 2 - 130 dB in the case of SLM
-2
-2
1 - 17.8 ms , 2 - 316 ms in the case of VLM
reserved
field correction: 0 - FREE, 1 - DIFFUSE in the case of SLM
outdoor microphone kit correction: 1 - enabled in the case of SLM
[06, 07=subblock_length]
nd
mode of the 2 channel:
0 - Vibration Level Meter / Analyser
1 - Sound Level Meter / Analyser
nd
calibration factor (*10 dB) in the 2 channel
nd
range in the 2 channel:
1 - 105 dB, 2 - 130 dB in the case of SLM
-2
-2
1 - 17.8 ms , 2 - 316 ms in the case of VLM
reserved
field correction: 0 - FREE, 1 - DIFFUSE in the case of SLM
outdoor microphone kit correction: 1 - enabled in the case of SLM
[06, 07=subblock_length]
rd
mode of the 3 channel:
0 - Vibration Level Meter / Analyser
1 - Sound Level Meter / Analyser
rd
calibration factor (*10 dB) in the 3 channel
rd
range in the 3 channel:
1 - 105 dB, 2 - 130 dB in the case of SLM
-2
-2
1 - 17.8 ms , 2 - 316 ms in the case of VLM
reserved
field correction: 0 - FREE, 1 - DIFFUSE in the case of SLM
outdoor microphone kit correction: 1 - enabled in the case of SLM
[06, 07=subblock_length]
th
mode of the 4 channel:
0 - Vibration Level Meter / Analyser
1 - Sound Level Meter / Analyser
th
calibration factor (*10 dB) in the 4 channel
th
range in the 4 channel:
1 - 105 dB, 2 - 130 dB in the case of SLM
-2
-2
1 - 17.8 ms , 2 - 316 ms in the case of VLM
reserved
field correction: 0 - FREE, 1 - DIFFUSE in the case of SLM
outdoor microphone kit correction: 1 - enabled in the case of SLM
Table B.1.5. SOFTWARE SETTINGS FOR CHANNELS
Word
number
0
1
Name / Value
Comment
0xnn07
0x040C
[07, nn=block_length]
[used_channel, used profile]
ProfileSett[1]
first profile settings for the 1 channel, defined
in Table B.1.5_SLM in the case of SLM mode or
in Table B.1.5_VLM in the case of VLM mode (see below)
st
2..7
B−
5
Appendix B
-6nd
8..13
ProfileSett[2]
first profile settings for the 2 channel, defined
in Table B.1.5_SLM in the case of SLM mode or
in Table B.1.5_VLM in the case of VLM mode
ProfileSett[3]
first profile settings for the 3 channel, defined
in Table B.1.5_SLM in the case of SLM mode or
in Table B.1.5_VLM in the case of VLM mode
ProfileSett[4]
first profile settings for the 4 channel, defined
in Table B.1.5_SLM in the case of SLM mode or
in Table B.1.5_VLM in the case of VLM mode
ProfileSett[5]
second profile settings for the 1 channel, defined
in Table B.1.5_SLM in the case of SLM mode or
in Table B.1.5_VLM in the case of VLM mode (see below)
ProfileSett[6]
second profile settings for the 2 channel, defined
in Table B.1.5_SLM in the case of SLM mode or
in Table B.1.5_VLM in the case of VLM mode
ProfileSett[7]
second profile settings for the 3 channel, defined
in Table B.1.5_SLM in the case of SLM mode or
in Table B.1.5_VLM in the case of VLM mode
ProfileSett[8]
second profile settings for the 4 channel, defined
in Table B.1.5_SLM in the case of SLM mode or
in Table B.1.5_VLM in the case of VLM mode
ProfileSett[9]
third profile settings for the 1 channel, defined
in Table B.1.5_SLM in the case of SLM mode or
in Table B.1.5_VLM in the case of VLM mode (see below)
ProfileSett[10]
third profile settings for the 2 channel, defined
in Table B.1.5_SLM in the case of SLM mode or
in Table B.1.5_VLM in the case of VLM mode
rd
14..19
th
20..25
st
26..31
nd
32..37
rd
38..43
th
44..49
st
50..55
nd
56..61
rd
62..67
ProfileSett[11]
third profile settings for the 3 channel, defined
in Table B.1.5_SLM in the case of SLM mode or
in Table B.1.5_VLM in the case of VLM mode
th
68..73
ProfileSett[12]
third profile settings for the 4 channel, defined
in Table B.1.5_SLM in the case of SLM mode or
in Table B.1.5_VLM in the case of VLM mode
Table B.1.5_SLM. SOFTWARE SETTINGS FOR A CHANNEL IN THE CASE OF SLM MODE
Word
number
0
1
2
3
Name / Value
0xnn08
ChannelNo
FilterP
DetectorP
4
BufferP
5
ProfileFlags
Comment
[08, nn=block_length]
number of channel: 0 - first channel
filter type in the channel: 1 - LIN, 2 - A, 3 - C, 4 – G
detector type in the channel: 0 - IMP., 1 - FAST, 2 – SLOW
buffer contents in the channel defined as a sum of :
1 - for PEAK results, 2 - for MAX results,
4 - for MIN results, 8 - for RMS results,
flags word (16 bits): b15 ... b3 b2 b1 b0
b0 - if set to 1: profile results have been calculated
b1 ... b15 – reserved
B−
6
Appendix B -7-
Table B.1.5_VLM. SOFTWARE SETTINGS FOR A CHANNEL IN THE CASE OF VLM MODE
Word
number
0
1
Name / Value
0xnn08
ChannelNo
2
FilterP
3
DetectorP
4
BufferP
5
ProfileFlags
Comment
[08, nn=subblock_length]
st
channel number: 0 - the 1 channel
filter type in the channel: 1 - HP1, 2 - HP3, 3 - HP10, 4 - Vel1,
5 - Vel3, 6 - Vel10, 7 - VelMF, 8 - Dil1, 9 - Dil3, 10 - Dil10,
15 - KB, 16 - Wk, 17 - Wd, 18 - Wc, 19 - Wj, 20 - Wm, 21 - Wh,
22 - Wg, 23 - Wb
detector type in the channel: 0 - 100 ms, 1 - 125 ms, 2 - 200 ms,
3 - 500 ms, 4 - 1 s, 5 - 2 s, 6 - 5 s, 7 - 10 s
buffer contents in the channel defined as a sum of:
1 - for PEAK results, 2 - for P–P results,
4 - for MAX results, 8 - for RMS results, 16 - for VDV results
flags word (16 bits): b15 ... b3 b2 b1 b0
b0 - if set to 1: profile results have been calculated
b1 ... b15 – reserved
Table B.1.6. VECTOR MEASUREMENT SETTINGS
Word
number
0
1
2
3
4
5
6
7
8
9
10
Name / Value
Comment
0xnn1E
VectorBufferP
VectorCoeff[1]
VectorCoeff[2]
VectorCoeff[3]
VectorCoeff[4]
VectorOn[1]
VectorOn[2]
VectorOn[3]
VectorOn[4]
VectorResult
[1E, nn=subblock_length]
vector result buffering: 0 - OFF, 1 - ON
st
vector coefficient for the RMS value from the 1 channel (*100)
nd
vector coefficient for the RMS value from the 2 channel (*100)
rd
vector coefficient for the RMS value from the 3 channel (*100)
th
vector coefficient for the RMS value from the 4 channel (*100)
st
RMS value from the 1 channel used for calculation: 0 - no, 1 - yes
nd
RMS value from the 2 channel used for calculation: 0 - no, 1 - yes
rd
RMS value from the 3 channel used for calculation: 0 - no, 1 - yes
th
RMS value from the 4 channel used for calculation: 0 - no, 1 - yes
VECTOR result value (*100 dB)
Table B.1.7. OCTAVES ANALYSIS HEADER
Word
number
0
1
Name / Value
Comment
0xnn09
0xkknn
[09, nn=block_length]
[nn=spectrum_mask, kk=used_spectrum]
2..5
OctaveHead[1]
…
2+4*used_
spectrum..
5+4*used_
spectrum
…
OctaveHead[used_spe
ctrum]
header of the first enabled octave analysis, defined
in Table B.1.7_SLM in the case of SLM mode or
in Table B.1.7_VLM in the case of VLM mode (see below)
…
header of the last enabled octave analysis, defined
in Table B.1.7_SLM in the case of SLM mode or
in Table B.1.7_VLM in the case of VLM mode
Table B.1.7_SLM. OCTAVE ANALYSIS HEADER IN THE CASE OF SLM MODE
Word
number
0
1
2
3
Name / Value
Comment
0xnn0A
SpectrumChannel
SpectrumFilter
SpectrumBuff
[0A, nn=subblock length]
spectrum channel
1/1 or 1/3 OCTAVE analysis filter: 0 - HP, 1 - LIN, 2 - A, 3 - C
1/1 or 1/3 OCTAVE buffering: 1 - ON, 0 - OFF
B−
7
Appendix B -8-
Table B.1.7_VLM. OCTAVE ANALYSIS HEADER IN THE CASE OF VLM MODE
Word
number
0
1
2
3
Name / Value
Comment
0xnn0A
SpectrumChannel
SpectrumFilter
SpectrumBuff
[0A, nn=subblock length]
spectrum channel
1/1 or 1/3 OCTAVE analysis filter: 0 - HP
1/1 or 1/3 OCTAVE buffering: 1 - ON, 0 - OFF
Table B.1.8. HEADER OF THE FFT ANALYSIS
Word
number
0
1
Name / Value
Comment
0xnn0B
0xkkmm
[0B, nn=block_length] nn=2+NumberOfEnabledFFTs*12
[mm=spectrum_mask,kk=spectrum_count]
2..13
FFTHeader[1]
header of the first enabled FFT analysis, defined
in Table B.1.8_SLM in the case of SLM mode or
in Table B.1.8_VLM in the case of VLM mode (see below)
…
…
2+spectru
m_count*1
FFTHeader[spectrum_c
2..13+spec
ount]
trum_coun
t*12
header of the last enabled FFT analysis, defined
in Table B.1.8_SLM in the case of SLM mode or
in Table B.1.8_VLM in the case of VLM mode
Table B.1.8_SLM. HEADER OF THE FFT ANALYSIS IN ONE CHANNEL SLM MODE
Word
number
0
1
2
3
4
5
6
Name / Value
Comment
0xnn0C
FFTChannel
FFTFilter
FFTBuff
LowestFreqNo
NFft
NFftTot
7
FftBand
8
FftWindow
9
10..11
12
13
FftAverag
FftSampFreq
FftWFactor
FftLines
[0C, nn=block_length]
channel of FFT analysis
FFT analysis filter: 0 - HP, 1 - LIN, 2 - A, 3 - C
FFT buffering: 1 - ON, 0 - OFF
number of the first line in the FFT spectrum = 0
number of lines in the spectrum = 1921, 961 or 481
number of TOTAL lines in the spectrum = 1
band of the FFT analysis: 1 – 22.4 kHz, 2 – 11.2 kHz, 3 – 5.6 kHz,
4 - 2.8 kHz, 5 - 1.4 kHz, 6 - 700 Hz, 7 - 350 Hz, 8 - 175 Hz,
9 – 87.5 Hz
window in the FFT analysis: 0 - HANNING,1 - RECTANGLE,
2 - FLAT TOP, 3 - KAISER-BESSEL
type of averaging in the FFT analysis: 0 - LINEAR
sampling frequency
Window coefficient
number of lines: 0 - 1920 lines, 1 - 960 lines, 2 - 480 lines
Table B.1.8_VLM. HEADER OF THE FFT ANALYSIS IN ONE CHANNEL VLM MODE
Word
number
0
1
2
3
4
5
Name / Value
Comment
0xnn0C
FFTChannel
FFTFilter
FFTBuff
LowestFreqNo
NFft
[0C, nn=block_length]
channel of FFT analysis
FFT analysis filter: 0 - HP
FFT buffering: 1 - ON, 0 - OFF
number of the first line in the FFT spectrum = 0
number of lines in the spectrum = 1921, 961 or 481
B−
8
Appendix B -9-
6
NFftTot
7
FftBand
8
FftWindow
9
10..11
12
13
FftAverag
FftSampFreq
FftWFactor
FftLines
number of TOTAL lines in the spectrum = 1
band of the FFT analysis: 1 – 22.4 kHz, 2 – 11.2 kHz, 3 – 5.6 kHz,
4 - 2.8 kHz, 5 - 1.4 kHz, 6 - 700 Hz, 7 - 350 Hz, 8 - 175 Hz,
9 – 87.5 Hz
window in the FFT analysis: 0 - HANNING,1 - RECTANGLE,
2 - FLAT TOP, 3 - KAISER-BESSEL
type of averaging in the FFT analysis: 0 - LINEAR
sampling frequency
Window coefficient
number of lines: 0 - 1920 lines, 1 - 960 lines, 2 - 480 lines
Table B.1.9. SETTINGS FOR VIBRATION DOSE MEASUREMENT
Word
number
0
1
Name / Value
Comment
0xnn1F
xxyy
[1F, nn=block_length]
[yy=channel of Y axis-1 ,xx=channel of X axis-1]
[zz=channel of Z axis-1, nn]
nn=1 for Hand-Arm measurement,
nn=2 for Whole-Body measurement
exposure time in minutes
standard: 0 - UK, 1 - Italy, 2 - Poland, 3 - French, 4 - User
2
nnzz
3
4
ExposureTime
Standard
Table B.1.10. MAIN RESULTS
Word
number
0
1
Name / Value
Comment
0xnn0D
0x040C
[0D, nn=subblock_length]
[used_channel, used profiles]
st
main results from first profile of the 1 channel, defined
in Table B.1.10_SLM in the case of SLM mode or
in Table B.1.10_VLM in the case of VLM mode (see below)
nd
main results from first profile of the 2 channel, defined
in Table B.1.10_SLM in the case of SLM mode or
in Table B.1.10_VLM in the case of VLM mode
rd
main results from first profile of the 3 channel, defined
in Table B.1.10_SLM in the case of SLM mode or
in Table B.1.10_VLM in the case of VLM mode
th
main results from first profile of the 4 channel, defined
in Table B.1.10_SLM in the case of SLM mode or
in Table B.1.10_VLM in the case of VLM mode
st
main results from second profile of the 1 channel, defined
in Table B.1.10_SLM in the case of SLM mode or
in Table B.1.10_VLM in the case of VLM mode (see below)
nd
main results from second profile of the 2 channel, defined
in Table B.1.10_SLM in the case of SLM mode or
in Table B.1.10_VLM in the case of VLM mode
rd
main results from second profile of the 3 channel, defined
in Table B.1.10_SLM in the case of SLM mode or
in Table B.1.10_VLM in the case of VLM mode
th
main results from second profile of the 4 channel, defined
in Table B.1.10_SLM in the case of SLM mode or
in Table B.1.10_VLM in the case of VLM mode
st
main results from third profile of the 1 channel, defined
in Table B.1.10_SLM in the case of SLM mode or
in Table B.1.10_VLM in the case of VLM mode (see below)
nd
main results from third profile of the 2 channel, defined
in Table B.1.10_SLM in the case of SLM mode or
in Table B.1.10_VLM in the case of VLM mode
2..15
MainResults[1]
16..29
MainResults[2]
30..43
MainResults[3]
44..57
MainResults[4]
58..71
MainResults[5]
72..85
MainResults[6]
86..99
MainResults[7]
100..113
MainResults[8]
114..127
MainResults[9]
128..141
MainResults[10]
B−
9
Appendix B
-10rd
142..155
MainResults[11]
156..169
MainResults[12]
main results from third profile of the 3 channel, defined
in Table B.1.10_SLM in the case of SLM mode or
in Table B.1.10_VLM in the case of VLM mode
th
main results from third profile of the 4 channel, defined
in Table B.1.10_SLM in the case of SLM mode or
in Table B.1.10_VLM in the case of VLM mode
Table B.1.10_SLM. ONE PROFILE MAIN RESULTS IN THE CASE OF SLM MODE
Word
Name / Value
Comment
number
0
0xnn0E
[0E, nn=subblock_length]
st
time of the measurement in the channel (if the 1 profile in channel)
1..2
MeasureTime
overload time in the channel (if second profile in channel)
PEAK value in the profile (*100 dB)
3
Result[1]
4
Result[2]
reserved
minimal value (MIN) in the profile (*100 dB)
5
Result[3]
SPL value in the profile (*100 dB)
6
Result[4]
maximal value (MAX) in the profile (*100 dB)
7
Result[5]
Lden value in the profile (*100 dB)
8
Result[6]
(depends on UnitFlags bits: b3, b4, b5)
LEQ value in the profile (*100 dB)
9
Result[7]
Ltm3 value in the profile (*100 dB)
10
Result[8]
Ltm5 value in the profile (*100 dB)
11
Result[9]
Lav value in the profile (*100dB), (the result enable only dosemeter
12
Result[10]
function)
TLav value in the profile (*100dB), (the result enable only
13
Result[11]
dosemeter function)
Table B.1.10_VLM. ONE PROFILE MAIN RESULTS IN THE CASE OF VLM MODE
Word
Name / Value
Comment
number
[0E, nn=subblock_length]
0
0xnn0E
st
time of the measurement in the channel(if the 1 profile in channel)
1..2
MeasureTime
overload time in the channel (if second profile in channel)
PEAK value in the profile (*100 dB)
3
Result[1]
P–P value in the profile (*100 dB)
Result[2]
5
Result[3]
reserved
6
Result[4]
reserved
MTVV (or MAX) value in the profile (*100 dB)
7
Result[5]
VDV value in the profile (if UnitFlags bit b2 is set to 0) (*100 dB)
8
Result[6]
RMS value in the profile (*100 dB)
9
Result[7]
10
Result[8]
reserved
11
Result[9]
reserved
12
Result[10]
reserved
13
Result[11]
reserved
Table B.1.11. SELECTED STATISTICAL LEVELS IN CHANNELS
Word
Name / Value
Comment
number
[19, nn=block_length]
0
0xnn19
[mm=channel_mask,cc=
used_channels]
1
0xccmm
number of statistical levels per channel = 10
2
NStatLevs
3
4
N1
N2
N1 value for the LN1 statistics ∈(1 ÷ 99)
N2 value for the LN2 statistics ∈(1 ÷ 99)
B−
10
Appendix B -11-
5
6
7
8
9
10
11
12
13
14
…
N3
N4
N5
N6
N7
N8
N9
N10
LN1[1]
LN2[1]
…
22
23
...
block_lengt
h-1
LN10[1]
LN1[2]
...
LN10[used_chan
nels]
N3 value for the LN3 statistics ∈(1 ÷ 99)
N4 value for the LN4 statistics ∈(1 ÷ 99)
N5 value for the LN5 statistics ∈(1 ÷ 99)
N6 value for the LN6 statistics ∈(1 ÷ 99)
N7 value for the LN7 statistics ∈(1 ÷ 99)
N8 value for the LN8 statistics ∈(1 ÷ 99)
N9 value for the LN9 statistics ∈(1 ÷ 99)
N10 value for the LN10 statistics ∈(1 ÷ 99)
st
value of the LN1 statistics (*10 dB) for the 1 channel in SLM mode
st
value of the LN2 statistics (*10 dB) for the 1 channel in SLM mode
…
st
value of the LN10 statistics (*10 dB) for the 1 channel in SLM mode
nd
value of the LN1 statistics (*10 dB) for the 2 channel in SLM mode
...
value of the LN10 statistics (*10 dB)
for the last channel in SLM mode
Table B.1.12. ONE CHANNEL 1/1 OCTAVE ANALYSIS RESULTS
Word
Name / Value
Comment
number
[0F, nn=block_length]
0
0xnn0F
the lowest 1/1 OCTAVE frequency (*100 Hz)
1
LowestFreq
number of 1/1 OCTAVE values
2
Noct
number of TOTAL values = 3
3
NoctTot
4…
block_leng
th
Octave[i]
1/1 octave[i] value (*100 dB); i=1..NOct+NOctTot
Note: The TOTAL values, calculated in the case of sound measurements, correspond to the
A, C and LIN filters – respectively. The TOTAL values, calculated in the case of vibration measurements,
correspond to the HP, CH and CH filters – respectively, where CH denotes the filter used in the channel
for Level Meter measurement.
Table B.1.13. ONE CHANNEL 1/3 OCTAVE ANALYSIS RESULTS
Word
Name / Value
Comment
number
[10, nn=block_length]
0
0xnn10
the
lowest
1/3
OCTAVE frequency (*100 Hz)
1
LowestFreq
number of 1/3 OCTAVE values
2
Nter
number of TOTAL values = 3
3
NterTot
4...
block_leng
th
Tercje[I]
1/3 octave[i] value (*100 dB); i=1..NTer+NTerTot
Note: The TOTAL values, calculated in the case of sound measurements, correspond to the
A, C and LIN filters – respectively. The TOTAL values, calculated in the case of vibration measurements,
correspond to the HP, CH and CH filters – respectively, where CH denotes the filter used in the channel
for Level Meter measurement.
Table B.1.14. ONE CHANNEL FFT ANALYSIS RESULTS
B−
11
Appendix B -12-
Word
number
Name / Value
0
0x0011
1
2..2+NFft
+ NFftTot
FftBlockLength
FFT[i]
Comment
[11, 0 (block is longer than 256 words, the length is given in the
second word)]
2 + NFft + NFftTot
value of the FFT line (*100 dB); i = 1..1..NFft + NFftTot
Table B.1.15. ONE CHANNEL TOTALS DESCRIPTION
Word
number
0
1
Name / Value
Comment
0xnn1B
SpectChannel
[1B, nn=block_length = 1 + Ntotal*4 (words)]
spectrum channel
2
FilterNo[1]
3
FilterType[1]
4
calFactor[1]
5
TotValue[1]
…
…
nn-4
FilterNo[Ntotal]
nn-3
FilterType[Ntotal]
nn-2
calFactor[Ntotal]
nn-1
TotValue[Ntotal]
logical filter no. for the first total value
0, 1, 2 - standard filters
3,… - user defined filters
for sound: 0
for vibration: 0 - ACC., 1 - VEL., 2 - DIL.
calibration factor used to modify the computed TOTAL value
TOTAL value computed for the filter with logical no. FilterNo or
zero value for standard filter
…
logical filter no. for the last total value
0, 1, 2 - standard filters
3,… - user defined filters
for sound: 0
for vibration: 0 - ACC., 1 - VEL., 2 - DIL.
calibration factor used to modify the computed TOTAL value
TOTAL value computed for the filter with logical no. FilterNo or
zero value for standard filter
Table B.1.16. TOTALS DESCRIPTION
Word
number
0
1...
1+4*Ntotal
…
Name / Value
Comment
0xnn1A
[1A, nn=block_length = 1+(1 + Ntotal*4)*k (words)]
One channel totals description block for the first channel
with USER FILTER TOTALS (Table B.1.15.)
…
One channel totals description block for the last channel
with USER FILTER TOTALS (Table B.1.15.)
OneChnlTotDesc[1]
…
OneChnlTotDesc[k]
Note: This data block is created only in the case when the file was saved for 1/1 OCTAVE or
1/3 OCTAVE analysis and the TOTAL values were calculated for the filters selected by the user
(USER FILTERS). The TOTAL values corresponding to those filters are given in the TotValue positions
and the definitions of the proper filters are presented in the Table B.1.17.
Table B.1.17. USER DEFINED FILTER DESCRIPTION
Word
number
0
Name / Value
Comment
0xnn1D
[1D, nn=block_length = 5 + NTer (words)]
FilerNo as saved
in ONE CHANNEL TOTALS DESCRIPTION Table (B.1.15)
filter name (up to 5 letters, zero-ending string)
filter value (*10 dB) corresponding to the 1/3 octave[i] position;
i=1..NTer (1..45)
1
FilterNo
2..4
FilterName
5..49
FilterVal[i]
B−
12
Appendix B -13-
Note: Such data block is created for each filter with the logical number FilterNo greater or
equal to 3, expressed in the TOTALS DESCRIPTION block (cf. Tab. B.1.15 and Tab B.1.16). The
description of the filter with the logical number FilterNo is given only once, disregarding the number of
FilterNo repetition in Tab. B.1.15.
Table B.1.18. STATISTICS IN CHANNELS HEADER
Word
number
0
1
Name / Value
Comment
0xnn12
0xccmm
[12, nn=block_length=2+4*used_channels ]
[mm=channels_mask, cc=used_channels]
2
3
4
5
0x0413
NofClasses[1]
BottomClass[1]
ClassWidth[1]
[13, 04=subblock_length]
st
number of classes in the 1 channel in SLM mode (100)
st
bottom class boundary (*10 dB) in the 1 channel in SLM mode
st
class width (*10 dB) in the 1 channel in SLM mode
…
…
…
0x0413
[13, 04=subblock_length]
block_
length-4
block_
length-3
block_
length-2
block_
length-1
NofClasses[used_
channels]
BottomClass[used_
channels]
ClassWidth[used_
channels]
number of classes in the last channel in SLM mode (100)
bottom class boundary (*10 dB) in the last channel in SLM mode
class width (*10 dB) in the last channel in SLM mode
Table B.1.19. RESULTS OF THE STATISTICAL ANALYSIS IN ONE CHANNEL
Word
number
0
1
2
3..4
5..6
.....
Name / Value
Comment
0x0014
SubblockLength
ChannelNo
Histogram[1]
Histogram[2]
.....
[14, 00=block length in next word]
2 * number of classes in the channel + 3
channel number minus 1
st
the 1 counter in the channel
nd
the 2 counter in the channel
.....
Table B.1.20. RESULTS OF THE STATISTICAL ANALYSIS PERFORMED IN 1/1 OCTAVE OR
1/3 OCTAVE MODE
Word
number
0
1
2
Name / Value
Comment
0x0015
BlockLength
0xccmm
[15, 00=block length in the next word]
Block length
[mm=spectrum_mask, cc=used_spectrum]
results of the statistical analysis performed
st
in the 1 channel in SLM mode (defined in Table B.1.21.)
....
results of the statistical analysis performed
in the last channel in SLM mode (defined in Table B.1.21.)
3..
OctStatRes[1]
....
.…
OctStatRes[used_
spectrum]
Table B.1.21. RESULTS OF THE STATISTICAL ANALYSIS PERFORMED IN 1/1 OCTAVE OR
1/3 OCTAVE MODE IN ONE CHANNEL
B−
13
Appendix B
Word
number
0
1
-14-
Name / Value
Comment
0x0016
BlockLength
2
NofHist
3
4
5
NofClasses
BottomClass
ClassWidth
[16, 00=block length in next word]
BlockLength=2*NofHist*NofClass+6
number of histogramms (number of 1/1 OCTAVE or 1/3 OCTAVE
filters and TOTAL values (3))
number of classes in the histogramm (100)
bottom class boundary (*10 dB)
class width (*10 dB)
6..7
8..9
.....
Histogram[1][1]
Histogram[1][2]
.....
the 1 counter for the first 1/1 OCTAVE or 1/3 OCTAVE filter
nd
the 2 counter for the first 1/1 OCTAVE or 1/3 OCTAVE filter
.....
st
6+2 * Nof
Classes…
7+2 * Nof
Classes
...
.....
Histogram[2][1]
the 1 counter for the second 1/1 OCTAVE or 1/3 OCTAVE filter
Histogram[2][2]
.....
the 2
.....
.....
.....
...
…
.....
Histogram[NofHist][1]
Histogram[NofHist][2]
.....
the 1 counter for the last 1/1 OCTAVE or 1/3 OCTAVE filter
nd
the 2 counter for the last 1/1 OCTAVE or 1/3 OCTAVE filter
.....
st
nd
counter for the second 1/1 OCTAVE or 1/3 OCTAVE filter
.....
st
Table B.1.22. HEADER OF THE FILE FROM THE BUFFER
Word
number
0
1
2
3
4..5
6..7
8..9
Name / Value
Comment
0xnn18
BufResOffs
BuffTSec
BuffTMilisec
BuffLength
RecsInBuff
[18, nn=header_length]
position of the first saved result
buffer time step - full seconds part
buffer time step - milliseconds part
buffer length (bytes)
number of records in the buffer
number of records in the observation period equal to:
number of records in the buffer + number of records not saved
RecsInObserv
Note: The current buffer time step in seconds can be obtained from the formulae:
T = BuffTSec + BuffTMilisec / 1000.
Table B.1.23. SPECTRUM HEADER OF THE FILE FROM THE BUFFER
Word
number
0
Name / Value
Comment
0xnn21
[21, nn=block_length=1+4*NumberOfBufferedSpectrums ]
1
ChannelNo
2
LowestFreq
3
NSpectRes
4
NTotal
channel number of the first buffered spectrum minus 1
the lowest 1/1 OCTAVE or 1/3 OCTAVE frequency (*100 Hz)
of the first buffered spectrum or
0 in the case of FFT
number of 1/1 OCTAVE or 1/3 OCTAVE or FFT results
of the first buffered spectrum
number of TOTAL values of the first buffered spectrum
…
…
…
B−
14
Appendix B -15-
block_
length-4
ChannelNo
block_
length-3
LowestFreq
block_
length-2
block_
length-1
NSpectRes
NTotal
channel number of the last buffered spectrum minus 1
the lowest 1/1 OCTAVE or 1/3 OCTAVE frequency (*100 Hz)
of the last buffered spectrum or
0 in the case of FFT
number of 1/1 OCTAVE or 1/3 OCTAVE or FFT results
of the last buffered spectrum
number of TOTAL values of the last buffered spectrum
Table B.1.24. CONTENTS OF THE FILE FROM THE BUFFER
Word number
Name / Value
0..(BuffLength/2-1)
Comment
result#1, result#2, ... result#(BuffLength/2-1)
Table B.1.25. FILE END MARKER
Word
number
0
Name / Value
Comment
0xFFFF
file end marker
Table B.1.26. INSTRUMENT’S SETUP DATA BLOCK
Word
number
0
1
2..BlockLe
ngth-1
Name / Value
Comment
0x0020
BlockLength
[20, 00=block lenght in the next word]
Block length
SetupData
saved setup values
Table B.1.27. USER FILTERS BLOCK IN INSTRUMENT’S SETUP DATA FILE
Word
number
0
1
2..BlockLe
ngth-1
Name / Value
Comment
0x0027
BlockLength
[27, 00=block length in the next word]
block length
FilterData
saved user filters values
Table B.1.34. THE RESULTS OF ROTATION SPEED MEASUREMENT
Word
number
0
1
2
3
4
5
6
Name / Value
Comment
0xnn2A
rpm[0]
rpm[1]
rpm_max[0]
rpm_max[1]
rpm_min[0]
rpm_min[1]
[2A, nn=block length]
RPM[0]
RPM[1]
RPM MAX[0]
RPM MAX[1]
RPM MIN[0]
RPM MIN[1]
B−
15
Appendix B
-16-
Table B.1.36. SEAT MEASUREMENT
Word
number
0
1
2
Name / Value
Comment
0xnn2C
SEATBaseChannel
SEATSeatChannel
[2C, nn=block length]
base channel
seating channel
Table B.1.37. MAXIMUM RESULTS OF THE 1/1 OCTAVE ANALYSIS IN ONE CHANNEL
Word
Name / Value
Comment
number
0
0xnn2D
[2D, nn=block length]
the lowest 1/1 OCTAVE frequency (*100 Hz)
1
LowestFreq
number of 1/1 OCTAVE values
2
Noct
number of TOTAL values = 3
3
NoctTot
4 - length
block
MaxOctave[i]
maximum result of the 1/1 octave analysis (*100 dB);
i = 1…NOct + NOctTot
…
Table B.1.38. MINIMUM RESULTS OF THE 1/1 OCTAVE ANALYSIS IN ONE CHANNEL
Word
number
0
1
2
3
4 - length
block
Name / Value
Comment
0xnn2E
LowestFreq
Noct
NoctTot
[2E, nn=block length]
the lowest 1/1 OCTAVE frequency (*100 Hz)
number of 1/1 OCTAVE values
number of TOTAL values = 3
MinOctave[i]
minimum result of the 1/1 octave analysis (*100 dB);
i = 1…NOct + NOctTot
Note: The TOTAL values, calculated in the case of sound measurements, correspond to the
A, C and LIN filters – respectively. The TOTAL values, calculated in the case of vibration measurements,
correspond to the HP, CH and CH filters – respectively, where CH denotes the filter used in the channel
for Level Meter measurement.
Table B.1.39. MAXIMUM RESULTS OF THE 1/3 OCTAVE ANALYSIS IN ONE CHANNEL
Word
number
0
1
2
3
4 – length
block
Name / Value
Comment
0xnn2F
LowestFreq
Nter
NterTot
[2F, nn=block length]
the lowest 1/3 OCTAVE frequency (*100 Hz)
number of 1/3 OCTAVE values
number of TOTAL values = 3
MaxTercje[I]
maximum result of the 1/3 octave analysis (*100 dB);
i = 1…NTer + NterTot
B−
16
Appendix B -17-
Table B.1.40. MINIMUM RESULTS OF THE 1/3 OCTAVE ANALYSIS IN ONE CHANNEL
Word
number
0
1
2
3
4 - length
block
Name / Value
Comment
0xnn30
LowestFreq
Nter
NterTot
[30, nn=block length]
the lowest 1/3 OCTAVE frequency (*100 Hz)
number of 1/3 OCTAVE values
number of TOTAL values = 3
MinTercje[I]
minimum result of the 1/3 octave analysis (*100 dB);
i = 1…NTer + NterTot
Note: The TOTAL values, calculated in the case of sound measurements, correspond to the
A, C and LIN filters – respectively. The TOTAL values, calculated in the case of vibration measurements,
correspond to the HP, CH and CH filters – respectively, where CH denotes the filter used in the channel
for Level Meter measurement.
B.2.
STRUCTURE OF THE FILE WITH THE RESULTS FROM THE LM
MODE
FILE HEADER - cf. Tab. B.1.1.
UNIT AND SOFTWARE SPECIFICATION - cf. Tab. B.1.2.
PARAMETERS AND GLOBAL SETTINGS - cf. Tab. B.1.3.
HARDWARE SETTINGS FOR CHANNELS - cf. Tab. B.1.4.
SOFTWARE SETTINGS FOR CHANNELS - cf. Tab. B.1.5.
VECTOR MEASUREMENT SETTINGS - cf. Tab. B.1.6.
SETTINGS FOR VIBRATION DOSE MEASUREMENT (the presence depends on the MEASURE DOSE
position and channel filter settings) - cf. Tab. B.1.9.
MAIN RESULTS - cf. Tab. B.1.10.
RPM RESULTS (present if RPM measurement was enabled) – cf. Tab. B.1.34.
SELECTED STATISTICAL LEVELS IN CHANNELS (the presence depends on the MODE position in the
channel settings) - cf. Tab. B.1.11.
HEADER OF THE STATISTICAL ANALYSIS IN CHANNELS (the presence depends on the SAVE STAT.
position) - cf. Tab. B.1.18.
RESULTS OF THE STATISTICAL ANALYSIS IN ONE CHANNEL (the presence depends on the
SAVE STAT. position and MODE position in the channel settings) - cf. Tab. B.1.19.
FILE END MARKER - cf. Tab. B.1.25.
B.3.
STRUCTURE OF THE FILE WITH 1/1 OCTAVE ANALYSIS RESULTS
FILE HEADER - cf. Tab. B.1.1.
UNIT AND SOFTWARE SPECIFICATION - cf. Tab. B.1.2.
PARAMETERS AND GLOBAL SETTINGS - cf. Tab. B.1.3.
HARDWARE SETTINGS FOR CHANNELS - cf. Tab. B.1.4.
SOFTWARE SETTINGS FOR CHANNELS - cf. Tab. B.1.5.
VECTOR MEASUREMENT SETTINGS - cf. Tab. B.1.6.
OCTAVES ANALYSIS HEADER - cf. Tab.B.1.7.
SETTINGS FOR VIBRATION DOSE MEASUREMENT (the presence depends on the MEASURE DOSE
position and channel filter settings) - cf. Tab. B.1.9.
B−
17
Appendix B -18-
MAIN RESULTS - cf. Tab. B.1.10.
RPM RESULTS (present if RPM measurement was enabled) – cf. Tab. B.1.34.
SELECTED STATISTICAL LEVELS IN CHANNELS (SLM mode channels only) - cf. Tab. B.1.11.
ONE CHANNEL 1/1 OCTAVES ANALYSIS RESULTS (one for each channel with spectrum analysis
enabled) - cf. Tab. B.1.12.
TOTALS DESCRIPTION (if needed) - cf. Tab. B.1.16.
USER DEFINED FILTER DESCRIPTION (if needed) - cf. Tab. B.1.17.
ONE CHANNEL MAXIMUM 1/1 OCTAVES ANALYSIS RESULTS (one for each channel with spectrum
analysis enabled, presence depends on the MAX. SPECT. position) - cf. Tab. B.1.37.
ONE CHANNEL MINIMUM 1/1 OCTAVES ANALYSIS RESULTS (one for each channel with spectrum
analysis enabled, presence depends on the MIN. SPECT. position) - cf. Tab. B.1.38.
HEADER OF THE STATISTICAL ANALYSIS IN CHANNELS (the presence depends on the SAVE STAT.
position) - cf. Tab. B.1.18.
RESULTS OF THE STATISTICAL ANALYSIS IN ONE CHANNEL (the presence depends on the
SAVE STAT. position and MODE position in the channel settings) - cf. Tab. B.1.19.
RESULTS OF THE STATISTICAL ANALYSIS PERFORMED IN 1/1 OCTAVE MODE (SLM channels only
- the presence depends on the SAVE STAT. position) - cf. Tab. B.1.20.
FILE END MARKER - cf. Tab. B.1.25.
B.4.
STRUCTURE OF THE FILE WITH 1/3 OCTAVE ANALYSIS RESULTS
FILE HEADER - cf. Tab. B.1.1.
UNIT AND SOFTWARE SPECIFICATION - cf. Tab. B.1.2.
PARAMETERS AND GLOBAL SETTINGS - cf. Tab. B.1.3.
HARDWARE SETTINGS FOR CHANNELS - cf. Tab. B.1.4.
SOFTWARE SETTINGS FOR CHANNELS - cf. Tab. B.1.5.
VECTOR MEASUREMENT SETTINGS - cf. Tab. B.1.6.
OCTAVES ANALYSIS HEADER - cf. Tab.B.1.7.
SETTINGS FOR VIBRATION DOSE MEASUREMENT (the presence depends on the MEASURE DOSE
position and channel filter settings) - cf. Tab. B.1.9.
MAIN RESULTS - cf. Tab. B.1.10.
RPM RESULTS (present if RPM measurement was enabled) – cf. Tab. B.1.34.
SELECTED STATISTICAL LEVELS IN CHANNELS (SLM mode channels only) - cf. Tab. B.1.11.
ONE CHANNEL 1/3 OCTAVES ANALYSIS RESULTS (one for each channel with spectrum analysis
enabled) - cf. Tab. B.1.13.
ONE CHANNEL MAXIMUM 1/3 OCTAVES ANALYSIS RESULTS (one for each channel with spectrum
analysis enabled, presence depends on the MAX. SPECT. position) - cf. Tab. B.1.39.
ONE CHANNEL MINIMUM 1/3 OCTAVES ANALYSIS RESULTS (one for each channel with spectrum
analysis enabled, presence depends on the MIN. SPECT. position) - cf. Tab. B.1.40.
TOTALS DESCRIPTION (if needed) - cf. Tab. B.1.16.
USER DEFINED FILTER DESCRIPTION (if needed) - cf. Tab. B.1.17.
HEADER OF THE STATISTICAL ANALYSIS IN CHANNELS (the presence depends on the SAVE STAT.
position) - cf. Tab. B.1.18.
RESULTS OF THE STATISTICAL ANALYSIS IN ONE CHANNEL (the presence depends on the
SAVE STAT. position and MODE position in the channel settings) - cf. Tab. B.1.19.
RESULTS OF THE STATISTICAL ANALYSIS PERFORMED IN 1/3 OCTAVE MODE (SLM channels only
- the presence depends on the SAVE STAT. position) - cf. Tab. B.1.20.
FILE END MARKER - cf. Tab. B.1.25.
B.5.
STRUCTURE OF THE FILE WITH THE FFT ANALYSIS RESULTS
B−
18
Appendix B -19-
FILE HEADER - cf. Tab. B.1.1.
UNIT AND SOFTWARE SPECIFICATION - cf. Tab. B.1.2.
PARAMETERS AND GLOBAL SETTINGS - cf. Tab. B.1.3.
HARDWARE SETTINGS FOR CHANNELS - cf. Tab. B.1.4.
SOFTWARE SETTINGS FOR CHANNELS - cf. Tab. B.1.5.
VECTOR MEASUREMENT SETTINGS - cf. Tab. B.1.6.
FFT ANALYSIS HEADER - cf. Tab.B.1.8.
SETTINGS FOR VIBRATION DOSE MEASUREMENT (the presence depends on the MEASURE DOSE
position and channel filter settings) - cf. Tab. B.1.9.
MAIN RESULTS - cf. Tab. B.1.10.
RPM RESULTS (present if RPM measurement was enabled) – cf. Tab. B.1.34.
SELECTED STATISTICAL LEVELS IN CHANNELS (SLM mode channels only) - cf. Tab. B.1.11.
ONE CHANNEL FFT ANALYSIS RESULTS (one for each channel with spectrum analysis enabled) - cf.
Tab.B.1.13.
HEADER OF THE STATISTICAL ANALYSIS IN CHANNELS (the presence depends on the SAVE STAT.
position) - cf. Tab. B.1.18.
RESULTS OF THE STATISTICAL ANALYSIS IN ONE CHANNEL (the presence depends on the
SAVE STAT. position and MODE position in the channel settings) - cf. Tab. B.1.19.
FILE END MARKER - cf. Tab. B.1.25.
B.6.
STRUCTURE OF THE FILE CONTAINING LM RESULTS FROM
BUFFER’S FILE
FILE HEADER - cf. Tab. B.1.1.
UNIT AND SOFTWARE SPECIFICATION - cf. Tab. B.1.2.
PARAMETERS AND GLOBAL SETTINGS - cf. Tab. B.1.3.
HARDWARE SETTINGS FOR CHANNELS - cf. Tab. B.1.4.
SOFTWARE SETTINGS FOR CHANNELS - cf. Tab. B.1.5.
VECTOR MEASUREMENT SETTINGS - cf. Tab. B.1.6.
HEADER OF THE FILE FROM THE BUFFER - cf. Tab.B.1.22.
CONTENTS OF THE FILE FROM THE BUFFER - cf. Tab.B.1.24.
FILE END MARKER - cf. Tab. B.1.25.
B.7.
STRUCTURE OF THE FILE CONTAINING 1/1 OR 1/3 OCTAVE
ANALYSIS RESULTS FROM BUFFER’S FILE
FILE HEADER - cf. Tab. B.1.1.
UNIT AND SOFTWARE SPECIFICATION - cf. Tab. B.1.2.
PARAMETERS AND GLOBAL SETTINGS - cf. Tab. B.1.3.
HARDWARE SETTINGS FOR CHANNELS - cf. Tab. B.1.4.
SOFTWARE SETTINGS FOR CHANNELS - cf. Tab. B.1.5.
VECTOR MEASUREMENT SETTINGS - cf. Tab. B.1.6.
HEADER OF THE FILE FROM THE BUFFER - cf. Tab.B.1.22.
OCTAVES ANALYSIS HEADER - cf. Tab.B.1.7.
SPECTRUM ANALYSIS HEADER OF THE FILE FROM THE BUFFER - cf. Tab.B.1.23.
CONTENTS OF THE FILE FROM THE BUFFER - cf. Tab.B.1.24.
FILE END MARKER - cf. Tab. B.1.25.
B.8.
STRUCTURE OF THE FILE CONTAINING FFT ANALYSIS RESULTS
FROM BUFFER’S FILE
FILE HEADER - cf. Tab. B.1.1.
UNIT AND SOFTWARE SPECIFICATION - cf. Tab. B.1.2.
B−
19
Appendix B -20-
PARAMETERS AND GLOBAL SETTINGS - cf. Tab. B.1.3.
HARDWARE SETTINGS FOR CHANNELS - cf. Tab. B.1.4.
SOFTWARE SETTINGS FOR CHANNELS - cf. Tab. B.1.5.
VECTOR MEASUREMENT SETTINGS - cf. Tab. B.1.6.
HEADER OF THE FILE FROM THE BUFFER - cf. Tab.B.1.22.
FFT ANALYSIS HEADER - cf. Tab.B.1.8.
SPECTRUM ANALYSIS HEADER OF THE FILE FROM THE BUFFER - cf. Tab.B.1.23.
CONTENTS OF THE FILE FROM THE BUFFER - cf. Tab.B.1.24.
FILE END MARKER - cf. Tab. B.1.25.
B.9.
STRUCTURE OF THE FILE CONTAINING SAVED INSTRUMENT
SETUP
FILE HEADER - cf. Tab. B.1.1.
UNIT AND SOFTWARE SPECIFICATION - cf. Tab. B.1.2.
INSTRUMENT’s SETUP DATA BLOCK - cf. Tab.B.1.26.
USER FILTERS ( the presence depends on the SAVE FILT. position) - cf. Tab.B.1.28.
FILE END MARKER - cf. Tab. B.1.25.
B.13.
CONTENTS OF THE FILES IN THE BUFFER
The records with the results and the records with the state of the markers as well as the records with the
breaks in the results registration are saved in the files in the buffer.
B.13.1. Record with the results
The contents of the record with the results depends on the measurement function, selected channels
modes, values set in the BUFFERS SETUP menu and its sub-lists, channels selected for spectrum
analysis and values set in the BUFFER position (path: MENU / INPUT / 1/1 OCTAVE or 1/3 OCTAVE or
FFT SETUP / CHANNEL x / BUFFER). All results are written in dB *10. Profile results are written on 15
most significant bits, while least significant bit is used for overload indication flag. The following elements
can be present (in the given sequence):
-
st
st
results of the measurement from the 1 profile of the 1 channel if the BUFFERS list was marked
and BUFFERS position was set to ON (path: MENU / INPUT / BUFFERS SETUP /
BUFFERS:ON) and if any position in CHAN. 1 PROF. 1 (path: MENU / INPUT /
BUFFERS SETUP / CHANNEL 1 / CHAN. 1 PROF. 1) sub-list was selected, up to five words are
written in the given sequence:
<result1> - PEAK result in the case of VLM or PEAK result in the case of SLM if the first position was
marked, else no value is written;
<result2> - P–P result in the case of VLM or MAX result in the case of SLM if the second position was
marked, else no value is written;
<result3> - MAX result in the case of VLM or MIN result in the case of SLM if the third position was
marked, else no value is written;
<result4> - RMS result in the case of VLM or RMS result in the case of SLM if the fourth position was
marked, else no value is written;
<result5> - VDV result in the case of VLM if the fifth position was marked, else no value is written;
-
st
nd
results of the measurement from the 1 profile of the 2 channel if the BUFFERS position was set
to ON (path: MENU / INPUT / BUFFERS SETUP / BUFFERS:ON); and if any position in CHAN. 2
B−
20
Appendix B -21-
PROF. 1 (path: MENU / INPUT / BUFFERS SETUP / CHANNEL 2 / CHAN. 2 PROF. 1) sub-list
was selected, up to five words are written in the given sequence:
<result1> - PEAK result in the case of VLM or PEAK result in the case of SLM if the first position was
marked, else no value is written;
<result2> - P–P result in the case of VLM or MAX result in the case of SLM if the second position was
marked, else no value is written;
<result3> - MAX result in the case of VLM or MIN result in the case of SLM if the third position was
marked, else no value is written;
<result4> - RMS result in the case of VLM or RMS result in the case of SLM if the fourth position was
marked, else no value is written;
<result5> - VDV result in the case of VLM if the fifth position was marked, else no value is written;
-
st
rd
results of the measurement from the 1 profile of the 3 channel if the BUFFERS position was set
to ON (path: MENU / INPUT / BUFFERS SETUP / BUFFERS:ON) and if any position in CHAN. 3
PROF. 1 (path: MENU / INPUT / BUFFERS SETUP / CHANNEL 3 / CHAN. 3 PROF. 1) sub-list
was selected, up to five words are written in the given sequence:
<result1> - PEAK result in the case of VLM or PEAK result in the case of SLM if the first position was
marked, else no value is written;
<result2> - P–P result in the case of VLM or MAX result in the case of SLM if the second position was
marked, else no value is written;
<result3> - MAX result in the case of VLM or MIN result in the case of SLM if the third position was
marked, else no value is written;
<result4> - RMS result in the case of VLM or RMS result in the case of SLM if the fourth position was
marked, else no value is written;
<result5> - VDV result in the case of VLM if the fifth position was marked, else no value is written;
-
st
th
results of the measurement from the 1 profile of the 4 channel if the BUFFERS position was set
to ON (path: MENU / INPUT / BUFFERS SETUP / BUFFERS:ON) and if any position in CHAN. 4
PROF. 1 (path: MENU / INPUT / BUFFERS SETUP / CHANNEL 4 / CHAN. 4 PROF. 1) sub-list
was selected, up to five words are written in the given sequence:
<result1> - PEAK result in the case of VLM or PEAK result in the case of SLM if the first position was
marked, else no value is written;
<result2> - P–P result in the case of VLM or MAX result in the case of SLM if the second position was
marked, else no value is written;
<result3> - MAX result in the case of VLM or MIN result in the case of SLM if the third position was
marked, else no value is written;
<result4> - RMS result in the case of VLM or RMS result in the case of SLM if the fourth position was
marked, else no value is written;
<result5> - VDV result in the case of VLM if the fifth position was marked, else no value is written;
-
nd
<result1> <result2> <result3> <result4> -
st
results of the measurement from the 2 profile of the 1 channel if the BUFFERS list was marked
and BUFFERS position was set to ON (path: MENU / INPUT / BUFFERS SETUP /
BUFFERS:ON) and if any position in CHAN. 1 PROF. 2 (path: MENU / INPUT /
BUFFERS SETUP / CHANNEL 1 / CHAN. 1 PROF. 2) sub-list was selected, up to four words are
written in the given sequence:
PEAK result in the case of SLM if the first position was marked, else no value is written;
MAX result in the case of SLM if the second position was marked, else no value is written;
MIN result in the case of SLM if the third position was marked, else no value is written;
RMS result in the case of SLM if the fourth position was marked, else no value is written;
nd
nd
results of the measurement from the 2 profile of the 2 channel if the BUFFERS position was
set to ON (path: MENU / INPUT / BUFFERS SETUP / BUFFERS:ON); and if any position in
CHAN. 2 PROF. 2 (path: MENU / INPUT / BUFFERS SETUP / CHANNEL 2 / CHAN. 2 PROF. 2)
sub-list was selected, up to four words are written in the given sequence:
<result1> - PEAK result in the case of SLM if the first position was marked, else no value is written;
<result2> - MAX result in the case of SLM if the second position was marked, else no value is written;
<result3> - MIN result in the case of SLM if the third position was marked, else no value is written;
B−
21
Appendix B -22-
<result4> - RMS result in the case of SLM if the fourth position was marked, else no value is written;
-
nd
rd
results of the measurement from the 2 profile of the 3 channel if the BUFFERS position was set
to ON (path: MENU / INPUT / BUFFERS SETUP / BUFFERS:ON) and if any position in CHAN. 3
PROF. 2 (path: MENU / INPUT / BUFFERS SETUP / CHANNEL 3 / CHAN. 3 PROF. 2) sub-list
was selected, up to four words are written in the given sequence:
<result1> - PEAK result in the case of SLM if the first position was marked, else no value is written;
<result2> - MAX result in the case of SLM if the second position was marked, else no value is written;
<result3> - MIN result in the case of SLM if the third position was marked, else no value is written;
<result4> - RMS result in the case of SLM if the fourth position was marked, else no value is written;
-
nd
<result1> <result2> <result3> <result4> -
th
results of the measurement from the 2 profile of the 4 channel if the BUFFERS position was set
to ON (path: MENU / INPUT / BUFFERS SETUP / BUFFERS:ON) and if any position in CHAN. 4
PROF. 2 (path: MENU / INPUT / BUFFERS SETUP / CHANNEL 4 / CHAN. 4 PROF. 2) sub-list
was selected, up to four words are written in the given sequence:
PEAK result in the case of SLM if the first position was marked, else no value is written;
MAX result in the case of SLM if the second position was marked, else no value is written;
MIN result in the case of SLM if the third position was marked, else no value is written;
RMS result in the case of SLM if the fourth position was marked, else no value is written;
rd
st
results of the measurement from the 3 profile of the 1 channel if the BUFFERS list was marked
and BUFFERS position was set to ON (path: MENU / INPUT / BUFFERS SETUP /
BUFFERS:ON) and if any position in CHAN. 1 PROF. 3 (path: MENU / INPUT /
BUFFERS SETUP / CHANNEL 1 / CHAN. 1 PROF. 3) sub-list was selected, up to four words are
written in the given sequence:
<result1> - PEAK result in the case of SLM if the first position was marked, else no value is written;
<result2> - MAX result in the case of SLM if the second position was marked, else no value is written;
<result3> - MIN result in the case of SLM if the third position was marked, else no value is written;
<result4> - RMS result in the case of SLM if the fourth position was marked, else no value is written;
rd
nd
results of the measurement from the 3 profile of the 2 channel if the BUFFERS position was
set to ON (path: MENU / INPUT / BUFFERS SETUP / BUFFERS:ON); and if any position in
CHAN. 2 PROF. 3 (path: MENU / INPUT / BUFFERS SETUP / CHANNEL 2 / CHAN. 2 PROF. 3)
sub-list was selected, up to four words are written in the given sequence:
<result1> <result2> <result3> <result4> -
PEAK result in the case of SLM if the first position was marked, else no value is written;
MAX result in the case of SLM if the second position was marked, else no value is written;
MIN result in the case of SLM if the third position was marked, else no value is written;
RMS result in the case of SLM if the fourth position was marked, else no value is written;
rd
rd
results of the measurement from the 3 profile of the 3 channel if the BUFFERS position was
set to ON (path: MENU / INPUT / BUFFERS SETUP / BUFFERS:ON) and if any position in
CHAN. 3 PROF. 3 (path: MENU / INPUT / BUFFERS SETUP / CHANNEL 3 / CHAN. 3 PROF. 3)
sub-list was selected, up to four words are written in the given sequence:
<result1> - PEAK result in the case of SLM if the first position was marked, else no value is written;
<result2> - MAX result in the case of SLM if the second position was marked, else no value is written;
<result3> - MIN result in the case of SLM if the third position was marked, else no value is written;
<result4> - RMS result in the case of SLM if the fourth position was marked, else no value is written;
-
rd
th
results of the measurement from the 3 profile of the 4 channel if the BUFFERS position was set
to ON (path: MENU / INPUT / BUFFERS SETUP / BUFFERS:ON) and if any position in CHAN. 4
PROF. 3 (path: MENU / INPUT / BUFFERS SETUP / CHANNEL 4 / CHAN. 4 PROF. 3) sub-list
was selected, up to four words are written in the given sequence:
<result1> <result2> <result3> <result4> -
PEAK result in the case of SLM if the first position was marked, else no value is written;
MAX result in the case of SLM if the second position was marked, else no value is written;
MIN result in the case of SLM if the third position was marked, else no value is written;
RMS result in the case of SLM if the fourth position was marked, else no value is written;
B−
22
Appendix B -23-
-
VECTOR measurement result if in the BUFFERS (path: MENU / INPUT / BUFFERS SETUP /
BUFFERS:ON) and VECTOR (path: MENU / INPUT / BUFFERS SETUP / VECTOR:ON) positions
are set to ON and VECTOR measurement was enabled; one word is written.
-
RPM measurement result if the BUFFERS (path: MENU / INPUT / BUFFERS SETUP /
BUFFERS:ON) and RPM (path: MENU / INPUT / BUFFERS SETUP / RPM:ON) positions are set
to ON and RPM measurement was enabled; two word are written.
-
results of 1/1 OCTAVE analysis from the 1 channel if 1/1 OCTAVE analysis was selected as the
measurement function and in the BUFFER (path: MENU / INPUT / 1/1 OCTAVE SETUP /
CHANNEL 1: ON / BUFFER) position other then None value was selected; the sequence of words
is written:
st
<flags> <Octave[1]> <Octave[2]> ... <Octave[NOct+NOctTot]>
where:
flags = 1 - the overload detected, 0 - the overload not detected
Octave[i] - the result of 1/1 OCTAVE analysis (*10 dB); i = 1..NOct+NOctTot (1..18)
-
nd
results of 1/1 OCTAVE analysis from the 2 second channel if 1/1 OCTAVE analysis was
selected as the measurement function and in the BUFFER (path: MENU / INPUT /
1/1 OCTAVE SETUP / CHANNEL 2: ON / BUFFER) position other then None value was selected;
the sequence of words is written:
<flags> <Octave[1]> <Octave[2]> ... <Octave[NOct+NOctTot]>
where:
flags = 1 - the overload detected, 0 - the overload not detected
Octave[i] - the result of 1/1 OCTAVE analysis (*10 dB); i = 1..NOct+NOctTot (1..18)
-
rd
results of 1/1 OCTAVE analysis from the 3 channel if 1/1 OCTAVE analysis was selected as the
measurement function and in the BUFFER (path: MENU / INPUT / 1/1 OCTAVE SETUP /
CHANNEL 3: ON / BUFFER) position other then None value was selected; the sequence of words
is written:
<flags> <Octave[1]> <Octave[2]> ... <Octave[NOct+NOctTot]>
where:
flags = 1 - the overload detected, 0 - the overload not detected
Octave[i] - the result of 1/1 OCTAVE analysis (*10 dB); i = 1..NOct+NOctTot (1..18)
th
results of 1/1 OCTAVE analysis from the 4 channel if 1/1 OCTAVE analysis was selected as the
measurement function and in the BUFFER (path: MENU / INPUT / 1/1 OCTAVE SETUP /
CHANNEL 4: ON / BUFFER) position other then None value was selected; the sequence of words
is written:
<flags> <Octave[1]> <Octave[2]> ... <Octave[NOct+NOctTot]>
where:
flags = 1 - the overload detected, 0 - the overload not detected
Octave[i] - the result of 1/1 OCTAVE analysis (*10 dB); i = 1..NOct+NOctTot (1..18)
-
-
st
results of 1/3 OCTAVE analysis from the 1 channel if 1/3 OCTAVE analysis was selected as the
measurement function and in the BUFFER (path MENU / INPUT / 1/3 OCTAVE SETUP /
CHANNEL 1: ON / BUFFER) position other then None value was selected; the sequence of words
is written:
<flags> <Terave[1]> <Terave [2]> ... <Terave[NT]>
where:
flags = 1 - the overload detected, 0 - the overload not detected
Terave[i] - the result of 1/3 OCTAVE analysis (*10 dB); i = 1..NT (1..48 or 1..33)
-
nd
results of 1/3 OCTAVE analysis from the 2 channel if 1/3 OCTAVE analysis was selected as the
measurement function and in the BUFFER (path: MENU / INPUT / 1/3 OCTAVE SETUP /
CHANNEL 2: ON / BUFFER)position other then None value was selected; the sequence of words
is written:
B−
23
Appendix B -24-
<flags> <Terave[1]> <Terave [2]> ... <Terave[NT]>
where:
flags = 1 - the overload detected, 0 - the overload not detected
Terave[i] - the result of 1/3 OCTAVE analysis (*10 dB); i = 1..NT (1..48 or 1..33)
-
rd
results of 1/3 OCTAVE analysis from the 3 channel if 1/3 OCTAVE analysis was selected as the
measurement function and in the BUFFER (path: MENU / INPUT / 1/3 OCTAVE SETUP /
CHANNEL 3: ON / BUFFER) position other then None value was selected; the sequence of words
is written:
<flags> <Terave[1]> <Terave [2]> ... <Terave[NT]>
where:
flags = 1 - the overload detected, 0 - the overload not detected
Terave[i] - the result of 1/3 OCTAVE analysis (*10 dB); i = 1..NT (1..48 or 1..33)
-
th
results of 1/3 OCTAVE analysis from the 4 channel if 1/3 OCTAVE analysis was selected as the
measurement function and in the BUFFER (path: MENU / INPUT / 1/3 OCTAVE SETUP /
CHANNEL 4: ON / BUFFER) position other then None value was; the sequence of words is
written:
<flags> <Terave[1]> <Terave [2]> ... <Terave[NT]>
where:
flags = 1 - the overload detected, 0 - the overload not detected
Terave[i] - the result of 1/3 OCTAVE analysis (*10 dB); i = 1..NT (1..48 or 1..33)
-
st
results of FFT analysis from the 1 channel if FFT analysis was selected as the measurement
function and in the BUFFER (path MENU / INPUT / FFT SETUP / CHANNEL 1: ON / BUFFER)
position other then None value was selected; the sequence of words is written:
<flags> <FFTave[1]> <FFTave [2]> ... <FFTave[NL]>
where:
flags = 1 - the overload detected, 0 - the overload not detected
FFTave[i] - the result of FFT analysis (*10 dB); i = 1..NL (1..481 or 1..961)
-
nd
results of FFT analysis from the 2 channel if FFT analysis was selected as the measurement
function and in the BUFFER (path: MENU / INPUT / FFT SETUP/ CHANNEL 2: ON /
BUFFER)position other then None value was selected; the sequence of words is written:
<flags> <FFTave[1]> <FFTave [2]> ... <FFTave[NL]>
where:
flags = 1 - the overload detected, 0 - the overload not detected
FFTave[i] - the result of FFT analysis (*10 dB); i = 1..NL (1..481 or 1..961)
-
rd
results of FFT analysis from the 3 channel if FFT analysis was selected as the measurement
function and in the BUFFER (path: MENU / INPUT / FFT SETUP / CHANNEL 3: ON / BUFFER)
position other then None value was selected; the sequence of words is written:
<flags> <FFTave[1]> <FFTave [2]> ... <FFTave[NL]>
where:
flags = 1 - the overload detected, 0 - the overload not detected
FFTave[i] - the result of FFT analysis (*10 dB); i = 1..NL (1..481 or 1..961)
-
th
results of FFT analysis from the 4 channel if FFT analysis was selected as the measurement
function and in the BUFFER (path: MENU / INPUT / FFT SETUP / CHANNEL 4: ON / BUFFER)
position other then None value was; the sequence of words is written:
<flags> <FFTave[1]> <FFTave [2]> ... <FFTave[NL]>
where:
flags = 1 - the overload detected, 0 - the overload not detected
FFTave[i] - the result of FFT analysis (*10 dB); i = 1..NL (1..481 or 1..961)
B−
24
Appendix B -25-
The value of NT parameter depends on the BUF. STEP selection (path: MENU / INPUT /
MEASURE SETUP). For the buffer steps greater then 10 ms the value of NT is equal to
NTer+NTerTot: the outputs from all 1/3 OCTAVE filters from 0.8 Hz up to 20 kHz and the TOTAL
values are written (45 + 3 = 48). For the buffer step equal to 10 ms the value of NT is equal to 33:
the outputs from 1/3 OCTAVE filters from 25 Hz up to 20 kHz and the TOTAL value are written
(30 + 3 = 33).
The value of NL parameter depends on the LINES selection (path: MENU / INPUT / FFT /
CHANNEL X / LINES).
B.13.2. Record with the state of the markers
The record with the state of the markers consists of one word:
<0x8nnn>
in which 12 bits nnn denote the state of the markers:
b11 = state of #12 marker
b10 = state of #11 marker
...
b1 = state of #2 marker
b0 = state of #1 marker
B.13.3. Record with the breaks in the results registration
The record with the breaks in the results registration consists of four words:
<0xB0ii> <0xB1jj> <0xB2kk> <0xB3nn>
in which ii, jj, kk, nn bytes denote 4-bytes counter of left or skipped records: nnkkjjii (ii is the least
significant byte, nn - the most significant byte).
B.13.4. Record with the breaks account PAUSE in the results registration
The record with the breaks in the results registration consists of four words:
<0xA0ii> <0xA1jj> <0xA2kk> <0xA3nn>
in which ii, jj, kk, nn bytes denote 4-bytes counter duration of PAUSE in milliseconds:
nnkkjjii (ii is the least significant byte, nn - the most significant byte).
Pause duration means time passed between pressing <PAUSE> key and measurement continuation key.
Start delay after pressing continuation key isn't added to the counter.
B.5. DATE AND TIME
Following function written in C explains how the date and time are coded:
void ExtractDateTime(int date, int time, int dt[])
{
int sec,year;
sec = ((0xffff&time)<<1); /* time<<1; */
dt[0] = sec%60; /* sec */
B−
25
Appendix B
-26-
dt[1] = (sec/60)%60; /* min */
dt[2] = sec/3600; /* hour */
dt[3] = date&0x1F; /* day */
dt[4] = (date>>5)&0x0F; /* month */
year = (date>>9) & 0x07F;
dt[5] = year+2000; /* year */ }
B−
26
-1-
APPENDIX C
Glossary of Terms
Glossary of Terms
A(8)
When analyzing hand-arm vibration and whole-body vibration, A(8) is a type of
measurement that computes the average over 8 hours.
The partial 8-hour time-weighted average exposure is calculated on the following formula:
•
Aeq x √(T/T0)
2
Aeq is the measured average acceleration value in m/s from the
measured vibration sample.
T is the actual total daily exposure time for the subject tool.
T0 is the daily work shift (8 hours).
Acceleration
The time rate of change in velocity measured by ft/sec2 or m/sec2 or gravity.
2
(1g=9.81m/sec )
Accelerometer
A sensor used to measure the x, y, z axis vibration. Two types of accelerometers are:
•
Charge Mode
•
Voltage Mode - ICP
ACGIH
American Conference of Governmental Industrial Hygiene is a committee of experts that
oversee and make recommendations based on environmental industrial hygiene and
occupational health for workers health and safety. ACGIH defined the following threshold
levels for human vibration:
Hand-arm vibration
5 – 1500 HZ
Whole-body vibration
1 – 80 HZ
Aeq
For HAV and WBV measurements, AEQ is the single number of the acceleration energy
equivalent for the test time. (ex: test time is 10 mins.)
Amax
For HAV and WBV measurements, AMAX is the maximum acceleration level on meter.
Amin
For HAV and WBV measurements, AMIN is the minimum accelerated level.
Arms
072-043 RevA
For HAV and WBV measurements, Arms is the single number of the acceleration energy
equivalent for the test time. (ex: test time is 10 mins.)
The vibration meter samples a constantly changing weighted signal from the
accelerometer many times per second and converts those samples into an “average” value
that is updated on the instrument display at some fixed frequency, typically once per
second. This “average” is actually computed as the square root of the average (mean) of
the squares of the samples, thus acronym “rms”.
VI-410
-2-
APPENDIX C
Glossary of Terms
Axis
Vibration can occur up and down, forward and backward, and left and right. These three
types of directions are called axis.
Calibration
The process of adjusting an instrument to a known calibrated source. An accelerometer
will come with a calibration certificate that states the defined sensitivity. For example, for a
10 mV/g accelerometer, you may see actual sensitivities of 9.95 mV/g or 10.23 mV/g.
Crest Factor
(CRF)
For Whole-Body vibration, this is the ratio of the maximum peak value of the frequency
weighted acceleration signal to the root-mean-square (RMS) value.
•
crest factor = peak
rms
The maximum allowable exposure to the accumulated noise or vibration; it gives the
condition that will result in the 100% dose.
Criterion Level
Damping
A means of dispersing vibration energy within a vibrating system.
Displacement
The distance between the normal resting position of an object and its position at any given
time in a vibration cycle.
EAV
Exposure Action Value is the daily exposure limit value for HAV and WBV in an eight
hour interval derived by the European Union directive. The following are the action
levels:
Hand-Arm Vibration
EAV
Whole-Body Vibration
ELV
EAV
2.5 m/s2
0.5 m/s2
Exposure Limit Value is the maximum exposed level set by European Union based on an
eight hour interval. The following are the action levels:
Hand-Arm Vibration
ELV
Whole-Body Vibration
ELV
072-043 RevA
5.0 m/s2
1.15 m/s2
VI-410
-3-
APPENDIX C
Glossary of Terms
EU
European Union – applied easy to follow guidelines for whole-body vibration and handarm vibration. This consists of an exposure action level limit (EAV) and a daily exposure
limit (ELV).
Fast Fourier
Transform
When analyzing measured HAV and/or WBV, FFT may be applied to understand the
frequency content of the vibration source in miniscule detail. A Fourier Frequency
Domain Spectrum is a radically fine scale that quantifies the vibration acceleration rates
according to frequency.
Frequency
Cycles per second usually displayed in Hertz (HZ).
HAV
Hand-Arm Vibration is vibration transmitted from work processes into workers hands and
arms. Some of the causes are from operating hand-held power tools such as pneumatic,
electric, hydraulic & gas-powered tools.
HAVS
ISO
ISO 8041
ISO5349
Hand-Arm Vibration Syndrome is permanent injuries to your hands and arms which can
include the following:
•
Sensory nerve damage – damages to the nerves in your fingers which may
cause permanent numbness or tingling in your fingers.
•
Blood circulatory systems – The first signs is an occasional attack when your
fingertips turn white. During an attack, your fingers may also become numb
and feel like “pins and needles”. This is very painful and your fingers may
change to a red flush.
•
Damage to the muscle, bones, and joints – you may notice a loss of strength in
your hands and pains in your wrists and arms.
International Standards Organization which defines the standards for human vibration and
sound.
A performance standard directed at instrument manufacturers. It defines the accuracies
that an instrument for this application shall meet in accordance with the threshold limit
value (i.e., tolerance limits) to address human response to vibration.
Procedural standards defined by International Standards Organization for hand-arm
vibration. Standard for total daily exposure is defined below:
Total Daily Exposure Duration
•
4 hours and less than 8 hours
•
2 hours and less than 4 hours
•
1 hour and less than
•
Less than an hour
Max Frequency-Weighted RMS Xh, Yh, or Zh
2
4 m/s
2
6 m/s
2
8 m/s
2
12m/s
IS02631
Procedural standards defined by International Standards Organization for the Whole-Body
Vibration which defines the range of frequency weight as:
•
0.5HZ – 80HZ for WBV
Isolation
The reduction of vibration by the intentional separation of mechanical transmission
between source and receiver.
MTVV
When analyzing exposure to hand-arm vibration and/or whole-body vibration, the MTVV is
the maximum transient vibration value (same as Amax).
072-043 RevA
VI-410
-4-
APPENDIX C
Glossary of Terms
Magnitude
The vibration magnitude tells how "powerful" the vibration is.
Usually the magnitude of vibration is indicated by the acceleration 'a', measured in meters
per second squared (m/s²). Because the magnitude of the acceleration is continually
changing, a single overall value was introduced. In most cases, when vibration does not
contain shocks, the acceleration magnitude is expressed by the root-mean-square (rms)
value.
arms =
NIOSH
National Institute for Occupational Safety and Health reviews, evaluates, and
disseminates new information on occupational hazards.
Occupational
Vibration
1/3 octave
Whole-body vibration and hand-arm vibration in the workplace.
A filtered measurement which divides the instrument’s broadband spectrum exactly into 33
band-limited frequency ranges.
P-P
For HAV and WBV measurements, P-P is denoted as “Peak to Peak” which displays the
highest point value to lowest point value.
Peak
For HAV and WBV measurements, Peak is the highest point value.
Resonance
The human body’s tendency to act in concert with externally applied
vibration and exacerbate (i.e., amplify) its effects. (The effects of the
vibration in certain frequency when in contact with various hand tools.)
Resonance
frequency
With HAV and WBV applications, a resonance frequency is a natural frequency of vibration
determined by the physical parameters of the vibrating object and associated with the
human body response.
RMS
Root Mean Square is the statistical measure of the magnitude of a varying quantity (Arms
for acceleration).
Sensed
Calibration
Tri-Axial
Accelerometer
A calibration done with a shaker calibrator.
TLV
072-043 RevA
Vibration transducers that contain three separate accelerometers (x,y,z axes) within one
physical instrument (housing).
Threshold Limit Value – Defines exposure level limits for Hand-Arm and Whole-Body
vibration.
VI-410
-5-
APPENDIX C
Glossary of Terms
Vector
A quantity that is completely determined by its magnitude and direction.
Vector Sum
This is the square root of the sum of the squares of the weighted rms acceleration values
of x, y, and z axes. Vector Sum is a vibration total value of all three axes. Vector Sum is
recommended for use when no dominant axis exists. Vector Sum is also prescribed for
use over most-dominant-axis values in some regulations.
The steady rate (or speed; i.e. a car) measured in meters per second (m/s ).
Velocity
VDV
Vibration Dose Value is a method used to calculate vibration exposure. It is more sensitive
to peaks than standard evaluation methods and should be used when crest factors are
greater than 9.
The EU WBV guidelines are defined as the following:
•
Daily Exposure Limit
–
1.15 m/s2 A(8) or 21 m/s1.75 VDV
•
WBV
Daily Exposure Action Value
–
0.5 m/s2 A(8) or 9.1 m/s1.75 VDV
Whole-Body Vibration is a form of mechanical vibration transmitted through a supporting
surface to the body. For example, heavy equipment vibration is transmitted through the
seat of the vehicle to the operator’s spine. Exposed groups include operators of trucks,
buses, tractors, aviation workers, and people working on vibrating floors. WBV is
hazardous when there is regular and frequent exposure to high levels of vibration (typically
over several years). The benchmarks are:
•
4 to 8 Hz Resonance Head-to-toe
•
1 to 2 Hz Resonance Left/Right & Front/Back
Wk
WBV vibration is generally adjusted, or weighted, so that the instrument’s frequency
follows a characteristic curve for the z-axis (vertical, seat surface).
Wd
WBV vibration is generally adjusted, or weighted, so that the instrument’s frequency
follows a characteristic curve for the x-axis and y-axis (horizontal, seat surface).
Weighting
According to the ISO2631, it is the range of frequency weight (0.5HZ – 80HZ for WBV)
(5HZ-1,500 for HAV). (For example, the weight is how the vibration corresponds to the
sensitivity of a person.)
072-043 RevA
VI-410
-6-
APPENDIX C
Glossary of Terms
For detecting WBV, frequency is measured from back-to-chest
X- Axis
For detecting HAV, frequency is measured through the back of the
hand
072-043 RevA
VI-410
-7-
APPENDIX C
Glossary of Terms
For detecting WBV, frequency is measured from right-to-left side
Y-Axis
For detecting HAV, frequency is measured across the knuckles
072-043 RevA
VI-410
-8-
APPENDIX C
Glossary of Terms
Z-Axis
For detecting WBV, frequency is measured from head-to-toe
For detecting HAV, frequency is measured up and down the arm
072-043 RevA
VI-410
-9-
Appendix C
Contacting Quest Technologies
Quest Service
Contacting Quest Technologies
Should your Quest Technologies equipment need to be returned for repair or
for recalibration, please contact the service department at the following
number or access the online form via the website.
Service Department: 1 (800) 245-0779. Office hours are 8:00
a.m. to 5:00 p.m. United States Central.
•
Contact Quest via e-mail at mailto:[email protected]
•
Fax: +1 262/567-4047
9 Request a Return Authorization number.
Internet: www.quest-technologies.com
If you have questions about the calibrator’s operation, please contact Quest
Technologies and ask for Technical Support.
Telephone: +1 262/567-9157 or
800-245-0779 within the USA
International customers
Contact your local, factory-authorized distributor from whom the product
was purchased. You can obtain the name and contact information of your
local factory-authorized distributor from Quest by using the e-mail,
telephone, or fax information given under “Contacting Quest Technologies”
above.
072-043 RevA
VI-410