1
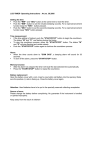
10 start off your career as mayor, flip through to the last page of the task card and gently tear it off. This is the
"Tips and HelpfulHints~page. Onthis page are hints taken from the SimCityUser Manual. Next to each hint is
a page number. If you want more information on a certain hint, turn to that page in the User ManuaL Use this .
sheet as a reference while building your citY. It may help you to avoid some common mistakes.
BEGINNER:
Clickon the ~STARTNEW GAME»menu option and name your City. Set the game level at casy~ If you are
already familiar with this game and want a challenge, you may set the game level on "Medium,» or ~ard~ Next.
go to the Disasters menu and set it on "Disable~ Begin building your City.
As you build, pay special attention to the City Evaluation Box. Check it each time a year passes and note your
progress. What is your approval rating? What are your city's worst problems? How can you improve them?
(HINT: Check the Hints page for solutions).
10 complete this level. you must achieve ~wn» status [2,000 residents), and answer the following Questions:
1) How did your
approval rating change as you progressed through the game? (Didit go up or down?)
2)
What were the top two complaints of the Sims during the game?
3)
What did you do [if anything) to try to get the Sims to stop their complaining?
4)
in what range was your average tax rate? (Circle one)
0-4%
5-7%
8-12%
13-15%
16%+
* SAVE
YOUR CITY OFTEN J1I.
5)
Do you think your tax rate made enough money tor your city? (Circle one)
YES
G)
NO
Did it keep the Sims' complaints to a minimum? (Circle one)
YES
NO
GOOD:
Build your saved town into a wCit1l~Youneed to get 10,000 residents to achieve "City» status. Pay attention to
the graphs and charts as you play. When you receive the bulletin telling you that you have achieved "City»
status. click into the Graphs Window and put the game on PAUSE. In the space provided below. draw what you
see on the graphs and label or color code each curve. Do one graph for the ten year period. and one for the 120
year period.
10 YEAR GRAPH
I
I
I
I
I
I
~ SAVE YOUR CITY OFTEN ~
I
I
I
)
)
120 YEAR GRAPH
-,
/
1) Has
the city changed since you took over as mayor? (Circle one)
YES
2) For each of the following,look
NO
at the graph, and circle either -INCREASEM or 1JECREASE~
RESIDENTIAL POPULATION GRAPH
INCREASE
DECREASE
INDUSTRIAL POPULATION GRAPH
INCREASE
DECREASE
CRIME RATE GRAPH
INCREASE
DECREASE
CASH FLOW GRAPH
INCREASE
DECREASE
POLLUTION GRAPH
INCREASE
DECREASE
Notice your city's trends over time. If your crime rate has increased, your population has decreased, or if you
notice any problems on your graphs, look at the Tips sheet for possible solutions before you move on to EXPERT
level.
i SAVE YOUR CITY OFTEN JoIL