1
Verifying Statemate Statecharts Using
CSP and FDR
A.W. Roscoe and Z. Wu
Oxford University Computing Laboratory
{bill.roscoe,zhenzhong.wu}@comlab.ox.ac.uk
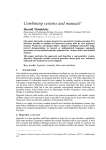
Abstract. We propose a framework for the verification of statecharts.
We use the CSP/FDR framework to model complex systems designed in
statecharts, and check for system consistency or verify special properties
within the specification. We have developed an automated translation
from statecharts into CSP and exploited it in both theoretical and practical senses.
1
Introduction
Statecharts are a popular means for designing the hierarchical state machines
which are used in embedded systems, telecommunications etc. Clarke and his
colleagues have developed the SMV tool for checking finite state systems against
specifications in the temporal logic CTL [4–6]. Work by Bienmuller, Damm and
their colleagues has built up the STVE to model and verify some industrial
applications [2, 3, 7, 11].
The CSP/FDR framework is well established as a methodology for analyzing interacting systems and state machines [25]. A number of people have done
prototyping work in the translation of statechart problems in a form the FDR
can analyze. Work by Fuhrmann and his colleagues [14] shows how a subset of
the statechart is expressed and verified by CSP/FDR. In this paper we report
on our development of an automated translation from Harel’s Statemate Statecharts into CSP, and exploit it in both theoretical and practical senses, mainly
in defining language semantics and in system verification.
The statecharts formalism derives from conventional finite state machines. It
is a structured analysis approach for modelling reactive systems. The Statemate
semantics of statecharts was introduced by David Harel [18], and has been proved
to be very useful for specifying concurrent systems. It supports both models of
timing: synchronous and asynchronous. Verification techniques for statecharts
have often been based on extensive checking or simulation. However, the informality of such approaches can easily lead to important requirements being
overlooked and, since testing is rarely exhaustive, failures can be missed.
Our approach to Statemate Statecharts uses the CSP process algebra to
specify concurrent systems. A statechart can be represented as a CSP process;
Supported by QinetiQ.
2
statechart constructs such as hierarchy, AND and OR states, and communications all having CSP analogues. CSP-based tools such as FDR can then be
used to verify properties of statecharts by performing refinement checks on the
translation.
We initially adopted our approach as a way of understanding the semantics of
statecharts, but it proved unexpectedly successful at verifying practical systems.
We have therefore sought to include as wide a range of statechart constructs
as possible in our compiler. In this paper we document which constructs are
covered, but only give technical details of the more important ones. The paper
is concluded by a case study.
2
Modelling Statecharts in CSP
Before we can describe the simulation we need to understand the basic concept
of Statemate Statecharts.
2.1
Statemate Semantics
The statechart concept is based fundamentally on three ideas:
– Hierarchy: a statechart can exist within a single state of a higher level state
machine.
– State machines: the basic component of a statechart is a sequential state
machine, with guarded actions between states that have the potential to set
signals and assign to shared variables.
– Parallelism (AND states): having several sequential machines running side
by side.
There are many semantics of statecharts. One of the most important is the
Statemate Statecharts of Harel [18], as refined by various developers. The various
semantics of statecharts take different views on, for example:
– Concurrency. Statemate has an eager and concurrent model of AND states
— if several states can proceed on one step then they all do.
– Timing model. Statemate has a two-level timing model and expects a system
to settle through a number of “small” time steps before allowing further
external signals to be processed.
– Nondeterminism. Statemate expects (under priority) at most one action of
each OR-state to be available at one time, and forbids race conditions on
variables.
– Priority. Statemate gives the highest priority to actions that are enabled
further up the hierarchy, together with various other rules.
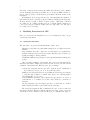
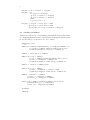
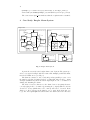
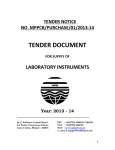
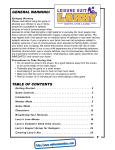
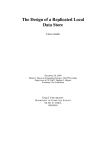
The statechart diagram in Fig. 1 illustrates the uses of these features in
Statemate semantics. This statechart module has two input events: event1 and
event2. There are two variables: v1 and v2. There is one constant Limit. Suppose,
3
P
B
B1
event1/v1:=1
C1
A
B2
D1
[v2=1]
[v1=1]/v2:=1
[v2>10]
C2
D2
event2/v1:=2
C3
D3
B3
E1
[v2=2]
[v2<Limit]/v2+=1
E2
event2/v2:=v1+1 [v2>10]
E3
Fig. 1. Example Statemate Statechart
for example, that state A is active, Limit is set to 11, and two variables are set
to 0. If event1 occurs under these conditions, the transition from state A to state
B is enabled, and variable v1 is set to 1.
State B is an AND-state: states B1, B2 and B3 are its sub-states. Once an
AND-state is entered, all its components become active in parallel. In Fig. 1,
states B1, B2, B3 are entered simultaneously when entering B so that all three
sub-states become active. Once they are entered transitions emerge from Default
Connectors automatically. States C1, D1 and E1 are activated.
Under the asynchronous time model, time is not advanced at every single step
but at super-steps. Each super-step consists of a collection of steps. Execution
of a series of steps within one super-step does not advance the timer, these steps
take place at the same point of time without introducing any external changes
from the environment. Once the system is in a stable state, i.e., when no enabled
transitions exist in the system, a super-step is completed. The environment can
generate signals to enable new transitions and subsequently execute another
super-step. In Fig. 1, the transition from C1 to C2 is taken, setting v2 to 1.
The transition from D1 to D2 is enabled and taken afterwards. There are no
more enabled transitions at this point and the system becomes stable. So this
super-step is completed, then the environment generates event2 to trigger new
transitions.
When multiple actions make changes on one element in the same step, we
cannot predict the outcome and this is considered an error. There is a potential
danger from reading and writing the same element in different parallel threads;
however Statemate semantics are that an assignment to an element does not
take effect till next step. In Fig. 1, occurrence of event2 enables both transitions
from C2 to C3 and from D2 to D3. There are two actions available at the same
time: v1 will attain the value of 2 and v2 will be assigned to “v1+1”. Without
the delay described above this would lead to ambiguity. The signals generated
and data-items changed cannot take effect until the completion of the step. This
4
suggests that v1 still and always holds the value 1 in this step so that v2 will
become 2 but not 3 after the assignment “v2: =v1+1”.
There is a conflict if multiple transitions are enabled from one common state.
Those transitions cannot be performed in the same step. Nondeterminism occurs
when there are some conflicts and those transitions within each conflict have the
same priority. The choice of transitions results in different statuses. Even if two
enabled transitions lead to the same state, non-determinism still occurs due to
the changes of some other items during the transition, for instance, different
signals being generated. In this case the overall result states will be different.
In Fig. 1, transition from state E1 to state E2 is enabled since the condition is
fulfilled, leading to the activation of state E2. The self-loop transition is enabled
until v2 reaches 11. There is a potential conflict at this point, three transitions
enabled at the same time: the transition pointed to E2 itself, the transition from
state E2 to state E3, and the transition from state B to state A.
A transition from a lower level state to a higher-level state takes priority
over other types of transitions from the same state. This phenomenon, also called
“Preemptive Interrupt” [18], happens when a high level transition prevents transitions on lower levels. Transition priority provides a way to pre-determine one
transition among a group of enabled transitions and also to avoid the potential
nondeterminism. In Fig. 1, the transition from state B to state A has the highest
priority among all three, and so is preferred. There will be no non-determinism in
this case. If none of conflicting multiple transitions has higher priority than the
others, different semantics treat it in different ways. Some semantics introduce
a specific priority of execution. For example, in Matlab Stateflow, transitions are
taken according to their relative locations in the statechart diagram in clockwise
order starting at the “twelve o’clock” position.1 Our compiler treats nondeterminism as an error which would be returned by the system. This could be altered
straightforwardly, but in some cases it would lead to our tool being less efficient
as it presently exploits the determinism of statecharts.2
2.2
Compiler
The compiler is written as a program in CSPM [25] making heavy use of functional programming. It consists of three main parts, plus some other functions:
– The mechanism to construct a single sequential chart: each individual chart
is described as a transition system and a set of state labels indicate its substates.
– The mechanism to construct a hierarchy of individual sequential statecharts
with capability of promotion: the overall hierarchical structure of the system
is expressed as a special tree data type; all charts are built based on the root.
Charts with no subcharts are expressed as single-leaf trees.
1
2
See [Mathworks97] for a precise description of the evaluation order [22].
The full description of the syntax of Statemate Statecharts is beyond the scope of
this paper. I refer the interested readers to a full description in Harel and Naamad
[18].
5
– Constructing variables and timers as processes running in parallel with the
main system.
2.3
Timing Model and Step Semantics
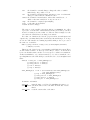
Two levels of timing model are supported in the compiler. A small step is indicated by event step, and event tock represents a super-step. The entire system
created has a synchronous timing model represented by tock and step, which all
processes synchronise on. When the possible actions are complete, processes will
agree to “step”. Once there is no progress that can be made within the system,
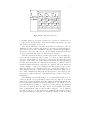
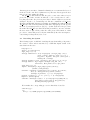
a “tock” is produced to introduce possible external changes. Another global synchronous event calculate is introduced after each tock and step. It occurs after
all external inputs or effects of the previous step have propagated themselves.
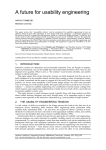
The sequence of these three actions is shown in Fig. 2.
external changes
tock
internal changes
calculate
no enabled transitions
step
variables change in order
Fig. 2. Sequence of tock, step and calculate
After a super-step, changes can be made to the inputs, and timers are advanced by one time unit. Inputs and changes to timers only happen on supersteps. After this we get as many small steps as are required until no further
progress is possible, i.e., there are no possible transitions without external changes
made by the environment. Inputs and timers do not change during the execution
of a small step. Within a small step, internal changes can be made to variables,
which is done by communicating with the variable processes.
2.4
Hierarchical Structuring
Statecharts are structured, and one chart can sit inside a single state of another.
The inner one is active only when the enclosing state is, and is turned off if the
enclosing one is left.
At the highest level the model of a chart combines three synchronous processes:
Sys represents the hierarchy of charts, VARSandTIMERS holds the values of variables and timers, and the combination of NOACT and TOX to enforce the timing
model and outputs. At the highest level a chart is defined as following:
System(Hierarchy) =
(VARSandTIMERS [|{|tock,calculate,step,ich,xch,iwrite,
read,readch,timer_read,timer_on,timer_cancel|}|]
6
Sys(Hierarchy,true,false))\{|ich,iwrite,read,readch,
timer_read,timer_on,timer_cancel|})
[|{|action,tock,step,turn_me_on,outp,xch|}|]
(NOACT[|{|tock,step|}|]TOX)
The parameter Hierarchy must be defined in the user script or as output
from a higher-level tool. The second parameter of Sys is set to “true” meaning
that the highest level machine in the hierarchy is initially on.
NOACT = action?_ -> ACTS
[] turn_me_on -> ACTS
[] STEPTOCK
STEPTOCK = tock -> NOACT
The step semantics is achieved through synchronization with the NOACT
process which obliges a step to happen as opposed to a tock just when there
has been an action since the last step or tock. The highest level chart has no enclosing state which can turn it on and off, so we forbid the actions “turn me on”
and “turn me off”.
ncSYSTEM(Hierarchy)= System(Hierarchy)
[|{|turn_me_on,turn_me_off|}|] STOP
Hierarchy The definition of the main type of chart structures is:
datatype Statechart =
SCTree.SGlabel.Set(ActLabel).Set((Statelabel,Statechart))
This recursive definition means that a chart is root behaviour identified by
one of these labels, a set of actions labels that are not to be promoted beyond
this point, and a set of pairs, each a state label of the present chart with a chart
which sits within it. We defined a function Sys()3 recursively that produces the
CSP representation of statechart. A chart with no lower level charts is compiled
using the function Machine()3, which creates a process from the description of
a sequential chart. Each sequential machine has an event proceed which is used
to enable subcharts to do things (implementing the priority rule). For the case
with no sub-machines this action is not required, and therefore we prevent it
by synchronisation with STOP. The actions are renamed to progress to discard
information unnecessary outside this level and to square the outer alphabet of
the process with what will be required outside.
Sys() is applied to all subcharts, which are then appropriately synchronised
with each other and also with the top level machine which has itself been created
with Machine(). We use many renamings and synchronisations to coordinate the
behaviour of these parts.
3
See full definitions of these functions in
http://web.comlab.ox.ac.uk/oucl/work/bill.roscoe/publications/115.pdf.
7
Sys(SCTree.label.acts.STs,initon,par_prom) =
let TopMach = Machine(sm(label),initstate(label),initon,par_prom,sc0)
...
within
(TopMach[[...]]
([|...|]v:{v’ | (v’,_) <- STs} @
(let ...
par_of_subs_of_V =
([|...|]sc:SCsInV @
((Sys(sc,v==startstate(label) and initon,par_prom’)
[[action.progress <- proceed.v]][[...]])))
within
(if par_prom’ then (par_of_subs_of_V
else par_of_subs_of_V)[[dummy <- peer_turn_off]]))) [[...]]
par of subs of V represents the construction for particular node’s subcharts.
Processes representing subcharts in different substates are synchronised, together
with the TopMach()3. Actions progress by inner machines are controlled by
events proceed, and all actions within this chart and not controlled outside is
renamed to progress.
Implementing Priority and Promotion Standard CSP, as implemented in
FDR has no priority. Any one of a set of the currently available actions can occur
next, and this is never made impossible by another action being enabled. This is
not the case in statecharts at several levels. It impacts upon the two-level model,
and on the relative priorities of transitions at low-level, high-level and inter-level
(promoted actions). Actions have names, but there is no synchronisation on
them between charts. Our model handles this by giving sequential components an
additional action progress which it perform precisely when there is nothing else
it can do on a given step. It is then possible to synchronise high-level progress
actions with low-level actions so that the latter only happen when no higherpriority action is possible [26].
Consider a high-level sequential machine whose states contain sub-statecharts
that run while the given state is enabled. Our model treats these subcharts as
separate parallel processes and so we need to link the behaviour of the highlevel state machine with the processes representing the subcharts. The model we
adopt is to give each chart (other than, perhaps, the highest-level one) events
“turn me on” and “turn me off” with the obvious effects. They are then (after
suitable renaming) synchronised with the transitions of the high-level machine.
An inner chart may perform an action which is promoted to be an action
of an outer one. Such an action must be named (not “progress”) and any
higher level chart that promotes it must use the same name. The actions of any
state are divided into primary ones that the state instigates itself and secondary
ones which are promoted by or through this state. To ensure charts running in
parallel to one with an action that is promoted higher get turned off, the process
Prom Mon is introduced:
8
Prom_Mon = tock -> calculate -> Prom_Mon’
Prom_Mon’ = let
P = one_prom -> Prom_Mon’’
[] step -> calculate -> Prom_Mon’
[] tock -> calculate -> Prom_Mon’
within
P [] local_over -> P
Prom_Mon’’ = one_prom -> action.error -> STOP
[] two_prom -> action.error -> STOP
[] peer_turn_off -> step -> calculate -> Prom_Mon’
2.5
Variables and Timers
Variables are defined as processes running parallel with the system. The variable
process implements many features of the semantics including the variable update
model. The CSP process shown below codes a variable:
VAR(id,range,v,ch)=
let
VARXI(v,v0) = member(id,InputIds)&xch?(_,v’):wrange(id)->VARXI(v’,v0)
[] calculate -> VARNC(v,member(id,changes) and (v!=v0))
[] member(id,Outputs) & outp.(id,v) -> VARXI(v,v0)
VARIW(v) =
iwrite.(id,v) ->
VARNC(v,ch) =
[]
[]
[]
VARII(v) =
VARII(v)
step -> VARII(v)
tock -> VARXI(v,if member(id,changes) then v else 0)
ich?(_,v’):wrange(id) -> VARIC(v’,ch)
member(id,changes) & readch.(id,ch) -> VARNC(v,ch)
calculate -> VARNC(v,false)
VARIC(v,ch) = step -> VARIW(v)
[] ich?(_,_):wrange(id) -> varerror -> STOP
[] member(id,changes) & readch.(id,ch) -> VARIC(v,ch)
RdVAR(v) = read.(id,v) -> RdVAR(v)
[] xch?(_,v’):irange(id) -> RdVAR(v’)
[] iwrite?(_,v’):wrange(id) -> RdVAR(v’)
within (tock -> VARXI(v,if member(id,changes) then v else 0))
[|union({|iwrite.p | p <- wrange(id)|},
{|xch.p | p <- irange(id)|})|] RdVAR(v)
Comments:
– Channels:
9
the channel for external changes, changes the value of variable
immediately, only possible on tock
ich:
the channel for internal changes, informs processes of real internal
changes of values after the calculation action
iwrite: the channel for internal writes, writes value variables, two of
which on the same variable in one step are an error
outp: the channel for outputs, helps analyzing
read: reads values from variables
readch: checks for changes
xch:
– The purpose of the parallel composition with process RdVAR(v) is to allow
a process to read the value of this variable from the previous step even after
it has been changed via ich on this one. The new value is assigned to take
effect after the variable has been changed via iwrite.
Note that our definition also has the properties that external inputs and
outputs only occur immediately after tock and two internal changes on one step
are an error. All variables are running in parallel, which produce a process for
the entire set of variables:
VARS = [|{step,calculate,tock}|] (id,v,r):union(Inputs,Variables)
@ VAR(id,r,v,false)
Timers are also defined as processes running parallel with the system. There
are three kinds of timers: one is set up on the entry to a state; one is addressed
by its own identifier name; another one is set up as a condition for transitions.
A timer is initialized to zero and incremented by one each tock until the corresponding limit is reached. The CSP process shown below codes a straightforward
timer:
Timer(l) =
[]
[]
[]
[]
timer_on.l -> Timer_Running(l,0)
timer_read.l.0 -> Timer(l)
timer_cancel.l -> Timer(l)
tock -> Timer(l)
step -> Timer(l)
Timer_Running(l,n) = tock -> (if n==tlimit(l) then Timer_Running(l,n)
else Timer_Running(l,n+1))
[] step -> Timer_Running(l,n)
[] timer_read.l.n -> Timer_Running(l,n)
[] timer_cancel.l -> Timer(l)
[] timer_on.l -> Timer_Running(l,0)
Comments on channels:
timer on:
turns the timer on, followed by initializing the timer to 0
timer cancel: cancels the timer, remove the timer from the list of active
timers
timer read: reads the current value of the timer
10
2.6
Translating statecharts into CSP
We analyse statecharts automatically by simulating them in CSP. In other words
we have a CSP process which accepts the description of a statechart S as a
parameter and then behaves like S. We can prove things about S by analyzing
this simulation on FDR.
The way the simulation is written is therefore as a CSP program which closely
resembles a translation from statechart syntax to behaviourally equivalent CSP.
The combination of the simulation operation and FDR’s own CSP compiler
produces a compiler from statecharts to FDR internal state machine code. For
simplicity we therefore refer to the code that creates the simulation as a compiler.
The current definitions of the CSP language mean that it does not have good
string processing. For that reason we supply the input statechart to it as a
member of a specially designed CSP type plus various ancillary definitions of
sets. In other words, by the time CSP sees the statechart, it has been parsed
and symbolized, see Section 4 for more details of this CSP syntax.
3
Specification Checking
Many checks can be implemented after the entire system is built. Typically
there are three types of checking: checks for general errors in the system, tests
for reachability of states, and checks for consistency with application–specific
requirements.
3.1
Checks for Errors
The simulation is written so that finitely detectable run-time errors are all flagged
by an error event:
error_events = {|action.error, varerror, outofrange, timer_overflow,
type_error|}
Event action.error indicates nondeterminism caused by ambiguous branching; event varerror indicates multiple writes on a small step; event outofrange
occurs when assigning a value which is out of range; event timer overflow indicates the attempt to read a timer that has reached the bound limit; event
type error occurs when a boolean expression produces result not 0,1.
The following standard check should be used for all charts:
delayable = {|xch,turn_me_on,turn_me_off,isat,outp|}
Time_Error_Spec = tock -> Time_Error_Spec
[](STOP |~| ([] x:delayable @ x -> Time_Error_Spec))
Time_Error_Imp(Hierarchy) = SYSTEM(Hierarchy)\
diff(Events,Union({{tock},delayable,error_events}))
Time_Error_Spec [FD= Time_Error_Imp(Hierarchy)
11
This refinement tests for all types of run-time errors, plus race conditions.4
It also ensures that there can never be an infinity of step events without an
infinity of tocks. It is this timing aspect of the check that explains the name.
This check uses the full power of failures/divergences refinement. However once
it is satisfied all subsequent checks will normally be done. A large proportion of
the errors we have discovered in industrial case studies have been via this check.
Race Condition Multiple writes to a variable on one small step lead to race
condition and are considered as an error. As showed in the definition of variables
in Section 2.5, an error message “varerror” would be returned by checking
through FDR.
Nondeterminism Ambiguous enabled actions by any single process cause nondeterminism. Each sequential machine should have at most one action available
at a time. Nondeterminism are considered as an error. If Nondeterminism exists
in the system, an event “action.error” will be returned by checking it through
FDR.
3.2
Reachability
To test whether a certain state in any chart can be reached at some point, the
following refinement is used:
indstates = {(chartlabel,statelabel)}
assert STOP [T= SYSTEM(Hierarchy)\diff(Events,{|isat|})
The set indstates 5 is used to indicate the state we want to test for reachability. The refinement fails if and when the intended state is reached and a trace
to describe how that state is reached can be provided by FDR. Note that this
check does not behave ideally with attempts to prove things about a chart under
non-deterministic parameters, since it will simply demonstrate that it is sometimes possible to reach the state, not that it is for all values of the parameter.
3.3
Analysis of Properties
Special requirements can be tested to ensure that they are satisfied by the system. Mostly one wants to check safety or security properties, which hold for
the whole lifetime of the system. As already mentioned, we model the formal
semantics of statecharts and requirements in the input script. Assume the chart
representing the requirement is labeled by spec label, the check can be made
as follows:
4
5
The check would fail if the simulation deadlocked. However deadlock is impossible
because of the way the simulation is constructed. This feature was useful in designing
the compiler.
See full definitions of isat and indstates in
http://web.comlab.ox.ac.uk/oucl/work/bill.roscoe/publications
/115statechartcompiler.csp.
12
SysAndSpec_sc = SCTree.Box.{}.{(0,Hierarchy),(0,lift(Spec_label))}
assert STOP [T= SYSTEM(SysAndSpec_sc)\diff(Events,{action.spec_error})
The event action.spec error indicates that the requirement is not satisfied.
4
Case Study: Burglar Alarm System
Burglar Alarm
Main Controller
go
go := false
lighton := 0
Report
go
go := false
siren := false
true
go,siren, lighton := false, false, 0
Key Pad
Disarmed
Pad_inactive
go
go := false
go
go := false
lighton := 0
go
go := false
go
go := false
Returning
Alarmed
Armed
Error_Wait
en[4]
go := true
en[4]:=false
Leaving
Pad_Active
not press &
timer(Key_Count,Idle_Time)
not go &
alarm = 1
lighton :=alarm
not go &
timer(Returning,Return_Time)
timer(Error_Wait, EW_Time)
ch(press) &
press
en[0] := true
Digit (0) Digit (1)
not go &
timer(Leaving,Leave_Time)
Digit (2) Digit (3)
not go &
alarm != 0
siren := true
lighton :=alarm
Digit(i)
true
en[i+1] = (i=0)&(key=d[i])
Dig (i)
ch(press) &
press &
kc=key_limit
true
kc := 0
Key_Count
Key
Manager
ch(press) & press & kc < key_limit
kc := kc + 1
Key_Manager
true
press := false
Key_Man
ch(press) & press
en[i+1] :=( key=d[i] ) & en[i]
ch(press) & press
press := false
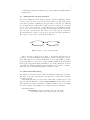
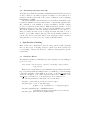
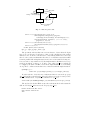
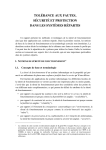
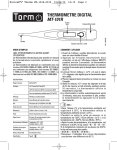
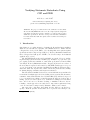
Fig. 3. Burglar Alarm System
A practical case study is the burglar alarm control system. The system provides a very typical example with the features like multiple parallel subcharts,
inter-level transitions etc. (see Fig. 3)
The alarm is constructed of two nearly independent parallel processes: one is
the number pad that determines (subject to things like timeout and too many
attempts as limitations) when the last D digits input are the code number for
arming and disarming the alarm.
The Main Controller chart moves the alarm between its principal states:
correctly typing in the code number (generating the go signal) will move it from
disarmed to leaving (which times out to armed) and back to disarmed. If the
alarm goes off we can type in the number once to turn off the siren and once
to get rid of the signal light that tells us where the alarm came from. The state
13
Returning gives some time to disarm the alarm if someone returns and is detected
in the area of the controller box (Alarm zone 1). The state Leaving gives the user
time to leave after arming the alarm.
The Key Pad chart indicates that the pad becomes active when a key is
pressed. It goes back to inactive if either the code is correctly entered or if too
long has passed since the previous press. If more than kc digits are used in an
attempt to key the code, a wait is imposed. The five constituents of Pad Active
all run in parallel while that state is running, and similarly the main graph and
Key Manager. The chart Digit indicates that if the digit just pressed is d[i] and
the most recent digits pressed are d[0]..d[i − 1] then enable the next process in
the chain. The Key Manager chart shows that press will become true each time
the user enters a digit, and key takes the value pressed. The function of this
process is to ensure that press is only true immediately after the users input so
a user-change is always from false to true.
4.1
Describing the System
The following is part of a CSP file describing the statechart in Fig. 3. In practice
the creation of these files is automated by a GUI that inputs details of the
statechart from the user.
Pad_Digits = 4
digits = {0..Pad_Digits-1}
digit_range = {0..1}
datatype Identifiers = en.{0..Pad_Digits} | d.digit_range | key |
press | alarm | lighton | siren | go | kc |
key_limit | EW_Time | Idle_Time | Leave_Time |
Return_Time | lastdigs
datatype ActLabel = error | progress | spec_error | kc_ew | kc_pa
datatype SGlabel = Digit.digits | Mainpad | Key_Man | KC |
Controller | Whole_Alarm | Box | Spec_label
alarm_zones = {0..3}
Inputs = union({(key,0,digit_range),(press,0,nbool)},
{(alarm,0,alarm_zones)})
Variables = {(lighton,0,alarm_zones),(en.j,0,nbool),(go,0,nbool),
(kc,0,{0..CV(key_limit)+1}),(siren,0,nbool),
(lastdigs,<>,prefixes) | j <- {0..Pad_Digits}}
prefixes = {<CV(d.i) | i <- <0..j-1>> | j <- {0..Pad_Digits}}
Outputs = {siren,lighton}
Constants = union({(d.i,i%2)| i <- {0..Pad_Digits-1}},{(EW_Time,1),
(Idle_Time,1),(Leave_Time,1),(key_limit,12),
(Return_Time,Pad_Digits+1)})
We formulate the corresponding process for chart Main Controller:
Controller_sg =
let
State_0 = (0,<(TRUE,progress,<(go,FALSE),(siren,FALSE),
14
(lighton,ZERO)>,1)>,<>)
Disarmed_1 = (1,<(Ival(go),progress,<(go,FALSE)>,2)>,<>)
Leaving_2 = (2,<(Ival(go),progress,<(go,FALSE)>,1),
(andf(notf(Ival(go)),timer(En.(Controller,2),
Ival(Leave_Time))),progress, <>,3)>,<>)
Armed_3 = (3,<(Ival(go),progress,<(go,FALSE)>,1),
(andf(notf(Ival(go)),notf(gt(Ival(alarm),ONE))),
progress,<(siren,TRUE),(lighton,Ival(alarm))>,4),
(andf(notf(Ival(go)),notf(eqf(Ival(alarm),ONE))),
progress,<(lighton,Ival(alarm))>,6)>,<>)
Alarmed_4 = (4,<(Ival(go),progress,<(go,FALSE),(siren,FALSE)>,5)>,<>)
Report_5 = (5,<(Ival(go),progress,<(go,FALSE),(lighton,ZERO)>,1)>,<>)
Returning_6 = (6,<(Ival(go),progress,<(go,FALSE)>,1),
(andf(notf(Ival(go)),timer(En.(Controller,6),
Ival(Return_Time))),progress,
<(siren,TRUE)>,4)>,<>)
within {State_0,Disarmed_1,Leaving_2,Armed_3,Alarmed_4,Report_5,
Returning_6}
Controller_g = (Controller_sg,Controller,0,{go})
The processes for charts Key Pad, Digit, and Key Manager are defined similarly to this. We collect information together for whole system:
Timed_Nodes_Lim = {((Controller,2),CV(Leave_Time)),
((Controller,6),CV(Return_Time)),
((KC,1),CV(Idle_Time)), ((Mainpad,2),CV(EW_Time))}
AllCharts = {Spec_g,Box_g(Box),kc_g,KeyMan,Digit_g(i),Mainpad_g,
Controller_g | i <- digits}
Burglar_Alarm_sc = SCTree.Box.{}.{(0,Pad_sc),(0,lift(Controller))}
4.2
Property Checking
A property can be verified against the system by trace refinement of the corresponding CSP processes. There are two possible ways of verification depending
on the representation of properties: representation as statecharts or implementation as CSP directly.
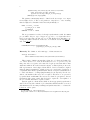
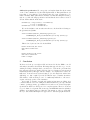
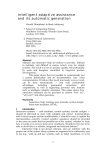
Statechart specification The first case means trivially using the existing
translation. For showing an example of an analysis driven by the presented
approach we use the statechart specification of a watch dog (Fig. 4). The requirement is: the siren never goes off until firstly the code number has been
typed in and secondly an alarm signal has appeared. Now we translate this
statechart into the input script for our compiler:
Spec_sg =
let
15
State 0
siren spec_error
ch(press) & press lastdigs = code
lastdigs := snocf(key,lastdigs)
State 2
siren
State 1
spec_error
alarm != 0
Fig. 4. A Watchdog Statechart
State0 = (0,<(Ival(siren),spec_error,<>,2),
(andf(ch(press),Ival(press)),progress,
<(lastdigs,snocf(Ival(key),Ival(lastdigs)))>,0),
(eqf(Ival(lastdigs),K(<CV(d.i) | i <- <0..3>>)),
progress,<>, 1)>,<>)
State1 = (1,<(Ival(siren),error,<>,2),
(notf(eqf(Ival(alarm),K(0))),progress,<>,2)>,<>)
State2 = (2,<>,<>)
within {State0,State1,State2}
Spec_g = (Spec_sg,Spec_label,0,{})
The specification shows that it moves from State0 to State1 when the digits
have been correctly entered, and prior to that does the calculations to know when
this has been done. It moves from State1 to State2 when alarm is not 0, and only
then does it not raise an alarm when the siren does off. This is a statechart which
is run in parallel with an implementation and can read its variables. It may not,
however, write to any variable used by the implementation. Its function is to keep
track (as it wishes) of what goes on and to raise a flag (spec error) which can
be caught by the Time and Error check if the implementation does something
wrong. These conditions mean that it never interferes with the implementation.
SysAndSpec_sc =
SCTree.Box.{}.{(0,Burglar_Alarm_sc),(0,lift(Spec_label))}
Now the task is to check the trace refinement relation between the property
Spec label and the system Burglar Alarm. For that reason it is necessary to hide
all the communication of SysAndSpec which is not spec error.
assert STOP [T= SYSTEM(SysAndSpec_sc)\diff(Events,{action.spec_error})
The used model checker FDR executes the refinement check and returns the
CSP model Burglar Alarm meets the Property Spec label:
Refine checked 199,245 states.
With 1025751 transitions.
True
16
CSP-style specification We can specify our burglar alarm directly in terms
of the events communicated by the CSP implementation. This particular model
is not that good for this type of specification since the event of typing in a code
number is rather diffuse (and almost certainly better handled using the watchdog
style above). The following specification asserts that the siren cannot sound for
at least k time units from the start:
SirenWait(0) = outp.(siren,1) -> SirenWait(0)
[] tock -> SirenWait(0)
SirenWait(k) = tock -> SirenWait(k-1)
We can check this for various values via the trace check and the following are
the (parameterised) limit.
assert SirenWait(CV(Leave_Time)+Pad_Digits+1) [T=
SYSTEM(Burglar_Alarm_sc)\diff(Events,{tock,outp.(siren,1)})
assert SirenWait(CV(Leave_Time)+Pad_Digits+2) [T=
SYSTEM(Burglar_Alarm_sc)\diff(Events,{tock,outp.(siren,1)})
This is done by the used model checker FDR.
Refine checked 185,362 states.
With 955557 transitions.
True.
Refine checked 13,028 states.
With 67109 transitions.
Found 1 example.
5
Conclusion
We have used the process algebra CSP and its model checker FDR to model
and analyse Statemate Statecharts. Following this approach, the scope of some
existing modeling techniques has been widened to address the problems that
have arisen in various case studies. We have discovered many errors in practical
industrial systems by this approach. For example, our compiler has been successfully used on an automotive system design project, the single lane architecture
(QinetiQ), etc. Our compiler provides an efficient way to translate Statemate
Statecharts to CSP and has proven to be sufficiently malleable to allow us to
capture various properties of the semantics.
As a result of extensive research and studies in Statemate modelling, it is
concluded that the idea of modelling statecharts in CSP has opened up, and will
continue opening up, many opportunities for researches to model various graphic
specifications which are widely used for complex systems. There is enormous
scope for future development. The next target is MATLAB Stateflow (which is
similar to statecharts). It is hoped that the demonstration of how to apply CSP
theory to statecharts will inspire new approaches to standard graphic notations.
17
References
1. R. Anderson, P. Beame, S. Burns, W. Chan, F. Modugno, D. Notkin, and J. Reese,
Model checking large software specifications, IEEE Transactions on Software Engineering, Vol. 24, No. 7, pp. 498-520, 1998.
2. T. Bienmuller, J. Bohn, H. Brinkmann, U. Brockmeyer, W. Damm, H. Hungar,
and P. Jansen, Verification of automotive control units, in E.-R. Olderog and B.
Steffen (Eds.), Correct System Design, Springer Verlag, Berlin, 1999,number 1710
in LNCS, pp. 319-341.
3. T. Bienmuller, U. Brockmeyer, W. Damm, G. Dohmen, H.-J. Holberg, H. Hungar,
B. Josko, R. Schlor, G. Wittich, H. Wittke, G. Clements, J. Rowlands, and E.
Sefton, Formal verification of an avionics application using abstraction and symbolic model checking, in F. Redmill and T. Anderson (Eds.), Towards System Safety
- Proceedings of the Seventh Safety-critical Systems Symposium, Huntingdon, UK,
Safety-critical Systems Club, Springer Verlag, Berlin, 1999, pp. 150-173.
4. J.R. Burch, E.M. Clarke, and D.E. Long, Symbolic model checking with partitioned
transition relations, In VLSI 91, Edinburgn, Scotland, 1990.
5. J.R. Burch, E.M. Clarke, K.L.McMillan, and D.L.Dill, Sequential circuit verification using symbolic model checking, In 27th ACM/IEEE Design Automation
Conference, 1990.
6. J.R. Burch, E.M. Clarke, K.L.McMillan, D.L.Dill, and J. Hwang, Symbolic model
checking: 10E20 states and beyond, In LICS, 1990.
7. T. Bienmuller, W. Damm and H. Wittke, The Statemeat Verification Environment
– Making it real, In: Proc. CAV, LNCS 1855, pp. 561-561, Springer, 2000.
8. E.M. Clarke, O. Grumberg and D.E. Long, Model Checking and Abstraction, In proceedings of the Nineteenth Annual ACM Symposium on Principles of Programming
Languages,1992.
9. W. Damm and D. Harel, LSCs: breathing life into message sequence charts, in
FMOODS’99 IFIP TC6/WG6.1 Third International Conference on Formal Methods for Open Object-Based Distributed Systems, Kluwer Academic Publishers,
NY, 1999.
10. W. Damm, B. Josko, H. Hungar, and A. Pnueli, A compositiona real-time semantics
of STATEMATE designs, in W.-P. de Roever (Ed.), Proceedings, International
Symposium on Compositionality-The Significant Diference, Springer-Verlag, 1998,
Lecture Notes in Computer Science.
11. W. Damm and J. Klose, Verification of a radio-based signalling system using the
Statemate verification environment, Formal Methods in System Design 19:121-141,
2001.
12. H. Eshuis and R. Wieringa, A Formal Semantics for UML Activity Diagrams C
Formalising Workflow Models, Technical Report, 2001.
13. Formal Systems (Europe) Ltd., Failures-Divergence Refinement, User Manual, obtainable from http://www.fsel.com/fdr2 manual.html
14. K. Fuhrmann and J. Hiemer, Formal Verification of STATEMATE-Statecharts,
Citeseer.nj.nec.com/255163.html, 2001.
15. W.J. Fokkink and P. Hollingshead, Verification of interlockings: from control tables
to ladder logic diagrams, in Proceedings of the 3rd Workshop on Formal Methods
for Industrial Critical Systems-FMICS’98, Amsterdam. Stichting Mathematisch
Centrum, 1998.
18
16. K. Feyerabend and B. Josko, VIS: A visual formalism for real time requirement
specifications, in Proceedings of the 4th International AMAST Workshop on RealTime Systems and Concurrent and Distributed Software, ARTS’97, Lecture Notes
in Computer Science 1231, 1997, pp. 156-168.
17. T.V. Group, VIS: A system for verification and synthesis, in 8th international
Conference on Computer Aided Verification, number 1102 in LNCS, 1996.
18. D. Harel and A. Naamad, The Statemate Semantics of Statecharts, Technical Report, i-Logix, 1995.
19. D. Harel, H. Lachover, A. Naamad, A. Pnueli, M. Politi, R. Sherman, and A.S.
Trauring, Statemate: A Working Environment for the Development of Complex
Reactive Systems, IEEE Transactions on Software Engineering, 16, 4, 1990.
20. J. Hudak, S.C. Dorda, D.P. Gluch, G. Lewis and C. Weinstock, Model-Based Verification: Abstraction Guidelines, Technical Note CMU/SEI-2002-TN-001, 2002.
21. D. Harel and M. Politi, Modeling Reactive Systems with Statecharts: The STATEMATE Approach, Part No.D-1100-43, i-Logix Inc., Three Riverside Drive, Andover,
MA 01810, June 1996.
22. The MathWorks, Stateflow, User Manual, obtainable from
http://www.mathworks.com/access/helpdesk/help/toolbox/stateflow/ug/
23. E. Mikk, Y. Lakhnech, C. Petersohn and M. Siegel, On Formal Semantics of Statecharts as Supported by STATEMATE, Technical Report, BCS-FACS Northern
Formal Methods Workshop, 2, Ilkley, 1997.
24. L.E. Moser, Y. Ramakrishna, G. Kutty, P. Melliar-Smith, and L. Dillon, A graphical
environment for design of concurrent real-time systems, ACM Transactions on
Software Engineering and Methodology, Vol.6, No. 1, pp.31-79, 1997.
25. A.W. Roscoe The theory and practice of concurrency, Prentice-Hall International,
1998.
26. A.W. Roscoe, Compiling Statemate Statecharts into CSP and verifying them using
FDR – abstract, Technical Report, 2003.