1
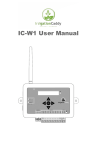
SAVINGWATER:THERE’SANAPPFORTHAT! by Robert Ryan Trenholm A THESIS SUBMITTED IN PARTIAL FULFILLMENT OF THE REQUIREMENTS FOR THE DEGREE OF BACHELOR OF SCIENCE HONOURS in The Irving K. Barber School of Arts and Sciences (Honours Computer Science Major Computer Science Minor Psychology) THE UNIVERSITY OF BRITISH COLUMBIA (Okanagan) April 2012 © Ryan Trenholm, 2012 ABSTRACT It is estimated that between 60% and 70% of municipal water usage is for residential lawn irrigation. Climate change, population growth and increased consumption require more efficient management of our water resources. The rapid development in mobile technology presents new opportunities to engage users about how their irrigation systems work and encourage them to use those systems more wisely. The primary focus of the project was to provide an effective tool to visualize irrigation and sensor based data, with the intended users being large institutional irrigation users such as city park managers. The tool was developed as an extensible Android app and was required to be usable, convenient and user‐friendly in order to be effective. Mobile development uses a different paradigm compared to web development specifically when displaying graphs, charts and maps. Challenges involved in developing a mobile application include the smaller screen sizes, the different user interaction and navigation of the interface, and the limited storage and processing resources on mobile devices. Mobile applications allow developers to take advantage of specific features of mobile devices, such as the GPS, to provide users with personally relevant information and a more convenient interface for their irrigation systems and more sustainable watering habits. TABLE OF CONTENTS Abstract .......................................................................................................................................................... i Table of Contents .......................................................................................................................................... ii Table of Figures ............................................................................................................................................ iii Acknowledgements ...................................................................................................................................... iv 1 Introduction .......................................................................................................................................... 1 1.1 Motivation ..................................................................................................................................... 1 1.2 Goals and Objectives ..................................................................................................................... 2 1.3 Contributions ................................................................................................................................ 2 2 Background ........................................................................................................................................... 3 2.1 Terms ............................................................................................................................................ 3 2.2 Irrigation and Sensor Data ............................................................................................................ 4 2.3 Mobile Development Paradigm .................................................................................................... 4 2.4 Usability Measures ........................................................................................................................ 4 2.5 Commercial Irrigation Apps .......................................................................................................... 5 3 Irrigation Advisor App – User Manual ................................................................................................... 8 3.1 Installing the App .......................................................................................................................... 8 3.2 Starting the App ............................................................................................................................ 8 3.3 Navigating the Different Screens .................................................................................................. 9 3.4 Latest Updates Activity ................................................................................................................. 9 3.5 Map of the Park Activity ............................................................................................................. 11 3.6 Sensor Readings Activity ............................................................................................................. 12 3.7 Watering Events Activity ............................................................................................................. 13 3.8 Statistics Activity ......................................................................................................................... 14 4 Irrigation Advisor App – Technical Details .......................................................................................... 15 4.1 Developing for Android using Eclipse ......................................................................................... 15 4.2 Getting the Data from the Server ............................................................................................... 15 4.3 Irrigation Advisor Database ........................................................................................................ 16 4.4 Using AndroidPlot for Drawing the Graphs ................................................................................ 17 5 Server Application ............................................................................................................................... 18 5.1 Server Database .......................................................................................................................... 18 5.2 advisor.php ................................................................................................................................. 18 6 Discussion and Conclusion .................................................................................................................. 19 6.1 Discussion .................................................................................................................................... 19 6.2 Conclusion ................................................................................................................................... 20 6.3 Future Work ................................................................................................................................ 20 7 References .......................................................................................................................................... 21 TABLE OF FIGURES Table 1: Comparison of features between the three commercial irrigation apps. ...................................... 6 Figure 1: The three commercial irrigation apps which fit the feedback and management criteria. ............ 5 Figure 2: Screenshot of the PureSense Irrigation Manager app featuring its misuse of screen space by displaying seven graphs on a single screen. [25] ............................................................................. 7 Figure 3: Demonstration of the spinning progress wheel and message to inform users that new data is being downloaded from the server. ................................................................................................ 8 Figure 4: Screenshot of the navigational menu highlighting the button to the Latest Updates screen when the user is viewing that screen. ............................................................................................. 9 Figure 5: Screenshot of the navigational menu highlighting a different button for when the user is viewing the Watering Events screen. ............................................................................................... 9 Figure 6: Screenshot of the soil water gauge on the left‐hand side of the Latest Updates activity. ............ 9 Figure 8: Demonstration of showing the message displayed when data is downloaded to the app. ........ 10 Figure 7: Screenshot of the right‐hand side of the Latest Updates activity with the latest irrigation information, as well as the Refresh Data button on the bottom corner. ...................................... 10 Figure 9: Screenshot of the Map of Park activity. ....................................................................................... 11 Figure 10: Demonstration of the pop‐up info window when a node is pressed by the user. .................... 11 Figure 11: Screenshot showing the Sensor Readings activity. .................................................................... 12 Figure 12: Drop‐down list to select a node ID to view that node’s moisture readings. ............................. 12 Figure 13: Screenshot of the Watering Events activity. .............................................................................. 13 Figure 14: Screenshot of the Statistics activity. .......................................................................................... 14 Figure 15: Diagram showing how the app gets and stores the irrigation data from the server. ............... 15 Figure 16: The database entity relationship diagram for the SQLite database used by the Irrigation Advisor app. ................................................................................................................................... 16 ACKNOWLEDGEMENTS Foremost, I would like to express my utmost gratitude to Dr. Ramon Lawrence, my honours supervisor and database professor. Without his encouragement I would not have strived for my honours status nor would I have gained this valuable experience! His guidance has been absolutely amazing, and I am truly grateful for his support and mentorship. I would also like to offer my regards and deepest appreciation to all my friends and family who supported me in any respect during the completion of my honours project. Thank you all. 1 INTRODUCTION 1.1 MOTIVATION Canada is one of the world’s largest consumers of fresh water [11]. With a growing population, changes in the climate and an increased overall consumption, the demand for fresh water resources is increasing against a limited supply. While nearly 60% of the world’s fresh water is used for agricultural irrigation [22], large amounts of that fresh water are also being used for irrigating parks and recreational green spaces. In semi‐arid regions such as the Okanagan Valley, approximately 20% of peak summer time water usage is for irrigating city parks [33]. Further, between 60% and 75% of municipal water usage is for residential lawn irrigation [9, 20]. Society has turned to automatic and timed irrigation systems in an effort to conserve water while maintaining lawns and green spaces. However, these technologies are often not being used correctly, and the problem of overwatering from mismanagement is primarily a human factor [4]. People often set up their timed irrigation systems in the spring and leave them running unchanged through the summer and fall, which can lead to increased water usage and wastes water unnecessarily. This problem of mismanagement can be corrected through increased awareness and education on how the water is used [5]. Previous research has shown that significant savings in water can be achieved using a data delivery framework that provides real time feedback to users [13]. The rapid development in mobile technology presents new opportunities to engage users about how their irrigation systems work and encourage them to use those systems more wisely. Mobile technology is making many aspects of our lives easier and more convenient. As of February 2012 there were “more than 450,000 apps available for Android, and the estimated number of apps downloaded…exceeded 10 billion” [28]. It would be negligent to ignore such a large and growing market as a means to educate people and increase their awareness on how to be more effective in managing our water resources. 1 1.2 GOALS AND OBJECTIVES There are two major goals for this project. The first goal is to provide an effective tool to visualize irrigation and sensor based data, with the intended users primarily being large institutional irrigation users such as city park managers and employees. The tool will be developed as an Android app, and needs to be extensible so that it can be easily modified to provide users with whichever type of feedback is most appropriate for a given context. For example, if the app is to be used by residential irrigation users, then it only needs to provide basic feedback such as when the last time their lawn was watered and how much water was used. For city park managers, the app needs to provide more complex feedback including graphs of the historical water usage in a park as well as historical graphs of the moisture content of the soil. The second goal was to ensure that the developed Android app is usable, convenient, and user‐ friendly. To do this, development followed usability measures following several of the principles of human‐computer interaction (HCI) such as consistency in the structure and navigation, legibility of text and buttons, and feedback on actions and changes of state. 1.3 CONTRIBUTIONS The contributions of this thesis include an extensible application framework which can be used by city park managers to retrieve and view relevant and useful irrigation information about their parks. This app can help managers regulate water usage in the city parks to be more sustainable and responsible over our water resources. 2 2 BACKGROUND 2.1 TERMS Activity – for an Android app, it represents a single screen with a user interface. [14] ADT – abbreviation of ‘Android Development Tools,’ ADT is a plugin for Eclipse to enable developers to use the Android SDK within Eclipse. Android – is Google’s operating system for mobile devices such as smartphones and tablet computers, with the latest version released known as Android 4.0 (Ice Cream Sandwich). AndroidPlot – a “pure Java API for creating static and dynamic charts for Android applications…designed exclusively for the Android platform.” [2] Android SDK – the Android software development kit (SDK) is a “comprehensive set of development tools, including a debugger, libraries, handset emulator, documentation, sample code, and tutorials.” [29] Apps –also called mobile apps or mobile applications, they are software applications designed to run on smartphones and tablet computers. Eclipse – is the development environment used in this project for writing the Java and XML files required for development of a mobile app. ET – abbreviation of “Evapotranspiration,” it is the process of water loss due to transpiration from plants and evaporation from the soil it is growing in. Field Capacity – the maximum amount of water that the soil can hold, usually expressed as a percentage; any further water added to the soil runs off or seeps right through the soil. GET Request – a type of method to request a resource or information from the internet. Google Play – formerly known as Android Market, it is a digital content service from Google which includes an online store for music, movies, books, and Android apps and games. [18] HCI – abbreviation of ‘Human‐Computer Interaction,’ it is the study, planning, and design of the interactions and interfaces between people (users) and computers. Java – “is a programming language originally…released in 1995 as a core component of Sun Microsystems' Java Platform” [30]. Android apps are written primarily with Java. JSON – abbreviation of ‘JavaScript Object Notation,’ it is a “lightweight text‐based open standard for human‐readable data interchange”. [31] MySQL – is a relational database management system that provides multi‐user access to a number of databases. Permanent Wilting Point – is the point at which plants suffer irreparable damage due to the lack of water resources in the soil. [13] PHP – is a “general‐purpose scripting language originally designed for Web development” [32]; for this project, it was used to write the program on the server. SQLite – is a lightweight relational database used for data storage purposes and is well suited to embedded systems such as Google’s Android operating system. Water Moisture Content – the amount of water in the soil, usually expressed as a percentage. [13] 3 2.2 IRRIGATION AND SENSOR DATA The data used for this project is from a previous research project [13] and was collected from July 2011 until October 2011. The type of information gathered included soil moisture readings, length of time for scheduled and calculated watering events, and the time that all readings and events occurred. As well, further information on the number of sensors, nodes, zones, and the field capacities and wilting points of each irrigation zone was also recorded. This data was chosen for this project because it is real data extracted from an actual city park, as well as its relevance for city park managers, the intended users for the developed app, in regulating water usage in city parks. 2.3 MOBILE DEVELOPMENT PARADIGM Developing an application for a mobile device has some fundamental constraints which need to be considered. The first is the smaller screen size of the mobile devices which requires effective management of the layout, organization and size of elements on the screen such as the user interface, text boxes and graphs. The next constraint is the touch screen interface commonly found on recent mobile devices. This requires elements on the screen to be an appropriate size to interact with as well as conforming to user’s expectations about how they will interact with those elements, such as pinching their fingers to zoom in or swiping the screen to scroll to different areas on the screen. Another constraint is the limited storage and processing power of mobile devices compared to traditional computer hardware, which affects how much data can be stored on the device as well as how graphs and maps can be displayed. Finally the last constraint that needs to be considered is the usability and responsiveness of the app, which is extremely important because if a user feels that the app reacts slowly and unpredictably or if the interface seems to be confusing and cluttered, then they are less likely to use the app and it will not be as effective. 2.4 USABILITY MEASURES To ensure the usability and effectiveness of the Irrigation Advisor app, several HCI principles were considered from [1, 6, 10] throughout the development process. The app is defined as being usable, having a good interface and being user‐friendly by having the following characteristics: Consistency in the layout and organization of elements in the interface structure, navigation, style of the text and use of color to provide a predictable and intuitive user experience. Purposeful and meaningful organization of the interface, with balanced and uncluttered placement of elements on the screen to effectively use the screen space of the mobile device. Legibility of the text by ensuring good use of font size, style, and contrast between text and background colour. Intuitive and natural control of interactive elements, ensuring a natural mapping among user gestures and changes in the content on the screen when using the app. Informative feedback by providing distinguishable animations when touching different elements on the screen or appropriate notification of delays and changes in state of the app. 4 Responsiveness of the app and interactive elements in an appropriate, predictable and timely manner according to a user’s expectations. 2.5 COMMERCIAL IRRIGATION APPS While there have been previous attempts to create interactive interfaces for visualizing and management of sensor data [23, 24], very few are concerned with irrigation based data and only a few industrial companies are currently using mobile technology as a platform to provide their services [25]. Searching the Android and Apple app markets for any apps that are related to irrigation in some manner brings about four categories: games, product catalogs, remote controllers, and feedback‐based management apps. Games and product catalog apps were excluded from consideration in this thesis due to the fact that those types of apps are not appropriate for the topic of visualizing irrigation and sensor based data. However, the use of mobile games as a method to increase awareness and education about issues around water usage would be an interesting topic for further research. The two remaining categories of apps are the remote controller apps, which can be used to remotely control the user’s irrigation system, and the feedback‐based management apps, which can be used to advise the user on how they should be managing their irrigation system. The remote controller apps, while very interesting, do not by themselves solve the problem of helping the user to manage their water usage better. The Cyber‐Rain app [7] for the Cyber‐Rain Irrigation Control System [8] and the EZVRC app [12] which can be used with the IrrigationCaddy irrigation controller [21] are two of the remote controller apps available on the Android and Apple markets. However, as mentioned earlier, the biggest factor in overwatering is human mismanagement of the irrigation technologies. So unless these remote controller apps also provide some sort of feedback to the user as well, then they were excluded from consideration in this thesis. Thus this thesis focuses solely on the apps which provide some form of feedback to the user about how they should manage their irrigation system and water usage. Surprisingly, there were only three apps currently on the Android and Apple app markets which fell into this category: the PureSense Irrigation Manager app [25] (Figure 1a), the SprinkWise Irrigation Assistance [27] (Figure 1b), and the Sprinkler Times app [26] (Figure 1c). Figure 1: The three commercial irrigation apps which fit the feedback and management criteria. 5 The biggest question that arises is “why are there so few apps about to assist irrigation systems?” The most likely explanation is that there is a large variety of different types of automated and timed irrigation systems and each of them has their own proprietary hardware and software that they use. Currently, it is up to the individual companies to develop any apps for use with their irrigation systems. This makes it very difficult for any third‐party developers to try to create any apps to provide feedback and advice to users on how to better manage their irrigation and water usage. The PureSense app is developed by the company of the same name which provides irrigation systems and management options and it is primarily focused on large agricultural businesses. The SprinkWise and Sprinkler Times apps are for residential users primarily and do not actually use any information from the irrigation system itself. Rather, they use weather prediction and ET models to suggest to the user when they should be watering their lawns. A comparison of the apps is listed below. Table 1: Comparison of features between the three commercial irrigation apps. app name manufacturer price of app mobile OS compatibility additional hardware required estimated downloads key features PureSense Irrigation Manager [25] PureSense free app but PureSense subscription required; system and services costs $744/month ‐ Android 1.5 and up ‐ iOs 4.3 or later PureSense Field Monitoring Systems 500 ‐ 1000 ‐ Map and lists of soil moisture sensors and readings ‐ Historical charts for soil moisture, climate and irrigation system; ‐ Custom alerts for frost or moisture levels ‐ Irrigation planning and scheduling service SprinkWise Irrigation Assistance [27] SprinkWise LLC $4.99 yearly subscription ‐ iOs 4.0 or later none information unavailable ‐ Historical table of weather and irrigation activity ‐ Weather and ET forecasts ‐ Daily watering schedule ‐ Proper lawn care tips Sprinkler Times [26] Garden Apps LLC $5.99 yearly subscription ‐ Android 2.2 and up ‐ iOs 4.0 or later none 50 ‐ 100 ‐ Timer application for up to 32 irrigation zones ‐ Monthly watering schedules for lawn ‐ Video usage tutorials These apps suffer from some limitations. The first is that all three of them are subscription based, requiring a yearly fee in order to use their services, and the PureSense app further requires purchasing their irrigation systems and hardware which can cost hundreds of dollars more. This can be a deterrent for some users making them reluctant to use these apps. Another major limitation is that 6 these apps are region‐locked, meaning they can only be used if you live in the continental United States of America. Finally, the biggest limitation is that these apps suffer from poor usability. They do not make good use of screen size, as demonstrated in (Figure 2) where the PureSense app tries to display seven different graphs on a single screen, making it virtually unreadable on mobile devices. If these apps are not usable, then people will not continue to use them and they will not be very effective in helping the user to better manage their water usage. Figure 2: Screenshot of the PureSense Irrigation Manager app featuring its misuse of screen space by displaying seven graphs on a single screen. [25] 7 3 IRRIGATION ADVISOR APP – USER MANUAL 3.1 INSTALLING THE APP Currently, the app is not released for public download from Google Play. The only alternative options for installing the app are to connect a compatible Android device up to a computer with the app on it and then build the app onto the device directly, or to download the app from either email or an internet web hosting and install the app indirectly onto the device. In any of these alternative cases, the Android device needs to be set to allow installation from unknown sources since Android systems will not normally install or run apps which were not downloaded from Google Play. If the app were to be published onto Google Play in the future, then installation would be as simple as navigating to the Irrigation Advisor app listing on Google Play and pressing the install button to automatically download and install the app onto the Android device. To publish an app onto Google Play, developers are highly recommended to follow the publishing guide [16], which will take them through the steps of registering a Google Play developer account, uploading the app to Google Play, configuring various publishing options and finally publishing the app for public download. Developers must pay an initial one‐time $25 fee and then agree to and abide by the Google Play Developer Distribution Agreement. As well, if the developer wishes to charge a fee for their app, they must further acquire and maintain a valid Payment Account from an authorized Payment Processor. Finally, developers are solely responsible for supporting and maintaining their apps, as well as resolving complaints about their apps. All this information is within the publishing guide [16]. 3.2 STARTING THE APP When a user first opens the Irrigation Advisor app, the app immediately checks the device to see if the internal SQLite database exists and if there is any of the required data in it, including information about the irrigation zones, sensors and nodes, sensor readings, and watering events. If the database does not exist or is empty, then the app will display a spinning progress wheel and message to instantly tell the user to please wait (Figure 3) while the app downloads the required information from the server. This is to provide immediate feedback to the user on the current state of the app. Once the data has been downloaded and stored onto the device, the progress wheel is removed and the Latest Updates screen is displayed (Figure 6, Figure 7). However if the app initially determined that the database existed and was not empty, then the app would instead immediately display the Latest Updates screen to the user since it would not need to download the information from Figure 3: Demonstration of the spinning progress wheel and message to inform users that new data is the server. being downloaded from the server. 8 3.3 NAVIGATING THE DIFFERENT SCREENS Each activity screen has a navigation bar at the top of the screen, with buttons linking to each different activity within the app. The button for the activity that the user is currently viewing will glow with a blue highlight (Figure 4), and when they move to a different screen, the button for the new screen becomes highlighted instead (Figure 5). This allows the user to quickly and easily keep track of which screen they are currently viewing while using the Irrigation Advisor app. Figure 4: Screenshot of the navigational menu highlighting the button to the Latest Updates screen when the user is viewing that screen. Figure 5: Screenshot of the navigational menu highlighting a different button for when the user is viewing the Watering Events screen. 3.4 LATEST UPDATES ACTIVITY There are two major features on the Latest Updates activity: the soil water gauge and the latest updates information box. The soil water gauge is on the left‐hand side of the screen (Figure 6) and is a visual representation of the latest conditions of the soil. The green‐filled section of the gauge represents the field capacity of the soil, the red‐filled section represents the permanent wilting point of the turfgrass, and the yellow‐filled is the turn‐on point halfway between. All of these values are provided for each irrigation zone with the information from the server. The blue bar represents the percentage of water or moisture that is in the soil. The higher the blue bar is on the gauge, the wetter the soil is, while the lower the blue bar is on the gauge, the drier the soil is. If the blue bar rises above the green field capacity section, then that lets the user instantly see that water was wasted unnecessarily during that last Figure 6: Screenshot of the soil water gauge on the irrigation event. When the blue bar drops into the left‐hand side of the Latest Updates activity. 9 yellow section, it lets the user know that they need to water their lawn soon. If the blue bar ever drops below into the red permanent wilting point section, it shows the user that the soil has dried out too much and that the plants are going to suffer irreparable damage. The right‐hand side of the latest updates activity provides a quick overview of the latest information about the irrigation zones (Figure 7). It lists sensor reading information including the date of the last time that a sensor reading was measured and the soil moisture reading at that time. It also lists watering event information such as the date of the last irrigation event, the scheduled length of watering time, and the volume of water used during that event. Also on the bottom right‐hand side of latest updates activity is a “Refresh Data” button (Figure 7, circled in red). This will send a new message to the server requesting all the required irrigation, sensor, node, and zone information for the month prior to the current date. The progress wheel pops up just like when the app is initially Figure 7: Screenshot of the right‐hand side of the Latest started (Figure 3), letting the user know that the Updates activity with the latest irrigation information, as latest information is being requested and stored well as the Refresh Data button on the bottom corner. onto the device. The app checks for a flag in the incoming data message to see whether the information currently stored on the device is up to date or not, as determined by the server program (Figure 15c). If the information is out dated then the app will store the new information onto the device and display a message to the user (Figure 8a). However, if the information on the device was the most recent data, then the app will ignore the new data and instead display a message to the user letting them know that their current data is already up to date (Figure 8b). Figure 8: Demonstration of showing the message displayed when data is downloaded to the app. 10 3.5 MAP OF THE PARK ACTIVITY The Map of Park activity features an intuitive, interactive Google map of the irrigation site (Figure 9). Users can pinch their fingers together while pressing down on the device screen to zoom in to view an area of the map in greater detail, or move their fingers farther apart while pressing down on the device screen in order to see a larger view of the surrounding neighborhood. Users can drag their fingers around on the device screen to scroll around the map to view different areas. Figure 9: Screenshot of the Map of Park activity. The colored overlays on the map highlight the different irrigation zones for the park. The red markers on the map represent the actual locations of the sensor nodes in the field. When a user presses their finger onto one of the markers, an information window pops‐up to display the latest information about that sensor node (Figure 10). The pop‐up window displays information about the voltage of the batteries, the temperature of the node and the time that the last message was received. As well, the pop‐up window displays information about the depth of the sensors used by the node and the latest moisture content readings at those depths. The user can close the pop‐up at any time by pressing the ‘x’ in the top corner of the window. Figure 10: Demonstration of the pop‐up info window when a node is pressed by the user. 11 3.6 SENSOR READINGS ACTIVITY The Sensor Readings activity features an interactive graph displaying the historical soil moisture readings for a month of data (Figure 11). Users can pinch their fingers together while pressing down on the device screen to zoom in to view specific readings, or move their fingers father apart while pressing down on the device screen to view the entire month at a glance. Users can drag their fingers horizontally along on the device screen to view different regions of the graph. Figure 11: Screenshot showing the Sensor Readings activity. Each sensor has a colored line on the graph and is labeled in the legend along the bottom of the graph (Figure 11, circled in red). The field capacity of the soil, permanent wilting point, and turn‐on warning point of the turfgrass are also displayed on the graph and legend, continuing the color theme as seen in the soil water gauge. This is to allow users to easily see if the irrigation habits of the past month have been keeping the moisture content of the soil within the optimal range between those values. Users can view the sensor readings associated with a specific sensor node (and corresponding irrigation zone) by selecting a node ID from the drop‐down list in the top‐right hand corner of the Sensor Readings activity (Figure 12). The user touches their finger to the currently displayed node ID, which drops down the list of node IDs they can select from. Tapping a node ID in the list will cause the graph to be redrawn to display the water moisture content readings of the selected node ID, with corresponding changes to the title of the graph and the Figure 12: Drop‐down list to select a node labels of the sensors in the legend along the bottom. ID to view that node’s moisture readings. 12 3.7 WATERING EVENTS ACTIVITY The Watering Events activity also features an interactive graph and displays the historical lengths of watering times of irrigation events at the park (Figure 13). As with the graph for the Sensor Readings activity, users can pinch their fingers together while pressing down on the device screen to zoom in to view a specific irrigation event, or move their fingers father apart while pressing down on the device screen to view all the irrigation events for the entire month. Users can drag their fingers horizontally along on the device screen to view different regions of the graph. Figure 13: Screenshot of the Watering Events activity. Bars in the graph represent a single irrigation event that occurred within the irrigation zone, with the height of the bar representing the length of time in minutes for the watering event. The blue‐ filled bars represent the length of time scheduled by the city to irrigate the zone, while the green‐filled bars represent the length of time calculated by the adaptive irrigation system [13]. Both the scheduled and applied watering times are labeled in the legend along the bottom edge of the graph. For this graph, the more blue that a user sees over the month period represents the water that was saved by the adaptive irrigation system. Users can easily see the difference between the scheduled water usage and the adaptive water usage. 13 3.8 STATISTICS ACTIVITY The last activity in the Irrigation Advisor app is the Statistics activity, which features a cumulative water usage graph as well as some basic statistics on the water usage from the past month. The cumulative water usage graph (Figure 14) on the left hand side of the screen displays the cumulative length of watering time in minutes for all the water usage. The amount scheduled to be used by the City is shown in blue on the graph and in the legend while the amount actually applied is shown in green, continuing the colour theme from the Watering Events activity. Figure 14: Screenshot of the Statistics activity. The right hand side of the activity displays the date range for the previous month’s data, followed by general water usage statistics such as the number of watering events, the average length of watering time, and the average volume of water used during the past month. Also displayed are the total volumes of water scheduled and applied for the past month. 14 4 IRRIGATION ADVISOR APP – TECHNICAL DETAILS 4.1 DEVELOPING FOR ANDROID USING ECLIPSE The Irrigation Advisor app was developed using Eclipse and the ADT Plugin for the Android SDK. The official Android Developers website [16] has very good instructions and documentation, and was integral in learning to develop for Android. The website includes a lot of information which is well organized and easy to use. It features step‐by‐step instructions for every stage of development from downloading and installing the Android SDK and the ADT Plugin for Eclipse [17] to design guidelines and principles for developing Android applications [15]. It also has many tutorials, training articles and code examples for everything from creating your first basic Android app to optimizing performance and monetizing your app [19]. Finally it also includes guides and walkthroughs for creating a developer’s profile and publishing completed apps to the Google Play market [19]. 4.2 GETTING THE DATA FROM THE SERVER When the Irrigation Advisor app is initially installed on the mobile device, there is no irrigation or sensor information stored on the device. When the app is started up, it will initially create an empty SQLite database to store the data, and then checks to see if there is any data in it (Figure 15a). Since the database is empty, the app will then open an HTTP connection to the internet and send a GET request to a pre‐defined internet address to the server (Figure 15b). The user can also manually request new data by pressing the Refresh Data button (Figure 7, circled in red) which will send the date from the latest sensor reading in the database as the lastDate parameter of the GET request. Figure 15: Diagram showing how the app gets and stores the irrigation data from the server. 15 When the server receives the request, it initially checks for the lastDate parameter in the GET request. If the parameter has a value, then the program compares that provided date to the date of the latest sensor reading from the database on the server. If the dates match, then the server creates a flag to inform the app that its data is currently up to date. However, if the dates do not match or if the app did not send a value for the lastDate parameter, then the server calculates the date range of one month prior to the last sensor reading closest to the current date. It then retrieves all the information about the irrigation zones, sensors and nodes, sensor readings, and watering events that fall within that date range (Figure 15c). The server then responds to the GET request by returning all the data within a JSON message back to the app (Figure 15d). Once the app receives the JSON message, it parses and stores the data into separate tables in the SQLite database (Figure 15e) using a database helper class written specifically for this task. The task of storing the data into the database is performed in the background of the running application to improve the speed and responsiveness of the app. 4.3 IRRIGATION ADVISOR DATABASE All Android devices come with SQLite embedded onto the device already; the Irrigation Advisor app takes advantage of that for the creation of an internal database for storing and organizing the irrigation and sensor information. The database consists of five interconnected relations: Zones, Nodes, Sensors, Watering Events, and Sensor Readings (Figure 16). Zones, nodes, sensors, and sensor readings are all uniquely identified by an ID number assigned to them, while the watering events are uniquely identified by the combination of zone ID and time the event started (timeStarted). Figure 16: The database entity relationship diagram for the SQLite database used by the Irrigation Advisor app. 16 The Zones relation contains information specific to an irrigation zone, which is the field capacity of the soil and the wilting point of the turfgrass. The Nodes relation contains the latitude and longitude to locate the node on the map and references the ID of the irrigation zone the node is within. The Sensors relation only contains a reference to the node ID which it is connected to. The Sensor Readings relation contains the timestamp that the soil moisture content reading was taken, as well as the value of that reading and a reference to the sensor which recorded the reading. Finally the Watering Events relation contains the length of time in seconds that the city scheduled to water their irrigation zones and the length of time calculated actually required by the adaptive irrigation system [13]. Note that the date‐times were stored as a DateTime format in the server database for the previous project, but due to the fact that SQLite does not have an equivalent storage format, the dates and times are stored as a single TEXT attribute in order to preserve their formatting. 4.4 USING ANDROIDPLOT FOR DRAWING THE GRAPHS Android does not natively provide tools for creating and displaying graphs or charts. To generate the desired graphs for each activity, an external library needs to be used. AndroidPlot [2] was selected over other graphing libraries designed for Android because it offered the greatest levels of features and support for the lowest price (free). Its features include compatibility with every version of Android; support for dynamic sources of data; extensive documentation including a wiki, tutorials, and code documentation; strong forum support; and its permissive free software license allows for both private and commercial usage [3]. The other free graphing libraries did not offer the same level of features or developer support. In order to use AndroidPlot, the latest release must first be downloaded from their website [2]. Once downloaded, it must then be included in the project’s build configuration. When using Eclipse and the ADT Plugin, the AndroidPlot library can be added by going to File then Build Path and then click on the Libraries tab. Click on the Add External Libraries option and navigate to the location of the AndroidPlot library on the computer. Click okay, and then the AndroidPlot graphs can then be used, referenced and customized in the same manner as all other items during Android development. For the Irrigation Advisor app, all the graphs are dynamically drawn using the data stored in the internal SQLite database. 17 5 SERVER APPLICATION 5.1 SERVER DATABASE As mentioned, this project uses the irrigation and sensor information collected from a previous research project [13]. For that project, the data was stored in a MySQL database on the server. Although this project uses some of the same information, the database from the previous project contains more information than what was required for the Irrigation Advisor app. The Irrigation Advisor app only requires a subset of the information as described in (Figure 16). 5.2 ADVISOR.PHP The program that sits on the server is called advisor.php and it is written in PHP. The program sits idle on the server until a request is sent to it and activates it. When the program receives a request, it retrieves the date of the last sensor readings sent by the app (the lastDate parameter in the GET request). It then determines the current date and retrieves the sensor reading timestamp that is closest to the current date from the server’s database. The program then calculates the (start) date of one month prior to the latest sensor reading in the database in order to produce the date range of the prior month’s worth of data from the database. The program then queries the database for the zone, node and sensor information, and the sensor readings and watering events. It places each section of data into its own array, along with a flag stating whether the data the app currently contains is out of date or not. The program then packages up all the information into a single JSON message (through the use of a simple class to create a JSON object) and returns the message back to the app. 18 6 DISCUSSION AND CONCLUSION 6.1 DISCUSSION One of the challenges encountered during the development process included getting the data from the server to the app as well as doing so in a timely manner. The simplest solution involved sending a GET request from the app and having the server return the information as a JSON message (Figure 15). However, the first attempts at having the app send the request, receive the message and store the data took several minutes to complete and “locked‐up” the app while doing so, which resulted in non‐ responsiveness and poor usability in the app. To remedy the situation, the tasks of requesting, receiving and storing the data were programmed to operate in the background separately from the main activity of the app while a progress wheel was displayed to the user when they had to wait for the task to complete. This improved the responsiveness from several minutes down to a few seconds (and even less time if the data is currently up to date). Another major challenge was the rendering of bar graphs for the soil water gauge (Figure 6) and watering events graphs (Figure 13). Despite the claimed relative ease it would be to render bar graphs using the AndroidPlot library, the first attempts were completely unsuccessful, and the app would crash as soon as it was started. After an exhaustive search of the AndroidPlot tutorials, forums and even source code, the root cause of the problem was finally determined to be a bug in the code of the AndroidPlot library. The bug would not allow the rendering of bar graphs to operate in the background separately from the main activity of the app; the operation is inseparable from creation of the activity that displays the graph, as currently coded in the latest release from AndroidPlot. This causes the app to have a slight lag between the user going to the activity and the rendering of the graph, at which time the app is “locked‐up” and non‐responsive until the graph is rendered correctly. However, the length of time of the lag is less than one second and only noticeable by the user attempting to rapidly switch between the different activities of the app. The last major challenge was ensuring the usability of the Irrigation Advisor app by following the usability measures defined earlier. The app maintained the consistency of the layout and organization by having a horizontal navigational bar along the top of every activity with the content for a particular activity taking up the rest of the screen. If there was more than one element to go into the content area, they were arranged to take equal portions of the screen space. As well, the app uses a consistent colour scheme for background, buttons, text, and even consistency across graphs which reference the same information, such as the field capacity, wilting point and turn‐on point used in the soil water gauge (Figure 6) and the sensor readings graph (Figure 11). The navigation was intuitive and easy to use; the buttons were a distinct colour from the background and other elements, with the names on the buttons representing the type of information associated with that activity. Further, by having the button for activity the user is currently viewing highlighted, it allows the user to easily keep track of where they are at all times while using the app 19 (Figure 4, Figure 5). The intuitive and natural controls were also maintained by allowing users to use gestures such as pinching their fingers to zoom or swiping their finger to scroll when interacting with the graphs and map. The app provided informative feedback by displaying a progress wheel letting the user know that data is being downloaded and that the app is still running, then when it has finished storing the data the app displays a message telling the user if new data was actually retrieved or if their current data was up to date. The app also maintained responsiveness by taking milliseconds to render graphs so there is seamless interaction with the graph, as well as only requiring a few seconds to download and store new information from the server. 6.2 CONCLUSION With growing concerns over climate change, population growth and increased water consumption, society has turned to automated and timed irrigation systems in an attempt to more sustainably regulate water usage. However overwatering is still a major concern as people often do not use these technologies correctly. To help increase awareness and educate users about how to better manage their irrigation systems, the Irrigation Advisor app was created as a tool for visualizing irrigation and sensor based data. Although the app was built primarily for large institutional irrigation users such as city park managers, it was also developed to be extensible and can easily be modified to accommodate new information and to support future functionality requirements as well. Furthermore, the usability and responsiveness of the app was maintained by complying with all the usability measures defined earlier in this thesis. 6.3 FUTURE WORK Work yet to be done on the Irrigation Advisor app includes integrating GPS and offline caching features to work with the Google Map. As well, the next step for the app is to begin usability testing with actual large institutional users such as city parks managers in order to determine if the Irrigation Advisor app can be used effectively in real world conditions to regulate water usage more sustainably. 20 7 REFERENCES [1] Abdullah N, Adnan W and Noor N (2011). “Cognitive Design of User Interface: Incorporating Cognitive Styles into Format, Structure and Representation Dimensions.” Communications in Computer and Information Science, DICTAP 2011, Dijon, France, June 2011. vol. 167, pp. 743– 758. doi: 10.1007/978‐3‐642‐22027‐2_62 [2] AndroidPlot. AndroidPlot. 25 Mar 2012. Retrieved March 25, 2012 http://androidplot.com/wiki/Home [3] AndroidPlot. AndroidPlot feature comparison. 25 Mar 2012. Retrieved March 25, 2012 http://androidplot.com/wiki/Feature_Comparison [4] Beard JB and Green RL (1994). “The role of turfgrasses in environmental protection and their benefits to humans.” Journal of Environ Quality, vol. 23, no. 3. [5] Carrow R (2006). “Can we maintain turf to customers’ satisfaction with less water?,” Agricultural Water Management, vol. 80, no. 13. [6] Chen L, Chu P and Cheng Y (2011). “Identifying the Features of Friendly User Interfaces from Emotional Perspectives.” IDGD’11 Proceedings of the 4th international conference on Internationalization, Design and Global Development, pp. 293–301, doi: 10.1007/978‐3‐642‐ 21660‐2_33 [7] Cyber‐Rain: https://play.google.com/store/apps/details?id=com.cyberrain.cloud [8] Cyber‐Rain XCI Cloud Smart Irrigation Control System: http://www.cyber‐rain.com/ [9] Degen D (2007), “Water Sustainability: City of Kelowna Water Utility,” Presentation for Okanagan Water Stewardship Council. [10] Engel J, Märtin C and Forbrig P (2011). “HCI Patterns as a Means to Transform Interactive User Interfaces to Diverse Contexts of Use.” HCII'11 Proceedings of the 14th international conference on Human‐computer interaction: design and development approaches, pp. 204–213, doi: 10.1007/978‐3‐642‐21602‐2_23 [11] Environment Canada, “2007 Municipal Water Use Report,” Tech. Rep., April 2007. [12] EZVRC: http://itunes.apple.com/us/app/ezvrc/id460825844?mt=8 [13] Fazackerley S, Trenholm R, Campbell A, and Lawrence R, “A Holistic Framework for Water Sustainability and Education in Municipal Green Spaces,” in IEEE Canadian Conference on Electrical and Computer Engineering 2012 (CCECE 2012), Montreal, Quebec, Canada, May 2012. [14] Google Inc. (2012). Activity | Android Developers. http://developer.android.com/reference/android/app/Activity.html [15] Google Inc. (2012). Android Design. http://developer.android.com/design/index.html [16] Google Inc. (2012). Android Developers. http://developer.android.com/index.html [17] Google Inc. (2012). Android SDK | Android Developers. http://developer.android.com/sdk/index.html [18] Google Inc. (2012). Google Play. https://play.google.com/store?hl=en&tab=m8 [19] Google Inc. (2012). The Developer’s Guide | Android Developers. http://developer.android.com/guide/index.html 21 [20] Haley MB, Dukes MD, and Miller GL (2007), “Residential Irrigation Water Use in Central Florida,” Journal of Irrigation and Drainage Engineering, vol. 133, no. 5, pp. 427–434. [21] IrrigationCaddy S1 (web based irrigation controller): http://www.irrigationcaddy.com/index.html [22] Irrigation Water Use. USGS. 09 Mar 2012. Retrieved January 22, 2011 http://ga.water.usgs.gov/edu/wuir.html [23] Huang J, Azogu I, Sunkara A, Lui H, Wang H and Miller H (2011). “Seamless Data Visualization for Frost Detection.” Wireless Communications and Mobile Computing Conference (IWCMC), 7th International Conference, July 2011, pp. 1970‐1975, doi: 10.1109/IWCMC.2011.5982836 [24] Pervez M and Hoque M (2002). “Interactive Information System for Irrigation Management.” CODATA 2002 18th International Conference, Montreal, Quebec, Canada, September 2002. [25] PureSense Irrigation Manager: https://play.google.com/store/apps/details?id=com.puresense [26] Sprinkler Times: https://play.google.com/store/apps/details?id=com.scheduler.sprinkler [27] SprinkWise Irrigation Assistance: http://itunes.apple.com/us/app/sprinkwise‐irrigation‐ assistance/id428784714?mt=8 [28] Wikimedia Foundation, Inc. (2012). Android (operating system) ‐ Wikipedia, the free encyclopedia. Retrieved March 25, 2012, http://en.wikipedia.org/wiki/Android_(operating_system) [29] Wikimedia Foundation, Inc. (2012). Android software development ‐ Wikipedia, the free encyclopedia. Retrieved March 25, 2012, http://en.wikipedia.org/wiki/Android_software_development [30] Wikimedia Foundation, Inc. (2012). Java (programming language) ‐ Wikipedia, the free encyclopedia. Retrieved March 25, 2012, http://en.wikipedia.org/wiki/Java_(programming_language) [31] Wikimedia Foundation, Inc. (2012). JSON ‐ Wikipedia, the free encyclopedia. Retrieved March 25, 2012, http://en.wikipedia.org/wiki/JSON [32] Wikimedia Foundation, Inc. (2012). PHP ‐ Wikipedia, the free encyclopedia. Retrieved March 25, 2012, http://en.wikipedia.org/wiki/Php [33] Wong J (2008), “Case Study: Get Water Smart, Kelowna, BC,” December, The POLIS Water Sustainability Project, Retrieved October 15, 2011, http://www.poliswaterproject.org/sites/default/files/general/tbpp/kelowna_tbpp.pd 22