1
INTREPID User Manual
Library | Help | Top
Introduction to the Spreadsheet Editor (G04)
1
| Back |
Introduction to the Spreadsheet Editor (G04)
Top
When you are processing geophysical data you may want to view, edit and
manipulate the numbers that make up your data. The INTREPID Spreadsheet
Editor is a powerful tool which allows you to do all of this.
This Guided Tour shows you how the INTREPID Spreadsheet Editor interprets and
manipulates the data contained in INTREPID datasets.
•
You will examine the structure of a line dataset and learn to navigate around it.
•
You will manipulate the data in an airborne magnetic Line dataset and create a
new data field. In this exercise you subtract base station data from raw magnetic
data to create a diurnally corrected magnetic channel.
Context of this guided tour
In the context of your data processing cycle, the Spreadsheet Editor may be
used at any stage to view and manipulate your data. It is a both a window into your
data and a versatile tool to make changes to that data. When you want access to the
“numbers”, the Spreadsheet is for you. We have extended this tool to support vectors
and tensors, using simple mimic garphs in each cell, to give you a quick visual that
with practise, gives you a simple way to see how the signal is varing from sample to
sample.
Library | Help | Top
© 2012 Intrepid Geophysics
| Back |
INTREPID User Manual
Library | Help | Top
Introduction to the Spreadsheet Editor (G04)
2
| Back |
Overview
The INTREPID Spreadsheet Editor is a tool for viewing and editing your data
numerically. It enables you to:
•
View and edit ALL types of INTREPID datasets in a spreadsheet layout
•
Navigate, examine and manipulate the dataset structure
•
Search and replace data, using conditional logic
•
View gradient and tensor data using special icons that help you to visualise the
complex values in each reading
•
Perform grid-level arithmetic on gridded datasets. For example, add a pair of
grids.
•
Create new fields and grids usingg functions.
This Guided Tour demonstrates the Spreadsheet Editor firstly as a tool for viewing
dataset structure, and secondly as a tool for manipulating your data.
Location of sample data for Guided Tours
We provide two complete sets of sample datasets, one in INTREPID format and one
in Geosoft format. INTREPID works equally well with both formats. When you want
to open a dataset, navigate to the directory containing the required data format.
Where install_path is the path of your INTREPID installation, the project
directories for the Guided Tours sample data are
install_path\sample_data\guided_tours\intrepid_datasets and
install_path\sample_data\guided_tours\geosoft_datasets.
For example, if INTREPID is installed in
C:\Program Files\Intrepid\Intrepid4.5.nnn,
then you can find the INTREPID format sample data at
C:\Program Files\Intrepid\Intrepid4.5.nnn\sample_data\
guided_tours\intrepid_datasets
This is the default location for the sample data. If you have installed INTREPID
normally, the data resides there. If you have installed INTREPID elsewhere, the
exercises will work just as well. Just use the appropriate pathnames.
For more information about installing the sample data, see "Sample datasets—
installing, locating, naming" in INTREPID Guided Tours Introduction (G01)
For a more detailed description of INTREPID datasets, see Introduction to the
INTREPID database (G20). For even more detail, see INTREPID database, file and
data structures (R05).
Location of sample data for CookBooks
Right next to the Guided tours data, is a rich set of more exotic geophysics datasets
and grids, already prepared for the cookbook training sessions. A casual user might
also gain some trial and error insights into the capbilities of the software, just by
testing the Project Manger’s ability to preview and describe the attributes of each of
the cookbook datasets.
Library | Help | Top
© 2012 Intrepid Geophysics
| Back |
INTREPID User Manual
Library | Help | Top
Introduction to the Spreadsheet Editor (G04)
3
| Back |
How the Spreadsheet represents INTREPID vector datasets
See "INTREPID dataset types" in Locating datasets, viewing, statistics, launching
tools (G02) for a brief introduction to the INTREPID database.
A spatial vector dataset consists of a set of data points. Each data point may have
several measurements or quantities associated with it, e.g., X, Y, elevation,
temperature, magnetometer reading. We can refer to these quantities as fields or
channels in the dataset.
Note: The word 'field' has many different meanings in physical sciences and
mathematics. A data ‘field' as used here, simply refers to an attribute or quantity
associated with a data point. It has no significance in the wider sense of a magnetic or
gravity 'field'. This can be confusing, as we might talk about a gravity gradient tensor
field also being part of the Spreadsheet visuals.
If data is collected at a series of random locations, we refer to it as random or point
data. This is generally true of gravity and geochemistry surveys. If data is collected
along a series of lines we refer to it as line data. This is true of airborne surveys,
where each line is assigned a unique line number.
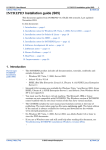
The Spreadsheet Editor displays vector data in rows and columns. Each vertical
column of the spreadsheet represents a field in the dataset. Each horizontal row of
the spreadsheet represents a single data measurement.
An INTREPID Point dataset consists of a single group of data. An INTREPID Line
dataset consists of several groups, where each group represents one survey line of
data.
For a Line dataset, the Spreadsheet Editor uses the line number field to group the
data into lines. It displays only one line at a time. The line number field is a ’group
by’ field, and is the primary identifier for the dataset.
How the Spreadsheet Editor displays a line dataset
Lines
(Groups in Spreadsheet)
(Each group contains
the data for one line)
Data points
(Samples (Rows) of Spreadsheet)
(Each row of numbers
represents one data point)
Line number field
Fields
(Columns of Spreads
heet)
(Each column of numbers
represents one field)
('Group by' field)
(The spreadsheet uses
this field to divide the
data into groups (lines))
You can also display and edit grid datasets using the Spreadsheet Editor. Each group
of the spreadsheet represents a horizontal line of grid points. The number of rows in
each group is equal to the number of grid cells per line.
Library | Help | Top
© 2012 Intrepid Geophysics
| Back |
INTREPID User Manual
Library | Help | Top
Introduction to the Spreadsheet Editor (G04)
4
| Back |
Steps to follow
Examine a line dataset
1
Load a dataset into the spreadsheet editor
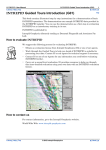
Start the Project Manager. Navigate to the directory
install_path\sample_data\guided_tours\intrepid_datasets. From
the Editing menu, launch the Spreadsheet Editor.
See Locating datasets, viewing, statistics, launching tools (G02) for instructions
about navigating to different directories and selecting datasets.
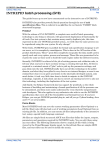
Choose File > Open Dataset. The INTREPID Load Dataset dialog box appears.
Select the line dataset albury..DIR, and choose Open.
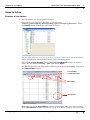
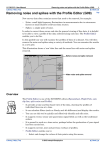
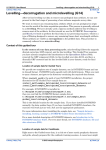
INTREPID launches the Spreadsheet Editor and displays the albury dataset in
the Spreadsheet window.
Line number
(‘group by’) field
Data fields
Data points
Tip: Each row in the Spreadsheet window represents a data point. Each column
in the Spreadsheet window represents a field. The Editor displays line data from
Library | Help | Top
© 2012 Intrepid Geophysics
| Back |
INTREPID User Manual
Library | Help | Top
Introduction to the Spreadsheet Editor (G04)
5
| Back |
one group at a time. Each group represents one survey line of data. The line
number field is the ‘group by’ field that identifies each line.
2
Use the scroll bars to view different rows and columns in the current group.
Use the vertical scroll bar to view different data points. You can choose the down
or up arrow to advance one or two data points through the group. You can also
drag and release the scroll box to advance many data points, or all the way to the
end of the current group.
Use the horizontal scroll bar to view different data points. You can choose the
right or left arrow to advance one or two columns through the group. You can also
drag and release the scroll box to advance many columns.
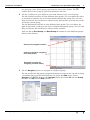
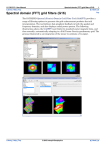
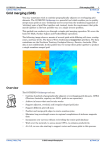
Now use the << Prev Group and Next Group >> buttons to view different groups
(lines) in the dataset.
Group (line) navigation buttons
Vertical scroll bar for navigating
rows (data points)
Horizontal scroll bar for
navigating columns (fields)
3
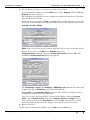
Use the Navigate function to navigate to a different group.
Use the scroll bars and group navigation buttons to return to the top left of group
1 as shown when you first launched the tool. From the Edit menu, choose
Navigate. INTREPID displays the Navigate dialog box. Enter 29 into the Group
text box, and 20 into the Row text box.
Library | Help | Top
© 2012 Intrepid Geophysics
| Back |
INTREPID User Manual
Library | Help | Top
Introduction to the Spreadsheet Editor (G04)
6
| Back |
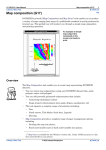
Choose Apply. INTREPID displays the 29th group, beginning at row 20.
Note the line number. You are viewing the data from line 140481. Close the
Navigate dialog box. Observe how the Spreadsheet Editor reports the dataset
name, the current group and the number of rows in the current group at the
bottom of the tool.
Note: You can leave the Navigate dialog box open on the screen and use it as
required.
4
Use the Reorder Fields function to change the display order of the fields (columns)
From the Format menu, choose Reorder Fields. INTREPID displays the Column
Display Order dialog box. From the Current Order list, select line and move it (>>)
to the New Order list. Then select and move the fid, then flight and time fields.
Choose OK. INTREPID displays the new column order in the Spreadsheet Editor.
5
Library | Help | Top
Exit from the tool
© 2012 Intrepid Geophysics
| Back |
INTREPID User Manual
Library | Help | Top
Introduction to the Spreadsheet Editor (G04)
7
| Back |
To exit from the Spreadsheet Editor, choose Quit from the File menu.
Manipulate a line dataset
You will now use the Spreadsheet Editor to create a new data field using a
combination of the existing fields. The new data field appears as a new column in the
Editor.
In this exercise you use the Editor to perform a routine diurnal correction on
magnetic survey data. Using the albury dataset, you subtract the base station data
from the raw magnetic data to create a diurnally corrected magnetic channel. You
also add the mean diurnal value to the new field.
Quick Review: The Earth’s magnetic field varies with time. One of these time
variations which affects airborne magnetic surveys is called the Diurnal. During the
airborne magnetic survey, the diurnal variation is monitored by a base station at
some fixed ground location. By subtracting the diurnal from the aircraft data, we get
a residual magnetic signal which has no time dependence. It is also common practice
to add the mean magnetic field value to the diurnally-corrected survey data, to
compensate for the arbitrary level shift introduced by the diurnal subtraction.
1
Calculate a Mean value for the diurnal field.
Start the Project Manager. Navigate to the directory
install_path\sample_data\guided_tours\intrepid_datasets. In the
File name panel of the Project Manager, select the dataset albury..DIR. The
dataset details appear in the lower panel.
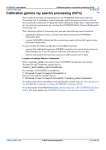
After the thumbnail colour image has finished drawing, select the Statistics tab.
The list of all data fields appear under the albury dataset. Select the diurnal field.
If a histogram is displayed, select the Statistics tab. Make a note of the Mean
value for the diurnal field.
59003 nT.
2
Auto-load a dataset into the spreadsheet editor
With the albury..DIR dataset still highlighted in the Project Manager, launch
the Spreadsheet Editor. INTREPID launches the Spreadsheet Editor and
displays the albury dataset in the Spreadsheet window. This feature of
Library | Help | Top
© 2012 Intrepid Geophysics
| Back |
INTREPID User Manual
Library | Help | Top
Introduction to the Spreadsheet Editor (G04)
8
| Back |
INTREPID is called auto-loading a dataset.
Note: Auto-loading is not enabled for all INTREPID tools.
Library | Help | Top
© 2012 Intrepid Geophysics
| Back |
INTREPID User Manual
Library | Help | Top
3
Introduction to the Spreadsheet Editor (G04)
9
| Back |
Use the Replace function to create a new field in the dataset.
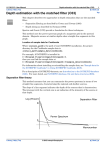
In the Spreadsheet Editor, from the Edit menu, choose Replace. The INTREPID
Replace dialog box appears.
The arithmetical expression we use contains no conditional statement. Therefore
leave the If text box blank.
In the text box to the right of Then, type magd. This becomes the name of our new
data field. In the textbox to the right of the = sign, type the following expression:
rawmag – diurnal + 59003
59003 is the mean value for the diurnal data field. Does it agree with your value?
When you are done, press OK on the Replace dialog box.
A Please Choose dialog box appears. Create New Column? Choose Yes. The
INTREPID Create New Field dialog box appears.
The Field Name is magd. The Datatype is IEEE8byte real (default). The data field
is not Group By, so Group By stays unchecked (default).
Choose OK in the Create New Field dialog box. The dialog box disappears and
INTREPID calculates the new data field.
Now you can view the new field as a column in the Editor. From the Format
menu, choose Reorder Fields. Select the rawmag, diurnal and magd fields in
turn, and move them to the New Order list. Choose OK. The Editor re-orders
those data fields to the left of the display screen where you can see them.
4
Exit from the tool
To exit from the Spreadsheet Editor, choose Quit from the File menu.
Library | Help | Top
© 2012 Intrepid Geophysics
| Back |
INTREPID User Manual
Library | Help | Top
Introduction to the Spreadsheet Editor (G04)
10
| Back |
Further things to consider
Using the Project Manager, examine the histogram and statistics for the magd
field. Compare the range of the data (Max-Min) with that of the rawmag field.
Are they similar or different ?
If there was noise or spikes in the diurnal data, what effect would you expect the
diurnal subtraction to have on the aircraft data?
If the base station was located in a magnetically noisy area, it may be necessary to
do some pre-processing of the diurnal data before applying the correction. This
might involve editing spikes out of the data, or filtering it before applying the
spreadsheet operation.
For further editing operations, see Editing with the Spreadsheet Editor (G11).
For full details about the Spreadsheet Editor, see Spreadsheet Editor (T15).
Key points for this guided tour
In this guided tour you used the Spreadsheet Editor to:
•
Navigate and view INTREPID datasets;
•
Understand the structure of an INTREPID dataset.
•
Create a new data field in an INTREPID dataset.
Frequently Asked Questions
Q : Does the INTREPID database store all INTREPID data?
A : Yes, the binary database that underpins INTREPID stores vector (line, point,
polygon) and grid datasets.
Q : Are there size limits in the database?
A : INTREPID itself imposes no size limits. Size limits are imposed by the Operating
System and the computer hardware.
Q : Can I save my arithmetic formula and reload it at a later session?
A : Yes, the Spreadsheet Editor Replace dialog box has Load Formula and Save
Formula buttons which allow you to do this.
Q : I created a field I don’t want - can I delete it?
A : Yes, the Spreadsheet Editor lets you delete fields, under Edit - Delete Field.
Q : How can I find out more about what arithmetic expressions are
supported?
A : The Spreadsheet Editor has its own Help facility. The INTREPID documentation
contains a comprehensive summary of the Spreadsheet functions.
Library | Help | Top
© 2012 Intrepid Geophysics
| Back |