1
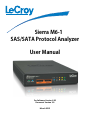
Sierra M6-1
SAS/SATA Protocol Analyzer
User Manual
For Software Version 4.30
Document Version 3.0
March 2012
LeCroy Protocol Solutions Group
Copyright © 2012 LeCroy Protocol Solutions Group. All rights reserved. Trademarks and Servicemarks:
LeCroy, LeCroy Protocol Solutions Group, CATC, SASSuite, SATASuite, SASTracer, SATracer, SASTrainer, SATrainer, SASTracker and Avalanche are trademarks of LeCroy. Microsoft, Windows, Windows 2000, and Windows XP, Windows Vista and Windows 7 are registered trademarks of Microsoft Inc.
Intel and Pentium are registered trademarks of Intel Corporation.
All other trademarks and registered trademarks are property of their respective owners.
THE SPECIFICATIONS AND INFORMATION REGARDING THE PRODUCTS IN THIS MANUAL ARE SUBJECT TO CHANGE WITHOUT NOTICE. ALL INFORMATION, EXAMPLES AND RECOMMENDATIONS IN THIS MANUAL ARE BELIEVED TO BE ACCURATE BUT ARE REPRESENTED WITHOUT WARRANTY OF ANY KIND, EXPRESS OR IMPLIED. USERS ARE FULLY RESPONSIBLE FOR THEIR APPLICATION OF ANY PRODUCTS.
THE SOFTWARE LICENSE AND LIMITED WARRANTY FOR THE ACCOMPANYING PRODUCT ARE SET FORTH IN INFORMATION THAT SHIPPED WITH THE PRODUCT AND ARE INCORPORATED HEREIN BY THIS REFERENCE. IF YOU ARE UNABLE TO LOCATE THE SOFTWARE LICENSE OR LIMITED WARRANTY, CONTACT LeCroy FOR A COPY.
Copyright © 2012, LeCroy Corporation; All rights reserved.
This document may be printed and reproduced without additional permission, but all copies should contain this copyright notice.
WEEE Program LeCroy Corporation
3385 Scott Blvd.
Santa Clara, CA 95054
TEL: 800‐909‐7112 (USA and Canada)
TEL: 408‐653‐1260 (worldwide)
Sierra M6‐1 SAS/SATA Protocol Analyzer User Manual
ii
Contents
Chapter 1: Introduction.........................................................................................13
Analyzer Overview...................................................................................................................... 13
Features....................................................................................................................................... 14
Receiving Your Analyzer............................................................................................................ 15
Unpacking the Analyzer ............................................................................................................. 15
Analyzer Features....................................................................................................................... 15
Front Panel .....................................................................................................................................................15
Rear Panel ......................................................................................................................................................16
Temperature and Humidity ...........................................................................................................................16
Installing Your Analyzer............................................................................................................. 17
Software Installation .....................................................................................................................................17
System restart .....................................................................................................................................17
Error Message .....................................................................................................................................17
Hardware Setup .............................................................................................................................................17
Separate Systems ...............................................................................................................................17
Connecting in General ........................................................................................................................17
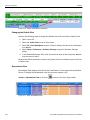
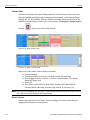
Cascading Sierra Analyzers ...................................................................................................... 18
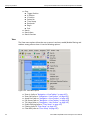
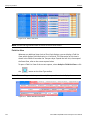
Connecting via Ethernet ............................................................................................................ 21
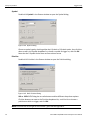
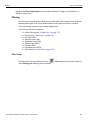
Connecting to a Network ..............................................................................................................................21
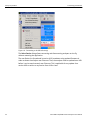
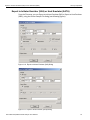
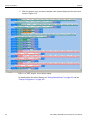
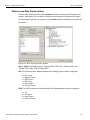
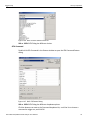
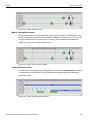
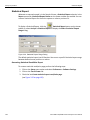
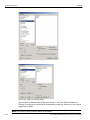
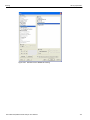
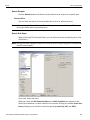
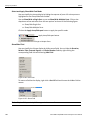
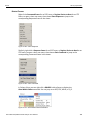
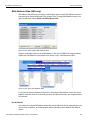
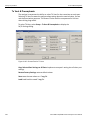
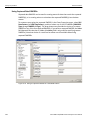
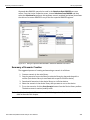
Select Device .................................................................................................................................................21
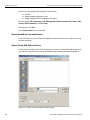
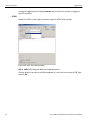
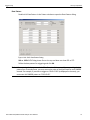
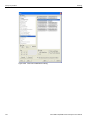
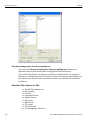
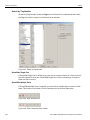
Connecting over Different Subnets .............................................................................................................26
TCP and UDP Ports Must Be Open to Connect over Ethernet ..................................................................26
Launching Your Analyzer .......................................................................................................... 26
Operating in Simulation Mode................................................................................................... 27
Using the Software ........................................................................................................................................27
Getting Started with the Protocol Analyzer.................................................................................................27
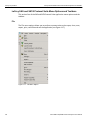
LeCroy SAS and SATA Protocol Suite Menu Options and Toolbars..................................... 28
File ..................................................................................................................................................................28
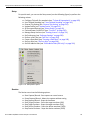
Setup...............................................................................................................................................................29
Sierra M6‐1 SAS/SATA Protocol Analyzer User Manual
1
LeCroy Corporation
Contents
Session...........................................................................................................................................................29
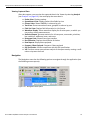
Analysis..........................................................................................................................................................30
Viewing Captured Data .......................................................................................................................31
Navigation ......................................................................................................................................................31
View ................................................................................................................................................................32
Window...........................................................................................................................................................33
Help.................................................................................................................................................................33
Toolbars .........................................................................................................................................................33
Port Status .....................................................................................................................................................34
InFusion..........................................................................................................................................................35
Analyzer and InFusion ..................................................................................................................................35
Chapter 2: Protocol Analysis ...............................................................................37
Easy Mode (Pre-Defined Setups) .............................................................................................. 37
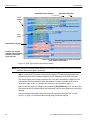
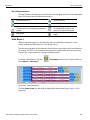
Main Window............................................................................................................................... 37
Project Tree ................................................................................................................................. 39
Capture Tab Fields ..................................................................................................................... 39
Exclude SATA_CONT (SAS) or Exclude CONT (SATA) ...................................................................39
Exclude SATA_SYNC (SAS) or Exclude SYNC (SATA) ...................................................................39
Exclude OOB Signals .........................................................................................................................39
Exclude XXXX ......................................................................................................................................39
Exclude Payload except .....................................................................................................................39
Exclude ALIGN ....................................................................................................................................39
Exclude RRDY (SAS only) ..................................................................................................................40
Exclude NOTIFY (SAS only) ...............................................................................................................40
Exclude Idle .........................................................................................................................................40
Define different patterns for pre-trigger and post-trigger data captures .......................................40
SAS/SATA Software Menus and Toolbars ............................................................................... 40
SAS Main Toolbar..........................................................................................................................................40
SATA Main Toolbar .......................................................................................................................................41
Run Hardware ............................................................................................................................. 41
Launch Jammer .............................................................................................................................................43
CrossSync Control Panel........................................................................................................... 43
Launching the CrossSync Control Panel .........................................................................................43
Save Workspace ......................................................................................................................... 44
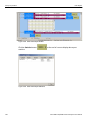
Saving a Trace Capture.............................................................................................................. 45
Exporting........................................................................................................................................................46
Export to Text/Excel ............................................................................................................................46
Export to Initiator Emulator (SAS) or Host Emulator (SATA) ................................................. 47
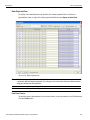
Export Read/Write Command Report ..........................................................................................................48
2
Sierra M6‐1 SAS/SATA Protocol Analyzer User Manual
Contents
LeCroy Corporation
Export Paired SAS Address Report.............................................................................................................48
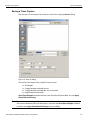
Projects........................................................................................................................................ 49
Project File Types..........................................................................................................................................49
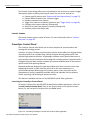
Example Projects...........................................................................................................................................50
Run an Example Analysis Project................................................................................................................50
Patterns and Data Capture Setup.............................................................................................. 53
Choose a Parameter......................................................................................................................................54
Exclude Patterns ...........................................................................................................................................54
Pre and Post Trigger Data Capture..............................................................................................................55
Defining Patterns...........................................................................................................................................56
Data Pattern ...................................................................................................................................................56
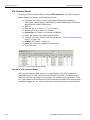
Protocol Errors ........................................................................................................................... 57
Protocol Errors ..............................................................................................................................................58
STP Frame (SAS only) ........................................................................................................................59
Address Frame (SAS only) ................................................................................................................60
SMP Frame (SAS only) .......................................................................................................................60
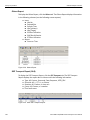
SSP Frame (SAS only) ........................................................................................................................61
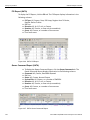
FIS (Frame Information Structure) (SATA only) ...............................................................................62
FIS Pattern (SATA only) ......................................................................................................................63
FIS Types (SAS and SATA) ................................................................................................................64
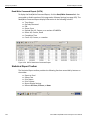
Register Device to Host ......................................................................................................................65
Set Device Bits ....................................................................................................................................65
DMA Activate .......................................................................................................................................66
DMA Setup ...........................................................................................................................................66
BIST ......................................................................................................................................................67
PIO Setup .............................................................................................................................................67
Data ......................................................................................................................................................68
Vendor ..................................................................................................................................................68
Trigger Setup .............................................................................................................................. 69
Snapshot Mode..............................................................................................................................................69
Manual Trigger Mode ....................................................................................................................................69
Any Trigger Mode ..........................................................................................................................................70
Choosing a Parameter ..................................................................................................................................71
Triggering on a Timer....................................................................................................................................71
Timeout...........................................................................................................................................................72
External Trigger ...................................................................................................................................73
Bus Condition ......................................................................................................................................73
Symbol .................................................................................................................................................74
Primitive ...............................................................................................................................................74
ATA Command ....................................................................................................................................75
ATAPI ...................................................................................................................................................76
Data Pattern .........................................................................................................................................77
Sierra M6‐1 SAS/SATA Protocol Analyzer User Manual
3
LeCroy Corporation
Contents
Protocol Errors ....................................................................................................................................78
STP Frame (SAS only) ........................................................................................................................79
Address Frame (SAS only) .................................................................................................................80
SMP Frame (SAS only) .......................................................................................................................81
SSP Frame (SAS only) ........................................................................................................................82
SCSI Command (SAS only) ................................................................................................................83
FIS (Frame Information Structure) (SATA only) ...............................................................................84
FIS Pattern (SATA only) ......................................................................................................................85
ATA Command Pattern (SATA only) .................................................................................................86
Soft Reset (SATA only) .......................................................................................................................86
Sequential Trigger Mode...............................................................................................................................87
Timer ....................................................................................................................................................87
Defining Patterns ................................................................................................................................88
Triggering Order ..................................................................................................................................88
Pre-Trigger ...........................................................................................................................................89
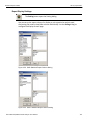
Project Settings .......................................................................................................................... 90
Memory Settings............................................................................................................................................91
Trigger Position ...................................................................................................................................91
Sample File Name ...............................................................................................................................91
Auto Run ..............................................................................................................................................91
Memory Size ........................................................................................................................................91
Partial Memory ....................................................................................................................................91
Segmented Memory ............................................................................................................................91
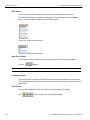
Upload Manager.......................................................................................................................... 92
Analyzer Settings........................................................................................................................ 93
Primitive Response Timeout ........................................................................................................................93
Disable Scrambling .......................................................................................................................................93
Show XXXX value ..........................................................................................................................................93
Protocol Error Mask ......................................................................................................................................93
External Trig Out Setting ..............................................................................................................................94
External Trig In Setting .................................................................................................................................94
Choose Port Speed .......................................................................................................................................94
Ports Configuration .................................................................................................................... 95
Port Configuration and Projects ..................................................................................................................96
MUX Setting (SAS only) ................................................................................................................................97
Add a Project Note ........................................................................................................................................98
Advanced Mode (User-Defined) ................................................................................................ 98
Working in Advanced Mode .........................................................................................................................99
State Number for Complex Trigger Sequences........................................................................................101
Setting Trigger Conditions ...............................................................................................................101
Set Timers ..........................................................................................................................................102
4
Sierra M6‐1 SAS/SATA Protocol Analyzer User Manual
Contents
LeCroy Corporation
Timeout ..............................................................................................................................................103
Useful Key Sequences ......................................................................................................................105
Project Settings ........................................................................................................................ 106
Notes.............................................................................................................................................................106
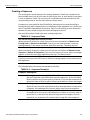
Creating a Data Block............................................................................................................... 106
Naming a Data Block...................................................................................................................................107
Editing a Data Block....................................................................................................................................108
Define Your Own Pattern ............................................................................................................................108
Counter ...................................................................................................................................... 109
Random Data Pattern ..................................................................................................................................110
Walking Bit Pattern......................................................................................................................................110
Creating and Editing Data Blocks as Text ................................................................................................111
Load Data .....................................................................................................................................................111
Save As.........................................................................................................................................................111
Chapter 3: Display Manipulation .......................................................................113
Viewer Display .......................................................................................................................... 113
Quick View ...................................................................................................................................................114
Using the Viewer Display............................................................................................................................115
Trace Properties ....................................................................................................................... 115
Analysis ..................................................................................................................................... 116
Show Analysis Toolbar ...............................................................................................................................116
Decoding Assignments...............................................................................................................................118
Packet View..................................................................................................................................................118
Packet View Metrics ..........................................................................................................................119
Changing the Default View .........................................................................................................................120
Spreadsheet View........................................................................................................................................120
Save As Text/Excel ...........................................................................................................................121
Change Format of Logical Block Address (LBA) ...........................................................................121
Column View ................................................................................................................................................122
Resize Columns ................................................................................................................................122
Rearrange Columns ..........................................................................................................................123
Save As Text/Excel ...........................................................................................................................123
Text View ......................................................................................................................................................123
Field List View..............................................................................................................................................124
Field List View Displayed in a Separate Window ...........................................................................125
Field List View Embedded in Frame or Spreadsheet Views .........................................................125
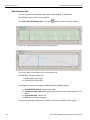
Waveform Display .......................................................................................................................................126
Making a timing Measurement .........................................................................................................127
Expanded Waveform View ...............................................................................................................127
Sierra M6‐1 SAS/SATA Protocol Analyzer User Manual
5
LeCroy Corporation
Contents
Statistical Report ...................................................................................................................... 128
Generating Statistical Read/Write Report .......................................................................................128
Report between Cursors ..................................................................................................................129
Report between Events ....................................................................................................................130
Statistical Report Content........................................................................................................ 130
Report Options ............................................................................................................................................131
General Report.............................................................................................................................................131
Primitive Report...........................................................................................................................................132
Bus Condition Report .................................................................................................................................133
ATA Command Report ................................................................................................................................134
Time out of ATA Command Report .................................................................................................134
ATAPI Report ...............................................................................................................................................135
Protocol Error Report..................................................................................................................................135
Others Report ..............................................................................................................................................136
SSP Transport Report (SAS) ......................................................................................................................136
SMP Transport Report (SAS)......................................................................................................................137
STP Transport Report (SAS) ......................................................................................................................137
SCSI Command Report (SAS) ....................................................................................................................137
SMP Command Report (SAS).....................................................................................................................138
Task Command Report (SAS) ....................................................................................................................138
SAS Address Report (SAS) ........................................................................................................................139
Lanes Report (SAS).....................................................................................................................................139
Read/Write Command Report (SAS) ..........................................................................................................140
Performance Report (SAS) .........................................................................................................................140
Performance Report (SATA).......................................................................................................................141
FIS Report (SATA) .......................................................................................................................................142
Queue Command Report (SATA) ...............................................................................................................142
PM Statistic Report (SATA) ........................................................................................................................143
PM Performance Report (SATA) ................................................................................................................143
Read Write Command Report (SATA) .......................................................................................................144
Statistical Report Toolbar ........................................................................................................ 144
Export as Microsoft® Excel file..................................................................................................................145
Save as Text file...........................................................................................................................................145
Print Statistical Report................................................................................................................................145
Print Preview................................................................................................................................................146
Report Display Settings ..............................................................................................................................147
Link With Sample View ...............................................................................................................................148
Formatting the Statistical Report View................................................................................... 149
Filtering Column Content ...........................................................................................................................149
Sorting Column Content .............................................................................................................................151
Hiding Columns ...........................................................................................................................................151
Histogram View............................................................................................................................................151
Hide Frames .......................................................................................................................................152
Hide Error Frames .............................................................................................................................152
6
Sierra M6‐1 SAS/SATA Protocol Analyzer User Manual
Contents
LeCroy Corporation
Pending IO Graph ..............................................................................................................................152
User Defined ......................................................................................................................................152
Bus Utilization View ....................................................................................................................................154
Bus Utilization Buttons .....................................................................................................................155
Data Report ............................................................................................................................... 155
Data Payload View.......................................................................................................................................157
Find Data Pattern ..............................................................................................................................157
Compare Two Data Payloads .....................................................................................................................158
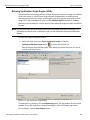
Running Verification Script Engine (VSE).............................................................................. 159
Navigation + View Toolbar..........................................................................................................................162
Go To Menu..................................................................................................................................................163
Filtering...................................................................................................................................... 167
Filter Setup...................................................................................................................................................167
Filter Type ..........................................................................................................................................169
Filtering Direction .............................................................................................................................169
Filter Idle ............................................................................................................................................169
Save Filter Setup ...............................................................................................................................169
Filter Logic .........................................................................................................................................169
Multilevel Filtering in SAS ................................................................................................................169
Filter descending packets from trace highlight bar .......................................................................172
Selectable Filter Options for SAS ..............................................................................................................172
Bus Condition ....................................................................................................................................173
Incomplete Frames ...........................................................................................................................173
ATA Command ..................................................................................................................................173
Protocol Error ....................................................................................................................................173
ATAPI SCSI Command .....................................................................................................................173
Filter Check Condition ......................................................................................................................174
Filter by Tag Number ........................................................................................................................174
Filter Miscellaneous ..........................................................................................................................175
Use Pair SAS Addresses ..................................................................................................................176
Selectable Filter Options for SATA............................................................................................................176
Enable Filter .................................................................................................................................................177
Filter Idle.......................................................................................................................................................178
Search........................................................................................................................................ 178
Save Search Setup ......................................................................................................................................179
Search By .....................................................................................................................................................179
Search Direction ..........................................................................................................................................179
Search From.................................................................................................................................................180
Search Logic ................................................................................................................................................180
Search For....................................................................................................................................................180
Data Pattern .......................................................................................................................................180
Advanced options .............................................................................................................................180
Sierra M6‐1 SAS/SATA Protocol Analyzer User Manual
7
LeCroy Corporation
Contents
Search Domain ............................................................................................................................................181
Search Sub Items ........................................................................................................................................181
Search by Tag Number ...............................................................................................................................182
Show/Hide Single Port ......................................................................................................................182
Show/Hide Multiple Ports .................................................................................................................182
Packet View Toolbar....................................................................................................................................183
CATC Navigation View ......................................................................................................................184
Spec View ..........................................................................................................................................186
Decode Icons ...............................................................................................................................................187
Customize Display.......................................................................................................................................187
Rename Port ......................................................................................................................................187
Select and Apply Show/Hide Port Mode .........................................................................................188
Show/Hide Field ................................................................................................................................188
Related Frames .................................................................................................................................189
Byte Order ..........................................................................................................................................190
Choose Data Format .........................................................................................................................190
Show All Data ....................................................................................................................................191
Port Status................................................................................................................................. 191
Toolbars..................................................................................................................................... 193
Enabling Tool Bars......................................................................................................................................193
Cursor Position Status Bar.........................................................................................................................193
See “Using the Cursors and Bookmarks” on page 194...........................................................................193
Status Bar.................................................................................................................................. 194
Search Status...............................................................................................................................................194
Using the Cursors and Bookmarks......................................................................................... 194
Cursors.........................................................................................................................................................194
Positioning the X Cursor ..................................................................................................................194
Time ....................................................................................................................................................194
Display Configuration .............................................................................................................. 195
Trace Viewer Configuration........................................................................................................................195
Field Setting .......................................................................................................................................197
Field Header Setting .........................................................................................................................198
Viewer Setting ...................................................................................................................................198
Data Payload ......................................................................................................................................198
Time Stamp Origin ............................................................................................................................198
Start Time and Port ...........................................................................................................................198
Packet View Condense Mode ...........................................................................................................198
Time Stamp Format ...........................................................................................................................199
Font ....................................................................................................................................................199
Save/Load Settings ...........................................................................................................................199
Set Port Alias ............................................................................................................................ 200
Set As Default ....................................................................................................................................200
8
Sierra M6‐1 SAS/SATA Protocol Analyzer User Manual
Contents
LeCroy Corporation
SAS Address Alias (SAS only) ................................................................................................ 201
Set As Default ....................................................................................................................................201
Tx Vout & Preemphasis............................................................................................................ 202
Software Settings ..................................................................................................................... 203
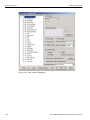
General Tab..................................................................................................................................................203
Paths ..................................................................................................................................................203
Template Files ...................................................................................................................................203
Other ...................................................................................................................................................204
Found Device List Mode ...................................................................................................................204
Browse Default Path .........................................................................................................................204
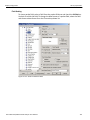
Trace Viewer Tab .........................................................................................................................................205
Open Trace file In ..............................................................................................................................205
Optimization ......................................................................................................................................205
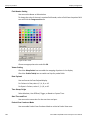
Spread Sheet View Tab ............................................................................................................ 206
Color Setting ......................................................................................................................................206
Anchor the Selection bar ..................................................................................................................207
Other ...................................................................................................................................................207
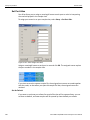
Column View Tab.........................................................................................................................................207
Other ...................................................................................................................................................208
Field List View Tab ......................................................................................................................................208
Update Filed List based on ..............................................................................................................209
Mode of frame field list .....................................................................................................................209
Other ...................................................................................................................................................209
Sampling Memory Usage Optimization .................................................................................. 209
If the Sampling Memory Usage Optimization Option is Checked...........................................................209
If the Sampling Memory Usage Optimization Option is Not Checked....................................................210
Floating License ....................................................................................................................... 211
External Trig Setting................................................................................................................. 212
External Trig Out Setting ..................................................................................................................212
External Trig In Setting .....................................................................................................................212
Update Device ........................................................................................................................... 213
User-Defined Decoding ............................................................................................................ 215
Help Menu.................................................................................................................................. 216
Help Topics ..................................................................................................................................................216
VSE Help Topics ..........................................................................................................................................216
Update License ............................................................................................................................................216
Display License Information.......................................................................................................................216
Check for Updates.......................................................................................................................................218
About ............................................................................................................................................................218
Self Test........................................................................................................................................................218
Sierra M6‐1 SAS/SATA Protocol Analyzer User Manual
9
LeCroy Corporation
Contents
Clock Check .......................................................................................................................................219
Test Result: OK or Error ...................................................................................................................219
Saving ................................................................................................................................................219
Number of Runs Each Test ..............................................................................................................220
Run All Tests Sequentially ...............................................................................................................220
Memory Check ...................................................................................................................................220
Serdes Check ....................................................................................................................................221
Crosspoint Check .............................................................................................................................222
Main FPGA Check (SATA only) ........................................................................................................223
Expansion Check ..............................................................................................................................224
LED/Buzzer Check ............................................................................................................................225
Find DUT.......................................................................................................................................................226
Aliasing ..............................................................................................................................................228
Exporting ...........................................................................................................................................228
Compliance Test (SATA).............................................................................................................................229
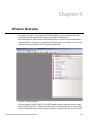
Chapter 4: InFusion Overview ...........................................................................233
Key Features ............................................................................................................................. 234
Interface..................................................................................................................................... 235
Buttons .........................................................................................................................................................235
Menus ...........................................................................................................................................................236
Setup ..................................................................................................................................................236
View ....................................................................................................................................................236
Configuration .....................................................................................................................................236
Tools ...................................................................................................................................................236
Help ....................................................................................................................................................236
Main Library .................................................................................................................................................237
File Library ...................................................................................................................................................238
Device Ports.................................................................................................................................................239
Using the Device Ports Dialog ...................................................................................................................239
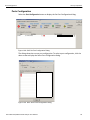
Port Configuration for InFusion .............................................................................................. 240
InFusion Scenarios................................................................................................................... 241
Scenarios Overview ....................................................................................................................................241
InFusion Scenario Parameters ........................................................................................................242
Global Rules ......................................................................................................................................244
Sequences .........................................................................................................................................244
Scenario Libraries .......................................................................................................................................245
Main Library .......................................................................................................................................245
File Libraries ......................................................................................................................................245
Device Libraries ................................................................................................................................246
10
Sierra M6‐1 SAS/SATA Protocol Analyzer User Manual
Contents
LeCroy Corporation
Scenario Properties.....................................................................................................................................247
SATA Smart Hold Option ..................................................................................................................248
Scenario Events........................................................................................................................ 250
DWORD Matcher..........................................................................................................................................253
SAS Data Pattern .........................................................................................................................................253
SATA Data Pattern.......................................................................................................................................253
Scenario Actions ...................................................................................................................... 254
Using Counters in Events and Actions .....................................................................................................256
Capturing a Data DWORD...........................................................................................................................257
Using Captured Data DWORDs ..................................................................................................................258
Summary of Scenario Creation ............................................................................................... 259
Creating Global Rules .............................................................................................................. 260
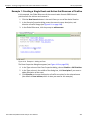
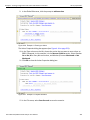
Example 1: Creating a Single Event and Action that Removes a Primitive ........................ 261
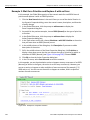
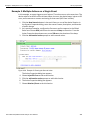
Example 2: Wait for a Primitive and Replace It with an Error............................................... 264
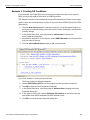
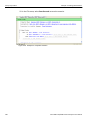
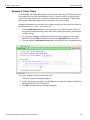
Example 3: Creating OR Conditions ....................................................................................... 265
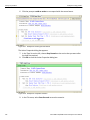
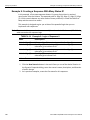
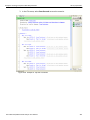
Example 4: Multiple Triggers and Actions ............................................................................. 267
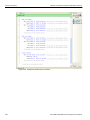
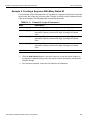
Example 5: Multiple Actions on a Single Event ..................................................................... 269
Example 6: Using Timers ......................................................................................................... 271
Creating a Sequence ................................................................................................................ 273
Example 7: Creating Two Sequences and Global Rules....................................................... 274
Example 8: Creating a Sequence With Many States #1 ........................................................ 280
Example 9: Creating a Sequence With Many States #2 ........................................................ 283
Downloading Scenarios ........................................................................................................... 286
Running Scenarios ................................................................................................................... 286
Scenario Batch Files ................................................................................................................ 287
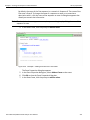
Script Workspace ........................................................................................................................................287
Error Checking.............................................................................................................................................290
Log ................................................................................................................................................................290
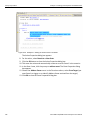
Statements ...................................................................................................................................................291
IfIsStopped .........................................................................................................................................291
Goto Label....................................................................................................................................................292
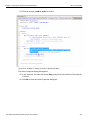
Run................................................................................................................................................................293
Stop...............................................................................................................................................................293
WaitForStop .................................................................................................................................................294
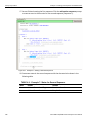
Beep..............................................................................................................................................................295
Sierra M6‐1 SAS/SATA Protocol Analyzer User Manual
11
LeCroy Corporation
Contents
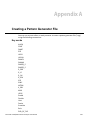
Appendix A: Creating a Pattern Generator File................................................297
Key words.................................................................................................................................. 297
Comment format ....................................................................................................................... 298
Primitive definition format ....................................................................................................... 298
Loop definition format.............................................................................................................. 298
Scramble definition format ...................................................................................................... 298
Role definition format............................................................................................................... 298
END_OF_FILE definition .......................................................................................................... 298
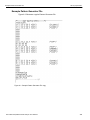
Example Pattern Generator File .............................................................................................. 299
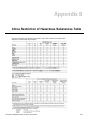
Appendix B: China Restriction of Hazardous Substances Table ...................301
WAN Operation ......................................................................................................................... 302
Appendix C: How to Contact LeCroy ................................................................303
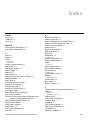
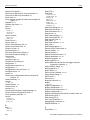
Index:.................................................................................................................. 305
12
Sierra M6‐1 SAS/SATA Protocol Analyzer User Manual
Chapter 1
Introduction
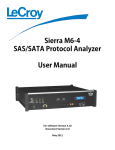
This manual describes installation and operation of the LeCroy Sierra M6‐1™ Protocol Analyzer and includes examples of typical applications.
Figure 1.1: LeCroy Sierra M6-1 Protocol Analyzer
Analyzer Overview
The Sierra M6‐1 SAS/SATA Protocol Analyzer is a portable single‐port system that can function as a protocol analyzer or as an error injector. The SAS analyzer software performs serial bus analysis for Serial Attached SCSI (SAS) data transfers, as well as Serial ATA (SATA) data transfers through STP data transfers. The SATA analyzer software performs serial bus analysis for Serial ATA (SATA) data transfers.
The Analyzer can operate at 1.5, 3, or 6 Gb/s data rates and has 2 GB or 4 GB of recording memory.
The Analyzer supports capture, triggering, and filtering of Serial Attached SCSI packets or Serial ATA packets. The Analyzer provides for bi‐directional trigger and capture of commands, primitives, patterns and all bus conditions. The analyzer allows you to select frames to include and exclude for capture. Capturing can be triggered based on a specific event or manually.
Sierra M6‐1 SAS/SATA Protocol Analyzer User Manual
13
LeCroy Corporation
Features
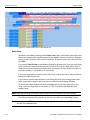
The Analyzer has a USB port and a GbE (Gigabit Ethernet) port to connect to a PC, which serves as the host for analysis or error injection software. The versatile GbE port can be used for either local or remote network connectivity. Sierra M6‐1 Analyzers can be linked together in cascaded configurations to provide additional recording channel capacity, or used in tandem to combine simultaneous error injection and trace capture/analysis capabilities (requires two Sierra M6‐1 units, one protocol analyzer model and one error injector model). Separate licences are required for the protocol analyzer and the error injector.
The Sierra M6‐1 Analyzer provides a full range of views and statistical reports. Statistical reports provide event and error counters, as well as performance metrics, that give users a snapshot into capture.
The InFusion™ Error Injector and Traffic Modifier is an error injector and traffic modification tool that allows you to verify real‐world fault handling. The Sierra M6‐1 InFusion models perform as a stand‐alone 1.5, 3 or 6 Gb/s version, allowing engineers to verify error recovery characteristics of their designs. An easy pop‐up menu interface allows the creation of customized test scenarios in just minutes. You can program on‐the‐
fly modifications to any field within any intercepted and changed to a different user frame, as the data moves across the link. Any primitive or data pattern can be intercepted and changed to a different user‐specified pattern. Examples include support for changing DWORD values, disconnecting links, and forcing various error conditions, such as an intermittent CRC error or running disparity errors. This enables unprecedented corner case testing for SAS and SATA traffic, which is especially useful during final test and integration cycles.
The Sierra M6‐1 Analyzer software has an intuitive GUI, combining easy setup with flexible data analysis displays. The application layer view logically assembles frames and primitives that are part of a specific SAS or SATA command. You can quickly view the completion status of any command, which is especially useful in addressing system‐level debug challenges.
Features
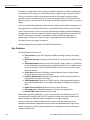
14 6 Gb/s SAS/SATA protocol analysis or error injection
Native PHY for fast lock time
Easy mode triggering
Cascade up to 8 ports
Sync with LeCroy Sierra and STX family products
CrossSync Control Panel
Hardware filtering
Automatic error detection
Comprehensive decoding of SAS and SATA data traffic
Logical and chronological traffic displays
Statistical reporting
Trace memory of 2 GB or 4 GB
GbE & USB 2.0 host interfaces
Capture, triggering, and filtering of Serial Attached SCSI packets or Serial ATA packets
Sierra M6‐1 SAS/SATA Protocol Analyzer User Manual
Receiving Your Analyzer
LeCroy Corporation
TX Vout on transmitters for test and characterization Automation API
Error Injection Functionality (Jammer)
Receiving Your Analyzer
The analyzer package includes the following components:
1 Sierra M6‐1 Analyzer identified in the packing list
1 USB A‐B 2.0 cable, 1.8 meter
1 Ethernet cable, 10 feet
2 SATA cables, 0.5 meter
2 SATA cables, 0.15 meter
1 Sync cable, 10‐pin, 6 inch
1 DC power pack and cord
1 Installation CD ROM with software and documentation
1 Sierra M6‐1 Quick Start manual
Unpacking the Analyzer
Inspect the shipping container for any damage. Unpack the container and account for each of the system components listed on the accompanying packing list. Visually inspect each component for any damage. In the event of damage, notify the shipper and LeCroy Corporation. Retain all shipping materials for shipper’s inspection.
Analyzer Features
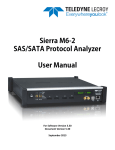
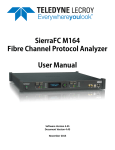
Front Panel
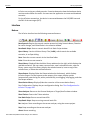
The Analyzer has the following features on the front:
Power Indicator LED (green)
Status LED (blue)
Host SATA Connector
Device SATA Connector
LED Indicators for Host and Device
Trig trigger (blue)
Error error (red)
Link link (orange)
Spd speed level (yellow)
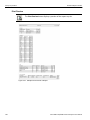
Speed Host Device
1.5G Off Off
3.0G On Off
6.0G On On
Sierra M6‐1 SAS/SATA Protocol Analyzer User Manual
15
LeCroy Corporation
Analyzer Features
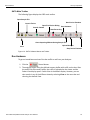
Fr/OOB OOB (Out of Bound) or Frames (traffic) (green)
Before the link, illuminates during
the OOB sequence.
After the link, indicates traffic on
the bus.
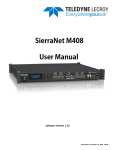
Figure 1.2: Front Panel
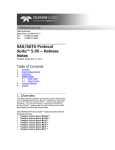
Rear Panel
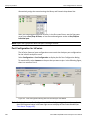
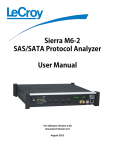
From left to right, the Analyzer has the following on the back:
USB Port for host connectivity
External Trigger IN/OUT and Sync Expansion Port
Gigabit Ethernet Port for network connectivity
DC Power
Power Switch (0/1)
Figure 1.3: Rear Panel
WARNING: Do not open the enclosure. No operator serviceable parts are inside.
Temperature and Humidity
The hardware should operate flawlessly in the following temperatures range:
Operating 0 °C to 55 °C (32 °F to 131 °F)
Non‐Operating ‐20 °C to 80 °C (‐4 °F to 176 °F)
The hardware should operate in the following humidity range:
16 10% to 90% RH (non‐condensing)
Sierra M6‐1 SAS/SATA Protocol Analyzer User Manual
Installing Your Analyzer
LeCroy Corporation
Installing Your Analyzer
Software Installation
The SAS and SATA software works on systems using the Windows® XP, Windows Vista, Windows 7, Windows Server 2003, and Windows Server 2008 operating systems. 64‐bit Windows OS is recommended because it allows using more RAM memory. Other Operating Systems limit the RAM to 3GB.
Note on the Windows Vista Operating System: If the SAS or SATA software does not open, right‐click the SAS Protocol Suite or SATA Protocol Suite icon and select Properties to display the Properties dialog. Select the Compatibility tab. Check to Run this program in compatibility mode for Windows XP.
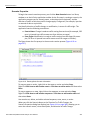
Insert the Installation CD ROM into the CD/DVD drive on the host machine.
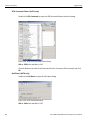
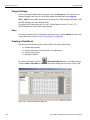
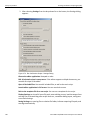
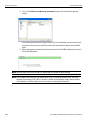
1. The installation automatically starts setup, unless Auto Run is off. In that case, select the CD ROM from “My Computer” and click Setup.
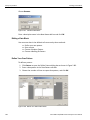
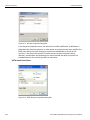
2. After the warning to close all other programs and before starting the installation, the Install component selection opens.
3. Select components for installation.
4. Click Next to complete the installation.
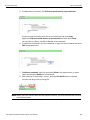
System restart
You must restart your computer before you can use your Analyzer software.
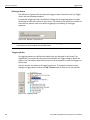
Error Message
If you get an error message during installation of the drivers for Window, consult your system administrator. Your system may allow only administrator‐level users to copy such driver files.
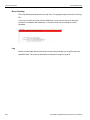
Hardware Setup
Separate Systems
When using the analyzer, it is recommended to use a system to generate bus traffic and a second system to run the software, to avoid characterization of traffic generated by the analyzer.
Connecting in General
Note: You must install the software before connecting the analyzer to the host machine for the first time.
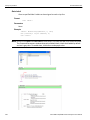
To set up the analyzer:
1. Plug the power adapter into the unit, and then plug the power adapter into a 100V–
240V, 50Hz–60Hz, power outlet. Turn on the Power switch.
Sierra M6‐1 SAS/SATA Protocol Analyzer User Manual
17
LeCroy Corporation
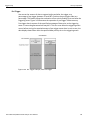
Cascading Sierra Analyzers
2. Connect the USB cable between the Sierra M6‐1 USB port and a USB port on the Host PC. The host PC operating system detects the analyzer and driver files.
(See “Connecting via Ethernet” on page 21 for Ethernet connectivity.)
3. Connect the analyzer to Host and Device as follows.
Figure 1.4: Hardware Setup
Cascading Sierra Analyzers
A Sierra M6‐1 analyzer includes a built‐in Sync port on the back panel (between the USB and Ethernet ports). See Figure 1.3. To connect two Sierra M6‐1 analyzers, plug the ends of a Micro‐D Sync cable [AC031XXA‐
X] into the Sync ports.
Figure 1.5: Cascading Two M6-1 Analyzers with a Micro-D Sync Cable
You must connect each of the analyzers to the Host PC using the USB port or Ethernet port.
18 Sierra M6‐1 SAS/SATA Protocol Analyzer User Manual
Cascading Sierra Analyzers
LeCroy Corporation
Note: Before connecting, stop all recording. However, you do not have to turn power off.
For Sierra M6‐1 analyzers connected by Sync cables, the SAS/SATA Protocol Suite application automatically synchronizes their recording timestamps, starts, and stops.
To connect three Sierra M6‐1 analyzers, connect the Micro‐D end of a Micro‐D to
DB‐9 Sync cable [AC030XXA‐X] to the Sync port of the first analyzer. Connect the male DB‐
9 end of the Micro‐D to DB‐9 cable to the female DB‐9 end of a second Micro‐D to DB‐9 cable. Connect the Micro‐D end of the second Micro‐D to DB‐9 Sync cable to the Sync port of the second analyzer. Connect the male DB‐9 end of the second Micro‐D to DB‐9 cable to the female DB‐9 end of a third Micro‐D to DB‐9 Sync cable. Connect the Micro‐D end of the third Micro‐D to DB‐9 Sync cable to the Sync port of the third analyzer.
Figure 1.6: Example Cascading Three Analyzers with Micro-D to DB-9 Cables
Sierra M6‐1 SAS/SATA Protocol Analyzer User Manual
19
LeCroy Corporation
Cascading Sierra Analyzers
To connect a Sierra M6‐1 analyzer to a Sierra M6‐2 or M6‐4 analyzer with a CATC SYNC Expansion Card, connect the Micro‐D end of a Micro‐D to DB‐9 Sync cable [AC030XXA‐X] to the Sync port of the Sierra M6‐1 analyzer. Connect the female DB‐9 end of the Micro‐D to DB‐9 cable to the CATC SYNC OUT port of the Sierra M6‐2 or M6‐4 analyzer.
Figure 1.7: Cascading M6-1 and M6-2 or M6-4 Analyzers with a Micro-D to DB-9 Cable
Note: You cannot connect a Sierra M6‐1 analyzer to a Sierra M6‐2 or M6‐4 analyzer with a STX SYNC Expansion Card.
For Sierra M6‐1, M6‐2, and M6‐4 analyzers connected by Sync cables, the
SAS/SATA Protocol Suite application automatically synchronizes their recording timestamps, starts, and stops.
For how to daisy‐chain two or more Sierra M6‐2 analyzers, see the Sierra M6‐2 User Manual. For how to daisy‐chain two or more Sierra M6‐4 analyzers, see the Sierra M6‐4 User Manual.
Note: You can use the Sync port to synchronize a Sierra M6‐1 analyzer to analyzers with different protocols. You use a Micro‐D Sync cable (AC031XXA‐X) to connect to a LeCroy Advisor T3 analyzer. You use a Micro‐D to DB‐9 Sync cable (AC030XXA‐X) to connect to other LeCroy analyzers. For more information, see the CrossSync User Manual and/or see “CrossSync Control Panel” on page 43.
20 Sierra M6‐1 SAS/SATA Protocol Analyzer User Manual
Connecting via Ethernet
LeCroy Corporation
Connecting via Ethernet
The Ethernet connection can have any of these configurations:
1. Analyzer connected to a network using a hub or switch, Gigabit Ethernet interface, or similar device.
2. Analyzer connected to the host computer (machine running the application software), using a hub or switch, Gigabit Ethernet interface, or similar device.
Connecting to a Network
When connected to a network, the analyzer can communicate with the DHCP server to obtain IP address configuration information in order to establish a connection. Select Device
After starting the software, click on Setup and select All Connected Devices (see the following screen capture).
Figure 1.8: Connecting to All SAS Device(s)
Sierra M6‐1 SAS/SATA Protocol Analyzer User Manual
21
LeCroy Corporation
Connecting via Ethernet
Figure 1.9: Connecting to All SATA Device(s)
The Select Device dialog allows connecting and disconnecting analyzers on the fly, without restarting the application. The new Device List (introduced in version 4.10) mandates using updated firmware in order to detect the analyzer over Ethernet. Thus, the analyzer must be updated over USB before it can be used remotely over Ethernet. This is applicable for any update from version 4.00 or earlier to any version from 4.10 or later.
22 Sierra M6‐1 SAS/SATA Protocol Analyzer User Manual
Connecting via Ethernet
LeCroy Corporation
The following Select Device dialog displays. The colors in the ‘Location’ column mean the following:
Red: Firmware and/or BusEngine components need to be updated to the latest version Light Blue: The device is ready to be connected.
Yellow: The device is locked.
Green: The software is connected and ready to run.
Figure 1.10: Select Device Dialog
Note: Click Refresh Device List to display all the devices on the network.
The Select Device dialog displays the following buttons:
Set Alias Name Click Set Alias Name to display the Set device alias name dialog as shown below.
Figure 1.11: Set Device Alias Name Dialog
Disconnect Click Disconnect to disconnect a device.
Sierra M6‐1 SAS/SATA Protocol Analyzer User Manual
23
LeCroy Corporation
Connecting via Ethernet
Add Device... Click Add Device to add a device with a static IP address.
Figure 1.12: Add Device with Static IP Dialog
Remove Device Click Remove Device to remove a previously added device.
IP Settings... Click IP Setting to reset IP settings of a device. The following IP Setting dialog displays.
Figure 1.13: IP Setting Dialog
Networks... Click Networks to select a network adapter. The following dialog displays.
Figure 1.14: Select Adapter Dialog
24 Sierra M6‐1 SAS/SATA Protocol Analyzer User Manual
Connecting via Ethernet
LeCroy Corporation
Refresh Device List Click Refresh Device List to refresh the device list.
To connect to a device, select a device which is Ready to Connect and click the Connect button on the right. The Connection Properties dialog is displayed (see the following screen capture).
Figure 1.15: Connection Properties Dialog
Specify one of the actions from the following:
Automatically connect to the device Ask if I want to connect to the device Take no action
If ‘Automatically connect to the device’ is selected, the next time the application opens the device will be automatically connected. In the Select Device dialog chained or cascaded units are displayed in the Device column with a [ (square bracket) icon. The sequence of the units is displayed in the Order column. See the following screen capture. Figure 1.16: Select Device Dialog Displaying Unit 1 and Unit 2 Chained
Sierra M6‐1 SAS/SATA Protocol Analyzer User Manual
25
LeCroy Corporation
Launching Your Analyzer
Note: When using STX Sync cards, you need to manually specify the order of the chained units. To match your unit sequence to the address for each unit in the Select Device dialog, click the pull down tab under the Order heading (on the right side) and select unit numbers: 1 for Unit 1, 2 for Unit 2, and so on. This determines the order in which the cascaded ports appear in the trace. When using the CATC Sync cards the order is automatically detected. IMPORTANT!
Power up all units before starting the software. Connecting over Different Subnets
If the Host PC (with the software) and Sierra M6‐1 are on the same subnet, they will see each other’s broadcasts, and the Sierra M6‐1 application will automatically appear in the Select Device dialog, from which you can select a device (as described in the previous section).
If the Host PC and Sierra M6‐1 do not reside on the same subnet, they will not see each other automatically. You must add the Sierra M6‐1 IP address manually. To add the IP Address, use the Add Device button (see Figure 1.12 on page 24).
TCP and UDP Ports Must Be Open to Connect over Ethernet
WARNING: Check your firewall settings before making Ethernet connections. Incorrect firewall settings can prevent LeCroy applications from detecting analyzers on the network, though Ping works correctly. Consult your Firewall documentation to allow LeCroy applications access to the network.
The following TCP and UDP ports must be open to connect over the Ethernet:
TCP Port: 4000 to 4003
UDP Ports: 4015 to 4017
Launching Your Analyzer
To launch the software, double‐click the SAS or SATA icon.
26 Sierra M6‐1 SAS/SATA Protocol Analyzer User Manual
Operating in Simulation Mode
LeCroy Corporation
Operating in Simulation Mode
The SAS/SATA applications operate in Simulation Mode by default if the software detects no hardware.
The Analyzer software launches and displays the appropriate tool bar, but with the limitation that the Analyzer operates only on static, previously captured, bus data.
Limitations:
Simulation Mode lets you try all of the available functions, but the system is not capturing any real data and is displaying only
pre‐captured results.
Using the Software
Depending on the software license(s) purchased with the unit, the Sierra M6‐1 has SAS and SATA protocol capability or has SATA only. Use the SAS Protocol Suite or SATA Protocol Suite applications, respectively. The LeCroy SAS Protocol Suite can be a:
Protocol Analyzer: Captures data, triggers on events, and saves. Easy Mode allows standard Trigger and Data capture. Advanced Mode (requires license) allows you to program custom triggering in and out, capturing, state jumps, and timers (see “Protocol Analysis” on page 37).
Jammer: The InFusion™ Error Injector and Traffic Modifier is an error injector and traffic modification tool that allows you to verify real‐world fault handling (see “InFusion Overview” on page 233).
Note: The Advanced Mode option has to be purchased separately.
Getting Started with the Protocol Analyzer
To use the software for protocol analysis, first select File > New > Protocol Analyzer for a new project or File > Open an existing protocol analysis file: .sac for a SAS file or .stc for a SATA file (see “Protocol Analysis” on page 37). You can also open a .scs SAS Sample file or .sts SATA Sample file. Example files are in the Examples folder. You can also use Project Setup > Last Protocol Analyzer.
On the Capture tab, select to capture Everything or Pattern. For Pattern, select a Pattern. You can exclude patterns and frames. You can use different patterns for pre‐trigger and post‐trigger.
On the Trigger tab, select the trigger type. For Pattern, select the pattern.
On the Settings tab, select trigger position and memory use. Change the Analyzer settings if necessary. Change the port Speed if necessary.
Use Advanced Mode only after you become familiar with the hardware and software and have special needs.
Sierra M6‐1 SAS/SATA Protocol Analyzer User Manual
27
LeCroy Corporation
LeCroy SAS and SATA Protocol Suite Menu Options and Toolbars
LeCroy SAS and SATA Protocol Suite Menu Options and Toolbars
This section lists all the SAS and SATA Protocol Suite application menu options and the toolbars.
File
The File menu options allows you to perform common tasks such as open, close, save, export, print, send files and exit the application (see Figure 1.17).
Figure 1.17: File Menu Option
28 Sierra M6‐1 SAS/SATA Protocol Analyzer User Manual
LeCroy SAS and SATA Protocol Suite Menu Options and Toolbars
LeCroy Corporation
Setup
For special work, you can use the Setup menu (see the following figure) to perform the following actions:
Configure TxVout & Pre‐emphasis (see “Tx Vout & Preemphasis” on page 202)
User Defined Decoding (see “User‐Defined Decoding” on page 215) External Trig Setting (see “External Trig Setting” on page 212)
Update Device (see “Update Device” on page 213)
All Connected Devices (see “Select Device” on page 21)
Find and Power On/Off DUT (see “Find DUT” on page 226)
Manage Setup Licences (see “Floating License” on page 211)
Set Preferences (see “Software Settings” on page 203)
Perform a Self Test (see “Self Test” on page 218)
Create a Data Block (see “Creating a Data Block” on page 106)
Set Port Alias (see “Set Port Alias” on page 200)
Set SAS Address Alias (see “SAS Address Alias (SAS only)” on page 201)
Figure 1.18: Setup Menu Option
Session
The Session menu has the following options:
Start Capture/Record ‐ Start capture or record a trace
Pause Capture/Record ‐ Aborts the capture without saving
Stop Capture/Record ‐ Stops the hardware
Start Target Emulator ‐ Starts the target emulator (SAS)
Stop Target Emulator ‐ Stops the target emulator (SAS)
Start Device Emulator ‐ Starts the device emulator (SATA)
Stop Device Emulator ‐ Stops the device emulator (SATA)
Sierra M6‐1 SAS/SATA Protocol Analyzer User Manual
29
LeCroy Corporation
LeCroy SAS and SATA Protocol Suite Menu Options and Toolbars
Analysis
The Analysis menu allows you to view captured data (see the following screen capture).
Menu items and toolbar options enabled and/or displayed are based on the type of window open. The following types of windows can be displayed:
No active window
Project file open
Trace file open
Figure 1.19: SAS Analysis Menu
Figure 1.20: SATA Analysis Menu
30 Sierra M6‐1 SAS/SATA Protocol Analyzer User Manual
LeCroy SAS and SATA Protocol Suite Menu Options and Toolbars
LeCroy Corporation
Viewing Captured Data
After data capture, you can view the captured data in the Viewer by selecting Analysis (see “Analysis” on page 116). You can display the same data in:
Packet View: Displays packets
Spreadsheet View: Displays Packet View fields by time
Column View: Shows DWORDs in columns by port
Text View: Shows transaction frames, grouped in columns by port
Field List View: Displays field information in a list format
Waveform Display: Shows waveform display for all active ports, on which you can perform timing measurements
Statistical Report: generate statistics for all transports, commands, primitives, bus conditions, addresses, lanes, and errors Histogram View: Shows frame‐type transfers
Bus Utilization: Displays the utilization of the bus
Data Reports: Displays data payloads
Compare 2 Data Payloads: Compares 2 data payloads
SAS Verification: Verifies compliance with the SAS specification
VSE: Perform custom post‐process analysis of the open trace by running a verifi‐
cation script over the trace
Navigation
The Navigation menu has the following options to navigate through the application (see the following screen capture):
Figure 1.21: Navigation Menu Option
Sierra M6‐1 SAS/SATA Protocol Analyzer User Manual
31
LeCroy Corporation
LeCroy SAS and SATA Protocol Suite Menu Options and Toolbars
Goto
Trigger Position
X Position
Y Position
Packet No
Time Stamp
Bookmark
Begin End Search
Search Next
Search Previous
View
The View menu options allows the user to zoom in and out, enable/disable filtering and toolbars among other actions. It has the following options:
Figure 1.22: View Menu Option
32 Zoom In (refer to “Navigation + View Toolbar” on page 162)
Zoom Out (refer to “Navigation + View Toolbar” on page 162)
Actual Size (refer to “Navigation + View Toolbar” on page 162)
Full Screen (refer to “Navigation + View Toolbar” on page 162)
Tile Views (refer to “Navigation + View Toolbar” on page 162)
Enable Filtering (refer to “Filter Setup” on page 167)
Filtering (refer to “Filter Setup” on page 167)
Filter Idles (refer to “Filter Setup” on page 167)
Sierra M6‐1 SAS/SATA Protocol Analyzer User Manual
LeCroy SAS and SATA Protocol Suite Menu Options and Toolbars
LeCroy Corporation
Link Layer‐SAS only (refer to “Packet View Toolbar” on page 183)
Transport Layer‐SAS only (refer to “Packet View Toolbar” on page 183)
Application Layer‐SAS only (refer to “Packet View Toolbar” on page 183)
Pack/Unpack Repeated Primitives‐SAS only (refer to “Packet View Toolbar” on page 183)
Physical Layer‐SATA only (refer to “Packet View Toolbar” on page 183)
FIS Layer‐SATA only (refer to “Packet View Toolbar” on page 183)
Command Layer‐SATA only (refer to “Packet View Toolbar” on page 183)
Wrap Packets (refer to (refer to “Packet View Toolbar” on page 183)
Toolbar (allows you to customize the toolbar with the options given below)
Main
Record+Capture
Analysis
Navigation+View
Column View
Cursor position
Target Emulator
Status Bar (refer to “Cursor Position Status Bar” on page 193)
Window
The Window menu has the following options:
Cascade: Displays all open windows in an overlapping arrangement.
Tile Horizontal: Displays all open windows in a above‐below arrangement.
Tile Vertical: Displays all open windows in a side‐by‐side arrangement.
Arrange Icons: Arranges minimized windows at the bottom of the display.
Close All: Closes all windows.
Help
For more information see “Help Menu” on page 216.
Toolbars
The toolbars enable you to perform several actions, some of which are listed below.
Show or hide fields and ports, change port names, and change data format.
Show the layers and channels using their toolbars.
Decode using the Decode toolbar.
Search and Filter.
Sierra M6‐1 SAS/SATA Protocol Analyzer User Manual
33
LeCroy Corporation
LeCroy SAS and SATA Protocol Suite Menu Options and Toolbars
There are four sets of toolbars:
Main Toolbar ‐ For details on the Main Toolbar refer to “SAS Main Toolbar” on page 40 and “SATA Main Toolbar” on page 41.
Record Capture Toolbar ‐ For additional information see “SAS Main Toolbar” on page 40 and “SATA Main Toolbar” on page 41.
Target/Device Emulator Toolbar ‐ For additional information see “SAS Main Tool‐
bar” on page 40 and “SATA Main Toolbar” on page 41.
Navigation + View Toolbar ‐ For additional information see “Navigation + View Toolbar” on page 162.
Show Analysis Toolbar ‐ For additional information see “Show Analysis Toolbar” on page 116.
Packets View Toolbar ‐ For additional information see “Packet View Toolbar” on page 183.
Figure 1.23: SAS/SATA Protocol Suite Toolbars
Port Status
You can display an overview of the active ports by clicking the buttons at the bottom right of the main window (See “Port Status” on page 191).
34 Sierra M6‐1 SAS/SATA Protocol Analyzer User Manual
LeCroy SAS and SATA Protocol Suite Menu Options and Toolbars
LeCroy Corporation
InFusion
The LeCroy InFusion™ Error Injector and Traffic Modifier is an error injector and traffic modification tool that allows you to verify real‐world fault handling for Serial Attached SCSI (SAS) and Serial ATA (SATA) systems. Click on the Jammer icon to invoke the LeCroy SAS or SATA InFusion, (see “InFusion Overview” on page 233).
You can toggle between the InFusion and Analyzer panes by using the Alt+Tab keys, the Windows Task Bar or by pressing the respective toolbar button in each pane. Analyzer and InFusion
Sierra M6‐1 Analyzers can be used in tandem to combine simultaneous error injection and trace capture/analysis capabilities.
Sierra M6‐1 SAS/SATA Protocol Analyzer User Manual
35
LeCroy Corporation
36 LeCroy SAS and SATA Protocol Suite Menu Options and Toolbars
Sierra M6‐1 SAS/SATA Protocol Analyzer User Manual
Chapter 2
Protocol Analysis
The system performs Protocol Analysis by defining and running an analysis project. An analysis project definition defines what to capture, what the analyzer triggers on, and the memory settings. You can save defined projects as project *.sac files for later use.
Easy Mode (Pre-Defined Setups)
After you install the Analyzer software (see “Software Installation” on page 17) and set up the Analyzer (see “Hardware Setup” on page 17), launch the Analyzer software (see “Launching Your Analyzer” on page 26) to display the default Protocol Analyzer in Easy Mode at the Capture tab.
This mode allows you to operate the analyzer with minimum setup. In this mode, you can perform only a Trigger and Data capture, or you can program the SAS Initiator Emulator or SATA Host Emulator to generate bus traffic for triggering and data capture.
Main Window
Use Easy Mode to get a comprehensive overview of your analyzer’s capabilities:
SAS: On the Analyzer Menu Bar, click File > New > Protocol Analyzer to open a SAS Protocol Analyzer dialog.
Sierra M6‐1 SAS/SATA Protocol Analyzer User Manual
37
LeCroy Corporation
Main Window
Project Tree display
What analyzer triggers on
Capture memory settings
Collapse All button hides details in Project Tree
Expand All button expands collapsed Project Tree
Figure 2.1: SAS: New Analysis Project Dialog
The New Project dialog opens with default settings to capture Everything on the bus and to Trigger On on Snapshot. (The analyzer captures everything immediately without triggering on anything in particular.)
SATA: On the Analyzer Menu Bar, click File > New > Protocol Analyzer to open a SATA Protocol Analyzer dialog.
Project Tree display
What analyzer triggers on
Capture memory settings
Collapse All button hides details in Project Tree
Expand All button expands collapsed Project Tree
Figure 2.2: SATA: New Analysis Project Dialog
38 Sierra M6‐1 SAS/SATA Protocol Analyzer User Manual
LeCroy Corporation
Project Tree
SAS vs. SATA: SATA Dialog does not show “Exclude RRDY” or “Exclude NOTIFY”.
SATA Dialog replaces “Exclude SATA_CONT” with “Exclude CONT” and “Exclude SATA_SYNC” with “Exclude SYNC”.
Project Tree
The Project Tree on the right side of the main window displays a comprehensive tree structured overview of the project. The project tree shows what to capture, on what the analyzer triggers, and the capture memory settings.
Capture Tab Fields
The Capture tab has the following fields:
Exclude SATA_CONT (SAS) or Exclude CONT (SATA)
Check this to exclude SATA_CONT primitives from the data capture.
Exclude SATA_SYNC (SAS) or Exclude SYNC (SATA)
Check this to exclude SATA_SYNC primitives from the data capture.
Exclude OOB Signals
Check this to exclude OOB signals from the data capture.
Exclude XXXX
Check this to exclude XXXX patterns from the data capture.
Note: The validity of time stamps during Idles is traded off against good buffer memory utilization when using ‘Exclude XXXX’.
Exclude Payload except
Check this to exclude Payload of Data Frames from the data capture. You can except a number of DWORD(s). Note: The Data Report does not reflect excluded Payload of Data Frames.
Note: When showing truncated data in the Data Payload View, the truncation points are marked with a separator placed between payloads. You can get more information about the data exclusion using the tooltip over the separator.
Exclude ALIGN
Check this to exclude ALIGN primitives from the data capture.
Sierra M6‐1 SAS/SATA Protocol Analyzer User Manual
39
LeCroy Corporation
SAS/SATA Software Menus and Toolbars
Exclude RRDY (SAS only)
Check this to exclude RRDY primitives from the data capture.
Exclude NOTIFY (SAS only)
Check this to exclude NOTIFY primitives from the data capture.
Exclude Idle
Check this to exclude Idles from the data capture.
Define different patterns for pre-trigger and post-trigger data captures
Replaces the Capture tab with a Pre‐Trigger Capture tab and a Post‐Trigger Capture tab.
SAS/SATA Software Menus and Toolbars
The SAS and SATA software has the following menus and toolbars.
SAS Main Toolbar
The following figure displays the SAS main toolbar.
Open Sample File
Start Target Emulator
Launch Trainer
Find DUT
Launch Jammer
Stop Hardware
Start Recording
Abort Capturing Without Saving Sample File
Save
Upload Manager
Stop Target Emulator
Figure 2.3: SAS: Software Menus and Toolbar
40 Sierra M6‐1 SAS/SATA Protocol Analyzer User Manual
Run Hardware
LeCroy Corporation
SATA Main Toolbar
The following figure displays the SATA main toolbar.
Open Sample File
Start Device Emulator
Launch Trainer
Open Find Device Dialog
Launch Jammer
Stop Hardware
Start Recording
Abort Capturing Without Saving Sample File
Save
Upload Manager
Stop Device Emulator
Figure 2.4: SATA: Software Menus and Toolbar
Run Hardware
To get an immediate overview of the bus traffic to and from your Analyzer:
1. Click the Record button.
2. The analyzer begins filling the defined memory buffer with traffic on the bus. After the traffic fills the memory buffer, the traffic is uploaded to the viewer and the Packet View display opens. Packet View is the default display. However, you can view results in any of the different views by selecting View on the menu bar and choosing the desired View.
Sierra M6‐1 SAS/SATA Protocol Analyzer User Manual
41
LeCroy Corporation
Run Hardware
Show/Hide Layers buttons
Show/Hide Port Data
X,Y,T
Cursors
Layer ID with different colors
Link
Layer
Transport Layer command interpretation
Data direction arrows
Relative time display
(between two sequential
packets on the same
layer and port)
Source and destination addresses in SCSI commands
Not shown in this capture
Figure 2.5: SAS: Typical Packet View Results Display
Note: When using the Advanced Mode sequencer, the analyzer logs the state transitions in the trace, with the name the user gives to the state.
SAS: In case of an STP interface, the expander displays STP addresses provided to the SATA drive and the SAS software integrates the STP addresses in the ATA command.
The results display shows each transaction for every layer identified in a different color and the data direction identified with data direction arrows. Upstream traffic has an arrow from right to left:. Downstream traffic has an arrow left to right: .
You can hide any layer by clicking the corresponding Show/Hide button on the menu bar. The system retains all captured data, but the display has only some data layers for simpler viewing.
You can configure the viewer display for test and viewing preferences (see “Viewer Display” on page 113 for details about configuring the viewer display).
42 Sierra M6‐1 SAS/SATA Protocol Analyzer User Manual
LeCroy Corporation
CrossSync Control Panel
The Analysis Project dialog offers you a comprehensive set of choices to create a trigger and capture project satisfying some specific need. You can set the Analyzer to:
Capture specific patterns (see "Patterns and Data Capture Setup" on page 53).
Capture different patterns pre‐ and post‐trigger.
Exclude parameters from capture.
Trigger on a pattern or sequence of patterns (see "Trigger Setup" on page 69).
Configure trace capture memory (Settings tab).
Select file to save trace capture in memory (Settings tab).
Include a project note (Notes tab).
Launch Jammer
The Launch Jammer option invokes InFusion. For more information refer to “InFusion Overview” on page 233.
CrossSync Control Panel
The CrossSync Control Panel allows you to select analyzers for synchronization and manage the recording process.
CrossSync is LeCroy’s analyzer synchronization solution that enables time‐aligned display of protocol traffic from multiple daisy‐chained analyzers showing packet traffic from multiple high‐speed serial busses. A lightweight software control panel allows users to select analyzers for synchronization and manage the recording process. Captured traffic is displayed using the latest analyzer software (in separate windows) with all the protocol specific search and reporting features.
Captured packets are displayed in separate windows that share a common time scale. Navigating the traffic in either direction will scroll to the same timestamp in a synchronized window. When using the CrossSync option, users can access the full complement of analysis capabilities available within the individual LeCroy software. Search, reporting, and decoding all operate normally. This feature is available with the LeCroy SAS/SATA Protocol Suite application.
Launching the CrossSync Control Panel
To launch CrossSync from the SAS/SATA Protocol Suite software application, select the ‘Launch CrossSync Control Panel‘ entry in the ‘Project Setup’ menu (see the screens below). Or, you can launch CrossSync from the ‘Start’ menu.
Figure 2.6: Launching CrossSync from the SAS Protocol Suite Application
Sierra M6‐1 SAS/SATA Protocol Analyzer User Manual
43
LeCroy Corporation
Save Workspace
Figure 2.7: Launching CrossSync from the SATA Protocol Suite Application
Please refer to the CrossSync Control Panel User Manual for more information.
Save Workspace
The workspace .wss file sets viewing parameters. After you open a trace and select views, you can save the viewing parameters in a workspace file. Select File > Save Workspace to open a Save As dialog. Save the current workspace as a .wss file.
To set a default workspace, select Setup > Preferences > Software Settings to open the Software Settings dialog. In the Default Workspace field, enter the path and name of a saved workspace .wss file.
After you open a trace, you can use a different workspace. Select File > Open to open to open another trace. Select a .wss file to open it.
44 Sierra M6‐1 SAS/SATA Protocol Analyzer User Manual
LeCroy Corporation
Saving a Trace Capture
Saving a Trace Capture
You can save a Trace Capture for review at a later time using the Save As dialog.
Figure 2.8: Save As Dialog
You can limit the range of the saved file. You can save:
All Samples
a range between selected cursors
a range between selected Idle, link, commands
range between bookmarks
Save Filtered Sample checkbox saves a trace file without filtered data. You can Apply Show/Hide Link Setting.
Note: If you deselect a port using the buttons on the toolbar, and then save the trace, on reopening the trace the deselected port will still display if you select the Save Filtered Sample checkbox and then check Apply Show/Hide Link Setting in save as dialog.
Sierra M6‐1 SAS/SATA Protocol Analyzer User Manual
45
LeCroy Corporation
Saving a Trace Capture
Exporting
From the File menu, you can Export to Text/Excel, Export to Initiator Emulator, Export to Trainer, Export Read‐Write Command Report, or Export Paired SAS Address Report.
Export to Text/Excel
From the File menu, you can export to Text/Excel, using the Export to Text/Excel. The Save as Text dialog displays.
Figure 2.9: Save As Text Dialog
You can limit the range of the saved file. You can save:
46 All Packets
Range between selected cursors
Range between bookmarks
Sierra M6‐1 SAS/SATA Protocol Analyzer User Manual
Export to Initiator Emulator (SAS) or Host Emulator (SATA)
LeCroy Corporation
Export to Initiator Emulator (SAS) or Host Emulator (SATA)
From the File menu, you can Export to Initiator Emulator (SAS) or Export to Host Emulator (SATA), using the Extract Sample File dialog (see following figures).
Figure 2.10: Export to Initiator Emulator (SAS) Dialog
Figure 2.11: Export to Host Emulator (SATA) Dialog
Sierra M6‐1 SAS/SATA Protocol Analyzer User Manual
47
LeCroy Corporation
Export to Initiator Emulator (SAS) or Host Emulator (SATA)
You can limit the range of the saved file. You can save:
All Trace
Range between selected cursors
Range between SCSI Commands or Transport
You can import SCSI Commands, Task Management, ATA Commands, SSP Frames, SMP Frames, SMP Commands, or STP Frames.
You can select the Port.
In the Project Name, enter a valid file.
Export Read/Write Command Report
From the File menu, you can Export Read/Write Command Report as an Excel file, using the Save As dialog. Export Paired SAS Address Report
If Text View is activated, from the File menu you can save a Paired SAS Address Report as an Excel file, using the Export Paired SAS Address Report dialog (see following figure). Figure 2.12: Export Paired SAS Address Report Dialog
48 Sierra M6‐1 SAS/SATA Protocol Analyzer User Manual
LeCroy Corporation
Projects
You can limit the range of the saved file. You can save:
All Packets
Range between selected cursors
You can view expander traffic (particularly during discovery) in a spreadsheet format. You can use column headers with SAS Address Pairs. For example, instead of I1, T1, I2, T2, and so on, the columns are Source/Destination SAS Address pairs, such as S1:SEP or S2:EXP 0. Projects
You can define a new project, starting with the default project definition, or modify the settings for the last project run.
New Default Project
To start a New project, select File > New on the main menu bar and choose Protocol Analyzer to open a new project with default settings that you can modify (see “Main Window” on page 37).
Last Project
Clicking the Green button opens the last project run, so you can modify it.
Project File Types
Projects have the following file types:
*.asl
Decoding script file (in the Examples folder “User Define Decoding Script” subfolder)
*.cfg
Display Configuration file (in the System folder “Config” subfolder)
*.dat
DataBlock file (in the System folder “DataBlock” subfolder)
*.sac
SAS Protocol Analyzer/Capture Project/Viewer file (in the Examples folder “EasyCaptr”, “AdvanceCaptr”, or “Exerciser” subfolders)
*.saf
Device Identifier file
*.scs
SAS Sample file (in the SAS Examples folder “Sample” subfolder)
*.sde
Device Emulator file (in the System folder “Compliance” subfolder)
*.sfl
Filter configuration file
*.spg
Single‐role Pattern Generator file (in the Examples folder SAS “PatternGenerator\Single role (spg files)” subfolder and SATA “PatternGenerator\Single Role” subfolder). Single role means the file is for a Device or Host.
*.ssh
SAS Search configuration File
*.stc
SATA Protocol Analyzer/Capture Project/Viewer file (in the Examples folder “EasyCaptr”, “AdvanceCaptr”, or “Exerciser” subfolders)
Sierra M6‐1 SAS/SATA Protocol Analyzer User Manual
49
LeCroy Corporation
Projects
*.std
Target Emulator file (in the Examples folder “Target Emulator” subfolder)
*.sts
SATA Sample file (in the SATA Examples folder “Sample” subfolder)
*.tsh
SATA Search configuration file
*.wss
SAS Workspace file (in the SAS System folder “Predefined\Workspace” subfolder)
*.wst
SATA Workspace file (in the SATA System folder “PreDefined\Workspace” subfolder)
Example Projects
The Analyzer includes example projects that you can use to perform an immediate analysis without any setup.
The Analyzer system software has a pre‐defined folder (directory) structure for storing all files. All example files are in the Examples folder under the Sierra M6‐1 folder.
It is strongly recommended that you open some example files to see types of projects that you can create.
Run an Example Analysis Project
To run an example project:
1. Select File > Open.
2. Locate example analysis projects by looking in the Examples folder. Examples are available for AdvanceCaptr, EasyCaptr, Exerciser, PatternGenerator, Samples, Target Emulator, and User Define Decoding Script.
3. In the EasyCaptr folder, choose an example *.sac file and click Open to display the example project dialog.
Figure 2.13: File Open Dialog
50 Sierra M6‐1 SAS/SATA Protocol Analyzer User Manual
LeCroy Corporation
Projects
Figure 2.14: SAS: Sample Protocol Analysis Project
SAS vs. SATA: For Pattern Parameters, SATA Dialog adds FIS, FIS Pattern, and ATA Command Pattern and does not have STP Frame, SSP Frame, SMP Frame, and Address Frame.
4. Click the Record button to execute the pre‐defined example.
Sierra M6‐1 SAS/SATA Protocol Analyzer User Manual
51
LeCroy Corporation
Projects
5. After the project runs, you see an analyzer trace capture display similar to the one shown in Figure 2.15.
Figure 2.15: SAS: Analyzer Trace Capture Display
For details about the results display, see “Display Manipulation” on page 113 and see “Display Configuration” on page 195.
52 Sierra M6‐1 SAS/SATA Protocol Analyzer User Manual
LeCroy Corporation
Patterns and Data Capture Setup
Patterns and Data Capture Setup
You can refine data capture by choosing Pattern and then selecting specific patterns for capture. Additionally, you can define a different set of patterns to capture after trigger.
To define specific patterns for capture, click the Pattern button to display the Capture tab for Pattern.
Figure 2.16: SAS: Choosing Capture Patterns
SAS vs. SATA: SATA Dialog replaces “Exclude SATA_CONT” with “Exclude CONT” and “Exclude SATA_SYNC” with “Exclude SYNC”. SAS: The SAS Parameters window displays the following pattern capture categories:
STP Frame
Address Frame
SMP Frame
SSP Frame
Data Pattern
Protocol Errors
SATA: The SATA Parameters window displays the following pattern capture categories:
FIS
FIS Pattern
Data Pattern
Protocol Errors
Sierra M6‐1 SAS/SATA Protocol Analyzer User Manual
53
LeCroy Corporation
Patterns and Data Capture Setup
Choose a Parameter
To choose a parameter for capture from any of these categories, highlight the category in the parameter window and click the Add>> button. This opens selection dialogs for each of the categories displaying all of the parameters for that category. All patterns added appear in the Project Tree.
Exclude Patterns
Check this box to allow for the capture of everything except the patterns that have been added to the Project Tree. When you check this box, the Primitive category appears in the Parameter window, and the window enables the Exclude Idle checkbox.
Figure 2.17: SAS: Exclude Patterns Checked
SAS vs. SATA: SATA Dialog replaces “Exclude SATA_CONT” with “Exclude CONT” and “Exclude SATA_SYNC” with “Exclude SYNC”. SATA Dialog has different Pattern Parameters (see “Patterns and Data Capture Setup” on page 53).
To remove an item from capture, highlight it in the Project tree and click the <<Remove button.
54 Sierra M6‐1 SAS/SATA Protocol Analyzer User Manual
Patterns and Data Capture Setup
LeCroy Corporation
Pre and Post Trigger Data Capture
You can define one set of patterns for capture prior to the occurrence of a trigger and another set of patterns for capture after the occurrence of a trigger. The selection and setup procedure is the same for both Pre‐Trigger capture and Post‐Trigger capture. Check Define different patterns for pre‐trigger and post‐trigger data capture to enable the Pre‐Trigger Capture and Post‐Trigger Capture tabs (instead of only the Capture tab).
Figure 2.18: SAS: Post-trigger Capture Dialog Enabled
SAS vs. SATA: SATA Dialog replaces “Exclude SATA_CONT” with “Exclude CONT” and “Exclude SATA_SYNC” with “Exclude SYNC”. SATA Dialog has different Pattern Parameters (see “Patterns and Data Capture Setup” on page 53).
Sierra M6‐1 SAS/SATA Protocol Analyzer User Manual
55
LeCroy Corporation
Patterns and Data Capture Setup
Defining Patterns
To select an item for capture, either highlight the category and click the Add>> button, or double‐click the category, to open a corresponding definition dialog. You can define patterns for specific ports by checking or unchecking the Port ID.
Primitive
Double‐click Primitive (available only if you check Exclude Patterns) to open the Primitive selection dialog.
Port ID
Figure 2.19: SAS: Primitive Dialog
SAS vs. SATA: SATA Dialog has no radio buttons and has different drop‐down options.
Click the down arrow next to the Primitive drop‐down list box, choose a Primitive to exclude, and click OK. Repeat for additional Primitives.
Data Pattern
Double‐click Data Pattern to open the Data Pattern definition dialog.
Figure 2.20: SAS: Data Pattern Dialog
56 Sierra M6‐1 SAS/SATA Protocol Analyzer User Manual
Protocol Errors
LeCroy Corporation
SAS vs. SATA: SATA Dialog shows Port at the top and does not show SSP or STP.
Define the data pattern for capture or exclusion from capture and click OK.
Note: When entering the data pattern in the “Data” section of this screen, if you are reading the data pattern from a recorded trace, you must reverse the order of the bytes listed for each DWORD entered. For example, if you want to capture (or exclude) “00 01 02 03” (as displayed in the trace), you must enter this pattern as “03 02 01 00”.
Protocol Errors
Double‐click Protocol Errors to open the Protocol Errors selection dialog.
Figure 2.21: SAS: Protocol Errors Dialog
SAS vs. SATA: SATA dialog does not show ACK/NAK Timeout and has FIS signal‐latency and state‐transition errors, not STP ones.
Check protocol error(s) to omit or not capture, then click OK.
Sierra M6‐1 SAS/SATA Protocol Analyzer User Manual
57
LeCroy Corporation
Protocol Errors
Protocol Errors
Code Violation: Wrong 10b symbol detected.
Disparity Error: Wrong disparity detected. ALIGN Error: ALIGN primitive frequency is outside the specification requirements.
STP Signaling Latency Error [SAS only] or FIS Signaling Latency Error [SATA only]: DWORD difference between HOLD and HOLDA is greater than entered value in the HOLD/
HOLDA Response Timeout field.
STP Invalid State Transition (Unexpected Primitive) [SAS only] or FIS Invalid State Transition (Unexpected Primitive) [SATA only]: Second SATA_SOF is encountered before SATA_EOF, and other unexpected primitives.
STP Invalid State Transition (Primitive Timeout) [SAS only] or FIS Invalid State Transition (Primitive Timeout) [SATA only]: Timeout between two paired primitives is above entered value. 65000 DWORDs is default. For example, it can occur between WTRM and R_OK, or X_RDY and R_RDY. It expects device (or host) to send a response, but response is not received after 65000 DWORDs. You set Primitive Response Timeout and HOLD/
HOLDA Response Timeout in the Settings tab Analyzer Settings section.
Frame Type Error: Wrong frame type.
Frame Length Error: Reported frame length is different than actual frame length.
Frame Direction Error: Wrong frame direction. For example, Register Device to Host coming from the Host.
CRC Error: CRC error detected.
ACK/NAK Timeout [SAS only]: ACK or NAK primitive missing or encountered unexpectedly.
Disable “Disparity Error” and “Symbol Violation” during the Speed negotiation: No longer detects Code Violation or Disparity Error.
Delimiter Error: Detects two SOF primitives without an EOF between them. Also detects two EOF primitives without an SOF between them. 58 Sierra M6‐1 SAS/SATA Protocol Analyzer User Manual
LeCroy Corporation
Protocol Errors
STP Frame (SAS only)
Double‐click STP Frame to open the FIS Patterns dialog.
Figure 2.22: SAS: FIS Patterns Dialog
SAS vs. SATA: Not available in SATA.
Click the down arrow next to the Type drop‐down list box, choose an FIS type to capture or exclude, and click OK. Repeat for additional types.
Available FIS Types
Register Host to Device
Register Device to Host
Set Device Bits
DMA Activate
DMA Setup
BIST
PIO Setup
Data
Vendor
Sierra M6‐1 SAS/SATA Protocol Analyzer User Manual
59
LeCroy Corporation
Protocol Errors
Address Frame (SAS only)
Double‐click Address Frame to open the Address Frame Type Pattern dialog.
Figure 2.23: SAS: Address Frame Type Pattern Dialog
SAS vs. SATA: Not available in SATA.
Click the down arrow next to the Address Frame Types list box and choose an address frame type.
SMP Frame (SAS only)
Double‐click SMP Frame to open the SMP Frame Pattern dialog.
Figure 2.24: SAS: SMP Frame Pattern Dialog
SAS vs. SATA: Not available in SATA.
Click the down arrow next to the SMP Frame Type list box and choose a frame type. Assign a specific function to the frame by clicking the down arrow next to the Function list box and choose a function.
60 Sierra M6‐1 SAS/SATA Protocol Analyzer User Manual
LeCroy Corporation
Protocol Errors
SSP Frame (SAS only)
Double‐click SSP Frame to open the SSP Frame Pattern dialog.
Figure 2.25: SAS: SSP Frame Type Dialog
SAS vs. SATA: Not available in SATA.
Click the down arrow next to the SSP Frame Type list box and choose an SSP Frame type.
Sierra M6‐1 SAS/SATA Protocol Analyzer User Manual
61
LeCroy Corporation
Protocol Errors
FIS (Frame Information Structure) (SATA only)
Double‐click FIS to open the FIS Type selection dialog.
Figure 2.26: SATA: FIS Types Dialog
SAS vs. SATA: Not available in SAS.
Click the down arrow next to the Type drop‐down list box, choose a FIS type to capture, and click OK. Repeat for additional types.
Available FIS Types
62 Register Host to Device
Register Device to Host
Set Device Bit
DMA Activate
DMA Setup
BIST
PIO Setup
Data
Any Type
Sierra M6‐1 SAS/SATA Protocol Analyzer User Manual
Protocol Errors
LeCroy Corporation
FIS Pattern (SATA only)
Double‐click STP Frame to open the STP Frame selection dialog.
Figure 2.27: SATA: FIS Pattern Dialog
SAS vs. SATA: Not available in SAS.
The FIS Pattern dialog opens with the default FIS Type as Register Host to device. To choose another available FIS Type, click the down arrow next to the FIS Type list box.
Figure 2.28: SATA: FIS Pattern Dialog Dropdown
SAS vs. SATA: Not available in SAS.
Choose FIS Type and complete the corresponding dialog.
Sierra M6‐1 SAS/SATA Protocol Analyzer User Manual
63
LeCroy Corporation
Protocol Errors
FIS Types (SAS and SATA)
If you select STP Frame (SAS) or FIS Pattern (SATA) for the Pattern, the FIS Pattern window opens. You can select the FIS Type in this window from among the following types.
Register Host to Device
Figure 2.29: Register Host to Device
64 Sierra M6‐1 SAS/SATA Protocol Analyzer User Manual
LeCroy Corporation
Protocol Errors
Register Device to Host
Figure 2.30: Register Device to Host
Set Device Bits
Figure 2.31: Set Device Bits
Sierra M6‐1 SAS/SATA Protocol Analyzer User Manual
65
LeCroy Corporation
Protocol Errors
DMA Activate
Figure 2.32: DMA Activate
DMA Setup
Figure 2.33: DMA Setup
66 Sierra M6‐1 SAS/SATA Protocol Analyzer User Manual
Protocol Errors
LeCroy Corporation
BIST
Figure 2.34: BIST
PIO Setup
Figure 2.35: PIO Setup
Sierra M6‐1 SAS/SATA Protocol Analyzer User Manual
67
LeCroy Corporation
Protocol Errors
Data
Figure 2.36: Data
Vendor
Vendor is for FIS Pattern.
Figure 2.37: Vendor
68 Sierra M6‐1 SAS/SATA Protocol Analyzer User Manual
LeCroy Corporation
Trigger Setup
Trigger Setup
The Trigger tab in the analysis project dialog allows you to specify when the analyzer completes a data capture. Three trigger modes are available: The default Don’t care (Snapshot), Manual Trig, and Pattern.
When data capture starts with Don’t care (Snapshot) selected, the analyzer triggers on the first data pattern on the bus. Starting a data capture with Pattern selected triggers when specific pattern(s) are detected in the captured data stream. The following three ways can trigger the analyzer with Pattern selected.
Trigger on any pattern (Any Trigger Mode)
External Trigger
Trigger on a sequence of patterns (Sequential Trigger Mode)
Snapshot Mode
To trigger immediately on any pattern, check the Don’t care (Snapshot) button.
Figure 2.38: Default Trigger Selected
Manual Trigger Mode
In the Manual Trigger mode, the analyzer captures bus traffic continually from when you use the Manual Trigger until you click the Stop Hardware button (on the analyzer toolbar), which triggers the analyzer. To perform a manual trigger, check the Manual Trig button.
Sierra M6‐1 SAS/SATA Protocol Analyzer User Manual
69
LeCroy Corporation
Trigger Setup
Any Trigger Mode
In Any Trigger mode, the Analyzer triggers whenever any of the patterns selected for triggering occurs (an OR condition). The procedure for selecting trigger parameters is identical to that for selecting capture parameters. All items selected for triggering appear in the Project Tree.
To define patterns for triggering, check the Pattern button in the Trigger dialog.
Figure 2.39: SAS: Select Patterns for Trigger
The SAS Parameters window displays the following trigger pattern categories:
70 Timer
Timeout
External Trigger
Bus Condition
Symbol
Primitive
STP Frame
ATA Command
ATAPI
Address Frame
SMP Frame
SSP Frame
SCSI Command
Data Pattern
Protocol Errors
Sierra M6‐1 SAS/SATA Protocol Analyzer User Manual
LeCroy Corporation
Trigger Setup
The SATA Parameters window displays the following trigger pattern categories:
Timer
Timeout
External Trigger
Bus Condition
Symbol
Primitive
FIS
FIS Pattern
ATA Command
ATA Command Pattern
ATAPI
Soft Reset
Data Pattern
Protocol Errors
Note: In packet view, you can right‐click on any frame, select Add to Trigger, and add the pattern to DataPatternCapture to make it a trigger pattern. Choosing a Parameter
Either highlight the category and click the Add>> button, or double‐click the category, to open a corresponding definition dialog.
To remove an item, highlight it in the Project Tree, then click the <<Remove button.
Triggering on a Timer
Selecting a timer for a trigger in the Any Trigger Mode limits the time that the analyzer looks for selected triggering conditions before triggering. The timer activates when the Project runs. If none of the selected triggering conditions occurs during the timer’s active time, the Analyzer triggers at the end of the time set for the timer.
You can set a timer independently of any other trigger selection, to cause an unconditional trigger after a set time.
To set the timer value, double‐click Timer in the Pattern window to open the Timer dialog.
Figure 2.40: Timer Dialog
Check a Time Unit, enter the Timer Value, and click OK.
Sierra M6‐1 SAS/SATA Protocol Analyzer User Manual
71
LeCroy Corporation
Trigger Setup
Timeout
Selecting Timeout for the pattern opens the Timeout Pattern dialog.
Figure 2.41: Timeout Dialog
"Start Events" starts the timer in Timeout Trigger and "End Events" triggers the analyzer (if first trigger mode is selected) or resets the trigger (if second trigger mode is selected). Repetitions of the Start Events are ignored until the End Event is encountered or the timer expires.
Select a pattern for Start Events or End Events, enter a Timeout value, then select Trigger Mode:
If End Events occur before timer expires
If timer expires before End Events
Note: You cannot select a Timeout pattern if you select any other pattern as the trigger condition.
72 Sierra M6‐1 SAS/SATA Protocol Analyzer User Manual
LeCroy Corporation
Trigger Setup
External Trigger
You can trigger on an external trigger. To set up the trigger, click the External Trigger category.
Figure 2.42: External Trigger Dialog
You cannot select an External Trigger Setting, so click OK.
Bus Condition
Double‐click Bus Condition in the Pattern window to open the Bus Conditions dialog.
Figure 2.43: SAS: Bus Conditions Dialog
SAS vs. SATA: SATA Dialog separates the COMINIT and COMRESET check boxes and replaces COMWAKE with Host COMWAKE and COMSAS with Device COMWAKE. Check Conditions on which to trigger, then click OK.
Note: You can define triggering for specific ports by checking or unchecking Port IDs. Sierra M6‐1 SAS/SATA Protocol Analyzer User Manual
73
LeCroy Corporation
Trigger Setup
Symbol
Double‐click Symbol in the Pattern window to open the Symbol dialog.
Figure 2.44: Symbol Dialog
Choose a symbol type by checking either the K Symbol or D Symbol option, then click the down arrow in the Symbol dropdown list, choose a symbol to trigger on, and click OK. Note that the D Symbol choice does not have a down arrow. Primitive
Double‐click Primitive in the Pattern window to open the Primitive dialog.
Figure 2.45: SAS: Primitive Dialog
SAS vs. SATA: SATA Dialog has no radio buttons and has different drop‐down options.
Click the down arrow next to the Primitive dropdown list, scroll the list to choose a primitive on which to trigger, and click OK. Note: Check the box to the right of the Primitive Type to use the logical NOT.
74 Sierra M6‐1 SAS/SATA Protocol Analyzer User Manual
LeCroy Corporation
Trigger Setup
Figure 2.46: SAS: Primitive Selection Choices
SAS vs. SATA: SATA Dialog has different choices.
ATA Command
Double‐click ATA Command in the Pattern window to open the ATA Command Pattern dialog.
Figure 2.47: SAS: FIS Pattern Dialog
SAS vs. SATA: SATA Dialog has different dropdown options.
Click the down arrow next to the Command dropdown list, scroll the list to choose a command to trigger on, and click OK.
Sierra M6‐1 SAS/SATA Protocol Analyzer User Manual
75
LeCroy Corporation
Trigger Setup
A powerful triggering choice is Any Command, which causes the analyzer to trigger on any ATA command.
ATAPI
Double‐click ATAPI in the Pattern window to open the ATAPI Pattern dialog.
Figure 2.48: SAS: ATAPI Pattern Dialog
SAS vs. SATA: SATA Dialog has different dropdown options.
Click the down arrow next to the CDB dropdown list, scroll the list to choose a CDB Type, and click OK.
76 Sierra M6‐1 SAS/SATA Protocol Analyzer User Manual
LeCroy Corporation
Trigger Setup
Data Pattern
Double‐click Data Pattern in the Pattern window to open the Data Pattern dialog.
Figure 2.49: SAS: Data Pattern Dialog
SAS vs. SATA: SATA Dialog shows Port at the top and does not show SSP or STP.
Define the data pattern for triggering and click OK.
Note: When entering the data pattern in the “Data” section of this screen, if you are reading the data pattern from a recorded trace, you must reverse the order of the bytes listed for each DWORD entered. For example, if you want to trigger on “00 01 02 03” (as displayed in the trace), you must enter this DWORD pattern as “03 02 01 00”.
Sierra M6‐1 SAS/SATA Protocol Analyzer User Manual
77
LeCroy Corporation
Trigger Setup
Protocol Errors
Double‐click Protocol Errors in the Pattern window to open the Protocol Errors dialog.
SAS: Protocol Errors Dialog
SAS vs. SATA: SATA Dialog shows Port and does not show SSP, SMP, or STP radio buttons.
Check the protocol error(s) to trigger on and click OK.
78 Sierra M6‐1 SAS/SATA Protocol Analyzer User Manual
LeCroy Corporation
Trigger Setup
STP Frame (SAS only)
Double‐click STP Frame in the Pattern window to open the STP Frame dialog.
Figure 2.50: SAS: FIS Pattern Dialog
SAS vs. SATA: Not available in SATA.
Click the down arrow next to the FIS type dropdown list, scroll the list to choose an FIS type on which to trigger, and click OK.
Sierra M6‐1 SAS/SATA Protocol Analyzer User Manual
79
LeCroy Corporation
Trigger Setup
Address Frame (SAS only)
Double‐click Address Frame in the Pattern window to open the Address Frame Type Pattern dialog.
Figure 2.51: SAS: Address Frame Type Pattern Dialog
SAS vs. SATA: Not available in SATA.
Click the down arrow next to the Address Frame Type dropdown list, scroll the list to choose an address frame type on which to trigger, and click OK.
80 Sierra M6‐1 SAS/SATA Protocol Analyzer User Manual
LeCroy Corporation
Trigger Setup
SMP Frame (SAS only)
Double‐click SMP Frame in the Pattern window to open the SMP Frame Pattern dialog.
Figure 2.52: SAS: SMP Frame Pattern Dialog
SAS vs. SATA: Not available in SATA.
Click the down arrow next to the SMP Frame Types dropdown list, then scroll the list to choose an SMP frame type on which to trigger.
Then click the down arrow next to the Function dropdown list, choose a function, and click OK.
Sierra M6‐1 SAS/SATA Protocol Analyzer User Manual
81
LeCroy Corporation
Trigger Setup
SSP Frame (SAS only)
Double‐click SSP Frame in the Pattern window to open the SSP Frame Type dialog.
Figure 2.53: SAS: SMP Frame Type Dialog
SAS vs. SATA: Not available in SATA.
Click the down arrow next to the SSP Frame Type dropdown list, scroll the list to choose an SSP frame type on which to trigger, and click OK.
82 Sierra M6‐1 SAS/SATA Protocol Analyzer User Manual
Trigger Setup
LeCroy Corporation
SCSI Command (SAS only)
Double‐click SCSI Command in the Pattern window to open the SCSI Command Pattern dialog.
Figure 2.54: SAS: SCSI Command Pattern Dialog
SAS vs. SATA: Not available in SATA.
Click the down arrow next to the CDB dropdown list, scroll the list to choose a CDB Type, and click OK.
Sierra M6‐1 SAS/SATA Protocol Analyzer User Manual
83
LeCroy Corporation
Trigger Setup
FIS (Frame Information Structure) (SATA only)
Double‐click FIS to open the FIS Type selection dialog.
Figure 2.55: SATA: FIS Type Dialog
SAS vs. SATA: Not available in SAS.
Click the down arrow next to the Type drop‐down list box, choose a FIS type on which to trigger, and click OK. Repeat for additional types.
Available FIS Types:
Register Host to Device
Register Device to Host
Set Device Bit
DMA Activate
Any Type
DMA Setup
BIST
PIO Setup
Data
Note: You cannot trigger on a Vendor FIS.
84 Sierra M6‐1 SAS/SATA Protocol Analyzer User Manual
Trigger Setup
LeCroy Corporation
FIS Pattern (SATA only)
Double‐click STP Frame to open the FIS Type selection dialog.
Figure 2.56: SATA: FIS Type Dialog
SAS vs. SATA: Not available in SAS.
The FIS Pattern dialog opens with the default FIS Type Register Host to device. To choose another available FIS Type, click the down arrow next to the FIS Type list box.
Figure 2.57: SATA: FIS Pattern Dialog Choices
SAS vs. SATA: Not available in SAS.
Choose an FIS Type and complete the corresponding dialog.
Sierra M6‐1 SAS/SATA Protocol Analyzer User Manual
85
LeCroy Corporation
Trigger Setup
ATA Command Pattern (SATA only)
Double‐click ATA Command to open the ATA Command Pattern selection dialog.
Figure 2.58: SATA: ATA Command Pattern Dialog
SAS vs. SATA: Not available in SAS.
Click the down arrow next to the Command list box, choose an ATA command, and click OK.
Soft Reset (SATA only)
Double‐click Soft Reset to open the Soft Reset dialog.
Figure 2.59: SATA: Soft Reset Dialog
SAS vs. SATA: Not available in SAS.
86 Sierra M6‐1 SAS/SATA Protocol Analyzer User Manual
LeCroy Corporation
Trigger Setup
Sequential Trigger Mode
In Sequential Trigger mode, triggering occurs whenever the system detects a specific sequence of patterns. Defining the triggering patterns sets the sequence order. You must define at least two patterns to enable selection of Sequential Trigger mode.
Note: Patterns, such as Primitives and Symbols or Frames, occurring very close together on different ports, cause an error in triggering.
To define a triggering sequence, select more than one pattern, then check the Define Sequential Trigger Mode check box.
Figure 2.60: SAS: Select Sequential Trigger Mode
SAS vs. SATA: SATA Dialog has different patterns.
Timer
The sequential triggering mode offers the option of triggering on a timer or inserting a timer in the triggering sequence to delay detection of the next pattern in the sequence. To insert a timer in the trigger list, double‐click Timer to open the Timer dialog.
Figure 2.61: Timer Dialog
Enter a Timer Value, choose the Time Unit, and click OK.
Sierra M6‐1 SAS/SATA Protocol Analyzer User Manual
87
LeCroy Corporation
Trigger Setup
Defining Patterns
The definition of patterns for the sequential trigger mode is identical to the Any Trigger mode, with the following exception: In sequential triggering mode, the definition dialogs for the triggering patterns enable the setting to count the number of occurrences. This allows you to specify the number of times that the pattern must occur before triggering or proceeding in the trigger sequence.
Figure 2.62: Number of Occurrences
Note: The events on each link are counted independently, causing a trigger whenever the number of occurrences on any link equals the specified value.
Triggering Order
As triggering patterns are defined and added, they are displayed in the Project Tree sequentially in the order that they were entered under the Trigger category. When the project runs, the analyzer detects the occurrence of each pattern in order and triggers on the last one.
You can re‐order the sequence of triggering patterns. To change the sequence order, highlight a trigger pattern and use the Up or Down arrow to move it to a new position.
Figure 2.63: Triggering Order
88 Sierra M6‐1 SAS/SATA Protocol Analyzer User Manual
LeCroy Corporation
Trigger Setup
Pre-Trigger
You can set the amount of data to capture before and after the trigger, as a
percentage of pre‐trigger, between 1% and 99%. Position the pre‐trigger slider to a percentage. This feature allows the evaluation of bus activity leading up to and after the triggering event. Figure 2.64 illustrates the operation of pre‐trigger in data memory.
Pre‐trigger data is capture of the specified percentage of data prior to the triggering event. It cannot be guaranteed and may be 0. This can occur when the triggering event occurs before storing the required amount of pre‐trigger event data. In such a case, the data display shows fewer than the specified data points prior to the triggering event.
Figure 2.64: Pre-Trigger Example, 20% Pre-Trigger
Sierra M6‐1 SAS/SATA Protocol Analyzer User Manual
89
LeCroy Corporation
Project Settings
Project Settings
To set project options, click the Settings tab.
Figure 2.65: SAS: Setting Project Options
SAS vs. SATA: For the ALIGN Transmission Period section, SATA Dialog shows options 256 and 258, and does not show 2048 or 2049.
For Speed, SATA Dialog shows H1, D1 to H2, D2 and does not show I1, T1 to I2, T2.
SATA Dialog does not show MUX Setting button.
90 Sierra M6‐1 SAS/SATA Protocol Analyzer User Manual
LeCroy Corporation
Project Settings
Memory Settings
The Trace Memory Status section has the following fields.
Trigger Position
Pre‐Trigger defaults to 50%, which defines the percentage of data to capture before and after the triggering event. You can change this percentage by dragging the slider.
Capture of the specified percentage of the data prior to the triggering event cannot be guaranteed and may be 0. This can occur if the triggering event occurs before storing the required amount of pre‐trigger event data. In such a case, the data display shows fewer than the specified data points prior to the triggering event. For more detail, See “Pre‐
Trigger” on page 89..
Note: Trigger Position only works when the triggering option is Pattern.
Sample File Name
Click the ellipses next to the Sample File Name text box and choose a file name and location for the results of your current project.
Auto Run
To repeat the current capture and trigger setup automatically, check the Auto Run checkbox and enter the number of times in the Number of Run text box. The capture and trigger repeat automatically for the specified number of times, and the results are saved in consecutively numbered Sample.scs files.
Memory Size
In the Protocol Analyzer Settings tab, you can allot memory for the trace recording. Check Entire Memory to allow recording to use the whole memory, to capture the maximum amount of trace data. (Minimum size of memory is 2 GB. Maximum size of memory is 16 GB.)
Partial Memory
To reduce the memory size, check Partial Memory and enter a buffer size in kilobytes, up to the memory size in megabytes.
Note: If the size of a data packet exceeds the buffer memory allocation, the project runs, but no data capture occurs. You must increase buffer memory size to a value greater than the packet size.
Segmented Memory
Alternatively, you can use Segmented Memory. Enter an integer # of Segment, from 1 to 32, then enter an integer Segment Size in kilobytes, up to the memory size in megabytes divided by the number of segments. The default segment size is 10 MB. Each time a trigger condition occurs, the system records a new segment. You can use a Snapshot or Pattern trigger, but not Manual Trigger. As the same trigger automatically repeats, the system makes the number of segments that you entered.
Sierra M6‐1 SAS/SATA Protocol Analyzer User Manual
91
LeCroy Corporation
Upload Manager
Upload Manager
To upload segments manually in the Upload Manager, select the Don’t upload segments and open upload manager automatically checkbox.
To upload segments automatically for display as the system creates them, do not select the checkbox.
To view segmented trace files, click the Upload Manager button, to display the Upload Manager dialog.
button, beside the Record Figure 2.66: Upload Manager Dialog
The dialog displays the segments in the format Segment1, Segment2, and so on.
Select segments by clicking the checkbox. You can also Select All or Deselect All segments.
You can Upload segments for display, Save segments as sample files, and Delete segments.
The Preview radio button allows a preview of an integer number of megabytes around the trigger position. You can set the trigger position as a percentage and select the segment number. Click the radio button to Show Traffic Summary with the preview. To show the preview, click the Preview button.
92 Sierra M6‐1 SAS/SATA Protocol Analyzer User Manual
LeCroy Corporation
Analyzer Settings
Analyzer Settings
Primitive Response Timeout
The Primitive Response Timeout parameter specifies the number of DWORDs between two pair primitives after which the analyzer detects a protocol error. Default value is 65000. When host or device sends a primitive, such as X_RDY, HOLD, or WTRM, it expects device or host to reply with a primitive, such as R_RDY, HOLDA, or R_OK. This parameter detects FIS Signaling Latency error, between HOLD and HOLDA, and FIS State Transition error, between X_RDY and R_RDY, between SOF and EOF, or between WTRM and R_OK or R_ERR.You can set a trigger on these protocol errors.
Disable Scrambling
If checked, causes the Analyzer to assume that no traffic is scrambled. By default, the Analyzer assumes the scrambling state of the devices under test Show XXXX value
Check this option to display XXXX values.
ALIGN Transmission Period (differs for SAS and SATA)
Choose the ALIGN Transmission Period for SSP and STP by clicking the corresponding option button, then open the Protocol Error Mask dialog.
Protocol Error Mask
Click the Protocol Error Mask button to open the Protocol Error Mask dialog.
Figure 2.67: Protocol Errors Dialog
Check the Protocol Errors that you want the Analyzer to ignore.
Sierra M6‐1 SAS/SATA Protocol Analyzer User Manual
93
LeCroy Corporation
Analyzer Settings
When “RD Error” and “Code violation Error” are set as trigger events:
“RD Error” or “Code violation Error” can occur right after the OOB sequence.
“RD Error” or “Code violation Error” can occur right after the recovery from the PM state.
These errors are mainly caused by the long synchronization time of the analyzer. If these errors, caused by the Analyzer, become triggers, you cannot detect some other errors that you really need to detect. To NOT detect the above two errors, enable the software setting Disable ‘Disparity Error’ and ‘Symbol Violation’ during Speed negotiation. After this, the code violation is not triggered during the speed negotiation phase, but is triggered if the violation happens after the speed negotiation phase. External Trig Out Setting
The Analyzer can send a Low or High external signal anytime a trigger occurs. Select the External Trig Out Setting: High Active, Low Active, or Toggle from High to Low or Low to High once (3.3 V output).
Enter the External TrigOut pulse width.
External Trig In Setting
An external Low or High input signal can cause triggering. Select the External Trig In Setting: High Active, Low Active, or Toggle from High to Low or Low to High once (3.3 V output).
Choose Port Speed
The default speed is Autospeed. You can also select the port speed from the
drop‐down list: 1.5 Gbps, 3.0 Gbps, or 6.0 Gbps.
Note: If a Port ID check box has no check, the analyzer does not capture any patterns for that port. The system allocates trace memory for that port to its adjacent port, for example: I1, T1 <‐> I2, T2.
94 Sierra M6‐1 SAS/SATA Protocol Analyzer User Manual
LeCroy Corporation
Ports Configuration
Ports Configuration
Select the Port Configuration button to display the Set Port Configuration dialog.
Figure 2.68: SAS: Set Port Configuration Dialog
The dialog shows the current port configuration. To select a port configuration, click the down arrow to display the Select Port Configuration dialog. Figure 2.69: SAS: Select Port Configuration Dialog
Sierra M6‐1 SAS/SATA Protocol Analyzer User Manual
95
LeCroy Corporation
Ports Configuration
Port configuration depends on the application you run.
To act as Analyzer, select the Analyzer port configuration.
To activate the InFusion on a port, select Jammer.
Note: To display the current Port Configuration, click the green button in the lower right corner to display the Port Status window (see “Port Status” on page 191).
Port Configuration and Projects
Port Configuration depends on Project selected. Performance Analyzer and Performance Analyzer with Initiator Emulator do not use ports. Protocol Analyzer, Protocol Analyzer with Initiator Emulator, and Target Emulator can have the following port configurations.
Project
Protocol Analyzer
Protocol Analyzer
with Initiator Emulator
Target Emulator
Number
One analyzer and/or one emulator
Port 1.
Port 1.
Pair on Port 1.
Port 1.
Pair on Port 1
Analyzers work with Emulators, Jammer, and Trainer (see below).
One Initiator Emulator can work by itself or work with one Analyzer.
One Target Emulator can work by itself or work with one Analyzer.
Emulators do not work with Trainer. Emulators work with Jammer (see below). Jammer can pair with one analyzer on a port.
Jammer does not work with Trainer.
Trainer can pair with one analyzer on a port.
Trainer does not work with emulators. Trainer does not work with Jammer. 96 Sierra M6‐1 SAS/SATA Protocol Analyzer User Manual
Ports Configuration
LeCroy Corporation
MUX Setting (SAS only)
Enable Muxing on port combinations.
Figure 2.70: MUX Setting Dialog Box
If you enable this option on two ports, the data of both ports transfers on one physical link, whose speed is twice the speed of each link, and the data of two links multiplexes on one physical link. For example, two 3 G ports together make one 6 G port. Note the following:
The muxing check boxes are usable only if two or more emulator channels are selected.
The initiator emulator check box is greyed out if only one emulator channel is selected.
Figure 2.71: Initiator Emulator Check Box and Channel Speeds
The target emulator check box is not displayed at all until two or more emulator channels are selected.
Figure 2.72: Target Emulator Check Box and Channel Speeds
Sierra M6‐1 SAS/SATA Protocol Analyzer User Manual
97
LeCroy Corporation
Advanced Mode (User‐Defined)
Note: Analyzer must detect MUX primitives from both host and device sides to capture traffic correctly in Muxing mode.
Add a Project Note
To enter and save information about the current project, click the Notes tab and enter the data about the project.
Figure 2.73: Project Notes Tab
Advanced Mode (User-Defined)
Advanced Mode expands Analysis capability by allowing you to program complex triggering and data capture projects.
Note: The Advanced Mode option has to be purchased separately.
The Advanced Mode is a state machine with up to 23 different states. You can program each state individually to:
Trigger on a different event or trigger unconditionally.
Capture Everything, Nothing, or a user‐defined pattern.
Include up to three ELSE IF statements, allowing a jump to any other state based on a user definition.
Use up to three timers, which you can set to a maximum value of 42949 ms. You can set a timer in the state or continue the timer set in the previous state.
Output an external trigger High or Low.
Note: In Advanced Mode, events on each link are counted independently. A condition is met if the number of events on a link equals the defined occurrence.
98 Sierra M6‐1 SAS/SATA Protocol Analyzer User Manual
LeCroy Corporation
Advanced Mode (User‐Defined)
Working in Advanced Mode
To start working in the Advanced Mode, click the Easy, Switch to Advanced Mode button in an open Analyzer window.
You can:
Display the state definition
Set Output Trigger level
Select up to three timers
Define the If condition and up to three Else If conditions
Set number of occurrences before trigger
Set captured data
Set excluded data
Go to next state
Add state
Choose link for Sequencer setup
Figure 2.74: SAS: State Programming Dialog
Sierra M6‐1 SAS/SATA Protocol Analyzer User Manual
99
LeCroy Corporation
Advanced Mode (User‐Defined)
Figure 2.75: SATA: State Programming Dialog
SAS vs. SATA: SATA Dialog removes Exclude ALIGN, Exclude RRDY, and Exclude NOTIFY.
SATA Dialog replaces Exclude SATA_CONT with Exclude CONT and Exclude SATA_SYNC with Exclude SYNC.
SATA Dialog has patterns Bus Condition, Primitive, FIS, FIS Pattern, Data Pattern, and Protocol Errors and does not have STP Frame, SMP Frame, STP Frame, or Address Frame.
Figure 2.76: SAS: Advanced Trigger with multiple branches
100 Sierra M6‐1 SAS/SATA Protocol Analyzer User Manual
Advanced Mode (User‐Defined)
LeCroy Corporation
State Number for Complex Trigger Sequences
To follow the path of complex trigger sequences, you can display state number. To see state number, in Packet View right‐click a link layer packet, show field, and select state number.
Setting Trigger Conditions
To set the If and Else If trigger condition:
1. Click the Add Pattern button
from the drop‐down list.
for a Pattern field and choose a trigger condition Figure 2.77: SAS: Choosing a Trigger Condition
2. Define each selected pattern in the same way as in Easy Mode, as described starting on page 56. To use a timer, define it first.
Note: You can set a timer for any If or Else If condition.
3. Enter a value for the number of occurrences before trigger in the Cont field, up to a maximum of 65535 occurrences.
4. Choose a capture option: Everything, Nothing, or Pattern.
5. If you choose Pattern, you can select patterns for inclusion or exclusion. Clicking the Pattern option enables a pattern definition dialog.
Figure 2.78: SAS: Choosing a Pattern
Sierra M6‐1 SAS/SATA Protocol Analyzer User Manual
101
LeCroy Corporation
Advanced Mode (User‐Defined)
6. Choose pattern(s) and click the +>> button to add them for capture or exclusion. You define each pattern the same way as in Easy mode (see “Defining Patterns” on page 56).
7. For an output trigger, click the down arrow in the Ext. Out field and choose an output trigger level. Note: Do not use the LOW setting in Advanced Mode.
8. To go to another state, click the down arrow in the Go To field and select a state. If no other state has been defined, choose New State to add a state.
Set Timers
You can set and use up to three timers for triggering. You can set each timer for each state or continue from a timer set in the previous state. The timer defined for a particular state starts when entering that state. To set timers, click the ellipses in the Timer field in each state and define each of the timers in the Set Timers dialog.
Figure 2.79: Set Timers Dialog
Note: Three timers are available. You have to set and start each timer in order to continue the next timer. For example, you have to start Timer 1, continue it, then set Timer 2 in order to continue it. It will not allow you to continue Timer 2 until you first set it.
102 Sierra M6‐1 SAS/SATA Protocol Analyzer User Manual
LeCroy Corporation
Advanced Mode (User‐Defined)
Timeout
You can set a Timeout. Select a Pattern for the Start Event. (Start Event resets the timer.)
Select a Pattern for the End Event. Enter the Timeout Value in milliseconds or microseconds.
Select a Trigger Mode:
If End Event occurs before timer expires.
If timer expires before End Event occurs.
Figure 2.80: Timeout Dialog
WARNING: In Advanced Mode, Short State Jump Intervals Can Cause Hardware Queue Overflow and Corrupt Frames.
When using Advanced Mode, if too many state jumps occur in a short time, the hardware queue can overflow, which may corrupt frames. For example, an infinite loop can cause many state jumps in a short time. Hardware overflow can occur if interval between state jumps is less than 60 DWORDs.
In Advanced Mode, infinite loops are usually used to check if an event occurs before a timeout. In this case, you can use the Timeout dialog to avoid hardware queue overflow.
Sierra M6‐1 SAS/SATA Protocol Analyzer User Manual
103
LeCroy Corporation
Advanced Mode (User‐Defined)
Figure 2.81: State Machine with Multiple Patterns and Timer Elapse
In Figure 2.81: , the port detects HARD_RESET, which starts the Timer. When the timer expires, it jumps to another state. If a trigger occurs between timer start and end, the captured trace will have corrupt frames because of hardware queue overflow. Figure 2.82: State Machine with Timeout Pattern to replace Timer
To overcome this limitation, use a Timeout Pattern instead of Timer. Figure 2.82 shows the state machine using Timeout instead of Timer. Figure 2.83 shows the Timeout settings.
104 Sierra M6‐1 SAS/SATA Protocol Analyzer User Manual
LeCroy Corporation
Advanced Mode (User‐Defined)
Figure 2.83: Timeout Settings
Timeout begins when the port detects the Start Event. Timer begins when the port detects the Hard RESET primitive. In the Trigger Mode window, set the Trigger to trigger when the port detects the End Event, before the Timeout occurs. In our example, this is the Bus Condition. Capture begins when the ports detects the Bus Condition before the Timeout occurs. If the port does not detect the Bus Condition until the Timeout occurs, the State Machine in Figure 2.82 jumps to State 0. Useful Key Sequences
The following key sequences are active to assist you in navigating a defined state machine:
Ctrl+a
Insert
Del
Ctrl+c/Ctrl+Ins
Ctrl+v/Shift+Ins
Up/Down arrow keys
Page Up/Page Down
Home
End
Sierra M6‐1 SAS/SATA Protocol Analyzer User Manual
Add State
Insert State
Delete State
Copy
Paste
Moves selection between states
Page Up and Page Down states
Go to first page
Go to end page
105
LeCroy Corporation
Project Settings
Project Settings
Prior to running the Advanced mode project, click the Settings tab. The options in the Settings dialog are the same as for the Easy Mode, described starting on page 90.
SAS vs. SATA: For the ALIGN Transmission Period section, SATA Dialog shows options 256 and 258, and does not show 2048 or 2049.
For Speed, SATA Dialog shows H1, D1 to H2, D2 and does not show I1, T1 to I2, T2.
SATA Dialog does not show MUX Setting button.
Notes
To include some descriptive information about the project, click the Notes tab and enter a brief descriptive note (see “Add a Project Note” on page 98).
Creating a Data Block
You can create the following types of data blocks, for use with data fields:
Random data pattern
Custom data pattern specifically for your application
Counter data pattern
Walking bit pattern
To create a data block, click the Default Data Block button on the Main toolbar, or select Setup > Data Block to open the Data Block dialog box as shown in Figure 2.84.
Figure 2.84: Default Data Block Dialog Box
106 Sierra M6‐1 SAS/SATA Protocol Analyzer User Manual
LeCroy Corporation
Creating a Data Block
To add another data block:
1. Click the New button in the Data Block dialog box.
Figure 2.85: New Data Block Dialog Box
2. Choose the number of data columns (up to 16 data cells/row) and the cell length (up to 16 bytes/cell). This is a display function only.
3. Click either the Bin, Hex, or Ascii option button to choose a number format.
4. Click either the LSB or MSB option button to choose a bit order.
Naming a Data Block
Each new data block automatically receives a sequential data block number. To assign a unique descriptive name to a data block, right‐click the data block name to open the Data Block Edit menu.
Figure 2.86: Data Block Edit
Sierra M6‐1 SAS/SATA Protocol Analyzer User Manual
107
LeCroy Corporation
Creating a Data Block
Choose Rename.
Figure 2.87: Rename Data Block
Enter a descriptive name in the New Name edit box and click OK.
Editing a Data Block
You can enter data in the defined cell structure by these methods:
Define your own pattern
Set a counter
Choose a Random Pattern
Choose a Walking Bit Pattern
Define Your Own Pattern
To define a pattern:
1. Click Pattern to open the Define Pattern dialog box as shown in Figure 2.88: 2. Enter a data pattern in the Data Pattern edit box.
3. Choose the number of times to repeat that pattern, and click OK.
Figure 2.88: Define Your Own Data Pattern
108 Sierra M6‐1 SAS/SATA Protocol Analyzer User Manual
LeCroy Corporation
Counter
Address
The cell address starts at 0 for the first data entry and automatically increments to the next available address. You can set it to a previously defined address to modify its content or insert additional data.
Insert/Overwrite Data
To define whether to overwrite data in a previously defined cell or insert new data after that cell, toggle the Insert/Overwrite button.
Save
When you have completed a data block definition, click the Save button to save the newly created data block. Counter
To use a counter as data, click the Counter button, enter a Starting Number for the counter and the data address to count to, and click OK.
Figure 2.89: Set Counter as Data
Sierra M6‐1 SAS/SATA Protocol Analyzer User Manual
109
LeCroy Corporation
Counter
Random Data Pattern
To use a random data pattern, click the Random button, enter the number of times to repeat the pattern, and click OK.
Figure 2.90: Choose a Random Pattern
Walking Bit Pattern
To use a walking bit pattern, click the Walking Bit button, then choose either a walking bit of “0” or “1”, the walk direction, the start position, and the number of times to repeat the pattern.
Figure 2.91: Define a Walking Bit Pattern
110 Sierra M6‐1 SAS/SATA Protocol Analyzer User Manual
LeCroy Corporation
Counter
Creating and Editing Data Blocks as Text
You can create and edit data blocks using a text editor such as Windows® Notepad. To create a data block in Notepad, launch Notepad. Enter a header consisting of [Item1, Item2, Item3, Item4, Item5] where:
Item1 is the name of the Data Block.
Item2 is the size of the Data Block or the number of bytes in the format.
Item3 is the format of the data (HEX, BIN, ASCII).
Item4 is the group of bytes defined (1, 2, 4, 8 or 16).
Item5 is the direction (LSB or MSB).
Then enter the data in space delimited Hex format and save as a *.txt text file.
Load Data
To import Text Editor created data, click the Load button in the data block definition dialog to open the Load dialog. Choose a file and click Load. Modify existing data.
Save As
To create a new data block from an existing data block using a text editor, select the data block to edit from the Data Block Name list, then click Save As to open the Save As dialog.
Assign a name to the new data block text file and click Save.
You can now edit the newly created text file using Notepad or any other text editor, then import it into the data block definition, as described above.
Sierra M6‐1 SAS/SATA Protocol Analyzer User Manual
111
LeCroy Corporation
112 Counter
Sierra M6‐1 SAS/SATA Protocol Analyzer User Manual
Chapter 3
Display Manipulation
Viewer Display
After data is captured (Recorded), the Viewer displays a sample file (.scs for SAS and .sts for SATA) in Packet View.
Figure 3.1: SAS: Packet View of .scs Sample File
Sierra M6‐1 SAS/SATA Protocol Analyzer User Manual
113
LeCroy Corporation
Viewer Display
Figure 3.2: SATA: Packet View of .sts Sample File
Quick View
By default, the Software Settings enable Quick View. Quick View allows full access to the whole trace more quickly, especially when using a Gigabit Ethernet connection. However, the trace is NOT written to the Host PC hard drive. To save the trace, you must manually click Save. If you uncheck Quick View in the Software Settings to disable Quick View, the trace loads more slowly, but is automatically saved to the Host PC hard drive. When Quick View is disabled, the Viewer displays successive parts of trace data as they upload. As soon as a trace part uploads, it is available in all trace views. If you only need quick successive traces, and do not need to save them, keep the default setting to enable Quick View.
If you need to save all captured traces, unchecking the Quick View setting loads traces faster, especially for larger traces and slower connections than Gigabit Ethernet.
To refresh the viewer display with more uploaded data, scroll to the end of the trace, using scroll bars, page down, arrow down, or CTRL‐End. Newly uploaded data then appears there.
Note: High‐level decoding and statistics are available only after the whole trace has uploaded.
The software automatically switches to full trace view after trace uploading finishes.
Note: Users must press CTRL Home to go to the beginning of an uploaded trace, and CTRL End to go to the end of an uploaded trace.
114 Sierra M6‐1 SAS/SATA Protocol Analyzer User Manual
LeCroy Corporation
Trace Properties
Using the Viewer Display
To configure the data viewer display, use the toolbars. You can display the same data in:
Packet view
Spreadsheet view
Column view, with transactions grouped for each active port
Text view, with transactions grouped for each active port
Waveform view
Field List view
Histogram view
Bus Utilization view
Data Report
Statistical Report view
To change the view type when opening a sample, change the default workspace or save options in the Software Settings dialog.
To toggle among open windows, use CTRL ‐ TAB.
To reverse toggle order, use CTRL ‐ SHIFT ‐ TAB.
To make a frame a trigger pattern, in Packet View, right‐click any frame, select Add to Trigger, and add the pattern to DataPatternCapture. Viewer Display enables you to also perform the following:
Decode Assignments (Refer to “Decoding Assignments” on page 118 for more details.)
Compare Two Data Payloads (Refer to “Compare Two Data Payloads” on page 158 for more details.)
Run Verification Scripts (Refer to “Running Verification Script Engine (VSE)” on page 159 for more details.)
Trace Properties
The Trace Properties dialog displays:
Software version
Sample file version
Grouping Type
Hardware bin file version
Analyzer armed at
Analyzer triggered at
Sample saved at
Original Capture Project: Open displays the project settings used to capture the sample.
Licensing Information
Sierra M6‐1 SAS/SATA Protocol Analyzer User Manual
115
LeCroy Corporation
Analysis
Figure 3.3: Trace Properties Dialog
Analysis
The Analysis menu options allows you to see the trace in various views and switch views.
Show Analysis Toolbar
To display the capture in any of the other available views you can make the selection on the View Type toolbar as shown below or select the menu option under Analysis as shown in Figure 3.5 on page 117.
Decoding Assignments
Show/Hide Histogram View
Show/Hide Column View
Show/Hide Text View
Show/Hide
Waveform View
Show Hide Field List View
Show/Hide Spreadsheet View
Show/Hide Packet View
Data Report
Show/Hide Bus
Utilization View
Compare 2 Data
Payloads
Show/Hide Statistical Report View
Running
Verification Scripts
Figure 3.4: View Type Toolbar
116 Sierra M6‐1 SAS/SATA Protocol Analyzer User Manual
LeCroy Corporation
Analysis
Figure 3.5: SAS Analysis Menu
Figure 3.6: SATA Analysis Menu
Sierra M6‐1 SAS/SATA Protocol Analyzer User Manual
117
LeCroy Corporation
Analysis
Decoding Assignments
Click on the Decoding Assignments icon to display the Decoding Assignment dialog. Check a Hash Destination SAS Address checkbox to select it and select a SCSI Spec(s). Click the Add to Assigned List button to decode. Select a spec and click Remove it or click on Remove All to remove all the specs.
Figure 3.7: Decoding Assignments Dialog for SAS
Figure 3.8: ATAPI Assignment Dialog for SATA
Packet View
After you select a view, it appears in a separate window. To increase the new window display size, select View > Packet View or click the button to hide the Packet View.
118 Show/Hide Packet View Sierra M6‐1 SAS/SATA Protocol Analyzer User Manual
LeCroy Corporation
Analysis
When scrolling through a window display using the scroll bar, the displays in the other windows also scroll.
To rearrange the tiling, select the Window menu and choose Cascade, Tile Vertical, or Tile Horizontal.
Packet View Metrics
The Metrics feature provides quick access to additional information about the packet data. Click the Metrics + icon as shown in Figure 3.9 to display the details.
Figure 3.9: Packet View Metrics
The following additional information of the packet is displayed when the Metrics field is expanded. Refer to Figure 3.10 on page 120.
Trp. No. ‐ Number of Transports
The total number of transports that compose this exchange.
Resp. Time ‐ Response Time
The time taken to transmit this command on the link(s) from the begining of the first frame in the command to the end of the last frame in the command.
Pld. Bytes ‐ Payload Bytes
The number of payload bytes this operation transferred.
Latency Time
The time measured from the transmission of the command to the first data transmitted for this IO operation.
Data‐Stat. Time ‐ Data to Status Time
The time between the end of data transmission for this command and the Status frame.
Thrpt MB/s‐ Data Throughput
The payload divided by response time expressed in MB per second.
Duration
The time taken from the first DWord to the last DWord in a line.
Sierra M6‐1 SAS/SATA Protocol Analyzer User Manual
119
LeCroy Corporation
Analysis
Figure 3.10: Packet View Metrics Expanded
Changing the Default View
Perform the following steps to change the default view of all trace files to Packet View: 1. Open a trace file.
2. Select the Packet View. Close all other views.
3. Select File > Save Workspace to open a Save As dialog. Save the current workspace as a .wss file.
4. Select Setup > Preferences > Software Settings to open the Software Settings dialog.
5. In the Default Workspace field, enter the path and name of the workspace .wss file that you saved in step 3.
Because the default workspace contains only Packet View, the software opens trace files in Packet View.
Spreadsheet View
Spreadsheet View displays all of the Packet View fields in a time sequential spreadsheet format. To display the Spreadsheet View of the current capture, click Analysis > Spreadsheet View or click the button on the View Type toolbar.
Figure 3.11: SAS: Spreadsheet View
120 Sierra M6‐1 SAS/SATA Protocol Analyzer User Manual
LeCroy Corporation
Analysis
Figure 3.12: SATA: Spreadsheet View
Right‐click a column heading to go to Software Settings, make all columns the same width, choose Time Stamp Format, or Goto a position. Right‐click a column heading to Hide or Show the column. To show the same columns permanently, select Setup> Preferences>Software Settings> Sample Viewer > As Previous Saved. Right‐click the column to Add Bookmark or Edit Bookmark, Set Time Stamp Origin, go to Software Settings, choose Time Stamp Format, Change Background (or Foreground) Color, or Goto a position.
Note: You can double‐click a data frame to display the data payload view.
The Status column can show ABRT and UNC status.
Save As Text/Excel
Select File > Save As Text/Excel to open the Save As Text dialog. For Save As Type, select Text Files or Excel Files.
For Save As Range, select All Packets or enter a cursor range.
Enter a File Name and click Save.
Note: The Save As Excel option is available only for Column View and Spreadsheet View.
Change Format of Logical Block Address (LBA)
You can set different LBA formats in Packet View and Spreadsheet View. To change the LBA format, right‐click the LBA column to display the popup menu, select Format, and change the format to Decimal, Hexadecimal, or Binary.
In Spreadsheet View, you can also click the Trace Viewer Configuration icon to display the Trace Viewer Configuration dialog. Expand the Frame List/Spread Sheet View, select LBA/Sector#, and change the Format. If you cannot change the format there, select the Link Fields, Transport Fields, ATA Cmd. Fields, or SCSI Cmd. Fields node, select the field (such as “LBA High”), and then change the Format.
Sierra M6‐1 SAS/SATA Protocol Analyzer User Manual
121
LeCroy Corporation
Analysis
Column View
Column View displays the captured data grouped in columns by port. Each row shows captured DWORDs on different ports related to the timestamp. It also shows different speed (1.5G, 3G, 6G) DWORDs. Different DWORD cell height shows the duration of the DWORD. To display Column View of the current capture, click Analysis > Column View or click the
button on the View Type toolbar.
Figure 3.13: SAS: Column View
Figure 3.14: SATA: Column View
Right‐click in the Column View to display commands:
Software Settings
Time Stamp Format (LeCroy Format, Milli Second, Micro Second)
Go to (Trigger Position, X Position, Y Position, Packet Number, Time Stamp, Bookmark, Begin, End)
Bookmark
Goto within Packet (SOF, EOF, Next HOLD, Previous HOLD, Next HOLDA, Previous HOLDA, Next Align, Previous Align, Next R_IP, Previous R_IP)
Note: The Column View displays the CRC value. To see different formats (10b, 8b, scrambled, and so on), select a format by clicking its Tool menu button.
Resize Columns
You can resize the columns in Column View by clicking in the column boundary and dragging the boundary to a new position.
122 Sierra M6‐1 SAS/SATA Protocol Analyzer User Manual
LeCroy Corporation
Analysis
Rearrange Columns
You can rearrange columns by left‐clicking in the column title and then dragging the drag‐
and‐drop icon to a new position.
Save As Text/Excel
Select File > Save As Text/Excel to open the Save As Text dialog. For Save As Type, select Text Files or Excel Files.
For Save As Range, select All Packets or enter a cursor range.
Enter a File Name and click Save.
Note: The Save As Excel option is available only for Column View and Spreadsheet View.
Text View
Text View displays the captured data interpreted as transaction frames, grouped in columns by port.
To display Text View, select Analysis > Text View or click the View Type toolbar.
button on the Figure 3.15: SAS: Text View
Sierra M6‐1 SAS/SATA Protocol Analyzer User Manual
123
LeCroy Corporation
Analysis
.
Figure 3.16: SATA: Text View
Note: The LBA and Tag Number value are shown in the All Lanes column.
Field List View
Whenever an additional view (such as Text View) displays, you can display a Field List View, which displays field information in a list format. The information of this view is shown in the Packet View under the Transport layer. Expand the Info Unit, then expand the Sense Data, refer to the screen capture below. To open a Field List View of the current capture, select Analysis > Field List View or click the button on the View Type toolbar.
Note: This icon will appear in the top tool bar only if the spreadsheet view is displayed.
Figure 3.17: Packet Decode Information
124 Sierra M6‐1 SAS/SATA Protocol Analyzer User Manual
LeCroy Corporation
Analysis
Field List View Displayed in a Separate Window
Click Setup > Software Settings and select the Field List View tab, refer to Figure 3.130 on page 208 to see the default settings of the Field List View dialog. The Show Field List in Column View checkbox is selected as the default setting. In order to view the Field List View in a separate window the Spreadsheet View needs to be open.
Click on the Field List View icon to view it in a separate window as shown in the following figure.
Field List View in a se per ate window
Figure 3.18: Field List View Displayed in a Separate Window
Field List View Embedded in Frame or Spreadsheet Views
Click Setup > Software Settings and select the Field List View tab, refer to Figure 3.135 on page 214 to see the default settings of the Field List View dialog. The Show Field List in Column View checkbox is selected as the default setting. Select the Show Field List as Embedded in frame/spreadsheet views checkbox in order to view the Field List View embedded in the Frame or Spreadsheet View.
Refresh the spreadsheet view to see the Field List View embedded as a column as shown in the following screen capture.
Sierra M6‐1 SAS/SATA Protocol Analyzer User Manual
125
LeCroy Corporation
Analysis
Figure 3.19: Field List View
In the Column View, check the Show Field View in Column View checkbox in the Software Settings dialog under the Setup> Preferences> file menu, then display Field View while the Column View is open. Waveform Display
You can enable a waveform display for all active ports, and perform timing measurements, by positioning timing cursors within the waveform display.
Select View > Wave Form View or click the
Show/Hide Waveform button on the View Type toolbar to enable the waveform display.
The Compact View shows the OOB Sequence with speed negotiation.
Figure 3.20: SAS: Waveform View
126 Sierra M6‐1 SAS/SATA Protocol Analyzer User Manual
LeCroy Corporation
Analysis
Figure 3.21: SATA: Waveform View
Making a timing Measurement
Timing measurements are made with two timing cursors T1 and T2. Click the left mouse button in the gray bar on the top of the waveform display at a point for the T1 cursor, and the right mouse button at a point for the T2 cursor. The time difference between the cursors is on a line connecting the two cursors.
Figure 3.22: SATA: Timing Cursors Enabled
Expanded Waveform View
To see a 10x time scale expansion of the waveform, uncheck the Compact View checkbox in the Waveform View window. The OOB Sequence has speed negotiation (Hardware version 4 or later).
Figure 3.23: SATA: Expanded Waveform View
Sierra M6‐1 SAS/SATA Protocol Analyzer User Manual
127
LeCroy Corporation
Statistical Report
Statistical Report
Whenever a captured sample is in the Sample Viewer, a Statistical Report selection in the Report menu and a Statistical Report Button on the viewer toolbar are enabled. You can create a Statistical Report for the entire capture or select a portion of it.
To display a Statistical Report, click the Statistical Report button on the viewer toolbar or select Analysis > Statistical Report to display the Select Statistical Report Range dialog.
Figure 3.24: Statistical Report Range Dialog
The default statistical report has All Samples. You can set a specific Statistical report range between defined cursor positions or events.
Generating Statistical Read/Write Report
To create a statistical read/write page perform the following steps:
1. Click on the Setup menu option and select Preferences > Software Settings.
2. Click on the Trace Viewer tab.
3. Check the box Create statistical report read/write page.
(see Figure 3.25 on page 129).
128 Sierra M6‐1 SAS/SATA Protocol Analyzer User Manual
LeCroy Corporation
Statistical Report
Figure 3.25: Enabling Read/Write Statistical Report
Note: This settings should be enabled before you capture the trace file. If you have already captured a trace file and want to create a read/write statistical report for the sample, perform the following steps: 1.
2.
3.
4.
5.
Enable the read/write settings as mentioned above.
Open the trace file. Set the X pointer on the first packet in the viewer. Set the Y pointer on last packet in the viewer. Save as the trace file using the X to Y option. Now the saved trace file will contain the read/write statistical report. Report between Cursors
Click the option button next to the From cursor selection drop down list. Then click the From down arrow and choose the 1st cursor, click the To down arrow to choose the 2nd cursor, and click OK. The resulting report has only the capture between the cursors.
Figure 3.26: Report between Cursors
Sierra M6‐1 SAS/SATA Protocol Analyzer User Manual
129
LeCroy Corporation
Statistical Report Content
Report between Events
Click the option button next to the From the event selection dropdown list, click the From down arrow to choose the 1st event, then enter the number of its occurrence. Next click the To down arrow to choose the 2nd event, then enter the number of its occurrence.
Figure 3.27: SATA: Report between Events
Click OK. The resulting report are limited to the capture between the defined events.
SAS vs. SATA: SAS adds Transport, SCSI Cmd, SMP Cmd, and Task Mng to the drop‐down list and deletes FIS and Phy Reset.
Statistical Report Content
SAS: A complete SAS statistical report consists of the following reports, accessed by clicking the corresponding tab in the dialog:
General
Bus Condition
Primitive
SSP Transport
SMP Transport
STP Transport
ATA Command
SCSI Command
SMP Command
Task Command
SAS Address
Read/Write Command
Protocol Error
Performance
Lanes
Others
SATA: A complete SATA statistical report consists of the following reports, accessed by clicking the corresponding tab in the dialog:
130 General
Bus Condition
Primitive
FIS
ATA Command
ATAPI Command
Read/Write Command
Sierra M6‐1 SAS/SATA Protocol Analyzer User Manual
LeCroy Corporation
Statistical Report Content
Protocol Error
Performance
Others
PM Statistic
PM Performance
Note: Results are displayed only for items that have been captured in the sample.
Report Options
Some report categories offer options to display only specific items.These report categories incorporate drop‐down list boxes offering pre‐defined and custom options. For details see “Formatting the Statistical Report View” on page 149.
General Report
To display the General Report, click the General tab. The General Report displays the report data in columns with the following information:
Type: All, Custom, Bus Condition, FIS, Identify Address Frame, Open Address Frame, SMP Frame, SSP Frame, STP Frame
Direction: All, H‐>D, D‐>H, I‐>T, T‐>I, or Custom
Duration: All, Custom, or time unit
Count: All, Custom, or a number of occurrences
%: of total count Figure 3.28: General Statistical Report
Sierra M6‐1 SAS/SATA Protocol Analyzer User Manual
131
LeCroy Corporation
Statistical Report Content
Primitive Report
To display the Primitive Report, click the Primitive tab. The Primitive Report displays information in the following columns:
Primitive: All, Custom, Unknown
For SATA: CONT, EOF, HOLD, HOLDA, R_IP, R_OK, R_RDY, SOF, SYNC, WTRM, X_RDY, ALIGN
FOR SAS: SATA_CONT, SATA_EOF, SATA_R_IP, SATA_R_OK, SATA_R_RDY, SATA_SOF, SATA_SYNC, SATA_WTRM, SATA_X_RDY, ACK, EOF, SOF, EOAF, SOAF, AIP_WAITING_ON_DEVICE,AIP_NORMAL, DONE_NORMAL, READY_NORMAL, CLOSE_NORMAL, OPEN_ACCEPT, ALIGN0, ALIGN1, NOTIFY_ENABLE_SPINUP
Direction: All, H‐>D, D‐>H, I‐>T, T‐>I, or Custom
Count: All, Custom, or a number of occurrences
%: of total count Figure 3.29: Primitive Report
132 Sierra M6‐1 SAS/SATA Protocol Analyzer User Manual
LeCroy Corporation
Statistical Report Content
Bus Condition Report
To display the Bus Condition Report, click the Bus Condition tab. The Bus Condition Report displays information in the following columns.
Bus Condition: All, Custom, Activity On, COMININT/COMRESET, COMSAS, COM‐
WAKE, Keep Alive Activity
Direction: All, H‐>D, D‐>H, I‐>T, T‐>I, or Custom
Count: All, Custom, or a number of occurrences
%: of total count
Figure 3.30: Bus Condition Report
Sierra M6‐1 SAS/SATA Protocol Analyzer User Manual
133
LeCroy Corporation
Statistical Report Content
ATA Command Report
To display the ATA Command Report, click the ATA Command tab. The ATA Command Report displays information in the following columns:
Command: All, Custom, Check Power Mode, Execute Device Diagnostic, Flush Cache, Identify Device, Read DMA Ext, Read FPDMA Queue, Set Feature, Write DMA Ext, Write FPDMA Queue
PM Port
Direction: All, H‐>D, D‐>H, I‐>T, T‐>I, or Custom
Number of FIS: All, Custom, or a number
Payload Size: All, Custom, or a number of DWORDs
Status: All, Custom, Incomplete, Normal Output
Timeout: such as All, Custom, N/A, Yes and No (see “Time out of ATA Command Report” on page 134)
Duration: All, Custom, or time unit
Count: All, Custom, or a number of occurrences
%: of total count Figure 3.31: SATA: ATA Command Report
Time out of ATA Command Report
The Time out shows the NCQ time out. It is applicable for only NCQ commands. A threshold can be set in the "NCQ commands Timeout Threshold", the default value is 1000 sec (the user can change it to any value). The statistical report provides a "Time out" report based on this threshold. Any NCQ command that takes more than the given threshold is flagged as "yes", which means that a timeout occurred for that command.
134 Sierra M6‐1 SAS/SATA Protocol Analyzer User Manual
LeCroy Corporation
Statistical Report Content
ATAPI Report
To display the ATAPI Report, click the ATAPI tab. The ATAPI Report displays information in the following columns (see the following screen capture):
Command: All, Custom, Inquiry, Mode Sense 10, Read10, Request Sense
Direction: All, H‐>D, D‐>H, or Custom
Number of FIS or Number of Transport: All, Custom, or a number
Payload Size: All, Custom, or a number of DWORDs
Status: All, Custom, Check Condition, Good
Duration: All, Custom, or time unit (accumulative)
Count: All, Custom, or a number of occurrences
%: of total count Figure 3.32: SATA: ATAPI Report
Protocol Error Report
To display the Protocol Error Report, click the Protocol Error tab.The Protocol Error Report displays the report data in columns with the following information:
Protocol Error: All, Custom, Code Violation, CRC Error, Disparity Error, Align‐
Notify Error
Direction: All, H‐>D, D‐>H, I‐>T, T‐>I, or Custom
Count: All, Custom, or a number of occurrences
%: of total count Figure 3.33: SAS: Protocol Error Report
Sierra M6‐1 SAS/SATA Protocol Analyzer User Manual
135
LeCroy Corporation
Statistical Report Content
Others Report
To display the Others Report, click the Others tab. The Others Report displays information in the following columns (see the following screen capture):
Items
Idle No
Payload Size
Sample Time
Idle (Initiator)
Idle (Target)
SSP Bus Utilization
SMP Bus Utilization
STP Bus Utilization
Report
Count or Time Figure 3.34: Others Report
SSP Transport Report (SAS)
To display the SSP Transport Report, click the SSP Transport tab. The SSP Transport Report displays the report data in columns with the following information:
Type: All, Custom, Command, Data, Response, XFER_RDY
Direction: All, I‐>T, T‐>I, or Custom
Duration: All, Custom, or time unit
Count: All, Custom, or a number
%: of total count Figure 3.35: SAS: SSP Transport Report
136 Sierra M6‐1 SAS/SATA Protocol Analyzer User Manual
LeCroy Corporation
Statistical Report Content
SMP Transport Report (SAS)
To display the SMP Transport Report, click the SMP Transport tab. The SMP Transport Report displays the report data in columns with the following information:
Type: All, Custom, Request, Response
Direction: All, I‐>T, T‐>I, or Custom
Duration: All, Custom, or time unit
Count: All, Custom, or a number
%: of total count Figure 3.36: SAS: SMP Transport Report
STP Transport Report (SAS)
To display the STP Transport Report, click the STP Transport tab. The STP Transport Report displays the report data in columns with the following information:
FIS Type: All, Custom, Data, PIO Setup, Register Host To Device, Register Device To Host
PM Port
Direction: All, I‐>T, T‐>I, or Custom
Duration: All, Custom, or time unit
Count: All, Custom, or a number
%: of total count Figure 3.37: SAS: STP Transport Report
SCSI Command Report (SAS)
To display the SCSI Command Report, click the SCSI Command tab. The SCSI Command Report displays the report data in columns with the following information (see Figure 3.38 on page 138):
Command: All, Custom, Inquiry, Mode Sense6, Pause Resume, Play Audio 10, Read Capacity, Read10, Receive Diagnostic Results, Send Diagnostic, Write10, Start Stop Unit, Test Unit Ready, Report Luns, Synchronize Cache10
Direction: All, I‐>T, T‐>I, or Custom
Number of Transport: All, Custom, or a number
Sierra M6‐1 SAS/SATA Protocol Analyzer User Manual
137
LeCroy Corporation
Statistical Report Content
Payload Size: All, Custom, or a number of DWORDs
Status: All, Custom, Good, Incomplete, Response Data Present
Task Attribute: Simple
Duration: All, Custom, or time unit
Count: All, Custom, or a number
%: of total count Figure 3.38: SAS: SCSI Command Report
SMP Command Report (SAS)
To display the SMP Command Report, click the SMP Command tab. The SMP Command Report displays the report data in columns with the following information:
Function: All, Custom, Discover, Report General, Report Manufacture Information, Report PHY Error Log
Function Result: SMP Function Accepted
Direction: All, I‐>T, T‐>I, or Custom
Duration: All, Custom, or time unit
Count: All, Custom, or a number
%: of total count Figure 3.39: SAS: SMP Command Report
Task Command Report (SAS)
To display the Task Command Report, click the TASK Command tab. The Task Command Report displays the report data in columns with the following information (see Figure 3.40 on page 139):
138 Function
Status
Direction: All, I‐>T, T‐>I, or Custom
Duration: All, Custom, or time unit
Count: All, Custom, or a number
%: of total count Sierra M6‐1 SAS/SATA Protocol Analyzer User Manual
LeCroy Corporation
Statistical Report Content
Figure 3.40: SAS: TASK Command Report
SAS Address Report (SAS)
To display the SAS Address Report, click the SAS Address tab.The SAS Address Report displays the report data in columns with the following information:
Source SAS Address: All, Custom, or an address
Destination SAS Address: All, Custom, or an address
Protocol Type: SMP, SSP, STP
Frame Type: All, Custom, Command, Data, DMA Activate, Register Host To Device, Register Device To Host, Response, XFER_RDY
Count: All, Custom, or a number Figure 3.41: SAS: SAS Address Report
Lanes Report (SAS)
To display the Lanes Report, click the Lanes tab. The Lanes Report displays the report data in columns with the following information:
Port
Open Accept: All, Custom, or a number
Open Reject: All, Custom, or a number
AIP Waiting on Con.
Break
SCSI Command: All, Custom, or a number
ATA Command: All, Custom, or a number
SMP Command: All, Custom, or a number
Out Standing Command: All, Custom, or a number
Transfer Bytes: All, Custom, or a number
Link Utilization (time)
Link Utilization %
Figure 3.42: SAS Lanes Report
Sierra M6‐1 SAS/SATA Protocol Analyzer User Manual
139
LeCroy Corporation
Statistical Report Content
Read/Write Command Report (SAS)
To display the Read/Write Command Report, click the Read/Write Command tab. You can enable or disable creation of this page under Software Settings (see “Software Settings” on page 203). The Read/Write Command report displays the report data in columns with the following information:
Source SAS Address
Destination SAS Address
Protocol Type
OpCode/Command
Tag
LBA
Sector Count
Xfer Length
Payload Size: All, Custom, or a number of DWORDs
Status: All, Custom, Good
Completion Time
Performance
Standard Deviation
Count: All, Custom, or a number
Figure 3.43: SAS: Read Write Command Report
Performance Report (SAS)
To display the Performance Report, click the Performance tab.The Performance Report displays the report data in columns with the following information (see Figure 3.44 on page 141):
140 Minimum Completion Time
Average Completion Time
Maximum Completion Time
Initiator Bus Utilization
Target Bus Utilization
Efficiency
Total Read Cmd
Total Read (Bytes)
Total Read Duration
Cmd Minimum Read (MB/S)
Cmd Average Read (MB/S)
Cmd Maximum Read (MB/S)
Total Write Cmd
Total Write (Bytes)
Sierra M6‐1 SAS/SATA Protocol Analyzer User Manual
Statistical Report Content
LeCroy Corporation
Total Write Duration
Cmd Minimum Write (MB/S)
Cmd Average Write (MB/S)
Cmd Maximum Write (MB/S)
Average Byte per SSP Frame
Average Byte per STP Frame Figure 3.44: SAS: Performance Report
Performance Report (SATA)
To display the Performance Report, click the Performance tab. The Performance Report displays information in the following columns (see the following screen capture):
Minimum Completion Time
Average Completion Time
Maximum Completion Time
Host Bus Utilization
Device Bus Utilization
Efficiency (%)
Total Read Cmd
Total Read (Bytes)
Total Read Duration
Cmd Minimum Read (MB/S)
Cmd Average Read (MB/S)
Cmd Maximum Read (MB/S)
Total Write Cmd
Total Write (Bytes)
Total Write Duration
Cmd Minimum Write (MB/S)
Cmd Average Write (MB/S)
Cmd Maximum Write (MB/S)
Average Byte Per FIS
FIS Minimum Difference Time
FIS Average Difference Time
FIS Maximum Difference Time Figure 3.45: SATA: Performance Report
Sierra M6‐1 SAS/SATA Protocol Analyzer User Manual
141
LeCroy Corporation
Statistical Report Content
FIS Report (SATA)
To display the FIS Report, click the FIS tab. The FIS Report displays information in the following columns:
FIS Type: All, Custom, Data, PIO Setup, Register Host To Device, Register Device To Host
PM Port
Direction: All, H‐>D, D‐>H, or Custom
Duration: All, Custom, or time unit (accumulative)
Count: All, Custom, or a number of occurrences
%: of total count Figure 3.46: SATA: FIS Report
Queue Command Report (SATA)
To display the Queue Command Report, click the Queue Command tab. The Queue Command Report displays information in the following columns:
Command: All, Custom, Read DMA Queued
PM Port
Status: All, Custom, Normal Output
Payload Size: All, Custom, or a number of DWORDs
Direction: All, H‐>D, D‐>H, or Custom
Duration: All, Custom, or time unit (accumulative)
Count: All, Custom, or a number of occurrences
%: of total count Figure 3.47: SATA: Queue Command Report
142 Sierra M6‐1 SAS/SATA Protocol Analyzer User Manual
LeCroy Corporation
Statistical Report Content
PM Statistic Report (SATA)
To display the PM Statistic Report, click the PM Statistic tab. The PM Statistic Report displays information in the following columns:
Request Type: PMREQ_P
Request Port
Response Type: All, Custom, PMACK
Response Time
Request Entering Delay
Response Entering Delay
Wakeup Type
Request DC Idle Time
Response DC Idle Time
Request Wakeup Time
Response Wakeup Time
Count: All, Custom, or a number Figure 3.48: SATA: PM Statistic Report
PM Performance Report (SATA)
To display the PM Performance Report, click the PM Performance tab. The PM Performance Report displays information in the following columns:
Port
Partial Request
Partial ACKed
Partial NACKed
Slumber Request
Slumber ACKed
Slumber NACKed
Partial Time / Slumber Time %
Partial Time / Total Time %
Slumber Time / Total Time % Figure 3.49: SATA: PM Performance Report
Sierra M6‐1 SAS/SATA Protocol Analyzer User Manual
143
LeCroy Corporation
Statistical Report Toolbar
Read Write Command Report (SATA)
To display the Read/Write Command Report, click the Read/Write Command tab. You can enable or disable creation of this page under Software Settings (see page 203). The Read/Write Command Report displays information in the following columns:
Time Stamp
OpCode/Command
LBA
Sector Count
Payload Size: All, Custom, or a number of DWORDs
Status: All, Custom, Good
Completion Time
Count: All, Custom, or a number Figure 3.50: SATA: Read Write Command Report
Statistical Report Toolbar
The Statistical Report toolbar provides the following functions accessible by buttons on the toolbar:
144 Export to Excel
Save as Text
Print Report
Print Preview
Report Display Settings
Move to X‐Cursor, Y‐Cursor, or None Sierra M6‐1 SAS/SATA Protocol Analyzer User Manual
LeCroy Corporation
Statistical Report Toolbar
Export as Microsoft® Excel file
The Export to Excel button opens the Export to Excel dialog. Choose a folder in which to save the Excel file, choose an appropriate file name, and click Save.
Save as Text file
The Save as Text button opens the Export to Text dialog. Choose a folder in which to save the Text file, choose an appropriate file name, and click Save.
Print Statistical Report
The Print button opens the select printer dialog. Choose an available printer and click OK.
Sierra M6‐1 SAS/SATA Protocol Analyzer User Manual
145
LeCroy Corporation
Statistical Report Toolbar
Print Preview
The Print Preview button displays a preview of the report to print.
Figure 3.51: Sample Print Preview of Report
146 Sierra M6‐1 SAS/SATA Protocol Analyzer User Manual
LeCroy Corporation
Statistical Report Toolbar
Report Display Settings
The Setting button opens the Setting dialog.
You can set up the report columns for display to suit a particular analysis need, eliminating the need to show/hide columns individually. Use the Setting dialog to configure the display for each page.
Figure 3.52: SAS: Statistical Report Column Setting
Figure 3.53: SATA: Statistical Report Column Setting
Sierra M6‐1 SAS/SATA Protocol Analyzer User Manual
147
LeCroy Corporation
Statistical Report Toolbar
Link With Sample View
When you select a type on any page of the Statistical Report, a set of navigation buttons allows you to examine each instance of that type in the Sample Viewer.
The Jump to Previous button goes to the previous instance of the selected type in
the Sample Viewer.
The Jump to Next button goes to the next instance of the selected type in the
Sample Viewer.
The Jump to Specific button goes to the instance specified as N of M items on the
Statistical Report toolbar.
The Move drop-down list moves to the X-Cursor, Y-Cursor, or None.
148 Sierra M6‐1 SAS/SATA Protocol Analyzer User Manual
Formatting the Statistical Report View
LeCroy Corporation
Formatting the Statistical Report View
Initially the Statistical Report View contains all of the information in columns, but you can customize the display by:
Filtering columns by item
Sorting items by column
Hiding any column on the display
Filtering Column Content
To filter column content, click the down arrow in the heading for that column and choose the items to display. The default is All. By checking a specific item, you exclude everything but that item for display.
.
Figure 3.54: SAS: Type
Choosing Custom allows you to specify more than one item for display.
Figure 3.55: SAS: Custom Filter
Sierra M6‐1 SAS/SATA Protocol Analyzer User Manual
149
LeCroy Corporation
Formatting the Statistical Report View
Figure 3.56: SATA: FIS Type
Choosing Custom allows you to specify more than one item for display.
Figure 3.57: SATA: Custom Filter
Check the items to display and click OK.
150 Sierra M6‐1 SAS/SATA Protocol Analyzer User Manual
LeCroy Corporation
Formatting the Statistical Report View
Sorting Column Content
To sort column content, click the heading for that column. Repeated clicking of the column heading sorts the column in ascending or descending order.
Figure 3.58: Toggling Type Sort Order
Hiding Columns
To hide a column, right‐click in the column and choose Hide. To unhide a column, right‐
click any column and choose Unhide.
Histogram View
The Histogram View displays a histogram of frame‐type transfers.
To display the Histogram View of the current capture, click View > Histogram View or click the button on the View Type toolbar.
Figure 3.59: Histogram View
Sierra M6‐1 SAS/SATA Protocol Analyzer User Manual
151
LeCroy Corporation
Formatting the Statistical Report View
Hide Frames
You can customize the histogram by including only frame types that you want.
To choose frame types to include in the display, click the down arrow on the Frame button on the Histogram toolbar and check frame types:
Figure 3.60: SAS: Histogram Frames
Figure 3.61: SAS: Histogram Frames
Hide Error Frames
Frames with errors are displayed in red. To hide error frames from the histogram, click the button.
Note: To display the error code of a protocol error, click the error icon (with the red 'x').
Pending IO Graph
The Tool menu has a Pending IO Graph command, with horizontal zoom, vertical zoom, click and drag zoom, graph area zoom, synchronize with trace view, fit to graph area and graph view. User Defined
You can define additional items for inclusion in the Histogram by clicking the 152 button to open the User Defined dialog.
Sierra M6‐1 SAS/SATA Protocol Analyzer User Manual
Formatting the Statistical Report View
LeCroy Corporation
Figure 3.62: SAS: Histogram User Defined Dialog
You can include Primitive and/or Outside Connections frames.
Primitives
To include Primitives, check the Primitive check box, click the down arrow on the Primitive list box, and choose a Primitive.
Figure 3.63: SAS: Choosing a Primitive
Figure 3.64: SATA: Choosing a Primitive
Check a Connection Type option radio button, if available, and click OK.
Zoom
You can Zoom from x1 to x256.
Sierra M6‐1 SAS/SATA Protocol Analyzer User Manual
153
LeCroy Corporation
Formatting the Statistical Report View
Bus Utilization View
The Bus Utilization View displays information on pending IO. To display the Bus Utilization View of the current capture,
click View > Bus Utilization View or click the button on the View Type toolbar.
Figure 3.65: SAS: Bus Utilization View for Pending SCSI IO.
Figure 3.66: SATA: Bus Utilization View for Pending ATA IO
Available Bus Utilization Views are:
Pending SCSI IO (for SAS)
Pending ATA IO (for SATA)
Hovering the mouse over the graph heading displays the graph legend:
Go to ATA/SCSI Cmd. #: Jump to command.
Synchronize with Trace View: Synchronize all open views to that location in the trace.
Fit to Graph Area: Zoom to fit.
Hide: Do not display the graph.
To synchronize all open views to that location in the trace, double‐click the graph.
154 Sierra M6‐1 SAS/SATA Protocol Analyzer User Manual
LeCroy Corporation
Data Report
Bus Utilization Buttons
The Bus Utilization window has a row of buttons for changing the format of the displayed data. The buttons have the following functions: Horizontal zoom in
Vertical zoom in
Horizontal zoom out
Graph Areas
Presents options for displaying additional graphs.
Vertical zoom out
Click and Drag zoom
Click diagonally to select and zoom in on part of the graph.
Graph legend (see previous page)
Hide graph.
Data Report
When a captured sample is in the Sample Viewer, the Data Report button is on the Viewer toolbar, and Data Report is in the Report menu.
The data report displays all the data sent from the host to the device and from the device to the host. All PIO In =>In commands are grouped as a data packet until the occurrence of a PIO Out =>Out command, creating a new data packet.
To display a Data Report, click the select Report > Data Report.
Data Report button on the Viewer toolbar or Figure 3.67: SAS: Data Report
Click the Down Arrow in a data field to display Data Report details (see Figure 3.68 on page 156).
Sierra M6‐1 SAS/SATA Protocol Analyzer User Manual
155
LeCroy Corporation
Data Report
Figure 3.68: SAS: Data Report Details
Click the Statistics button statistics.
at the end of a row to display data report Figure 3.69: SAS: Data Report Statistics
156 Sierra M6‐1 SAS/SATA Protocol Analyzer User Manual
LeCroy Corporation
Data Report
Data Payload View
To display the Data Payload View, double‐click a data payload field in a Packet or Spreadsheet view, or right‐click a data payload field and select Open as Data View:
Figure 3.70: Data Payload View
Note: When showing truncated data in the Data Payload View, the truncation points are marked with a separator placed between payloads. You can get more information about the data exclusion using the tooltip over the separator.
Note: You can control the number of bytes per line.
Find Data Pattern
To quickly locate a data pattern in the current frame, enter the pattern in the Text Box and click the Find button.
Sierra M6‐1 SAS/SATA Protocol Analyzer User Manual
157
LeCroy Corporation
Data Report
Compare Two Data Payloads
To compare two data payloads, select two different payload packets, one as reference. Right‐click a payload field in Packet View or a related frame in Text View or Spreadsheet View to display a menu, then select Set As Reference Data Payload.
Right‐click a payload field in Packet View or a related frame in Text View or Spreadsheet View to display a menu, and choose Set as Second Data Payload.
To compare data payloads, click the
Show/Hide Compare 2 Data Payloads button on the View Type toolbar:
Figure 3.71: Compare Two Data Payloads
158 Sierra M6‐1 SAS/SATA Protocol Analyzer User Manual
Running Verification Script Engine (VSE)
LeCroy Corporation
Running Verification Script Engine (VSE)
You can perform custom post‐process analysis of the open trace by running a verification script over the trace. A verification script instructs the application to send trace and analysis information to the script. A verification script also contains script code, written using CATC Script Language (CSL) (see the CSL_RefManual.pdf document in the docs directory of the installation), used to process trace data and output that data in different formats.
Note: You may write your own verification scripts to perform custom verification and analysis. For information on how to write a verification script, see the Verification Script Engine Reference Manual.
To run a verification script over a trace:
1. Select the main menu item Tools > Verification script or click the Running verification scripts button on the main tool bar. The Run Verification Scripts dialog opens, from which you choose and then run one or several verification scripts: Figure 3.72: Run Verification Scripts Dialog
To expand the Log window, click the Expand Log button. The Log window fills the whole window. To see the Verification Scripts window again, click the Collapse Log button.
To save output, click the Save Output button.
Sierra M6‐1 SAS/SATA Protocol Analyzer User Manual
159
LeCroy Corporation
Running Verification Script Engine (VSE)
2. After choosing Settings from the drop‐down list or the button, the Settings dialog appears:
Figure 3.73: Run Verification Scripts - Settings Dialog
Choose the editor application: Notepad or other.
Edit all selected scripts in one process: If the editor supports multiple documents, you can edit all scripts in the editor.
Open all included files: You can edit included files, as well as the main script.
Launch editor application in full screen: You can use whole screen.
Path to the template file for a new script: You can use a template for the script.
Display Settings can show full trace‐file path, restore dialog at start, load last output from save log files, activate dialog after scripts have run, remember dialog layout, and ignore errors and warnings.
Saving Settings can save log files to relative file folder, indicate output‐log‐file path, and save logs automatically.
160 Sierra M6‐1 SAS/SATA Protocol Analyzer User Manual
Running Verification Script Engine (VSE)
LeCroy Corporation
3. Click the Run scripts button after you select scripts to run. VSE starts running the selected verification scripts, shows script report information in the output windows, and presents the results of verifications in the script list:
Figure 3.74: Run Verification Scripts Dialog
4. Right‐clicking in the script list displays some additional operations over selected scripts:
Figure 3.75: Run Verification Scripts - Menu
Sierra M6‐1 SAS/SATA Protocol Analyzer User Manual
161
LeCroy Corporation
Running Verification Script Engine (VSE)
Run verification script(s): Start running selected script(s).
Edit script: Edit selected scripts in the editor application specified in Editor settings.
New script: Create a new script file using the template specified in Editor settings.
Show Grid: Show/hide a grid in the verification script list.
Show Description window: Show/hide the script description window (Shortcut key F2).
Show Output: Show/hide the script output windows (Shortcut key F3).
Settings: Open a special Setting dialog to specify different settings for VSE.
Navigation + View Toolbar
The Navigation + View toolbar allows you to navigate, search filter, hide RRDY/all primitives and unassociated traffic, zoom, tile views and select ports.
The down arrow on the Go To button allows location of cursors or specific packets: Trigger Position, X Position, Y Position, Packet Number, Timestamp, Bookmark, Begin, and End.
The Search button opens the search dialog (see “Search” on page 178).
The Filtering Setup button opens the Filter dialog (see “Filtering” on page 167) and allows you to specify the criteria for filtering the result.
The Enable Disable Filtering button toggles the result between a filtered and unfiltered view (see “Filtering” on page 167).
The Filter Idle button toggles the display to show/hide idle packets (see “Filtering” on page 167).
The Hide RRDY Primitives button toggles the display to show/hide RRDY primitives (see “Filtering” on page 167).
The Hide Unassociated Traffic button toggles the display to show/hide unassociated traffic (see “Filtering” on page 167).
162 Sierra M6‐1 SAS/SATA Protocol Analyzer User Manual
Running Verification Script Engine (VSE)
LeCroy Corporation
The Hide All Primitives button toggles the display to show/hide all primitives (see “Filtering” on page 167. Note: When capturing PM traces, you need the ability to filter the PM primitives so you can find commands quicker. The Zoom In button on the Viewer Setting Toolbar magnifies the data display area on the screen. Clicking this button in Column or Text View increases column width only.
The Zoom Out button on the Viewer Setting Toolbar scales the data display area to display more data lines on the screen. Clicking this button in Column or Text View decreases column width only.
The Normal Zoom button on the Viewer Setting Toolbar resets the zoom to default normal on the screen. Clicking this button in Column or Text View resets column width only.
You can use Tile Horizontally All Views icon or select View > Tile Views to revert any unintended window docking or sizing, or maximize screen utilization. This function only tiles views inside a trace window.
Note that there is no command to tile views vertically.
The Data Report button displays the data report.
Go To Menu
Locate Cursors
To quickly locate any cursor within the data viewer display, click the Go To button and choose the cursor to locate. You can also locate a cursor by selecting Go To from the Edit menu and choosing the cursor to locate.
Figure 3.76: Locate Cursor
Sierra M6‐1 SAS/SATA Protocol Analyzer User Manual
163
LeCroy Corporation
Running Verification Script Engine (VSE)
Go to Time Stamp
To locate a timestamp, click the Go To button and choose Timestamp.
Figure 3.77: Time Stamp
Enter a time stamp value in the Go To Timestamp dialog and click OK. Figure 3.78: Go to Time Stamp
Bookmarks
Bookmarks are a convenient way to mark a point in the data viewer display by name, so that you can rapidly return to that point. To create a bookmark, right‐click the mouse in the data viewer area on a packet in which to place the bookmark.
Figure 3.79: Bookmark
Click Bookmark from the fly out menu to open the Bookmark Comment Dialog.
164 Sierra M6‐1 SAS/SATA Protocol Analyzer User Manual
Running Verification Script Engine (VSE)
LeCroy Corporation
Figure 3.80: Bookmark Dialog
Enter a description for the bookmark and click the Add button. Repeat for additional bookmarks.
You can save the bookmark as a text file or Excel CSV file.
Note: Column View has a different bookmark mechanism than other views, and you can set a bookmark on each DWORD in the view. This makes Column View bookmarks unavailable in other views and vice versa.
Editing a Bookmark
If a packet has a bookmark, you can edit the bookmark by right‐clicking the data viewer area of the packet, selecting the Edit Bookmark command from the
pop‐up menu, and changing the information in the Bookmark dialog (see above). Sierra M6‐1 SAS/SATA Protocol Analyzer User Manual
165
LeCroy Corporation
Running Verification Script Engine (VSE)
Finding a Bookmark
To find a bookmark in the data viewer display, right‐click the mouse in the sample viewer and select Bookmark.
Figure 3.81: Go To Bookmark Dialog Box
Highlight the bookmark to which to go, then click the Go To button, or
double‐click the selection.
Figure 3.82: Bookmark Found Example in Data Viewer Display
Bookmark Description
To get a quick description of a displayed bookmark, position the tool tip over a bookmark. The name and description of the bookmark display.
Set Time Stamp Origin
Right‐click in the sample viewer to open the fly out menu:
Figure 3.83: Bookmark Found Example in Data Viewer Display
166 Sierra M6‐1 SAS/SATA Protocol Analyzer User Manual
LeCroy Corporation
Filtering
Highlight Set Time Stamp Origin and choose either Absolute, Trigger, Current Position, or Based on system time.
Filtering
The Filtering menu and options allow you to modify data in the sample viewer display to exclude packets with a set of user‐defined patterns and show the results in all views.
To set up filtering, you must have a viewer display open.
The Filtering menu has the options:
Enable Filtering (see “Enable Filter” on page 177)
Filtering (see “Filter Setup” on page 167)
Link Layer (SAS)
Transport Layer (SAS)
Application Layer (SAS)
Physical Layer (SATA)
FIS Layer (SATA)
Command Layer (SATA)
Filter Idles (see “Filter Idle” on page 178)
Filter Setup
To display the Filter setup dialog, click the select Filtering (see following screen capture).
Sierra M6‐1 SAS/SATA Protocol Analyzer User Manual
Filter button on the Viewer toolbar or 167
LeCroy Corporation
Filtering
Figure 3.84: SAS: Filter Setup Dialog
Figure 3.85: SATA: Filter Setup Dialog
You can select or deselect each of the items shown in the Filter Options window for filtering, by checking or unchecking a corresponding check box. Items not in the current sample are in shade.
Note: If you select a group, that also selects all child items. 168 Sierra M6‐1 SAS/SATA Protocol Analyzer User Manual
LeCroy Corporation
Filtering
Note: Only packets captured at run time are available for selection for filtering.
Filter Type
You can choose to show or hide the Filter Type items by checking the Show or Hide option button.
Note: When capturing PM traces, you need the ability to filter the PM primitives so you can find commands quicker. Filtering Direction
You can select items for filtering in a single direction or both directions by checking the corresponding Port. By default, all ports are enabled. Uncheck the port check boxes for ports not to include in the filter.
Filter Idle
Depending on the Filter Type (Hide/Show), Idle packets in the Sample Viewer are shown or hidden.
Save Filter Setup
After you have set up a Filter configuration, you can save it as an SAS Filter file (*sfl) or SATA Filter file (*.tfl) by clicking Save. You can then use it on a different capture by clicking Load in the Filter dialog.
Filter Logic
After you have set up Filter options, you can set filter logic to And Related Items to apply “AND” logic on related selected options (for example, SCSI commands and SAS Addresses) or OR to apply “OR” logic on all selected options.
Multilevel Filtering in SAS
You can set up a filter in a sequential steps by Multi level filtering. In each level, you can select specific items to “AND” to the previous level. The results of all levels show in views (see following screen capture). Sierra M6‐1 SAS/SATA Protocol Analyzer User Manual
169
LeCroy Corporation
Filtering
Figure 3.86: First Level of Multilevel Filtering
170 Sierra M6‐1 SAS/SATA Protocol Analyzer User Manual
LeCroy Corporation
Filtering
Figure 3.87: Second Level of Multilevel Filtering
Sierra M6‐1 SAS/SATA Protocol Analyzer User Manual
171
LeCroy Corporation
Filtering
Figure 3.88: Third Level of Multilevel Filtering
Filter descending packets from trace highlight bar
If you check the Filter descending packets from trace highlight bar checkbox, the application will only filter onward from the highlighted trace selection bar.
If you uncheck this option, the software only filters the filtered packet. For example, if this option is checked and any SCSI command is selected, all transport and link packets of this command are filtered. If you unchecked this option, only selected SCSI commands are filtered.
Selectable Filter Options for SAS
172 The SAS Filter Options are:
Bus Condition
Primitive
Incomplete Frames
Address Frames
SSP Frames
SMP Frames
STP Frames
SCSI Commands
Task Management Functions
Sierra M6‐1 SAS/SATA Protocol Analyzer User Manual
LeCroy Corporation
Filtering
ATA Commands
SCSI Command Status (see “Filter Check Condition” on page 174)
Source SAS Address
Destination SAS Address
Pair SAS Address
Protocol Error
STP Port
Tag (see “Filter by Tag Number” on page 174)
ATAPI SCSI Command
Miscellaneous (see “Filter Miscellaneous” on page 175)
Bus Condition
When selected, depending on the Filter Type, the Hide/Show selection shows or hides captured Bus Conditions in the Sample Viewer.
Incomplete Frames
When selected, depending on the Filter Type, the Hide/Show selection shows or hides Incomplete Frames in the Sample Viewer. ATA Command
When selected, depending on the Filter Type, the Hide/Show selection shows or hides captured ATA commands in the Sample Viewer.
Protocol Error
When selected, depending on the Filter Type, the Hide/Show selection shows or hides captured packets with the specified Protocol Errors in the Sample Viewer.
ATAPI SCSI Command
When selected, depending on the Filter Type, the Show/Hide selection shows or hides ATAPI SCSI commands.
Sierra M6‐1 SAS/SATA Protocol Analyzer User Manual
173
LeCroy Corporation
Filtering
Filter Check Condition
Checking the SCSI Command Status check box enables Check Condition for filtering.
Figure 3.89: SAS: Filter Check Condition
Filter by Tag Number
Checking the Tag check box displays tags available for filtering. Check the corresponding check boxes for tags to filter.
Figure 3.90: SAS: Filter by Tag Number
174 Sierra M6‐1 SAS/SATA Protocol Analyzer User Manual
LeCroy Corporation
Filtering
Filter Miscellaneous
When you choose Miscellaneous, an additional dialog displays, allowing you to specify the filtering of State Range and/or External Signal In.
Figure 3.91: Filter State and/or External Signals
Sierra M6‐1 SAS/SATA Protocol Analyzer User Manual
175
LeCroy Corporation
Filtering
Use Pair SAS Addresses
You can use all available pair SAS addresses (Source ‐> Destination) instead of using SAS source and destination addresses. To enable the pair SAS address filter option, check Use Pair SAS Addresses check box in the Filter dialog.
Figure 3.92: SAS: SAS Address Filtering before and after Using Pair SAS Addresses
Note: If you enable pair SAS addresses, the source/destination SAS addresses options are disabled and filtering on them is ignored at filtering time. If you disable pair SAS addresses, the pair SAS address option is disabled and filtering on it is ignored at filtering time.
Selectable Filter Options for SATA
The SATA filter options are:
176 Bus Condition
Incomplete Frames
FIS
ATA Command
Protocol Error
Port
ATAPI SCSI Command
Miscellaneous
Filter Idle
Sierra M6‐1 SAS/SATA Protocol Analyzer User Manual
LeCroy Corporation
Filtering
Bus Condition
When selected, depending on the Filter Type, the Hide/Show selection shows or hides captured Bus Conditions in the Sample Viewer.
Incomplete Frames
When selected, depending on the Filter Type, the Hide/Show selection shows or hides Incomplete Frames in the Sample Viewer.
FIS
When selected, depending on the Filter Type, the Hide/Show selection shows or hides captured FIS items in the Sample Viewer.
ATA Command
When selected, depending on the Filter Type, the Hide/Show selection shows or hides captured ATA commands in the Sample Viewer.
Protocol Error
When selected, depending on the Filter Type, the Hide/Show selection shows or hides captured packets with the specified Protocol Errors in the Sample Viewer.
Port
When selected, depending on the Filter Type, the Show/Hide selection shows or hides packet traffic for the selected port.
ATAPI SCSI Command
When selected, depending on the Filter Type, the Show/Hide selection shows or hides ATAPI SCSI commands.
Miscellaneous
When you choose Miscellaneous, an additional dialog displays, allowing you to specify the filtering of State Range and/or External Signal In (see “Filter Miscellaneous” on page 175).
Enable Filter
Select Filtering > Enable Filtering or click the Filter Enable button on the display menu bar to toggle between Filtered and Unfiltered display.
Sierra M6‐1 SAS/SATA Protocol Analyzer User Manual
177
LeCroy Corporation
Search
Filter Idle
Depending on the Filter Type (Hide/Show), Idle packets in the Sample Viewer are shown or hidden.
You can quickly filter idles by clicking the between Show and Hide items.
Filter Idle button. This button toggles Search
The Search menu and toolbar options permit you to examine any data capture file to quickly locate the packet or data pattern. To perform an initial search, select Edit > Search or click the open the Search setup dialog (Figure 3.93).
Search button to Note: Only items captured in the sample file are enabled for search.
Figure 3.93: SAS: Search Data Pattern
178 Sierra M6‐1 SAS/SATA Protocol Analyzer User Manual
Search
LeCroy Corporation
Figure 3.94: Search Parameter Definition Dialog
You can continue to search the output file using Next Search (F3) or Previous Search (F4) for the same pattern, until you redefine the data capture search parameters.
Save Search Setup
After you have set up a Search configuration, you can save it as a SAS Search configuration file (*.ssh) or a SATA Search configuration file (*.tsh) by clicking Save. You can then use it on a different capture by clicking Load in the Search dialog.
Search By
Choose Hashed SAS Address to search on hash address, or choose SAS Address to search for address. Search Direction
Choose either Forward or Backward direction in which to perform the search.
Sierra M6‐1 SAS/SATA Protocol Analyzer User Manual
179
LeCroy Corporation
Search
Search From
Choose a starting point to begin or continue a search: Start of the sample file, Trigger Pointer, X Pointer, Y Pointer, or Last Found.
Search Logic
The default setting is Or Selected Items. With this setting, clicking Find Next locates all selected items in turn. If you choose And Selected Items, you can set a logical AND combination of items to find. Both options allow setting Advanced search features.
Search For
Choose a category to search in the Search For window. Each of the search categories offers additional choices in the Search Items window to refine the search. Check items for the selected category.
Data Pattern
Search for Data Pattern allows you to search for a specific Data Type, Pattern, and Length (see Figure 3.93 on page 178).
Data Pattern Only
Data Payload Length Only
Data Pattern and Data Payload Length
Advanced options
Some of the Search For categories offer advanced options for search. To set these options, highlight the search item in a category and click the Advanced button to open the Advanced options dialog.
Figure 3.95: Advanced Options Dialog Example: Set Device Bits
Set the options and click OK.
180 Sierra M6‐1 SAS/SATA Protocol Analyzer User Manual
LeCroy Corporation
Search
Search Domain
Click the Domain button and choose a search domain from all ports or a specific port.
Protocol Error
You can refine the search to locate packets with an error or without an error.
Note: When searching for Protocol Errors in Column View, you cannot search for a specific Protocol Error type. Search returns any protocol error.
Search Sub Items
When searching SCSI Command Status, you can refine the search by selecting from a list of Sub Items.
Note: Some of the search categories allow you to refine the search by specifying specific SAS addresses and STP ports to search.
Figure 3.96: Search Sub Items
When you check the SCSI Command Status, the Check Condition item appears in the Search Items Window, if a check condition has occurred. Clicking this enables Search Sub Items, allowing you to refine the search by specifying Sense Key, ASC, and ASCQ.
Sierra M6‐1 SAS/SATA Protocol Analyzer User Manual
181
LeCroy Corporation
Search
Search by Tag Number
To search by Tag Number, check the Tags box in the Search For window and then check the Tag(s) for which to search in the Search Items window.
Figure 3.97: Search by Tag Number
Show/Hide Single Port
If Show/Hide Single Port is selected, you can click on one port button at a time to show/
hide the capture for that port. Show/Hide Single Port is time consuming as it shows or hides one port at a time.
Show/Hide Multiple Ports
If Show/Hide Multiple Ports is selected, you can click on multiple ports to show or hide them. This mode is much faster. Click on multiple ports to show or hide them.
Figure 3.98: SAS: Show/Hide Ports Toolbar
.
Figure 3.99: SATA: Show/Hide Ports Toolbar
182 Sierra M6‐1 SAS/SATA Protocol Analyzer User Manual
LeCroy Corporation
Search
You can also show or hide a port by right‐clicking a Port ID in Text View or Column View and choosing Show or Hide (see Figure 3.103 on page 187).
Packet View Toolbar
The Packet View toolbar allows wrapping, zooming, and configuration.
The Wrap Packets button on the Viewer Toolbar wraps the packet data in the display to eliminate the need for horizontal scrolling.
Go to CATC Navigation View. Click this button to change the trace display to a CATC Trace™.
You can change the colors, fonts, and so on, in the Trace Viewer Configuration (see “Set Port Alias” on page 200).
The Show/Hide Link Packet button displays/hides the Link layer. SAS only. The Show/Hide Transport Packet button on the Layers Toolbar displays/hides the Transport layer and below. SAS only.
The Show/Hide All Commands Packet button shows/hides the Command layer and all layers below: SCSI Cmd and Task Mng, SMP Cmd, and ATA Cmd. SAS only.
Click the down arrow on the Show/Hide All Commands Packet button to choose command types to show/hide.
The Show/Hide Physical Packet button toggles the display of physical layer packets. SATA only. The Show/Hide FIS packet button toggles the display of FIS layer packets. When “OFF”, the FIS layer and its links are hidden. SATA only. The Show/Hide CMD packet button toggles the display of the CMD packets. When “ON”, only the command layer displays. SATA only. Sierra M6‐1 SAS/SATA Protocol Analyzer User Manual
183
LeCroy Corporation
Search
The Show/Hide Command Queue button displays queued commands.
The Order/Reorder toggles the time order of packets.
The Pack/Unpack Repeated Primitives toggles packing repeated primitives in one port.
The 10B button displays the payload data as 10‐bit encoded data.
The 8B button displays the payload as 8‐bit scrambled or unscrambled data, depending on the Scrambled setting.
The SC button selects scramble/unscramble for the 8‐bit payload data.
CATC Navigation View
To change the trace display to a CATC Trace™, click the CATC Navigation button (see Figure 3.100 on page 185). You can change the colors, fonts, and so on, in the Trace Viewer Configuration (see “Trace Viewer Configuration” on page 195).
184 Sierra M6‐1 SAS/SATA Protocol Analyzer User Manual
LeCroy Corporation
Search
Figure 3.100: CATC Navigation View
Sierra M6‐1 SAS/SATA Protocol Analyzer User Manual
185
LeCroy Corporation
Search
Spec View
Spec View shows packet header information. To obtain the Spec View from the CATC View, left‐click to display a popup menu, then select the View Field option.
To obtain the Spec View from the Catalyst View, right‐click to display a popup menu, then select the View Field option.
Figure 3.101: Spec View
The tabs allows you to display Hexadecimal or Binary. The buttons allow you to go to Previous or Next.
You can Save As a text file.
186 Sierra M6‐1 SAS/SATA Protocol Analyzer User Manual
LeCroy Corporation
Search
Decode Icons
The Decode Toolbar controls encoding and scrambling features.
To view corresponding Unscrambled and Scrambled payload data values instantaneously, position the mouse pointer over a data field.
Running Disparity indication
Figure 3.102: Payload Data Display
Customize Display
Rename Port
You can rename each port for easy identification. To rename a port, right‐click the port ID in Text View or Column View.
Figure 3.103: Rename Port
Choose Rename title of port to open the Rename Title of Port dialog.
Figure 3.104: Rename Title of Port
Sierra M6‐1 SAS/SATA Protocol Analyzer User Manual
187
LeCroy Corporation
Search
Select and Apply Show/Hide Port Mode
You can simplify the viewer display by hiding the captures of ports. All active ports are highlighted on the Show/Hide Ports toolbar. You can Show/Hide a Single Port or you can Show/Hide Multiple Ports. Click on the drop‐down arrow and select from the two options as shown in the following figure:
Show/Hide Single Port
Show/Hide Multiple Ports
Click on the Apply show/hide port button to apply the specific mode.
.
Apply show/hide port button
Figure 3.105: Show/Hide Single or Multiple Ports
Show/Hide Field
You can simplify the Viewer display by hiding some fields. You can hide the Duration, Relative Time, External Signals, and Packet number fields by right‐clicking the corresponding field title and choosing Hide Field.
Figure 3.106: Hide Field
To restore a field to the display, right‐click a Port ID field and choose the hidden field to restore.
Figure 3.107: Show Field
Note: Only the fields previously hidden appear in the restore list.
188 Sierra M6‐1 SAS/SATA Protocol Analyzer User Manual
LeCroy Corporation
Search
Related Frames
Right‐click a Command frame for an SSP frame, or Register Device to Host for an STP frame, to open a short‐cut menu, then choose Goto Response to jump to the corresponding Response frame in the viewer.
Figure 3.108: Goto Response
Similarly, right‐click a Response frame for an SSP Frame, or Register Device to Host for an STP frame, to open a short‐cut menu, then choose Goto Command to jump to the corresponding Command frame in the viewer.
Figure 3.109: Goto Command
In Column View, you can right‐click a DWORD inside a frame to display the Goto Within Packet command. You can jump to an SOF, EOF, HOLD, or R_IP.
Figure 3.110: Goto Within Packet Command
Sierra M6‐1 SAS/SATA Protocol Analyzer User Manual
189
LeCroy Corporation
Search
Byte Order
You can change the byte order in fields marked by an arrow and other fields. Right‐click in the field, select Byte Order, and choose the ordering.
Figure 3.111: Byte Order
Note: A blue arrow in the byte order field indicates that it has been changed.
Choose Data Format
You can display data values either in hexadecimal (default) or binary. To choose data format, right‐click the mouse over a data field, and choose Format and the format.
Figure 3.112: Format
190 Sierra M6‐1 SAS/SATA Protocol Analyzer User Manual
LeCroy Corporation
Port Status
Show All Data
To display all captured data, click the data expand toggle arrow in a data field, to examine the data in detail.
Data expand toggle
Figure 3.113: Show All Data
You can expand or collapse all data fields globally. To expand all data fields,
right‐click the mouse in a data field and choose Expand All (see Figure 3.114).
Figure 3.114: Expand All
To collapse all fields, right‐click the mouse in a data field and choose Collapse All.
Port Status
You can get an overview of the active ports by clicking the Port Status button at the bottom right of the application window.
The Port Status displays the Port, Speed, and Analyzer.
Sierra M6‐1 SAS/SATA Protocol Analyzer User Manual
191
LeCroy Corporation
Port Status
In addition to displaying OOB, Link, Frame, and Error, a display showing the % buffer full opens when a trigger occurs.
Figure 3.115: Port Status Window and Capturing Time
1. Pre‐trig capturing (trig is 50%)
2. Trig point (shown by red bar; 36% pre trig was captured)
3. Post‐trig capturing (50% post‐trig was captured and capturing has stopped)
Note: If sample capture occurs with more than one unit active, additional Port Status windows display.
The OOB, Link, Frame and Error LEDs in the Port Status dialog mimic/follow the LEDs on the Front panel of the unit. Reset button
LEDs illuminated
When the LEDs are dim, it indicates they were lit in the past. Pressing the Reset button erases this history and the illuminated LEDs are removed from the dialog.
192 Sierra M6‐1 SAS/SATA Protocol Analyzer User Manual
LeCroy Corporation
Toolbars
Toolbars
Enabling Tool Bars
To customize the Viewer Display workspace, you can enable and reposition the available toolbars. To display or hide toolbars, select View > Toolbar, then check or uncheck toolbars (see following screen capture).
Toolbars are:
Main
Record + Capture
Analysis
Navigation + View
Packet View
Column View
Cursor Position
Device/Target Emulator
Once enabled, the toolbars can dock at the Viewer Display window or float on the windows desktop.
Cursor Position Status Bar
To display the cursor position status bar, select Toolbar > Cursor Position.
Figure 3.116: Cursor Position Toolbar
See “Using the Cursors and Bookmarks” on page 194.
Sierra M6‐1 SAS/SATA Protocol Analyzer User Manual
193
LeCroy Corporation
Status Bar
Status Bar
The Status bar is located at the bottom of the main display window.
Search Status
The right most segment displays the current search direction: Fwd (forward) or Bwd (backward). Change the search direction from the Search Menu or double‐click the Search Status segment. Using the Cursors and Bookmarks
Cursors
The data viewer display incorporates three cursors labeled X, Y, and T. All cursors are initially overlaid and positioned at location 0, which is the trigger position of the display. The Trigger, or T, cursor is the measurement reference and is always at location 0 in the display.
Positioning the X Cursor
To position the X‐Cursor within the viewer data display, click the left mouse button in the gray bar on the left side of the sample viewer next to the line in which to place the cursor. Positioning the Y Cursor
To position the Y‐cursor within the viewer data display, click the right mouse button in the gray bar on the left side of the sample viewer next to the line in which to place the cursor. Note: You can also left‐click to set the X‐cursor and right‐click to set the Y cursor in the Frame and Column View by clicking in the narrow strip on the very left side of a cell. Similarly, you can set the cursors in the Waveform View by left and right clicking at the beginning of a waveform.
Time
Time differences between the cursors are displayed in the Cursor Position toolbar. To display the cursor position toolbar, select Toolbar from the view menu and choose Cursor Position.
Figure 3.117: Cursor Position Toolbar
194 Sierra M6‐1 SAS/SATA Protocol Analyzer User Manual
LeCroy Corporation
Display Configuration
Display Configuration
The Analyzer ships with a default display configuration of field and viewer settings. You can define your own field and viewer settings for a particular testing scenario. Right‐click in the Packet View and select Display Option. The Trace Viewer Configuration dialog displays.
Trace Viewer Configuration
The Trace Viewer Configuration dialog allows you to change the following display settings (see following screen capture):
Field Setting
Format (Decimal, Hexadecimal, Binary)
Visible
Byte Order (Right Align, Left Align)
Field Header Setting
Text (color)
Name
Abbreviation
Foreground (color)
Viewer Setting
Wrap Packet
Enable Tooltips
Data Payload
Columns in Row (1, 2, 4, 8, 16)
Bytes in Column (1, 2, 4, 8, 16)
Time Stamp Origin: Absolute, Trigger, User Defined, Based on System Time
Same color for start time and port
Enable Packet View Condense Mode
Time Stamp Format (LeCroy, Milli, Micro)
Save Trace Viewer Configuration in a file
Load Trace Viewer Configuration from a file
Factory Setting (restores default settings)
Font (opens Font dialog)
Sierra M6‐1 SAS/SATA Protocol Analyzer User Manual
195
LeCroy Corporation
Display Configuration
Figure 3.118: Trace Viewer Configuration
196 Sierra M6‐1 SAS/SATA Protocol Analyzer User Manual
LeCroy Corporation
Display Configuration
Field Setting
To view a packet field, select a field from the packet field tree and check the Visible box. Uncheck it to hide the field. To change the data format of a packet field, select the field and choose a data format from the Format drop‐down list.
Figure 3.119: SCSI Command Fields
Sierra M6‐1 SAS/SATA Protocol Analyzer User Manual
197
LeCroy Corporation
Display Configuration
Field Header Setting
You can use the Name or Abbreviation.
To change the color of the text in a packet field header, select a field from the packet field tree and click the Foreground button.
Figure 3.120: Color
Choose an appropriate color and click OK.
Viewer Setting
Check the Wrap Packet box to enable the wrapping of packets in the display.
Check the Enable Tooltip box to enable tool tips for packet fields.
Data Payload
You can format the Data Payload display.
For Columns in Row, select 1, 2, 4, 8, or 16.
For Bytes in Column, select 1, 2, 4, 8, or 16.
Time Stamp Origin
Select Absolute, User DEfined, Trigger, or Based on System Time.
Start Time and Port
You can use the same color for the start time and port.
Packet View Condense Mode
You can enable Packet View Condense Mode to minimize Packet View rows.
198 Sierra M6‐1 SAS/SATA Protocol Analyzer User Manual
LeCroy Corporation
Display Configuration
Time Stamp Format
Select LeCroy, Milliseconds, or Microseconds.
Font
To change display fonts, click the Font button to open the Font dialog box.
Figure 3.121: Font
Choose the font, font style, and size, and click OK.
Save/Load Settings
You can save the customized configuration settings in a *.cfg file by clicking the Save button and completing the Save As procedure. To load a previously saved configuration file, click Load and choose an appropriate file.
Sierra M6‐1 SAS/SATA Protocol Analyzer User Manual
199
LeCroy Corporation
Set Port Alias
Set Port Alias
Port Alias allows you to assign a meaningful name to each port to assist in interpreting the results displayed in the sample view.
To assign port names in an open sample view, select Setup > Set Port Alias.
Figure 3.122: SAS: Assign Port Alias
Assign a meaningful name to each port in use and click OK. The assigned names replace the port numbers in the sample view.
If you elect to save the capture sample file, the assigned port names are saved together with the result, so that when you open the sample file later, the assigned names are retained.
Set As Default
If you want to set these port aliases for sample files that will be captured later, you can set them as default, and new samples will be opened by these default port aliases.
200 Sierra M6‐1 SAS/SATA Protocol Analyzer User Manual
SAS Address Alias (SAS only)
LeCroy Corporation
SAS Address Alias (SAS only)
SAS Address Alias allows you to assign a meaningful name to each SAS address to assist in interpreting the results displayed in the sample view. To assign SAS address names in an open sample view, select Setup > Set SAS Address Alias.
Figure 3.123: SAS: Assign SAS Address Alias
Assign a meaningful name to each SAS address in use and click OK. The assigned names replace the SAS address in the sample view, Search, filter,. and Statistical report.
Figure 3.124: SAS: SAS Address Alias
If you elect to save the captured sample file, the assigned SAS address names are saved together with the result, so that when you open the sample file later, the assigned names are retained.
Set As Default
If you want to set these SAS address aliases for sample files that will be captured later, you can set them as default, and new samples will be opened by these default SAS address aliases. Sierra M6‐1 SAS/SATA Protocol Analyzer User Manual
201
LeCroy Corporation
Tx Vout & Preemphasis
Tx Vout & Preemphasis
The analyzer incorporates the ability to select TX Vout for the transmitter on each port. Selecting TX Vout increases the output voltage swing above the nominal value, for test and characterization purposes. This feature is also useful to compensate for line loss when driving long cables. To select TX Vout, select Setup > Tx Vout & Preemphasis to display the
Rx/Tx Settings dialog.
Figure 3.125: Choose Port for TX Vout
Copy Selected Port Settings to All Ports implements one port's setting into all other port settings. Restore Factory Settings restores default values.
Save saves the new values as a *.sng file.
Load loads back the saved *.sng file.
202 Sierra M6‐1 SAS/SATA Protocol Analyzer User Manual
LeCroy Corporation
Software Settings
Software Settings
Software Settings allow you to define template files for new Analyzer projects, to specify how sample files appear when opened, and to set ATAPI Spec Assignment.
To perform software settings in an open sample view, select Setup > Software Settings.
General Tab
Figure 3.126: SAS: Software Settings Dialog General Tab
The SATA Software Settings dialog has the same options, except that it does not have “SCSI spec assignment”.
Paths
User Path specifies the “User” folder path, used by the software after launching the Open dialog.
Template Files
Protocol Analyzer: You can use a pre‐saved analyzer and/or analyzer/emulator project file as a template. Whenever you make a new project file, the software uses the template to initialize the project file. New Protocol Analyzer Project in Advanced Mode: When you use the New menu item to create a new project file, the software switches to Advanced mode automatically.
Sierra M6‐1 SAS/SATA Protocol Analyzer User Manual
203
LeCroy Corporation
Software Settings
Other
Default Workspace specifies the default workspace file for opening a sample file. You can save any viewer configuration as a workspace and then specify it as the default workspace. The software always open a trace file based on the default workspace file.
NCQ Commands Time out Threshold: The software uses this setting in the statistical ATA command page for NCQ commands. If the time out exceeds this setting, the software reports an error.
Maximum Number of Uploader Threads: If Quick View is not enabled, during cascading, specifies the number of concurrent processes for uploading a sample file.
ATAPI spec assignment: Specifies the ATAPI default spec.
SCSI spec assignment (SAS only): Specifies the SCSI default spec.
Convert port configuration without prompt for confirm: If the current attached board does not support the project file port configuration, the software converts it to a supported port configuration without asking for confirmation. If this setting is unchecked, the software asks for confirmation Ask user to close the previous captured sample before running the new project: When you start to run a new project, the software prompts you to close the current sample.
Found Device List Mode
Reset (clear) the list of found devices: Lists only the currently found devices.
Refresh (append to) the list of found devices: Adds new devices to the list of devices found previously.
Browse Default Path
Software default: After you select File > Open, the Open dialog shows the default user folder.
Windows default: After you select File > Open, the Open dialog shows the path selected when the Open dialog was last used.
204 Sierra M6‐1 SAS/SATA Protocol Analyzer User Manual
LeCroy Corporation
Software Settings
Trace Viewer Tab
Figure 3.127: SAS: Software Settings Dialog Sample Viewer Tab
The SATA Software Settings dialog has the same options.
Open Trace file In
Default Workspace: The software opens a sample file in view(s) based on the specified default workspace.
As previously saved: The software opens a sample file in view (views) based on the last saved configuration for the sample file. Optimization
Sampling memory usage optimization: Enables memory cascading for two ports. The analyzer will use memory of another port if there is not data on another port. See “Sampling Memory Usage Optimization” on page 209.
Quick View: Quick View allows full access to the whole trace more quickly, especially when using a Gigabit Ethernet connection. However, the trace is NOT written to the Host PC hard drive. To save the trace, you must manually click Save.
If you do not check Quick View, the trace loads more slowly but is automatically saved to the Host PC hard drive.
Other
Switch to CATC Navigation: Packet view will open in CATC mode. Reverse Link Data: The software shows DWORDs of link data as reversed.
Sierra M6‐1 SAS/SATA Protocol Analyzer User Manual
205
LeCroy Corporation
Spread Sheet View Tab
Pack Repeated Primitives: The software packs repeated primitives just after opening a sample file. Cancel button kills upload immediately: The software kills the uploading process if you press Cancel. Close previous sample file when new sample file opens: When you want to open a new sample file, the software closes any open sample files.
Create statistical report read/write page: The software creates a Read/Write page in the statistical report. Enabling this setting displays the Read/Write Stream DMA command in the Read/Write page.
Spread Sheet View Tab
Figure 3.128: SATA: Software Settings Dialog Spread Sheet View Tab
The SAS Software Settings dialog has the same options, except that it does not have “Show ‘Sector Count’ instead of ‘Xfer Length”.
Color Setting
Based on Cell Type: Each column has its own color. Based on Port No.: Data of each row are shown based on the specified color for its port. You can set the color of ports in the Viewer settings. Based on Read/Write Command Type: You can specify a color for Read commands, another color for Write commands, and other color for other commands. The software shows each row based on the command type: Read, Write, or others.
206 Sierra M6‐1 SAS/SATA Protocol Analyzer User Manual
Spread Sheet View Tab
LeCroy Corporation
Based on Specific Command Type: You can specify a color for each command. The software applies the setting on the Command column.
Anchor the Selection bar
You can anchor the selection bar of the Spreadsheet View.
Set the Anchor row as sync. point: Other views synchronize based on the contents of the anchor row.
Other
Repeat decoded command in frame column: The spreadsheet shows the name of the command in front of all frames in the Command column. Otherwise, it will show the name of the command only in front of the SSP command frame.
Decode CDB of Commands: The spreadsheet shows name of command in command column, otherwise shows CDB of command in command column.
Show ‘Sector Count’ instead of ‘Xfer Length’ (SATA only): Display sector count.
Column View Tab
Figure 3.129: SAS: Software Settings Dialog Column View Tab
The SATA Software Settings dialog has the same options.
Sierra M6‐1 SAS/SATA Protocol Analyzer User Manual
207
LeCroy Corporation
Spread Sheet View Tab
Other
Display pre‐filtered cells as blank in column view: The software shows pre‐filtered data (already filtered in the capture project), as blank cells. Otherwise, it will show them as “pre‐filtered” cells.
Show Warning in Search Primitive In Column View: If searching in Column View takes a long time, the software asks if you want to continue search. Otherwise, the software continues searching with no pause.
Column View Packet Size: Specifies the allocated buffer for showing rows of a packet in Column View: When you see “Too Large” in a Column‐View cell, the current allocated buffer is not enough and you should increase it by changing this setting.
Column View Memory Size: Displays the memory buffer.
Field List View Tab
Figure 3.130: SAS: Software Settings Dialog Field List View Tab
The SATA Software Settings dialog has the same options.
For additonal information on Field List View, refer to “Histogram View” on page 151.
208 Sierra M6‐1 SAS/SATA Protocol Analyzer User Manual
Sampling Memory Usage Optimization
LeCroy Corporation
Update Filed List based on
Text view: The software updates the contents of the Field List based on the current Text View.
Spreadsheet view: The software updates the contents of the Field List based on the current Spreadsheet View.
Mode of frame field list
Transport: Shows decoding of transport layer.
Application: Shows decoding of Application layer.
Both: Shows decoding of both transport and application layers.
Other
Payload field length: Specifies the number of bytes that are shown in the field list for payload fields.
Show Field List as embedded In frame/spreadsheet views: The Field List is embedded in frame/spreadsheet views. Otherwise, it will open as a separated view.
Show Field List in Column View: The software embeds the Field List in the column. Otherwise, the Field List is not in Column View.
Sampling Memory Usage Optimization
The Software Settings dialog has a Sampling Memory Usage Optimization option. This Memory Assignment (MA) feature optimizes sampling memory utilization.
If the Sampling Memory Usage Optimization Option is Checked
The system tries to use empty space in all memory banks to prevent any memory bank from filling completely. Each physical link is not necessarily assigned to a specific memory bank. The system can capture more sample data than if the MA option is unchecked, and sample file size is closer to the user‐defined Sampling Memory Size.
Memory Assignment efficiency varies with Port Configuration and Trigger Position:
FPGA: The Memory Assignment feature works for a pair of ports connected to one FPGA, for example ports 1 and 2 (or ports 3 and 4). Memory Assignment does not work for two ports connected to different FPGAs, for example ports 1 and 3.
Triggering: Memory Assignment only starts after the trigger point. During
pre‐trigger, each physical link is always assigned to a specific memory bank.
Post‐trigger, the system can try to use empty space in all memory banks, if you check the MA option. Therefore, Memory Assignment efficiency is maximum when Trigger Position is set to 0% (snap‐shot trigger) and is minimum when Trig‐
ger Position is set to 99% or when there is no triggering (you stop recording man‐
ually).
MUX: When MUX is enabled, each segment has four memory banks, limiting Memory Assignment somewhat.
Sierra M6‐1 SAS/SATA Protocol Analyzer User Manual
209
LeCroy Corporation
Sampling Memory Usage Optimization
Here are examples of different Port Configurations and Trigger Positions:
One port configuration (A ‐ ‐ ‐): Sample size is user‐specified sample size.
Two port configuration (AA ‐ ‐): Ports 1 and 2 are on the same FPGA, so Memory Assignment has an effect. If you use snapshot triggering, the sample size is near specified size.
Two port configuration (AA ‐ ‐): If you use manual stop, Memory Assignment has no effect. Sample size depends on port traffic loads.
Two port configuration (AA ‐ ‐): If trigger is set at 50%, and there is enough data to fill pre‐trigger, Memory Assignment has an effect. Sample size is typically near specified size.
Two port configuration (AA ‐ ‐): If trigger is set at 50%, but there is not enough data to fill pre‐trigger, Memory Assignment has an effect. Sample size is typically more than half specified size, with size determined by the amount of data cap‐
tured before trigger.
Two port configuration (A ‐ A ‐): Ports 1 and 3 are not on the same FPGA, so Memory Assignment has no effect. If one port has heavy traffic, it may fill its memory bank and stop recording, resulting in smaller sample size than speci‐
fied.
Note: Checking this option does not affect the sample. It only allows larger sample sizes.
Note: If traffic is balanced on ports, sample size is the same whether you check or uncheck the Sampling Memory Usage Optimization option.
Note: Memory Assignment depends on traffic load distribution at the time when the system tries to re‐assign physical links to memory banks. Therefore, if you repeat a capture with the same Sampling Memory Size and Segment Number parameters, the resulting sample size may not be the same. However, if traffic load distribution is similar, sample size will be similar. Note: The buffer status indicator shows buffer by FPGA, not by port.
If the Sampling Memory Usage Optimization Option is Not Checked
Each physical link (or logical link if MUX is enabled) is assigned to a specific memory space (memory bank), depending on the Sampling Memory Size and Segment Number parameters.
Important: If any physical link fills its memory bank, the recording process stops. Other memory banks will typically be less than full (and can be empty). The sample file might be smaller than the user‐defined Sampling Memory Size. You might even think that the Analyzer malfunctioned. 210 Sierra M6‐1 SAS/SATA Protocol Analyzer User Manual
LeCroy Corporation
Floating License
Floating License
Note: License Manager is only available when in Cascading mode.
To manage the license, select Setup > License Manager.
The Floating License dialog displays the available functionality by Function, Total Ports, Assigned To ports, and Not Used. It also displays the Current License Configuration by License Type, Serial Number, Analyzer, Device Emulator, Host Emulator, and InFusion.
Figure 3.131: Floating License Dialog
Sierra M6‐1 SAS/SATA Protocol Analyzer User Manual
211
LeCroy Corporation
External Trig Setting
External Trig Setting
The External Trig Setting dialog displays the External Trig Out Setting and External Trig In Setting as High Active, Low Active, or Toggle.
Figure 3.132: External Trigger Setting Dialog
To display the External Trig Setting dialog, select Setup > External Trig Setting.
External Trig Out Setting
The Analyzer can send a Low or High external signal anytime a trigger occurs. Select the External Trig Out Setting: High Active, Low Active, or Toggle from High to Low or Low to High once (3.3 V output).
Enter the External TrigOut pulse width.
External Trig In Setting
An external Low or High input signal can cause triggering. Select the External Trig In Setting: High Active, Low Active, or Toggle from High to Low or Low to High once (3.3 V output).
212 Sierra M6‐1 SAS/SATA Protocol Analyzer User Manual
LeCroy Corporation
Update Device
Update Device
The Update Sierra Device command allows you to update a Sierra M6‐1 Analyzer or CATC‐
Sync expansion card whose current version is incorrect.
1. Click Setup > Update Sierra Device to display the Device Setup dialog.
Figure 3.133: Device Setup Dialog with BAD Device Status
Devices whose version is correct have an OK status.
A device whose version is incorrect has a BAD status.
Note: You can click the ellipses (...) at the end of a file path and name to display an Open dialog, in which you can browse for files.
2. Click the checkbox to the left of a device with BAD status, then click Update Selected to begin the process that will make the Analyzer version correct.
Figure 3.134: Device Setup Dialog Beginning to Update Status of a Device
After the update, the device must restart.
Sierra M6‐1 SAS/SATA Protocol Analyzer User Manual
213
LeCroy Corporation
Update Device
Figure 3.135: Info Dialog
Then the update is complete.
Figure 3.136: Device Setup Dialog with DONE Device Status
214 Sierra M6‐1 SAS/SATA Protocol Analyzer User Manual
User‐Defined Decoding
LeCroy Corporation
User-Defined Decoding
User‐defined decoding allows you to create a definition file to interpret commands and frames that are not in the standard set recognized by the software.
Select Setup > User Defined Decoding to open the User Defined Decoding dialog.
Figure 3.137: SAS: User Defined Decoding
SAS vs. SATA: SAS adds SCSI Commands, SSP Frames, and SMP Frames.
Check ATA Commands and/or STP frames. Click the ellipses next to a command type text box to display the Open dialog. Choose an appropriate script file and click Open.
Figure 3.138: Choosing a Script File
Sierra M6‐1 SAS/SATA Protocol Analyzer User Manual
215
LeCroy Corporation
Help Menu
Help Menu
Help Topics
Displays online help. You can also select F1.
VSE Help Topics
Displays VSE online help. You can also select F1. Update License
A current license agreement with LeCroy entitles the Analyzer owner to continued technical support and access to software updates as they are published on the LeCroy website. When you obtain a license key, from the Help menu select Update License to display the Select License Key File dialog box. Enter the path and filename for the license key, or browse to the directory that contains the license key and select the *.lic file. Click Open.
Display License Information
Open a license information dialog to display a list of named features supported by the current software version (see Figure 3.139 on page 217).Named features that are not enabled on your system are indicated by No in the Purchased column. Whether or not named features are enabled depends on the license key stored in your analyzer. If you try to use a feature for which you do not yet have a license, the program displays the License Protection Message. To use the feature, you must purchase a license.
216 Sierra M6‐1 SAS/SATA Protocol Analyzer User Manual
LeCroy Corporation
Help Menu
Figure 3.139: Licensing Dialog
Sierra M6‐1 SAS/SATA Protocol Analyzer User Manual
217
LeCroy Corporation
Help Menu
Check for Updates
Check whether a new software version is available. If so, you can download from the LeCroy web site.
You can select to Check for updates at application startup.
Figure 3.140: Check for Updates
About
Displays version information.
Self Test
You can use the built‐in RAM self‐test utility. Select Setup on the main menu bar and choose Self Test to open the Self Test dialog.
Figure 3.141: SAS: Self Test Command on Tools Menu
218 Sierra M6‐1 SAS/SATA Protocol Analyzer User Manual
LeCroy Corporation
Help Menu
Clock Check
To perform a Clock check, choose the clock to test and click the Start Clock Check button. After a short time, the Test Result appears to the right of the selected line.
Figure 3.142: SATA: Self Test Dialog Clock Tab
Test Result: OK or Error
If a test is OK and you specified one run, the Test Result is OK: 1 times.
If a test has an error and you specified one run, the Test Result is Error: 1 times.
Saving
You can save any check result by checking the Save error details check box and specifying a destination file name.
Sierra M6‐1 SAS/SATA Protocol Analyzer User Manual
219
LeCroy Corporation
Help Menu
Number of Runs Each Test
You can specify to run a test more than once.
Run All Tests Sequentially
This option runs all items in the Clock, Memory, Serdes, Crosspoint, Main FPGA, Expansion, and LED/Buzzer tests in order. After you check this check box, the command button becomes Start All Tests. You must click the Stop Test button on the LED/Buzzer tab to stop the check.
Memory Check
To perform a SDRAM or Exerciser RAM memory check, select the Memory tab.
Figure 3.143: SAS: Self Test Dialog Memory Tab
Choose the SDRAM, Exerciser Data, or Exerciser Instruction to test and click the Start Memory Check button. After a short time, the Test Result appears to the right of the selected line.
220 Sierra M6‐1 SAS/SATA Protocol Analyzer User Manual
LeCroy Corporation
Help Menu
Serdes Check
To perform an FPGA 1 or 2 Serdes Chip check, select the Serdes tab.
Figure 3.144: SATA: Self Test Dialog Serdes Tab
Choose the n FPGA 1 or 2 Serdes Chip to test and click the Start Serdes Check button. After a short time, the Test Result and Marvel Failure Type appear to the right of the selected line. Marvel Failure Type indicates the error type.
Sierra M6‐1 SAS/SATA Protocol Analyzer User Manual
221
LeCroy Corporation
Help Menu
Crosspoint Check
To perform a Crosspoint‐Crosspoint bus test or Crosspoint external loop back, select the Crosspoint tab.
Figure 3.145: SATA: Self Test Dialog Crosspoint Tab
Choose the Crosspoint Interconnection Pair or External loop back to test and click the Start Crosspoint Check button. After a short time, the Test Result appears to the right of the selected line.
222 Sierra M6‐1 SAS/SATA Protocol Analyzer User Manual
LeCroy Corporation
Help Menu
Main FPGA Check (SATA only)
To perform an Inter‐FPGA Connection check, select the Main FPGA tab.
Figure 3.146: Self Test Dialog Main FPGA Tab
Choose the Inter‐FPGA Connection test and click the Start Main FPGA Check button. After a short time, the Test Result appears to the right of the selected line.
Sierra M6‐1 SAS/SATA Protocol Analyzer User Manual
223
LeCroy Corporation
Help Menu
Expansion Check
To perform a Expansion Card Data Status or Clock Status check, select the Expansion tab.
Figure 3.147: Self Test Dialog Expansion Tab
Choose the Expansion Card Data Status or Clock Status to test and click the Start Expansion Check button. After a short time, the Test Result appears to the right of the selected line.
224 Sierra M6‐1 SAS/SATA Protocol Analyzer User Manual
LeCroy Corporation
Help Menu
LED/Buzzer Check
To perform a LED or Buzzer check, select the LED/Buzzer tab.
Figure 3.148: Self Test Dialog LED/Buzzer Tab
Check LED Test or Buzzer Test and click the Start LED/Buzzer Check button. For the LED, you should see the LED pattern. For the buzzer, you should hear it sound. You must click the Stop Test button to stop the check.
Sierra M6‐1 SAS/SATA Protocol Analyzer User Manual
225
LeCroy Corporation
Help Menu
Find DUT
Saving device information allows you to import the specific device information into the Target/Device emulator.
The Find DUT utility obtains all vendor‐specific information and detailed device parameters.
Find device finds any devices that are attached to any port.
Select Setup on the main menu bar and choose Find DUT.
Figure 3.149: SATA: Find Device Command on Tools Menu
The Find DUT dialog opens. See following screen capture.
226 Sierra M6‐1 SAS/SATA Protocol Analyzer User Manual
LeCroy Corporation
Help Menu
Figure 3.150: SAS: Device Identifier Dialog
Sierra M6‐1 SAS/SATA Protocol Analyzer User Manual
227
LeCroy Corporation
Help Menu
Click the Find Device button to search for connected devices. After a brief period, the dialog displays all device information.
Figure 3.151: SAS: Identified Devices
Click a device in the Device List to display information about that device.
Aliasing
You can enter a 16‐character alias name for a device. In the Device List, right‐click the device name and enter an alias after the colon.
The alias name appears in the Device List. Exporting
You can export a device specification to a text file. Click the Export button to open the Export dialog. 228 Sierra M6‐1 SAS/SATA Protocol Analyzer User Manual
LeCroy Corporation
Help Menu
Compliance Test (SATA)
The Compliance Test consists of a set of selectable tests to verify compliance with the SATA specification. SATA compliance is at UTD Rev 1.4.
Note: The tests follow the LeCroy MOI, which is described in the
SATA_Digital‐Device_MOI_LeCroy_1.00_UTD1.4.pdf file in the installed Documents directory.
Note: You can start tests using the command line. The SAS/SATA Protocol Suite API Reference Manual, Section 2.12, starting on page 153, explains how to write VB scripts to automate compliance tests and generate results as RTF files.
To run a Compliance Test:
1. Select Tools on the main toolbar and choose Compliance Test to open the Compliance Test dialog.
Figure 3.152: SATA: Compliance Test Selection
Sierra M6‐1 SAS/SATA Protocol Analyzer User Manual
229
LeCroy Corporation
Help Menu
The Digital Test Group has:
General Device Requirements: GTR‐01 through GTR‐05
Native Command Queuing: NCQ‐01 through NCQ‐05
Asynchronous Signal Recovery: ASR‐01 and ASR‐02
Software Settings Preservation: SSP‐01 through SSP‐12
Interface Power Management: IPM‐01 through IPM‐11
Digital Optional Features: DOF‐01 and DOF‐02
The PHY Test Group has tests OOB‐03 through OOB‐07.
2. Choose the tests in the left pane of the dialog and click the Add>> button.
3. Enter a value for Capture Timeout.
Note: If test running time exceeds the Capture Timeout value, the test terminates.
4. Enter the Device Name.
5. Select the UTD Version as UTD 1.3 (for devices supporting up to SATA 2.6 specification) or UTD 1.4 (for devices supporting up to SATA 3.0 specification).
6. Select the Compliance Type as Host or Device.
7. Select the Device Type as ATA or ATAPI.
8. When testing SSD devices, select the SSD Drive checkbox, to ensure correct test results.
9. To view failed test traces in the sample viewer, check the Automatically load failed test traces into STX trace viewer check box.
10. To save the failed test traces only, check the Save only failed test traces check box.
11. Enter a path and file name for the Compliance Report file, or use the default file name and path:
C:\Program Files\LeCroy\SATA Protocol Suite\User\Compliance_Device1.rtf
12. Enter a path and file name for the Saved Traces, or use the default folder:
C:\Program Files\LeCroy\SATA Protocol Suite\User\
13. After you select tests, click Start. 14. The test runs and, after a brief period, displays the result.
230 Sierra M6‐1 SAS/SATA Protocol Analyzer User Manual
LeCroy Corporation
Help Menu
Figure 3.153: Compliance Test Result
15. To save the current compliance setup for later use, click the Save button to open the Save As dialog. Assign a meaningful name to the setup and save it as a *.cst compliance file.
16. To run a previously defined setup, click the Load button and choose a previously defined setup to run.
Note: When you are running Compliance Test, do not connect the analyzer to the Host if testing a Device. Do not connect the analyzer to the Device if testing Host. Such improper connections can impact compliance‐test result validity. Sierra M6‐1 SAS/SATA Protocol Analyzer User Manual
231
LeCroy Corporation
232 Help Menu
Sierra M6‐1 SAS/SATA Protocol Analyzer User Manual
Chapter 4
InFusion Overview
The LeCroy InFusion™ Error Injector and Traffic Modifier is an error injector and traffic modification tool that allows you to verify real‐world fault handling for Serial Attached SCSI (SAS) and Serial ATA (SATA) systems. InFusion can sit unobtrusively in the data path on a live system to programmatically alter or corrupt traffic. InFusion is the ideal tool for stress‐testing systems using actual workloads.
Figure 4.1: InFusion Windows
InFusion supports SAS SSP, SMP, STP, and SATA‐based protocols operating across a single SAS or SATA link up to 6 G. InFusion monitors traffic from both directions in real‐time and relies on predefined rules to replace any bit, primitive, or parameter with one you specify. Sierra M6‐1 SAS/SATA Protocol Analyzer User Manual
233
LeCroy Corporation
Key Features
InFusion can change traffic when it detects a specific sequence or reaches a designated time interval, yet it requires no complicated scripts, programming, or simulation tools.
InFusion can monitor traffic in both directions and act on events occurring in either direction of the communications link. InFusion can modify traffic in only one direction within a given test scenario, but that direction can be either from the Initiator or from the Target.
InFusion is specifically designed to verify recovery characteristics within a subsystem. An easy pop‐up menu interface allows you to create specific test scenarios in just minutes. Once a InFusion session starts, the system automatically handles protocol handshaking between devices. InFusion transmits a faithful copy of the original data stream down to the CRC value which, if needed, it recalculates. InFusion allows test engineers to systematically verify error recovery in ways not possible with other test platforms.
An Infusion event can trigger an analyzer.
Infusion supports all commands in the SATA 3.0 specification.
Key Features
The key features of InFusion are:
Error Injection: Injects CRC, disparity, 8b/10b encoding, framing, and coding errors.
Break Link Recovery: Programmatically breaks the connection to test link recov‐
ery.
Value Replacement: Monitors the link for specific values, patterns, or primitives (as low as bit level) and replace with user‐defined values. You can replace values on every occurrence, after a specified number of occurrences, or after a speci‐
fied time interval.
Packet Drop: Removes individual primitives, address frames, or data frames from the stream to verify retry behavior.
Primitive Manipulation: Replaces handshaking and flow control primitives to help validate robustness of a design. Traffic Monitoring: Operates as a traffic monitor, collecting statistical data on user‐specified parameters. In this mode, data passes unchanged in both direc‐
tions. Menu‐Driven Interface: Allows easy set‐up of test scenarios.
API based on C++: Allows development of custom test applications.
Scenario Batch Files: Allows scenario scripts.
With respect to traffic modification, in the Link Layer you can modify primitives, CRC, scrambled traffic, and SSP, SMP, and STP connection events. You cannot modify clock skew management, OOB and power management, and signal integrity.
InFusion consists of a hardware device that connects to the line under test and a Windows‐based software application used to create and download test scripts to the device. You also can use the software application to configure and control the device across an Ethernet link.
234 Sierra M6‐1 SAS/SATA Protocol Analyzer User Manual
LeCroy Corporation
Interface
InFusion test scripts are called scenarios. Scenarios determine how the hardware device monitors and modifies line traffic. You must use the application to create and download scenarios.
For the InFusion connections, the device is connected between the SAS/SATA host and the PHY of the test target (DUT). Interface
Buttons
The InFusion interface has the following command buttons:
New Scenario: Begins the scenario creation process by listing Scenario Name, Direction for traffic changes, and Global Rules in the scenario window.
New Batch Script: Starts a scenario batch file in Batch Script window.
Open Library: Lists the InFusion Library Files (.infdb), which contain the available scenarios, in an Open dialog.
Save: Saves the current scenario in the UserData folder.
Print: Prints the current scenario.
Show Library: Displays/hides the Main Library window (on the right), which displays the available scenarios. You can create a new scenario, save a selected scenario, save the library, save a copy of the library, display the selected scenario, insert a copy of the selected item, or delete the selected scenario.
Show Output: Displays/hides the Output window (at the bottom), which displays InFusion output. Use the buttons to save output, print output, display options (automatically save the log file, with a path and size), start logging, stop logging, and clear the Output window.
Show Device Library: Displays/hides the scenarios of the current device library.
Port Configuration: Displays the port configuration dialog. See “Port Configuration for InFusion” on page 240.
Show Analyzer: Returns to the Protocol Analyzer or Target/Host Emulator window.
Show Trainer: Goes to the Trainer window.
Run Batch Script: Runs a scenario batch file.
Stop Batch Script: Stops a running scenario batch file.
Rec Analyzer: Starts recording on the current analyzer, using the current project.
Stop: Stops recording on the current analyzer.
Abort: Aborts recording.
Sierra M6‐1 SAS/SATA Protocol Analyzer User Manual
235
LeCroy Corporation
Interface
Menus
The InFusion interface has the following menus:
File (see command descriptions in the “Buttons” section above)
New Scenario, Open Scenario (File Library or Main Library)
Open an InFusion database (.infdb file)
Launch Analyzer
Launch Trainer
New Batch Script, Save Batch Script As
New Library, Close Library (File Library or Main Library), Save Library, Save Copy of Library As
Open Log File
Print Setup
Recent Trace Files
Recent Project Files
Close
Setup
External Trig Setting (see “External Trig Setting” on page 212)
Update Sierra Device (see “Update Device” on page 213)
All Connected Devices
Status Bar
View
Views (Library, Output, Customize; see window descriptions in “Buttons” section above)
Smart Docking
Toolbar
Status Bar
Configuration
Port Configuration (see “Port Configuration for InFusion” on page 240)
Batch Script Setting (see “Scenario Batch Files” on page 287)
Tools
Browse UserData, System, or InFusion folder.
Help
Help Topics and About InFusion.
236 Sierra M6‐1 SAS/SATA Protocol Analyzer User Manual
LeCroy Corporation
Interface
Main Library
You can Show Main Library.
Figure 4.2: Main Library
The Main Library has Scenarios.
Using the buttons from left to right, you can:
Create a new scenario and save a scenario.
Save a library and save a copy of a library.
View/edit a scenario, insert copy of a scenario and delete scenario.
device ports.
Copy and paste.
Sierra M6‐1 SAS/SATA Protocol Analyzer User Manual
237
LeCroy Corporation
Interface
File Library
You can display the File Library.
Figure 4.3:
File Library
A File Library has Scenarios currently available in the device.
Using the buttons from left to right, you can:
238 New scenario.
Save selected scenario.
Save library.
Save a copy of the library as.
View/edit a selected item.
Insert a copy.
Delete a selected scenario.
Copy
Paste
Sierra M6‐1 SAS/SATA Protocol Analyzer User Manual
LeCroy Corporation
Interface
Device Ports
If a device is connected, the software displays the Device Ports.
Figure 4.4: Device Ports
Using the first row of icons, you can Run/Stop All Ports or Run/Stop individual ports.
The columns display the Port, Function/Configuration, Library, and Scenario.
You can Float, Dock, Auto‐Hide, or Hide the window.
Note: A port row is grayed‐out when that port has not been configured to be a Jammer in the Port Configuration dialog (see “Port Configuration for InFusion” on page 240).
Using the Device Ports Dialog
After you have finished Port Configuration (see “Port Configuration for InFusion” on page 240), you use the Device Ports dialog to assign specific scenarios to ports, so that different scenarios can run on different ports. To assign a scenario to a port, drag and drop the scenario from any library window to the port. The Device Ports dialog then displays the Library and Scenario on the row for that Port/Configuration.
Sierra M6‐1 SAS/SATA Protocol Analyzer User Manual
239
LeCroy Corporation
Port Configuration for InFusion
Alternatively, assign the scenario using the Library and Scenario drop‐down lists.
After you have assigned scenarios to ports, in the first row of icons, use the first green arrow icon to Run/Stop All Ports, or use the numbered green arrows to Run/Stop an individual port.
Note: A port row is grayed‐out when that port is running a scenario.
Port Configuration for InFusion
The InFusion (Jammer) port configurations must match the Analyzer port configurations for the infusion‐analyzer to work. Select Configuration > Port Configuration to display the Set Port Configuration dialog. To record traffic, select Jammer on the port that you want to jam. In the following figure, there is a match on Port 1. Figure 4.5: Ports Configuration Dialog with InFusion/Analyzer Port Match
Note: To display the current Port Configuration, click Show Analyzer to go to the analyzer application, then click the green button in the lower right corner to display the Port Status window (see “Port Status” on page 191).
240 Sierra M6‐1 SAS/SATA Protocol Analyzer User Manual
LeCroy Corporation
InFusion Scenarios
InFusion Scenarios
You can create and execute InFusion scenarios. A scenario is a test script that defines how InFusion monitors and modifies line traffic.
Scenarios Overview
You create scenarios on a PC running the InFusion application. You then assign the scenarios for execution to a desired port on an InFusion device. You can also download up to ten scenarios to each InFusion device.
The InFusion application provides a menu‐driven interface for building scenarios. The interface prompts you for simple decisions and choices from drop‐down menus. As you make your selections, the script takes shape automatically in the scenario window. The script is in the form of simple English sentences. You need not understand any formal scripting language.
Figure 4.6: New Scenario in InFusion Window
Sierra M6‐1 SAS/SATA Protocol Analyzer User Manual
241
LeCroy Corporation
InFusion Scenarios
InFusion Scenario Parameters
Timers
Timers allowed per state/sequence/scenario: 2 timers per state and 6 timers per scenario are allowed.
Events
Events allowed to be used per state/sequence/scenario: For combined events, there is virtually no limit per state/sequence/scenario. Actions
Actions allowed per state/sequence/scenario: A maximum of 8 actions per state, 2048 actions per sequence (8*256 state), 4104 actions per scenario (2*2048 + 8 more in the Global Rules "state"). Monitors
Monitors allowed to be used per state/sequence/scenario: InFusion can keep an account of 8/12 Monitor/Count events per scenario. Random change of use of count and count randomly:
In Global Rules, if a Counter is used for Event counting, 2 extra actions are consumed. 2 more actions are required for "Every Nth occurrence" option. In Sequences, If a Counter is used for Event counting, 3 extra actions are consumed. 3 more actions are required for "Every Nth occurrence" option. Regarding limits on any of the above mentioned connections, i.e., x timers + y monitors are allowed per state where x+y=n: There are a lot of big/small rules checked by the scenario compiler, but as a rule of thumb: 8 actions per state are available
12 counters globally are available, each assigned permanently to a certain job 6 available timers per scenario 12 programmable multi‐purpose resources for DWORD comparison/substitution/capture are available. If a pattern detector uses 3 of these resources to trigger on a specific frame on the bus, only 9 more resources are available for other tasks. Frame/FIS type detectors are excluded from this rule, because they use their own dedicated resources. 8 primitive detectors are available
If you want to trigger on a pattern (Frame/FIS) and change/capture a dword(s) before the last offset of a detected pattern (e.g., changing the Frame Type of a SAS Frame with Data Offset == 11223344), you are limited to a maximum of 9 dword offset (i.e., if you trigger on the 20th payload of a Data FIS, you can change/capture the 12th dword onwards. 11th payload dword and preceding dwords are not accessible for change/capture) 242 Sierra M6‐1 SAS/SATA Protocol Analyzer User Manual
LeCroy Corporation
InFusion Scenarios
You can not change a state based on back‐to‐back events. At 6G speed, there should be at least one dword between the triggering event of two consecutive states. At other speeds, back‐to‐back dword state transitions might rarely be missed, so best practice is to never assume back‐to‐back dword events. As described later in this chapter, you can create any number of scenarios and store them in libraries on the PC hard drive. Scenario library files names are in the following format: <filename>.infdb
Creating InFusion scenarios is easy, but it requires an understanding of the following terms defined in Table 1.
TABLE 4.1: Key Scenario Terms
Term
Action
Event
Combined Event
Global Rules
Sequence
State
Definition
InFusion response to an event.
Condition that is detectable by InFusion.
Logical OR association of events (for example, event A OR event B).
Portion of a scenario that can define a single InFusion test state. You can think of the Global Rules and each sequence as a separate test routine or program operating within the scenario. Each operates independently and in parallel with the others. The purpose of each is to detect events and then respond with the appropriate action or set of actions. In essence, you can operate up to three test states simultaneously within InFusion.
Portion of a scenario that can define multiple InFusion test states. More flexible than the Global Rules, a sequence allows more powerful scenarios that include branching and looping between test states (Global Rules can define only a single test state, so there is no branching).
“Behavior” of the Global Rules or a sequence at any point in time. In terms of InFusion testing, behavior is “waiting” for a set of events and responding with a set of actions.
Sierra M6‐1 SAS/SATA Protocol Analyzer User Manual
243
LeCroy Corporation
InFusion Scenarios
Global Rules
Global Rules are a portion of the scenario that can define only one test state. To create the Global Rules, you use the menu‐driven interface to enter an event or combined event and the corresponding action or set of actions (the response of InFusion hardware to the event).
In the case of a combined event, the action is taken upon occurrence of any of the events stated for the event combination. It is a logical OR association, meaning any of the events can trigger the action.
After you enter the event or combined event, the interface prompts you for actions. An action might be, for example, injecting a particular primitive or error into the traffic stream. You can enter multiple actions, which take place simultaneously. After defining the event and actions within the Global Rule area, you can save the scenario and download it to a InFusion device.
Sequences
The Global Rules are all you need for simple test scenarios. However, a scenario also can contain one or two sequences, which can define multiple states and allow branching between states. With a sequence, you also can do looping, which allows you to repeat a test state or to execute a test for a specified period of time.
As with Global Rules, the menu‐driven interface guides you in building a sequence. Some of the prompts are different, however, because you now are encapsulating groups of events and actions as distinct states. Recall that a state is a combination of events and actions at a specific point in time. If the event or combined event defined by a state occurs, the corresponding action or set of actions follows.
Figure 4.7: Global Rules and Sequence Areas of a Scenario
InFusion hardware provides the capacity to have up to two sequences co‐existing in a scenario in addition to the Global Rules. Recall that both the Global Rules and any sequences are active at all times. Each is a separate “state machine,” having the behavior of a particular test state at any point in time. Because the Global Rules has the capacity for only one state, you can view it as a “degenerative state machine.”
244 Sierra M6‐1 SAS/SATA Protocol Analyzer User Manual
LeCroy Corporation
InFusion Scenarios
Scenario Libraries
You can create any number of scenarios, which you then can archive on your PC hard drive. You also can download up to ten scenarios to each InFusion device for test execution. You can think of the libraries as windows that hold scenarios. Recall that each library is a separate *.infdb file.
Main Library
When you launch the InFusion application, it opens a window called the Main Library. The main library is the default workspace for creating and storing new scenarios. The main library corresponds with the following file in the InFusion folder on the PC hard drive:
default.infdb
File Libraries
You can save the main library with a name other than default (while still using the .infdb file extension). The new file becomes a file library that is functionally equivalent to the main library with the following exception: It does not open by default in the Main Library window. You can navigate to other file libraries using the File Manager of the InFusion application.
In this manual, the main library and other .infdb file libraries are collectively called general libraries.
If you select Open Library, you see a window similar to the following:
Figure 4.8: Open Library File List
Sierra M6‐1 SAS/SATA Protocol Analyzer User Manual
245
LeCroy Corporation
InFusion Scenarios
By selecting the TestCasesForSATA.infbd file, you get an additional library window with predefined SATA test cases, similar to the following:
Figure 4.9: Test Cases for SATA Library
Device Libraries
In addition to general libraries, the application defines device libraries. Each device library is associated with a specific InFusion device. Each device library opens in a separate Device Library window and holds up to ten InFusion scenarios for the device. When you connect to the device and click the entry for that device in the Device List, the device library for the device opens automatically. The scenarios that appear in the device library are those currently stored on the corresponding device. They were uploaded from the device to your PC when you opened the device library. You can click any of the scenarios listed to open it for editing. When you are finished with your edits, you can use the buttons on the Device Library toolbar to download the revised scenario to the device.
The None scenario is an empty and undefined scenario to allow you to assign port(s) to None.
The Multiport feature allows you to run a scenario by more than one port in a Device Library and to assign different ports to different scenarios and run them together. Each scenario in a library can run by more than one port.
246 Sierra M6‐1 SAS/SATA Protocol Analyzer User Manual
LeCroy Corporation
InFusion Scenarios
Scenario Properties
To begin the scenario creation process, you click the New Scenario button in a library window or on the InFusion application toolbar. As the first step in creating a scenario, the application prompts you for scenario name, a short description (optional), and the direction of traffic to which any traffic changes apply. Changes are, for example, injection or removal of data or a primitive.
You identify direction of traffic change, or modification, in terms of traffic origin. The application uses the following conventions:
From Initiator: Change is made to traffic coming from test host (for example, CRC error is injected into traffic stream sent from initiator to target).
From Target: Modification is made to traffic coming from the target (for exam‐
ple, CRC error is injected into traffic stream sent from target to initiator). The figure shows the first prompt in the scenario creation process (Figure 4.10 on page 247).
Figure 4.10: Entering Basic Scenario Information
To copy an event or action, right‐click on the event or action and select Copy.
Right‐click Click here to add another event or Click here to add an action and then select Paste. To copy a sequence or state, right‐click on the sequence or state and select Copy.
Right‐click Click here to add another sequence or Click here to add another state and then select Paste. You can also cut, delete, and edit a selected sequence, state, event, or action.
When you click the Scenario Name or the Direction For Traffic Changes, the Scenario Properties dialog box displays (see Figure 4.11 on page 248), allowing you to enter the scenario name, a short description, and direction of traffic change.
Sierra M6‐1 SAS/SATA Protocol Analyzer User Manual
247
LeCroy Corporation
InFusion Scenarios
Figure 4.11: Scenario Properties Dialog Box
In the Scenario Properties screen, the direction for traffic modification is defined on a global basis for the entire scenario. In other words, any scenario action that modifies line traffic only affects the traffic flowing in the direction established at the top of the scenario, in the Scenario Properties. Scenario events can be monitored in either direction, and therefore the parameters for events provide the ability to specify the intended direction for monitoring traffic for that event.
SATA Smart Hold Option
Figure 4.12: SATA Scenario Properties Dialog Box
248 Sierra M6‐1 SAS/SATA Protocol Analyzer User Manual
LeCroy Corporation
InFusion Scenarios
SATA Scenario Properties have a Smart Hold option, which is on by default. Each port monitors incoming data, which originated with the other device’s receiver, as close as possible to where it enters the bus engine. If a port detects a HOLD primitive during a SATA frame, the port stops reading data from the FIFO and generates HOLDA. The HOLD propagates through the bus engine and eventually goes to the other device, where the HOLD causes the other device to send HOLDA. (The bus engine FIFOs must be deep enough to hold all the traffic that the other device sends while the HOLD propagates. The port drops all incoming HOLDA conditions, so HOLDAs are never put in the FIFOs or made visible to the sequencers.)
After this, the port that had been receiving the HOLD stops sending HOLDA and attempts to read data from the FIFO. The termination of HOLD propagates through the bus engine and then causes the other device to restart transmission, which puts data into the FIFO.
Note: If both sides send HOLD primitives that overlap, the receivers drop the HOLD conditions to avoid overflowing the FIFOs. If you turn off the Smart Hold option, the port does not send HOLDA when it detects a HOLD primitive during a SATA frame.
Sierra M6‐1 SAS/SATA Protocol Analyzer User Manual
249
LeCroy Corporation
Scenario Events
Scenario Events
A scenario is a script you create using simple mouse clicks and text entries. As you work, the script takes shape in the scenario area of the application display. You can think of the scenario area itself as consisting of two subareas: A Global Rules area at the top, where you create the Global Rules, and a Sequence area beneath the Global Rules, where you create any sequences. Whether you are creating Global Rules or a Sequence, the menu‐
driven interface prompts you to specify the event(s) for which you want to trigger actions.
Figure 4.13: Event Properties Dialog
250 Sierra M6‐1 SAS/SATA Protocol Analyzer User Manual
LeCroy Corporation
Scenario Events
While many events are line conditions, an event also can be a condition that occurs within a InFusion device (for example, detection of a trigger signal from another device).
The following table lists supported events. Note that some events are applicable only in the context of creating sequences (those events appear on the drop‐down list only if you are creating a sequence). Sequences can have multiple states, and they allow branching between states.
Sierra M6‐1 SAS/SATA Protocol Analyzer User Manual
251
LeCroy Corporation
Scenario Events
TABLE 4.2: Events
Event
Address Frame
Analyzer Trigger
Description
Occurrence of a specified address frame.
Trigger on Analyzer when its event matches. You can see the trigger on the Status Bar, but the Port Status dialog does not display any mark in the Trigger column. Note: This is different than the external trigger mechanism. You do not need an external trigger cable.
Note: When the analyzer triggers, it triggers on a packet before the actual trigger event occurs. The trace triggers more than 1us before the event actually occurs. The trigger is on the Initator side instead of the Target side as set in the scenario. Any DWORD
Occurrence of any DWORD.
ATA Command
Occurrence of a particular ATA command.
ATA Command Frame
Occurrence of a particular ATA command frame.
[+] ATAPI
Occurrence of a particular ATAPI command from the list:
MMC4, RBC, SBC2, SMC2, SPC2, SPC3, or SSC2.
Both Links Up
Occurrence of both line ports active (not idling).
CRC Error
Occurrence of a CRC error.
DWORD Matcher
Occurrence of a particular DWORD.
FIS Frame
Occurrence of a particular FIS frame.
FIS Type
Occurrence of a particular SATA FIS type.
Frame Type
Occurrence of a particular frame type.
Invalid 10bit‐code Error Occurrence of an invalid 10b code.
Links Speed 3G
Both lines operating at 3 Gbps.
Links Speed 6G
Both lines operating at 6 Gbps.
OOB Signal
Occurrence of OOB signal.
[+] Primitives
Occurrence of Primitive Group, SAS Primitive, or SATA Primitive.
Running Disparity Error Occurrence of Running Disparity (RD) error.
SAS Data Pattern
Occurrence of a particular data pattern in a SAS frame.
SATA Data Pattern
Occurrence of a particular data pattern in a SATA frame.
{+} SCSI
Occurrence of a particular SCSI command from the list:
MMC4, RBC, SBC2, SMC2, SPC2, SPC3, or SSC2.
SMP Frame
Occurrence of a particular SMP frame.
SNW
Occurrence of Final SNW, SNW1, SNW2, SNW3, Train SNW
SSP Frame
Occurrence of a particular SSP frame.
Timer
Occurrence of a particular elapsed time (time period).
Trigger Input
Occurrence of input trigger.
The following sections provide some additional details about three of the above events.
252 Sierra M6‐1 SAS/SATA Protocol Analyzer User Manual
LeCroy Corporation
Scenario Events
DWORD Matcher
DWORD Matcher is a DWORD pattern matcher that presents match and mask fields and a K‐Code Mask field. K‐Codes are control characters that are always used in the first byte of a four‐byte primitive. Of the K‐Code masks listed in the menu, D‐D‐D‐D is used for data bytes, and K‐D‐D‐D is used for all primitives.
When you create a DWORD match, keep the following in mind:
The pattern can be inside or outside of frames (it does not matter if the pattern is inside a frame or not).
Because the pattern can be inside or outside of frames, there is no offset.
You can make user‐defined primitives. (This is the reason this feature was cre‐
ated.)
You can use any K/D pattern.
SAS Data Pattern
When you create a SAS data pattern, keep the following in mind:
The pattern must be defined inside a frame that starts with a SOF or SOAF.
The pattern must be data only (no K‐codes/primitives).
The pattern must be defined at a specific offset in the frame.
The pattern and mask must be specified in the same format as specified in the SAS standard:
0x12345678 (hex)
where “1” is the first digit on the cable and is the MSB as given in the SAS Stan‐
dard.
For example, for an SMP Request:
Pattern: 0x40000000
Mask: 0xFF000000
Offset: 0
SOF Type: SOF
SATA Data Pattern
When you create a SATA data pattern, keep the following in mind:
The pattern must be defined inside a frame that starts with a SATA_SOF.
The pattern must be data only (no K‐codes/primitives).
The pattern must be defined at a specific offset in the frame.
The pattern and mask must be specified in the same format as specified in the SATA Standard.
For example, for Register H ‐> D FIS:
Pattern: 0x00000027
Mask: 0x000000FF
Offset: 0
SOF Type: SATA_SOF
Sierra M6‐1 SAS/SATA Protocol Analyzer User Manual
253
LeCroy Corporation
Scenario Actions
Scenario Actions
After you enter the set of events for a test state, the menu‐driven interface prompts you for the corresponding action or set of actions. If you define multiple actions, the actions occur simultaneously.
Figure 4.14: Action Properties Dialog
The following table lists supported actions. Note that some of these actions only apply to creating sequences.
254 Sierra M6‐1 SAS/SATA Protocol Analyzer User Manual
LeCroy Corporation
Scenario Actions
TABLE 4.3: Test State Actions
Action
Beep
Branch to Existing State1
New State1
Capture Data DWORD
Inject
CRC Error
Invalid 10bit‐code Error
Running Disparity Error
Insert
Address Frame
FIS Frame
SAS Primitive
SMP Frame
SSP Frame
Insert DWORD
Link
Disconnect
Reconnect
Monitor/Count
Remove
Frame Partially
Primitive
Whole Frame
Restart
All Sequences1
Current Sequence1
SNW
Speed Negotiation Retime
Speed Negotiation Violation
Stop Scenario
Substitute Data DWORD
with SAS Primitive
with SATA Primitive
Trigger Output
Description
Emits audible sound of duration. Select via drop‐down list.
Go to a state in this sequence that is already defined.1
Go to a state in this sequence that is not yet defined (you need to define it).1
Captures a data DWORD into one of four registers.
Injects a CRC error into the line.
Injects invalid 10b code into the line.
Injects a Running Disparity (RD) error into traffic.
Inserts a frame or primitive.
Inserts DWORD.
Puts both InFusion SAS ports at electrical idle immediately.
Starts traffic pass‐through immediately. This action restarts traffic after a previous disconnect command. Once traffic is passing through, the initiator and target resume OOB signaling.
Opens a window to count the number of events that occur during a session. A session is a time interval during which a scenario runs.
Removes the targeted event from the traffic.
Restart all sequences in the scenario.1
Restart the sequence that contains this action definition. 1
Set RCDT, SNTT, ALT/TLT, TX speed, TRAIN/TRAIN_DONE pattern, and/or PHY Capability.
Set Violation Type.
Stops all scenario activity.
Substitutes a data DWORD in the traffic.
Substitutes a SAS primitive in the traffic.
Substitutes a SATA primitive in the traffic.
Sends a signal out the trigger port to the device downstream.
1
Only shown in Action Properties dialog box when creating a sequence.
Sierra M6‐1 SAS/SATA Protocol Analyzer User Manual
255
LeCroy Corporation
Scenario Actions
Using Counters in Events and Actions
Many of the events and actions supported by InFusion also support counters that can control functions.
Within events, counters determine how many times the event must occur before the associated actions are triggered. Event counters typically have two properties:
Count Randomly: Can be set to “Yes” or “No” (default value is “No”).
If set to “Yes”, the event repeats a random number of times (between 1 and the value set in the property Max Random Count, which replaces the property Counter Value when “Yes” is selected), before the action is triggered.
Counter Value: Number of repeats required when Count Randomly is set to “No”. The default value is 1.
Within actions, counters determine how many times the system calls the action before it acts. Action counters typically have two properties:
Random: Can be set to “Yes” or “No” (default value is “No”).
If set to “Yes”, the action triggers a number of occurrences before the action takes place. That number ranges randomly between 1 and the value set in the property At least every Nth occurrence, which replaces the property Every Nth occurrence when “Yes” is selected.
Every Nth occurrence: Number of times the system calls the action before it acts.
Note that there is some overlap in the way these counters can be used. For example, in the simple case of a single event leading to a single action, it makes no difference whether you specify the event to require five repeats before triggering the action, or the action to require five occurrences before it acts.
However, in the case of combined events and/or actions, the separate counters provide flexibility in designing test cases. For example, consider the case where Event_1 OR Event_2 leads to Action. If Event_1 has a counter of 5, then the Action triggers either when Event_1 has repeated five times or when Event_2 happens the first time, whichever occurs first.
But if the event counters are set to 1 and the Action counter is set to 5, then the Action happens after five occurrences of EITHER Event_1 or Event_2.
256 Sierra M6‐1 SAS/SATA Protocol Analyzer User Manual
LeCroy Corporation
Scenario Actions
Capturing a Data DWORD
InFusion provides the ability to capture individual data DWORDs and provides four different registers to store captured DWORDs (DWORD #0, #1, #2 and #3).
To capture a data DWORD, select Capture Data DWORD from the Action Properties screen, as shown below. Select the register to be used to store the DWORD from the drop‐down menu under the Capture Register property.
Figure 4.15: Capture Data DWORD Action
Sierra M6‐1 SAS/SATA Protocol Analyzer User Manual
257
LeCroy Corporation
Scenario Actions
Using Captured Data DWORDs
Captured data DWORDs can be used in creating events for data that match the captured DWORD(s), or in creating actions to substitute the captured DWORD(s) into the data stream.
To create an event using the captured DWORD, in the Event Properties menu, select SAS Data Pattern (or SATA Data Pattern), and then select any of the 12 DWORDs (DWORD 0 Type through DWORD 11 Type). The drop‐down menu provides the choice of a custom DWORD or any of the four captured DWORDs. If you select a captured DWORD, the Value field beneath this selection is hidden (the Value field is only used for specifying custom DWORDs). Note that choice of a mask and an offset are still available when using captured DWORDs.
Figure 4.16: Using a Captured DWORD in a SAS Data Pattern
258 Sierra M6‐1 SAS/SATA Protocol Analyzer User Manual
Summary of Scenario Creation
LeCroy Corporation
Captured data DWORDs may also be used in the Substitute Data DWORD test state action. From the Action Properties screen, choose Substitute Data DWORD and then select the Substitute for property. A drop‐down menu is provided (see below) that allows the choice of a custom DWORD or any of the four captured DWORD registers.
Figure 4.17: Using a Captured Data DWORD in Substitute DWORD Test Action
Summary of Scenario Creation
The suggested process of creating and executing a scenario is as follows:
1. Create a scenario in the main library.
2. Copy the scenario from main library to a device library by drag‐and‐drop with a mouse. (Each device library is associated with a specific InFusion device.)
3. Download all scenarios in the device library to a InFusion device.
4. Select the scenario in the device library that you want to run on the device.
5. To run the scenario, click the Start Scenario button from the Device Library toolbar. The device starts to monitor/modify traffic.
Note: Step 1 is described in detail for each example in following sections. Steps 2 to 5 are described in detail at the end of this chapter.
Sierra M6‐1 SAS/SATA Protocol Analyzer User Manual
259
LeCroy Corporation
Creating Global Rules
Creating Global Rules
This section gives examples for creating the Global Rules area of a scenario. Recall that the Global Rules area defines a single test state. The Global Rules do not have the capacity for multiple states, so that area of a scenario cannot change state.
In terms of InFusion testing, a state defines test “behavior.” In this context, behavior is “waiting” for an event and responding with an action or set of actions that happen simultaneously. Keep in mind that a test state you implement with the Global Rules operates in parallel with the active test state of each sequence in the scenario. In effect, InFusion lets you do up to three line tests at the same time. You can do one test with the Global Rules and a separate test with each sequence you create. You can have up to two sequences in a scenario. The following table summarizes the Global Rules examples that follow.
TABLE 4.4: Global Rules Examples
Example
1
2
3
4
5
6
260 Description
Creating a single event and action (removes a primitive).
Creating a single event and action (replaces a primitive).
Creating a combined event (a logical OR association of multiple events) and an action.
Creating multiple triggers and actions.
Creating multiple actions on a single event.
Using timers.
Sierra M6‐1 SAS/SATA Protocol Analyzer User Manual
Example 1: Creating a Single Event and Action that Removes a Primitive
LeCroy Corporation
Example 1: Creating a Single Event and Action that Removes a Primitive
In this example, the Global Rules area of the scenario waits for each RRDY Normal primitive from the initiator and removes it.
1. Click the New Scenario button in the main library or one of the device libraries.
2. In the Scenario Properties dialog, enter the scenario name, description, and direction of traffic change (see Figure 4.11 on page 248).
3. In the Global Rules area, click the prompt to add an event.
Figure 4.18: Example 1: Adding an Event
The Event Properties dialog box appears (see Figure 4.13 on page 250). 4. In the Type column of the Event Properties dialog, choose Primitive > SAS Primitive.
5. In the Type column in the middle of the dialog box, click Description if you want to add a description of the event. 6. Click Direction to choose the direction of traffic to monitor for the selected event (the default is From Initiator, which is what you want for this example). Sierra M6‐1 SAS/SATA Protocol Analyzer User Manual
261
LeCroy Corporation
Example 1: Creating a Single Event and Action that Removes a Primitive
7. Still in the middle column of the Event Properties dialog box, click Primitive to display a drop‐down menu that lets you choose the type of primitive for which you want to wait in this scenario. In this example, it is RRDY (Normal).
Figure 4.19: Example 1: Event Drop-Down List
8. Click OK to close the Event Properties dialog box.
262 Sierra M6‐1 SAS/SATA Protocol Analyzer User Manual
Example 1: Creating a Single Event and Action that Removes a Primitive
LeCroy Corporation
9. In the Global Rules area, click the prompt to add an action.
Figure 4.20: Example 1: Entering an Action
The Action Properties dialog box appears (see Figure 4.14 on page 254).
10. In the Type column on the left, choose the action that you want to occur when an RRDY is detected. In this example, it is the Remove Primitive action. Select Random Yes or No, N for Every Nth occurrence, and Monitor/Count as Monitored or Not Monitored.
11. Click OK to close the Action Properties dialog box.
Figure 4.21: Example1: Complete Scenario
12. In the File menu, select Save Scenario to save the scenario.
Sierra M6‐1 SAS/SATA Protocol Analyzer User Manual
263
LeCroy Corporation
Example 2: Wait for a Primitive and Replace It with an Error
Example 2: Wait for a Primitive and Replace It with an Error
In this example, the Global Rules portion of the scenario waits for each RRDY Normal primitive and replaces it with an ERROR primitive.
1. Click the New Scenario button in the main library or one of the device libraries. In the Scenario Properties dialog, enter the scenario name, description, and direction of traffic change.
2. In the Global Rules area, click the prompt to add an event to display the Event Properties dialog box.
3. As you did in the previous example, choose RRDY (Normal) as the type of primitive to monitor.
4. In the Global Rules area, click the prompt to add an action to display the Action Properties dialog box.
5. In the Type column on the left, choose Substitute > with SAS Primitive as the action that you want when an RRDY (Normal) occurs.
6. In the middle column of the dialog box, click Description if you want to add a description of the action.
7. Still in the middle column of the Event Properties dialog box, click Primitive to display a drop‐down menu that lets you choose the type of primitive for which to substitute for RRDY (Normal) (see Figure 4.19 on page 262). Choose ERROR.
8. Click OK to close the Action Properties dialog box.
9. In the File menu, select Save Scenario to save the scenario.
In this example, you set the substitution action to happen at every occurrence of an RRDY (Normal) (as shown in the figure, the action is set for every occurrence). However, you can set an action to happen at other multiples of event occurrence (for example 5, 25, 1000 and so on). You also can set the action to happen at random, within a specified number of event occurrences. Figure 4.22: Example 2: Complete Scenario
264 Sierra M6‐1 SAS/SATA Protocol Analyzer User Manual
Example 3: Creating OR Conditions
LeCroy Corporation
Example 3: Creating OR Conditions
In this example, the Global Rules area of the scenario waits for either of two types of RRDY primitive and replaces them with an ERROR primitive.
This example includes a combined event (a logical OR association of two or more single events). Here, the combined event consists of any occurrence of RRDY (Normal) or RRDY (Reserved 0).
1. Click the New Scenario button in the main library or one of the device libraries. In the Scenario Properties dialog, enter the scenario name, description, and direction of traffic change.
2. In the Global Rules area, click the prompt to add an event to display the Event Properties dialog box.
3. As you did in example 1 of this chapter, choose RRDY (Normal) as the first primitive that you want to monitor.
4. Click the add combined event prompt to add a second event. Figure 4.23: Example 3: Entering the Second Event
5.
6.
7.
8.
9.
The Event Properties dialog box appears.
Choose RRDY (Reserved 0) as the second primitive that you want to monitor. Click OK to close the Event Properties dialog box. In the Global Rules area, click the prompt to add an action to display the Action Properties dialog box.
In the Type list on the left, choose Substitute SAS Primitive as the action that you want when either RRDY Reserved 0 or RRDY Normal occurs.
Click OK to close the Action Properties dialog box.
Sierra M6‐1 SAS/SATA Protocol Analyzer User Manual
265
LeCroy Corporation
Example 3: Creating OR Conditions
10. In the File menu, select Save Scenario to save the scenario.
Figure 4.24: Example 3: Complete Scenario
266 Sierra M6‐1 SAS/SATA Protocol Analyzer User Manual
Example 4: Multiple Triggers and Actions
LeCroy Corporation
Example 4: Multiple Triggers and Actions
In this example, the Global Rules area of the scenario waits for two events, each of which triggers a different action.
1. Click the New Scenario button in the main library or one of the device libraries. In the Scenario Properties dialog, enter the scenario name, description, and direction of traffic change.
2. As you did in example 2, choose RRDY (Normal) as the first event to monitor, and substitute with the SAS primitive ERROR as action.
3. In the Global Rules area, click the prompt to add the next event (keep in mind this is not a combined event).
Figure 4.25: Example 4: Entering Second Event
The Event Properties dialog box appears.
In this example, there is a parallel set of events, but each event is associated with its own action. In a combined event, there is a parallel set of events sharing the same action.
4. Using the drop‐down menu, choose RRDY (Reserved 0) as the second event to monitor.
5. Click OK to close the Event Properties dialog box.
Sierra M6‐1 SAS/SATA Protocol Analyzer User Manual
267
LeCroy Corporation
Example 4: Multiple Triggers and Actions
6. In the Global Rules area, click the prompt to add an action to be triggered by the RRDY (Reserved 0).
Figure 4.26: Example 4: Entering Second Action
The Action Properties dialog box appears.
7. Use it to choose Inject RD Error as the action triggered by RRDY (Reserved 0).
8. Click OK to close the Action Properties dialog box.
Figure 4.27: Example 4: Complete Scenario
9. In the File menu, select Save Scenario to save the scenario.
268 Sierra M6‐1 SAS/SATA Protocol Analyzer User Manual
Example 5: Multiple Actions on a Single Event
LeCroy Corporation
Example 5: Multiple Actions on a Single Event
In this example, an event triggers a set of actions. The actions occur at the same time. The device waits for an ACK from the initiator. When it occurs, the device beeps, injects an RD error, and increments a counter monitoring for that event (ACK from initiator).
1. Click the New Scenario button in the main library or one of the device libraries. In the Scenario Properties dialog, enter the scenario name, description, and direction of traffic change.
2. As in previous examples, configure the first event and its response in the Global Rules area. Choose ACK primitive as the event and Beep as the action. From the Action Properties drop‐down menu, enter 500 ms as the duration of the beep.
3. Click the add another action prompt to add a second action.
Figure 4.28: Example 5: Entering the Second Action
4.
5.
6.
7.
The Action Properties dialog box appears.
Choose Inject RD Error as the second action.
Click the add another action prompt to add a third action.
The Action Properties dialog box appears.
Choose Monitor/Count as the third action.
Sierra M6‐1 SAS/SATA Protocol Analyzer User Manual
269
LeCroy Corporation
Example 5: Multiple Actions on a Single Event
8. Click OK to close the Action Properties dialog box.
Figure 4.29: Example 5: Complete Scenario
9. In the File menu, select Save Scenario to save the scenario. This example sets the counter to increment at each occurrence of an ACK (every 1 ACK). 270 Sierra M6‐1 SAS/SATA Protocol Analyzer User Manual
Example 6: Using Timers
LeCroy Corporation
Example 6: Using Timers
In this example, the Global Rules portion of the scenario waits for an ACK primitive from the initiator. Each time the device detects an ACK, it injects an RD Error into the traffic stream. This state continues for a random period of time, not to exceed 1.790 seconds. After the time period has elapsed (timer times out), the scenario stops.
Although this example sets the timer for a random period, you also can set the timer for known values (2 ms., 5 mins., 1 hr., and so on).
1. Click the New Scenario button in the main library or one of the device libraries. In the Scenario Properties dialog, enter the scenario name, description, and direction of traffic change.
2. As in previous examples, configure the first event and its response in the Global Rules area. Choose ACK primitive as the event and Inject RD Error as the action.
3. Click the prompt to add another event (keep in mind this is not a combined event).
Figure 4.30: Example 6: Entering the Second Event
The Event Properties dialog box appears.
4. In the Type column on the left, choose Timer. Set the timer for random timing with a maximum time limit of 1.790 seconds.
5. Click OK to close the Event Properties dialog box.
Sierra M6‐1 SAS/SATA Protocol Analyzer User Manual
271
LeCroy Corporation
Example 6: Using Timers
6. Click the prompt to add an action to correspond with the second event. Figure 4.31: Example 6: Entering Second Action
The Action Properties dialog box appears.
7. In the Type list on the left, choose Stop Scenario as the action that you want after the timer has expired.
8. Click OK to close the Action Properties dialog box.
Figure 4.32: Example 6: Complete Scenario
9. In the File menu, select Save Scenario to save the scenario.
272 Sierra M6‐1 SAS/SATA Protocol Analyzer User Manual
LeCroy Corporation
Creating a Sequence
Creating a Sequence
This section gives several examples for creating sequences. Recall that a sequence can have multiple states, but only one state is active at any time. In other words, at any point in time, a sequence “waits” for one event (or combined event) and responds with the corresponding action or set of actions when the event occurs. A sequence is more powerful than Global Rules, because you can create branching or looping test logic with a sequence.You can include up to two sequences in a scenario, but each is completely independent of the other. There is no branching or other interaction between the two, except through the Restart All Sequences action.
You must follow some simple rules when creating sequences:
TABLE 4.5: Sequence Rules
You can use only two branch actions per state.
When you specify actions for a state, you can only use two instances of Branch to an Existing State or Branch to a New State. If you try to use more than two, a red error message appears in the status area of the application that says “Too Many Actions.”
You can use only one restart sequence action per state.
When you specify actions for a state, you can only use one instance of Restart Current Sequence or Restart All Sequences. If you try to use more than one, a red error message appears in the status area of the application that says “Too Many Actions.”
You can use a maximum of 255 states per sequence.
If you try to use more than 255 states, a red error message appears in the status area of the application.
The following table summarizes the examples that follow.
TABLE 4.6: Sequence Examples
Example Description
7
Creating two sequences and Global Rules: This scenario has two objectives that you implement with Global Rules and two sequences. 1) You use Global Rules to replace any of three types of primitives. 2) You use two sequences to detect the order in which a type of frame is received from initiator and target.
8
Creating a sequence with many states #1: The objective of this scenario is to detect an incorrect order of primitives and to cause the device to beep when it happens. You implement this scenario with a single five‐state sequence.
9
Creating a sequence with many states #2: This scenario is an enhancement of example 8. In this scenario, the objective is to detect an incorrect order of primitives, fix it, and cause the device to beep when this happens. As with example 8, you implement this scenario with a single five‐state sequence. Sierra M6‐1 SAS/SATA Protocol Analyzer User Manual
273
LeCroy Corporation
Example 7: Creating Two Sequences and Global Rules
Example 7: Creating Two Sequences and Global Rules
In this example, Global Rules substitute an Align (0) primitive for each of the following received from the initiator: Align (1), Align (2), and Align (3). As a separate test operation, two sequences determine the order in which each Identify Address frame is received from initiator and target.
The following tables summarize the logic implemented by each of the sequences.
TABLE 4.7: Example 7: Logic of Sequence 0
State
State 0
State 1
Description
If Address Frame is detected from initiator, go to State 1;
otherwise, continue to check incoming frames (do not change state).
If next Address Frame detected is from target, beep 1 second.
TABLE 4.8: Example 7: Logic of Sequence 1
State
State 0
State 1
Description
If Address Frame is detected from target, go to State 1;
otherwise, continue to check incoming frames (do not change state).
If next Address Frame detected is from initiator, beep 2 seconds.
There is no interaction between the two sequences. Each of them operates independently (and is independent of the Global Rules). However, the two sequences complement each other with their logic. In this sense, they both combine to implement a test objective.
1. Click the New Scenario button in the main library or one of the device libraries. In the Scenario Properties dialog, enter the scenario name, description, and direction of traffic change.
2. As in previous examples, create the Global Rules area.
3. Click the prompt to add a sequence. Prompts for the sequence appear beneath the Global Rules area. You create a sequence one state at a time. The application numbers states consecutively from 0 up (1, 2, 3, and so on).
Figure 4.33: Example 7: Adding a Sequence
274 Sierra M6‐1 SAS/SATA Protocol Analyzer User Manual
Example 7: Creating Two Sequences and Global Rules
LeCroy Corporation
By default, the name of the first sequence in a scenario is Sequence 0. The name of the first state is State 0. To change the name of a sequence or state, or to associate a description with it, click the name of the sequence or state. A dialog box appears that allows you to enter that information.
Note: The description does not appear on screen, but you can bring it up by clicking the name of the sequence or state.
4. In the State 0 area, click the prompt to add an event.
Figure 4.34: Example 7: Adding an Event for the First State
The Event Properties dialog box appears.
5. In the Event Properties dialog box, select Address Frame as the event.
6. Click OK to close the Event Properties dialog box.
7. In the State 0 area, click the prompt to add an action.
Sierra M6‐1 SAS/SATA Protocol Analyzer User Manual
275
LeCroy Corporation
Example 7: Creating Two Sequences and Global Rules
Figure 4.35: Example 7: Adding an Action for the First State
The Action Properties dialog box appears
8. For the action, select Branch to > New State.
9. Click the OK button to close the Action Properties dialog box. 10. This saves the action and automatically creates an area for State 1 in the scenario. 11. In the State 1 area, click the prompt to add an event. The Event Properties dialog box appears.
12. Choose the Address Frame event. In the Direction column, select From Target (you want State 1 to trigger on an Identify Address frame received from the target). 13. Click OK to close the Event Properties dialog box.
276 Sierra M6‐1 SAS/SATA Protocol Analyzer User Manual
Example 7: Creating Two Sequences and Global Rules
LeCroy Corporation
14. Click the prompt to add an action for State 1. Figure 4.36: Example 7: Adding an Action to the Second State
The Action Properties dialog box appears. 15. In this example, you enter the action Beep, and you set the duration of the beep for 1 second.
16. Click OK to close the Action Properties dialog box.
Sierra M6‐1 SAS/SATA Protocol Analyzer User Manual
277
LeCroy Corporation
Example 7: Creating Two Sequences and Global Rules
17. You are finished creating the first sequence. Click the add another sequence prompt to create an area in the scenario for the second sequence (Sequence 1).
Figure 4.37: Example 7: Adding a Second Sequence
18. Create two states in the second sequence with the characteristics shown in the following table.
TABLE 4.9: Example 7: States for Second Sequence
State
0
1
278 Event
Address Frame from Target
Address Frame from Initiator
Action
Branch to State 1
Beep for 2 seconds.
Sierra M6‐1 SAS/SATA Protocol Analyzer User Manual
Example 7: Creating Two Sequences and Global Rules
LeCroy Corporation
19. In the File menu, select Save Scenario to save the scenario.
Figure 4.38: Example 7: Sequence Area of Scenario
Sierra M6‐1 SAS/SATA Protocol Analyzer User Manual
279
LeCroy Corporation
Example 8: Creating a Sequence With Many States #1
Example 8: Creating a Sequence With Many States #1
In this example, a five‐state sequence detects if a group of primitives is received
out‐of‐order from the initiator. The expected order is: Align (0), Align (1), Align (2), Align (3). If this scenario detects any other order of these primitives, it causes the device to beep and the scenario to restart.
This example is designed to give you an idea of the powerful logic that you can implement with sequences.
Note: The states in this sequence have been renamed (do not have their default names). The following table summarizes the sequence logic.
TABLE 4.10: Example 8: Logic of Sequence 0
State
Wait for Align (0)
Wait for Align (1)
Wait for Align (2)
Wait for Align (3)
Indicate Error
Description
When an Align (0) is received, go to Wait for Align (1).
If an Align (1) is received next, go to Wait for Align (2);
otherwise, go to Indicate Error.
If an Align (2) is received next, go to Wait for Align (3);
otherwise, go to Indicate Error.
If an Align (3) is received next, restart test;
otherwise go to Indicate Error.
Indicate error and restart test.
1. Click the New Scenario button in the main library or one of the device libraries. In the Scenario Properties dialog, enter the scenario name, description, and direction of traffic change.
2. As in previous examples, create the five states for this sequence.
280 Sierra M6‐1 SAS/SATA Protocol Analyzer User Manual
Example 8: Creating a Sequence With Many States #1
LeCroy Corporation
3. In the File menu, select Save Scenario to save the scenario.
Figure 4.39: Example 8: Top Half of Scenario
Sierra M6‐1 SAS/SATA Protocol Analyzer User Manual
281
LeCroy Corporation
Example 8: Creating a Sequence With Many States #1
Figure 4.40: Example 8: Bottom Half of Scenario
282 Sierra M6‐1 SAS/SATA Protocol Analyzer User Manual
Example 9: Creating a Sequence With Many States #2
LeCroy Corporation
Example 9: Creating a Sequence With Many States #2
In this example, a five‐state sequence not only detects if a group of primitives is received out‐of‐order, but it fixes any incorrect order. The logic is similar to that of example 8 with a few small changes. The following table summarizes each state.
TABLE 4.11: Example 9: Logic of Sequence 0
State
Wait for Align (0)
Wait for Align (1)
Wait for Align (2)
Wait for Align (3)
Indicate Error
Description
When an Align (0) is received, go to Wait for Align (1).
If an Align (1) is received next, go to Wait for Align (2);
otherwise, replace primitive with Align (1) and go to Indicate Error.
If an Align (2) is received next, go to Wait for Align (3);
otherwise, replace primitive with Align (2) and go to Indicate Error.
If an Align (3) is received next, restart test;
otherwise, replace primitive with Align (3) and go to Indicate Error.
Indicate error and restart test.
1. Click the New Scenario button in the main library or one of the device libraries. In the Scenario Properties dialog, enter the scenario name, description, and direction of traffic change.
2. As in previous examples, create the five states for this sequence.
Sierra M6‐1 SAS/SATA Protocol Analyzer User Manual
283
LeCroy Corporation
Example 9: Creating a Sequence With Many States #2
3. In the File menu, select Save Scenario to save the scenario.
Figure 4.41: Example 9: Top Half of Scenario
284 Sierra M6‐1 SAS/SATA Protocol Analyzer User Manual
Example 9: Creating a Sequence With Many States #2
LeCroy Corporation
Figure 4.42: Example 9: Bottom Half of Scenario
Sierra M6‐1 SAS/SATA Protocol Analyzer User Manual
285
LeCroy Corporation
Downloading Scenarios
Downloading Scenarios
After you have created a scenario, you need to download it to the InFusion device for execution.
If you use a general library as a scenario archive, then the process of creating and downloading a scenario is as follows:
1. Open the general library (Main library or a File library). Scenarios in the library are listed in the Main Library window.
2. Open the Device Library window by clicking the Show Device Library button on application toolbar.
3. Open the Device Library for the device to which you want to download a scenario or scenarios. You can open the device library in two ways: by clicking the Device Library icon in the device list window or by double‐clicking the device name.
4. Copy the scenario from general library to device library by dragging it with the mouse. 5. Download all scenarios in the device library to the InFusion device. To do so, click the Download all Scenarios button on the Device Library toolbar (second button from left).
Running Scenarios
If you use a general library as a scenario archive, then the process of executing a scenario is as follows:
1. Select the scenario to run by clicking it. 2. To run the scenario, click the Run Scenario button on the Device Library toolbar (second button from the right). The InFusion device then begins its session.
286 Sierra M6‐1 SAS/SATA Protocol Analyzer User Manual
LeCroy Corporation
Scenario Batch Files
Scenario Batch Files
You can write a script with commands to run a sequence of executable scenarios automatically. A Scenario Batch file is a text file with a list of commands to run in sequence when you execute the file. A batch script can manage scenarios and their assigned ports and hardware in sequence, using conditions. The system checks for accuracy of inputs and commands.
Note: Before you run a Scenario Batch file that requests scenarios, you must download the scenarios to the Scenarios box.
To start a batch script, click the New Batch Script File > New Batch Script.
button or select
Script Workspace
In the Script Workspace, add a command and make a batch file.
In this window, you can enter a script command by clicking Click here to add script command.
Sierra M6‐1 SAS/SATA Protocol Analyzer User Manual
287
LeCroy Corporation
Scenario Batch Files
3. First, click Click here to add script command to open the Command Properties dialog.
The Command Parameters Dialog contains the list of available commands and their parameters from which to build scenarios and connected hardware and available ports.
4. Select appropriate parameters for the command and click OK to display the script in the Script Workspace. Note: You can select ports from the port list, depending on number of ports licensed.
Note: The hardware Serial Number can already exist or not. If the Serial Number exists, the Serial Number (for example, S/N: 12871) is shown. In Offline and Simulation mode, you can enter a Serial Number. In Online mode, you can only enter an existing Serial Number.
288 Sierra M6‐1 SAS/SATA Protocol Analyzer User Manual
LeCroy Corporation
Scenario Batch Files
5. To add another command, click Click here to add another script command.
To copy a script command, right‐click on the command and select Copy.
Right‐click Click here to add another script command and then select Paste. You can also cut, delete, and edit a selected script command.
6. To edit batch commands, click the command, or right‐click the command and select Edit from popup menu.
7. To delete a command, right‐click and select Delete from popup menu, or select command and press Delete key on keyboard.
8. After finishing, if everything is correct, push the Run Batch button to execute scenario and save result in the log file. Note: Before you run a Scenario Batch file that requests scenarios, you must download the scenarios to the Scenarios box.
Sierra M6‐1 SAS/SATA Protocol Analyzer User Manual
289
LeCroy Corporation
Scenario Batch Files
Error Checking
The Script Workspace shows errors by red color. The program reports all errors in the log file. If you use a script from other InFusion hardware, it may cause an error, for example, mismatch in hardware Mac addresses, or scenarios that are not already in current hardware.
Log
Results of executable batch commands are saved automatically into a log file with user‐
specified name. The status of executable commands is shown in log area.
290 Sierra M6‐1 SAS/SATA Protocol Analyzer User Manual
LeCroy Corporation
Scenario Batch Files
Statements
Statements can be conditional statements or non‐conditional statements.
IfIsStopped
Shows whether a scenario is already stopped or not.
Format
IfIsStopped (Serial Number, Target Port)
Parameters
Serial Number: Serial number of hardware
Target Port: Port number in port map
Example
IfIsStopped(ox01267, 1) Then
{
Beep (750, 300)
Run (ox01267," Detect AddressFrame Open", 5)
}
The value of second parameter is 5 and shows check stopping mode of combination of port number 1 and port number 3. After filling parameters from the Command Parameters Dialog, the program makes the IF‐
ELSE structure in the Script workspace. The ELSE statement is optional. To add an ELSE body, click Click here to add else body.
Sierra M6‐1 SAS/SATA Protocol Analyzer User Manual
291
LeCroy Corporation
Scenario Batch Files
Goto Label
Goes to specified label. Labels can be assigned to each script line. Format
Goto Label3
Parameters
None
Example
Label3: WaitForStop(0x83456, 2, 100))
Run (ox01267," Inject CRC000", 4)
Goto Label7
Note: You can use a Label and a Goto Label to make loops. First make the label, then make Goto Label. The Command Parameters window shows only enabled Labels. Labels are disabled by default and are in gray color. To enable them, click them to make purple color.
292 Sierra M6‐1 SAS/SATA Protocol Analyzer User Manual
LeCroy Corporation
Scenario Batch Files
Run
Runs the scenario on hardware on specified ports. If you call this command for the first time and the scenario was not assigned to the hardware and ports before, the scenario is assigned to specified hardware and ports and then scenario runs on the hardware.
Format
Run(Serial Number, Scenario Name, Target Port)
Parameters
Serial Number: Serial number of hardware
Scenario Name: Name of scenario
Target Port: Port number in port map
Example
Run (ox841200," Substitute address frame", 4)
Beep(800, 400)
Run (ox841200," CRC Inject _ Play CD", 8)
WaitForStop(0x63463, 1, 150)
Run (ox841200," Remove Send Cue Sheet", 2)
Goto Label6
Run (S/N: 12871, Port 1, DISCOVER)
Note: If the selected ports are busy, scenario cannot run, and the command will be skipped. The result will be written in Log area.
Stop
Stops running scenario by hardware and port name.
Format
Stop (Serial Number, Target Port)
Parameters
•
Serial Number: Serial number of hardware
•
Target Port: Port number in port map
Example
Run (ox00820,"Inject CRC000", 2)
Beep(700, 500)
Stop (ox00820, 2)
Goto Label3
...
Label3 : Run(ox005007,"Detect DATA", 8)
Sleep(40)
Sierra M6‐1 SAS/SATA Protocol Analyzer User Manual
293
LeCroy Corporation
Scenario Batch Files
WaitForStop
Used to wait for occurrence of specified condition.
Format
WaitForStop(SerialNumber, Target Port, Duration)
Parameters
Serial Number: Serial number of hardware
Target Port: Port number in port map
Duration: Integer or random duration in milliseconds. In the Command Parame‐
ters Window, WaitForStop duration has three options:
Infinite: Wait until Stop command.
Random: Stop after a random time.
Finite time: Stop after specified time in milliseconds.
Example
Run (ox001267,"Detect AddressFrame Open", 2)
WaitForStop (0x348790, 2, Forever)
Run (ox005007,"Detect DATA", 4)
WaitForStop(ox005007, 4, 100)
Stop (ox001267, 2)
294 Sierra M6‐1 SAS/SATA Protocol Analyzer User Manual
LeCroy Corporation
Scenario Batch Files
Sleep
Used to sleep for a few seconds.
Format
Sleep(Duration)
Parameters
Duration: Integer or random duration in milliseconds
Example
Sleep(100)
Beep
If specified condition is satisfied, the system beep for specified duration.
Format
Beep (Duration, Frequency)
Parameters
Duration: Integer or random duration in milliseconds
Frequency: Frequency in hertz
Example
IfIsStopped(0x83456, 4)) then
{
Beep (2, 20)
Run (0x83456,"Identify_Disparity error", 8)
}
Sierra M6‐1 SAS/SATA Protocol Analyzer User Manual
295
LeCroy Corporation
296 Scenario Batch Files
Sierra M6‐1 SAS/SATA Protocol Analyzer User Manual
Appendix A
Creating a Pattern Generator File
You may use any text editor or word processor to create a pattern generator file (*.spg) using the following conventions:
Key words
ALIGN
CONT
DMAT
EOF
HOLD
HOLDA
PMACK
PMNAK
PMREQ_P
PMREQ_S
R_ERR
R_IP
R_OK
R_RDY
SOF
SYNC
WTRM
X_RDY
XXXX
LOOP
Enable
Disable
Host
Device
Scramble
Role
END_OF_FILE
Sierra M6‐1 SAS/SATA Protocol Analyzer User Manual
297
LeCroy Corporation
Comment format
Comment format
/*Comment text*/
Primitive definition format
To add an ALIGN primitive, use ALIGN or 27.3 10.2 10.2 K28.5
To add a CONT primitive, use CONT or 25.4 25.4 10.5 K28.3
Loop definition format
You may write a defined pattern into memory repeatedly by enabling a loop.
Loop definition allows either “Enable” or Disable”. To enable looping use: Loop=Enable
Scramble definition format
Scramble definition allows either “Enable” or Disable”. To enable scramble use: Scramble=Enable
Role definition format
To specify SATA hardware role: Role=Host or Role=Device END_OF_FILE definition
A pattern generator file must include END_OF_FILE as the last statement in the file.
298 Sierra M6‐1 SAS/SATA Protocol Analyzer User Manual
Example Pattern Generator File
LeCroy Corporation
Example Pattern Generator File
Figure A‐1 illustrates a typical Pattern Generator file.
Figure A.1: Sample Pattern Generator File *spg
Sierra M6‐1 SAS/SATA Protocol Analyzer User Manual
299
LeCroy Corporation
300 Example Pattern Generator File
Sierra M6‐1 SAS/SATA Protocol Analyzer User Manual
Appendix B
China Restriction of Hazardous Substances Table
The following tables are supplied in compliance with China’s Restriction of Hazardous
Substances (China RoHS) requirements:
Sierra M6‐1 SAS/SATA Protocol Analyzer User Manual
301
LeCroy Corporation
WAN Operation
WAN Operation
WAN connected operation is supported. Contact factory for details of operation. Refer “How to Contact LeCroy” on page 303 for contact information.
302 Sierra M6‐1 SAS/SATA Protocol Analyzer User Manual
Appendix C
How to Contact LeCroy
Type of Service
Call for technical support
Fax your questions
Contact
US and Canada:
1 (800) 909‐7112
Worldwide:
1 (408) 653‐1260
Worldwide:
1 (408) 727‐6622
Write a letter
LeCroy
Protocol Solutions Group Customer Support 3385 Scott Blvd. Santa Clara, CA 95054‐3115
USA
Send e‐mail
[email protected]
Visit LeCroy’s web site
http://www.lecroy.com/
Sierra M6‐1 SAS/SATA Protocol Analyzer User Manual
303
LeCroy Corporation
304 Sierra M6‐1 SAS/SATA Protocol Analyzer User Manual
Index
Symbols
.cfg file 199
.infdb file 245
.sac files 37
Numerics
10 bit payload data display 184
8 bit payload data display 184
A
About 218
Action 243
action
counter 256
scenario 254
Action Properties dialog 255
Add Device... 24
Add Pattern button 101
Add to Trigger 115
address 303
address frame 60
Address Frame Type Pattern dialog 60, 80
Advanced Mode 27, 98
alias name 228
ALIGN Transmission Period 93
Analysis Project dialog 43
analyzer overview 13
Anchor the Selection bar 207
Any Trigger mode 70
Apply Show/Hide Link Setting 45
As previously saved 205
Ask user to close the previous captured sample before running the new project 204
ATA Command Pattern dialog 75, 86
ATA Command Report 134
ATAPI Pattern dialog 76
ATAPI Report 135
ATAPI spec assignment 204
Auto Run 17, 91
Sierra M6‐1 SAS/SATA Protocol Analyzer User Manual
B
Based on Cell Type 206
Based on Port No. 206
Based on Read/Write Command Type
Based on Specific Command Type 207
batch command editing 289
batch script 287
Batch Script Setting 236
Beep statement 295
BIST (FIS) 67
bookmarks 164
206
finding 166
Break Link Recovery 234
Browse Default Path 204
buffer
% full 192
bus condition report 133
Bus Conditions dialog 73
Bus Utilization
buttons 155
Bus Utilization View
buttons
154
bus utilization 155
Buzzer check 225
Byte Order 190
Bytes in Column 198
C
Cancel button kills upload immediately
capture
206
parameter 54
pre and post trigger 55
Capture tab 39
Capture tab for Pattern 53
captured data 31
cascading 18
CATC Script Language 159
CATC Technical Support 303
cell address 109
Check for Updates 218
305
LeCroy Corporation
Index
Choose Port Speed 94
Click here to add another script command 289
Click here to add script command 288
Clock check 219
Close previous sample file when new sample file opens 206
Collapse All 191
Collapse Log button 159
color 198
column
hiding 151
rearrange 123
resize 122
column content
filtering 149
sorting 151
Column View 31
column view 122
Column View Memory Size 208
Column View Packet Size 208
Columns in Row 198
Combined Event 243
Command Parameters dialog 288
Command Properties dialog 288
compensate
for line loss 202
compliance test 229
Compliance Test dialog 229
components 15
conditional statements 291
configuration 195
Configuration menu (InFusion) 236
Configure Device 236
contact 303
Convert port configuration without prompt for confirm 204
Count Randomly 256
counter
as data 109
Counter button 109
Counter Value 256
counters 256
Create statistical report read/write page
Current License Configuration field 211
cursor position status bar 193
cursors
locating 163
positioning 194
timing 127
D
data
31
pattern 56
show 191
306 Data (FIS) 68
data block
counter data 109
custom pattern 108
defining 106
editing 108
editing as text 111
naming 107
random pattern 110
walking bit 110
Data Block dialog box 106
Data Block Edit menu 107
Data Block Name list 111
data format 190
Data Pattern dialog 56, 77
Data Pattern edit box 108
Data Payload View 157
data report 155
Data Report button 155, 163
Data View 31
DataPatternCapture 115
Decode CDB of Commands 207
Decode Toolbar 187
Decode toolbar 33
Default Data Block button 106
Default Workspace 204, 205
default workspace 204
default.infdb file 245
Define different patterns for pre‐trigger and post‐
trigger data captures 40
Define Pattern dialog 108
defining patterns 88
device library 246
Device Library window 246, 286
Device Setup dialog 213
DHCP server 21
Disconnect 23
disparity indication 187
display
fonts 199
206
display Configuration 195
display configuration 195
Display License Information 216
display manipulation 115
Display pre‐filtered cells as blank in column view
DMA activate (FIS) 66
DMA setup (FIS) 66
Don’t care (Snapshot) 69
downloading a scenario 286
DWORD Matcher 253
E
Easy Mode
208
27, 37
Sierra M6‐1 SAS/SATA Protocol Analyzer User Manual
LeCroy Corporation
Index
Edit script 162
e‐mail 303
Email CATC Support 303
Enable Tooltip box 198
Entire Memory 91
Error Injection 234
error message
startup 17
errors 290
Ethernet
connecting with 21
243
Event
event
counter 256
scenario 250
example files 50
exclude from capture
Align 39
Idles 40
Notify 40
OOB Signals 39
patterns 54
Payload of Data Frame 39
RRDY 40
SATA_CONT 39
SATA_SYNC 39
XXXX 39
Exclude Idle checkbox 54
Expand All 191
Expand Log button 159
Expanded Waveform View 127
Expansion Card Data Status or Clock Status check 224
Export Paired SAS Address Report 48
Export Read/Write Command Report 48
Export to Excel button 145
Export to Initiator Emulator 46, 47
External Trig In Setting 94, 212
External Trig Out Setting 94, 212
External Trig Setting 236
External Trig Setting dialog 212
external trigger 94
External Trigger dialog 73
Extract Sample File dialog 47
file type
definition 49
167
by tag number 174
check condition 174
options 172
save setup 169
type 169
filter enable 177
filter idle 162, 178
filtering 167
direction 169
filter
filtering column content 149
Filtering menu 167
Find Device 226
Find Device button 228
FIS Pattern dialog 63, 79, 85
FIS Patterns dialog 59
FIS Report 142
FIS Type dialog 62, 84
FIS types 64
Fit to Graph Area 154
Floating License dialog 211
Found Device List Mode 204
FPGA 1 or 2 Serdes Chip 221
frames
hide 152
From Initiator 247
From Target 247
G
general report 131
Gigabit Ethernet interface
Global Rules 244
21
examples 260
Go to ATA/SCSI Cmd. 154
Go To button 162
Go To Timestamp dialog 164
Goto Command 189
Goto Label statement 292
Goto Response 189
Goto Within Packet command
grouping
189
by port 93
F
fax number
field
303
show/hide 188
Field List Settings 208
field list view 124
Field Settings 197
file library 245
File Manager 245
File menu (InFusion) 236
Sierra M6‐1 SAS/SATA Protocol Analyzer User Manual
H
hardware
run 41
hardware setup 17
Help Topics 216
Hide All Primitives 163
Hide RRDY Primitives 162
Hide Unassociated Traffic
Histogram View 31
162
307
LeCroy Corporation
histogram view
Index
Micro‐D to DB‐9 cable 19
Mode 209
Mode of frame field list 209
Move drop‐down list 148
MUX Setting 97
MUX Setting dialog 97
Muxing 97
151
I
IfIsStopped statement 291
InFusion 35, 233
InFusion scenarios 241
Install component selection
Installation CD ROM 15
installing the analyzer 17
Inter‐FPGA Connection 223
IP Settings... 24
17
N
NCQ Commands Time out Threshold 204
network 21
Networks... 24
New Batch Script command 235
New Protocol Analyzer Project in Advanced Mode 203
New Scenario button 247
New script 162
normal zoom
J
Jammer 240
Jump to Next button 148
Jump to Previous button 148
Jump to Specific button 148
K
K‐Codes 253
key sequences
reset 163
Notes tab 98
Number of Run text box 91
Number of Runs Each Test 220
105
L
lanes report 139
launching 26
Launching the CrossSync Control Panel
LED check 225
library 245
43
device 246
main 245
License Configuration
License Manager 211
line condition 251
link layer
235
in results display 184
Others Report view
output trigger 102
211
Link With Sample View
Load dialog 111
log file 290
148
M
Main FPGA tab 223
Main Library window 245
Main Window 37
Manual Trig 69
Manual Trig button 69
manual trigger 69
Maximum Number of Uploader Threads
Memory Assignment 209
memory check 220
Memory Size 91
Micro‐D Sync cable 18
136
P
Pack Repeated Primitives
Packet Drop 234
Packet View 31, 113, 118
packing list 15
Partial Memory 91
Paths settings 203
pattern
command interpretation 42
308 O
Open as Data Vie 157
Open Library command
Open Sample file In 205
operating system 17
order reorder
206
definition 88
Pattern command
pattern definition
53
in sequential trigger mode 88
204
Pattern field 101
Pattern triggers 69
Payload field length
209
Pending ATA IO 154
Pending SCSI IO 154
Performance Report
141
Sierra M6‐1 SAS/SATA Protocol Analyzer User Manual
LeCroy Corporation
Index
performance report 140
PIO Setup (FIS) 67
PM Performance Report
PM Statistic Report 143
port
Remove Device 24
Rename Title of Port dialog 187
renaming port 187
Repeat decoded command in frame column
Reset (clear) the list of found devices 204
Response frame 189
Reverse Link Data 205
Run All Tests Sequentially 220
Run Batch button 289
Run Batch Script command 235
run hardware 41
Run Scenario button 286
Run scripts button 161
Run statement 293
Run Verification Scripts dialog 159
running disparity 187
Running verification scripts button 159
Rx/Tx Settings dialog 202
143
renaming 187
status 191
port alias 200
Port Configuration 235, 236
Port Configuration button 95
port ID 187
Port Speed 94
Port Status 34
Post‐Trigger Capture tab 55
pre‐trigger 89
data 91
Pre‐Trigger Capture tab 55
Primitive dialog 56, 74
Primitive Manipulation 234
primitive report 132
primitive response timeout
Print Preview button 146
project
S
Sample File Name 91
Sample View link 148
Sampling memory usage optimization 205
Sampling Memory Usage Optimization option
SAS Address Alias 201
SAS address report 139
SAS data pattern 253
SAS Parameters window 70
SAS Protocol Suite 27
SATA data pattern 253
SATA Parameters window 71
save
93
examples 50
file type definition 49
notes 98
settings 90, 106
project note 98
Project Tree 39
projects 49
protocol
error mask 93
Protocol Analysis 37
Protocol Analyzer 27
Protocol Analyzer setting 203
protocol error report 135
protocol errors 57
Protocol Errors dialog 57, 78
Q
Queue Command Report
Quick Start manual 15
Quick View 114, 205
Sierra M6‐1 SAS/SATA Protocol Analyzer User Manual
209
partial trace capture 45, 46, 47, 48
trace capture 45
Save as Text button 145
Save As Text dialog 121, 123
Save Filtered Sample 45
Save Output button 159
scenario 241
action 254
creation 259
downloading 286
event 250
overview 241
properties 247
running 286
Scenario Batch file 287
Scenario Properties dialog 247
142
R
random data pattern 110
Read/Write Command Report 144
read/write command report 140
Rec Analyzer command 235
Refresh (append to) the list of found devices
Refresh Device List 25
register device to host (FIS) 64, 65
relative time display 42
207
204
scramble/unscramble payload data
scrambling
184
disable 93
Script Workspace 287
SCSI Command Pattern dialog
83
309
LeCroy Corporation
SCSI Command report
SCSI commands
Index
137
address display 42
SCSI spec assignment 204
SDRAM or Exerciser RAM memory check
search 178
220
by tag 182
domain 181
for data pattern 179, 180
logic 180
SAS address 181
save setup 179
status 194
STP port 181
sub items 181
search direction 179
search from 180
search items 180
in results display 183
Show/Hide Command queue
in results display 184
Show/Hide Compare 2 Data Payloads button
Show/Hide DLLP packet
select
item for capture 56
Select Device 21
Select Port Configuration dialog 95
selecting components for installation
self test 218
Self Test dialog 218
separate systems 17
sequence 244
17
Sequential Trigger mode 87
sequential triggering 87
Serial ATA (SATA) data transfers 13
Serial Attached SCSI (SAS) data transfers
session 255
Set Alias Name 23
Set as Second Data Payload 158
set device bits (FIS) 65
Set Port Configuration dialog 95
Set the Anchor row as sync. point 207
Set Time Stamp Origin 167
Set Timers dialog 102
Setting button 147
Setting dialog 147
settings
advanced mode 106
all data in data field 191
Show Analyzer command 235
Show Description window 162
Show Device Library button 286
Show Device Library command 235
310 158
in results display 183
Show/Hide Field 188
Show/Hide Link Packet button
Show/Hide Physical Packet
183
in results display 183
Show/Hide TLP packet
in results display 183
examples 273
Settings command 160
Settings dialog 160
Settings tab 90, 106
Setup command 17
show
Show Field List as embedded In frame/spreadsheet views 209
Show Field List in Column View 209
Show Grid 162
Show Library command 235
Show Output 162
Show Output command 235
Show Sector Count instead of Xfer Length 207
Show Trainer command 235
Show Warning in Search Primitive In Column View 208
Show XXXX value 93
Show/Hide CMD packet
13
Show/Hide Transport Packet button
Simulation Mode 27
Sleep statement 295
SMP Command report 138
SMP frame 60
SMP Frame Pattern dialog 60, 81
SMP Transport report 137
Snapshot mode 69
Soft Reset dialog 86
Software default 204
software installation 17
software settings 203
sorting column content 151
Spec View 186
Spread Sheet Color Setting 206
Spreadsheet View 31
spreadsheet view 120
SSP Frame 61
SSP Frame Pattern dialog 61
SSP Frame Type dialog 82
SSP Transport Report 136
State 243
statements 291
statistical report
183
column setting 147
content (SATA) 130
options 131
save as text 145
Sierra M6‐1 SAS/SATA Protocol Analyzer User Manual
LeCroy Corporation
Index
Statistical Report toolbar 144
Statistical Report View 149
statistical reports 31
Statistics button 156
Status bar 194
Stop Batch Script 235
Stop Hardware button 69
Stop statement 293
STP Transport report 137
subnet 26
support 303
Switch to CATC Navigation 205
Symbol dialog 74
Sync port 18
Synchronize with Trace View 154
T
task command report 138
Technical Support 303
telephone number 303
Template Files 203
Test Result 219
Text View 31
text view 123
Tile Views 163
time
any ATA command 76
69
Trigger tab
triggering
on timer sequential 87
order 88
triggering order 88
Tx Vout 202
202
U
unpacking 15
Update Field List based on 209
Update License 216
Update Sierra Device 236
Update Sierra Device command 213
Upload Manager dialog 92
user defined decoding 215
User Defined Decoding dialog 215
User Path 203
using the cursors 194
72
setup advanced mode 102
71, 87
Timer dialog
timers 271
timing
cursors 126
measurement 127
tool bar 193
Toolbar command 193
Tools menu (InFusion) 236
Trace Capture 45
Trace Memory Status section
Traffic Monitoring 234
trigger
trigger on
Tx Vout & Preemphasis command
relative display 42
Time Stamp Origin 167
Timeout Pattern dialog
timer 71
on primitive 74
on protocol errors 78
on SCSI Command 83
on SMP Frame 81
on soft reset 86
on SSP Frame 82
on STP frame 79
on symbol 74
on timer 71
position in memory 91
setting advanced 101
setup 69
snapshot 69
91
condition 101
external 73
manually 69
on address frame 80
on ATA command 75
on ATA command pattern 86
on ATAPI 76
on bus condition 73
on data pattern 77
on FIS 84
on FIS pattern 85
on pattern 70
Sierra M6‐1 SAS/SATA Protocol Analyzer User Manual
V
Value Replacement 234
VENDOR (FIS) 68
Verification script command 159
Verification Script Engine Reference Manual
View Field option 186
View menu (InFusion) 236
View Type toolbar 123
Viewer 31, 113
Viewer Setting toolbar 183
Viewer Settings 198
views 31
Visible box 197
159
311
LeCroy Corporation
W
WaitForStop statement
walking bit pattern 110
Waveform Display 31
waveform display 126
web site 303
Website, CATC 303
Windows default 204
Wrap Packet box 198
wrap packets
Index
294
in results display 183
Z
Zoom In
results display 163
Zoom Out
results display 163
312 Sierra M6‐1 SAS/SATA Protocol Analyzer User Manual