1
University of Southern Queensland
Faculty of Engineering and Surveying
Design, Development and Implementation of Innovative &
Pervasive Applications using Emerging Communication
Technologies for Highly Mobile Organisations
A Dissertation submitted by
Keyurkumar Jayantibhai Patel, BE, MEng
For the Award of
Engineering Doctorate
Principal Supervisor
Dr Wei Xiang
Associate Supervisor
Associate Professor Nigel Hancock
Abstract
Information and Communications Technology (ICT) industry is rapidly expanding,
constantly changing and oriented around emerging technologies. In recent times, research
data from industry skills demand and job advertisements shows that there is clearly vast
skills shortages to develop applications leading to computer and telecommunications
networks for financial, banking, energy, health, engineering, aviation, tourism, hospitality
and education sectors.
Applications based on the wireless technologies both short range (Bluetooth® and IEEE
802.11x family) and long range (next generation cellular technologies) reliant on
telecommunication networks are growing at an alarming rate with an increased demand
for security, quality of service, scalability, mobile multimedia, bandwidth usage,
infrastructure and innovation. This demand brings major technological challenges for the
management, developers and end-users in the ICT sector. This dissertation presents an
investigation into these challenges in form of a decade of individual professional projects
requiring fundamental design from the principles of wireless communications. Innovative
and pervasive solutions are developed for the highly mobile organisations using
amalgamation of compatible and cost effective emerging communication technologies.
Highly mobile organisations span the aviation, power generation and distribution,
hospitality, tourism, education, and telecommunication sectors. These industries execute
numerous and distinctively different real-time business transactions. From the preliminary
research and investigations in each, suitable technological solution for each organisation’s
problem is designed, developed then implemented. This dissertation is assembled from
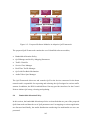
my research input to nine commercial projects executed between 2001 and 2010. Each
was ‘cutting edge’ and technically challenging at the time of execution. These comprise:
a secure wireless technology implementation at the Sydney Airport Corporation
Limited (SACL) between 2001 and 2003;
implementation of a secure on-site and off-site electricity meter reading solutions
for the Hong Kong Electricity Company (HEC) between 2004 and 2005;
design and development of wireless food ordering system, iPod as a visitor’s
personal guide and voice over internet protocol (VoIP) for student attendance
i
recording and retrieval application (SARRA) for the Box Hill Institute (BHI)
between 2005 and 2007;
a new three layered packet switching media access control (MAC) framework was
developed with the quality of service mechanism for the Aricent® Group between
2007 and 2009;
a new modular data link layer (M-DALL) was developed for a multiple radio
access technologies (RATs) for the Aricent® Group between 2008 and 2009;
digital living network alliance (DLNA) enabled mobile terminals integrated with
home gateway (HG) and an adaptive quality framework was developed for the
Aricent® Group between 2009 and 2010; and
a heuristic buffer management scheme on Android® to enhance video quality for
smart phones was developed for the Aricent® Group between 2009 and 2010.
One of the major key performance indicators for these projects was to develop and
implement solutions in their respective organisations. This dissertation is based on these
projects. To date a total of 15 manuscripts (international refereed conferences and
journals) and one book in the form of international refereed conference proceedings are
published.
ii
Certification of Dissertation
I certify that the ideas, experimental work, results, analyses and conclusions reported in
this dissertation are entirely my own effort, except where otherwise acknowledged. I also
certify that the work is original and has not been previously submitted for any other
tertiary award, except where otherwise acknowledged.
____________________________________
______________
Signature of Candidate
Date
(Keyurkumar Jayantibhai Patel)
Endorsement
____________________________________
______________
Signature of Principal Supervisor
Date
(Dr Wei Xiang)
____________________________________
______________
Signature of Associate Supervisor
Date
(Associate Professor Nigel Hancock)
iii
Acknowledgement
I would like to express my deepest gratitude to Dr Wei Xiang and Associate Professor
Nigel Hancock for their guidance, support and critical reviews of the entire dissertation
and many constructive suggestions from the initial to the final level that enabled me to
develop my projects into the dissertation.
This thesis would not be possible without immense help and support from my
collaborators and ex-colleagues Mr Steve McCubben of the Sydney Airport Corporation
Ltd (SACL), Dr Wing Tam of the Hong Kong Electricity Company (HEC), Mr S. Vijay
Anand and Mr Suman Kumar Prasanna of Aricent® Group, and Mr Henry Wiebell,
Mr Steven Besford and Mr Jose Straube of Box Hill Institute.
I am grateful to my colleagues at Armed Reconnaissance Helicopter Project Office,
Mr
Dong Le (Nova Defence) and Squadron Leader Mikel Schmid for their time and
contribution towards proof reading of this dissertation. I am obliged to the Australian
Defence Force and in particular, the Army, Defence Materiel Organisation (DMO),
Colonel Robert B. Crowe, Mr Brett J. Worsley and Major Aaron J. Rose for providing a
flexible working conditions and much needed study leaves in order to pursue the
Engineering Doctorate.
I am heartily thankful to Mr Mohan Trada, Mrs Lata Trada, Dr Vipul Parikh and Mrs
Preeti Parikh for providing much needed hospitality during my several visits to
Toowoomba.
I am indebted to my wife, Dr Deval Patel and my parents for their unconditional support
and continuous encouragement that kept me constantly focused towards completion of the
study.
Needless to say, without all the above help and support, the writing of this dissertation
would not have been possible. Lastly, I offer my sincere regards to all of those who
supported me in any respect during the completion of the Engineering Doctorate.
iv
Dissertation Overview
Telecommunication is the fastest growing part of the Information Communication
Technology (ICT) industry with the emergence of real-time and multimedia rich
applications, distributed systems and mobile technologies needs to be compatible with the
existing skills sets, applications and infrastructures.
Chapter 1 presents a fundamental understanding on emerging communication
technologies, their classification and implications on the third and fourth generation
wireless and mobile services. Discussions on standards and technologies are done only as
needed and relevant to projects to get the readers up to speed on the technologies. This
chapter undertakes qualitative comparison of emerging technologies and demonstrates
with examples, the features, effort and investments in these technologies. Chapter 1
concludes with the implications of current downturn in global economy and consumer
reaction towards new technologies.
Chapters 2, 3, 4, 5 and 6 are based on five major projects carried out between 2001 and
2007. These projects are based on short range communication technologies and were
commercially financed and business driven which warranted return on investment, ease of
use, simple design, and scalable. They mainly focus on data communication. In summary,
the topics of these chapters are as follows.
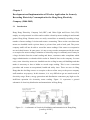
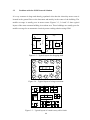
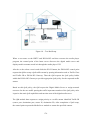
Chapter 2 presents wireless technology implemented at the Sydney Airport Corporation
Limited (SACL). Wireless Technology, an integral part of the telecommunication
industry, is growing at an alarming rate with increased security being the main challenge
for developers and end users. It discusses tackling initial challenges and issues faced
during the implementation of wireless technology and how security issues and wireless
application were implemented at the Sydney Airport – a highly mobile organisation. The
decision to deploy and manage the wireless spectrum throughout the Airport campus
meant the Wireless Local Area Network (WLAN) will be a shared medium with public
users, tenants and aircraft communications, sharing the same available bandwidth.
Therefore to protect unintended users from breach of existing security policies adopted by
their corporate network a comprehensive security solution needed to be established. This
chapter focuses on how WLAN architecture and security challenges of implementing a
v
common use wireless infrastructure were addressed. Authentication and data privacy
challenges are also presented. The complete WLAN connectivity for tenants, public and
corporate usage is presented. My role in this project was as a research engineer. Tasks
included but not limited to, infrastructure research, feasibility analysis, technical proposal
development and design review.
Chapter 3 presents a comprehensive technical overview on how a wireless application is
developed and implemented using short range wireless technology – Bluetooth®, to
securely collect electricity meter readings using on-site and off-site techniques. A huge
manpower is coordinated by electricity distributor – Hong Kong Electricity Company
(HEC), to collect electricity usage data from the electricity meters. It is an expensive task
and prone to obtain wrong readings. An innovative solution is presented which automates
and simplifies the meter reading task using Bluetooth. This solution is referred as On-site
Meter Reading. Mobile communication has been used in technologically motivated
countries like Singapore and Hong Kong. In early 2003, meter reading was accomplished
by using an electricity meter equipped with a modem to connect to a GSM network
through a serial interface with firmware control. Few problems existed due to physical
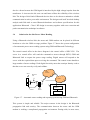
constraints of buildings. One of the major problems was connectivity due to the GSM
coverage. Since any Bluetooth enabled digital power meter can form a wireless network
(piconet) and with Bluetooth enabled smartphone, staff of electricity companies can
collect numerous meter readings from a distance of up to 100 m away from electricity
meters. Within seconds, the data collected by smartphone are sent to the energy provider’s
central office via mobile network. This solution is referred as Off-site Meter Reading
System. As a result of these solutions, electricity distributor has considerably reduced the
operating cost, elimination of human error and avoided unnecessary estimation. My role
in this project was as a lead technical consultant in a team consisting two members. My
specific responsibilities included research, develop, test, implement and document the
project. Overall management including finance, coordination and client liaison was the
responsibility of the other team member.
Chapter 4 presents the design and development undertaken to create an innovative
application of wireless food ordering system in a training restaurant run by students at the
Box Hill Institute (BHI). This chapter presents an in-depth technical operation of
Fountains Integrated Wireless Ordering System which includes systems architecture,
vi
workings, software development and implementation. It is demonstrated that by using
wireless enabled PDA, food ordering system can increase coordination efficiency for
restaurants and caterers. It saves time, reduces human errors and provides superior quality
customer service. I strongly believe that with the increase use of wireless enabled PDA in
restaurants, this application will become an important teaching and learning tool for the
hospitality educators and students. Combining simple design, lower development and
readily available emerging communications technologies, this chapter concludes that this
system is an attractive learning and teaching solution for hospitality industry and
educators. I was the key stake holder as a project manager and a mentor.
Chapter 5 showcases the design and development of an iPod as a visitor’s personal guide
at BHI. Since late 2004, the iPod has been successfully and effectively used for various
purposes in entertainment and education industry which includes media player, external
data storage device, a PDA replacement and for pod-casting. An emerging application is
developed as an interface designed around a central scroll wheel of an iPod for the
navigation, recording and playback facility which provides latest information to visitors
visiting “innovation walk” within the Institute. With the increasing use of digital media
together with the handheld devices, this iPod application will eliminate need of a human
guide and will provide an entertaining experience to visitors. This solution can be
implemented at various landmark tourist destinations such as mines, aquariums, museums
etc, and in near future will replace existing expensive technologies. I was the key stake
holder as a project manager and a mentor.
Chapter 6 aims to provide an in-depth technical in-sight into development of an
innovative student attendance recording application using emerging communication
technologies. Development of Voice over IP (VoIP) Student Attendance Recording
Application (VoIP SARRA) for BHI is presented. This project demonstrates application
programming, test bed setup, design considerations, design decisions, future plans as well
as creative usage of emerging communications technologies. Developed application
combines Cisco VoIP telephony and network systems and integrates it with existing
database systems with the aim to provide BHI with an efficient and secure way to record
and store student attendance data. This project is a success and when fully integrated
within existing system, it will provide BHI with a cost effective and efficient student
attendance recording and reporting system. This chapter concludes that the developed
vii
application has a potential for use to record student attendance at other Australian
education providers. I was a project manager and a mentor in this project.
Chapters 7, 8, 9 and 10 are presented as a breakdown of four major projects executed
between 2007 and 2011 for Aricent® Group (www.aricent.com). These chapters set out
research development for the future – Next Generation Mobile Communication. These
projects were commercially financed and business driven which warranted superior
multimedia experience, quality of service, innovative design, scalable architecture and
interoperability with other compatible technologies. They mainly focused on voice, video
and data communication in 3G and 4G. In summary, the topics of these chapters are as
follows.
Chapter 7 presents a new Packet Switching Media Access Control (PSMAC) Framework
architecture with a three-layer approach for the NEXT GEN Mobile Terminal suitable for
all IP based wireless networks. The design goal of a new NEXT GEN PSMAC Protocol
was to provide support for enhanced mobility management; handover strategy with IPv6
protocol, high throughput with efficient quality of service (QoS) oriented packet
transmission mechanism, scheduling techniques, and traffic and flow control mechanism.
PSMAC Protocol stipulates the QoS requirements for an application depending upon
traffic type and mapping various parameters for different kinds of flows, which would
ultimately make sure that an application receives the QoS it requested. Simulations results
are presented. This chapter concludes that proposed new PSMAC Framework for mobile
terminals provides high-speed data transfer and ensures high throughput for different code
rate and modulation techniques. I was a collaborating systems engineer in this project.
Chapter 8 presents a new Modular Data Link Layer (M-DALL) for NEXT GEN Mobile
Terminal to abstract common metrics and introduces a single interface for retrieving radio
link layer information. Present 3G Mobile Devices often support multiple communication
technologies. If software developers want to control the configuration or monitor the
characteristics of active Radio Access Technologies (RATs), their mobile applications
will have to use different programming interfaces for each technology on the various
supported platforms. M-DALL offers a flexible query interface and a powerful
notification mechanism to the application layer that enables applications to become linkaware. The M-DALL also compromises common data functionality that is extended
viii
through specific parts of dedicated RATs like GPRS, UMTS, CDMA2K and WLAN, that
could serve as a basis for existing and future Protocol stack development through reusable
software components. The M-DALL also provides enhanced Services like handover, data
storage and a method of power consumption. The evaluation of these enhanced services
by means of analysis, simulations and prototyping is a topic of ongoing and future work.
Additionally, special attention was paid to keep the M-DALL extendible for emerging
networking technologies. I was a collaborating systems engineer in this project.
Chapter 9 presents advanced QoS Framework for the Digital Living Network Allianceenabled Home Gateway (DLNA-HG) to provide enhanced services for accessing and
sharing various multimedia contents which are distributed over DLNA capable devices in
a digital home environment. Many measurement studies have characterized the media
access patterns and user behaviours. In order to gain insights into the current system, we
have analysed these patterns for most commonly used applications among consumers. An
analysis was carried out and it shows that the QoS is delivered on a best-effort basis in a
connected home environment. Motivated by these observations we propose a QoS
framework for DLNA-HG. DLNA home networked device interoperability guidelines
were adopted with the proposed QoS-enabled media distribution architecture for
interoperability of multimedia networking and QoS management among respective
networked devices. By combining the DLNA guidelines with the proposed QoS
architecture and integrating them into a standard home gateway and multimedia devices,
interoperability of media distribution among different networked devices and an easy-touse management of QoS for multimedia services in a digital home environment were
offered. The architecture presents an innovative perspective of identifying, classifying,
prioritizing and assigning the primary QoS parameters to devices. In other words,
deterministic quality-of-service is ensured by a process of sequential delegation, i.e. at
each stage the best fit for the given request is determined and the information is passed to
the next stage. It is the responsibility of the element in the subsequent stage to analyse and
act on this information to move closer to the optimal solution. A prototype is built based
on this architecture demonstrating the QoS feature that is implemented in a DLNA-HG.
The performance characteristics for a trial problem are also presented. I was a
collaborating systems engineer in this project.
ix
Chapter 10 is the final chapter of the dissertation. Android® is a mobile operating system
running on the Linux kernel initially developed by Google, and later the Open Handset
Alliance. This chapter presents a new architecture for efficient end-to-end performance
delivery on Android. This allows developers to write managed code in the Java language,
controlling the device using Google® developed Java libraries. Most research efforts have
concentrated on advancement in video compression techniques resulting in DivX/Xvid
codecs for better performance on handheld devices. Initial investigations reveal that these
techniques are actually taking less time compared to entire execution time in a typical
media playback system. However, it enlists that the buffer management methods
employed in multimedia framework can significantly impact the overall end-to-end
performance on these resource constrained devices. Motivated by these observations, a
heuristic buffer management scheme to improve end-to-end performance for Android
based devices is presented. An existing buffer management methods used within Packet
Video Multimedia Framework (PVMF) of Android is discussed. How buffering schemes
used between processors in hardware platform can further contribute to the performance
bottleneck is also described. Consequently, a heuristic buffer management scheme is
proposed to ensure a uniform buffer allocation among PVMF components and between
processor-coprocessor of the hardware platform. To validate the approach, an experiment
was performed using the heuristic buffer management technique to playback Xvid content
on Zoom2 hardware platform based on Android®. The performance characteristics of the
trial experiments are conducted. Experimental results lead to conclusion that the
technique is effective at improving overall system performance significantly. The
benchmark performance is achieved to further characterize this method. Finally,
evaluation trade-off between memory and performance using the method with
combinations of measurements using the experimental setup are also presented. I was a
collaborating systems engineer in this project.
x
Table of Contents
Abstract ................................................................................................................................. i
Certification of Dissertation ............................................................................................... iii
Acknowledgement .............................................................................................................. iv
Dissertation Overview ......................................................................................................... v
Table of Contents ............................................................................................................... xi
List of Figures .................................................................................................................... xx
List of Tables ................................................................................................................... xxv
List of Acronyms........................................................................................................... xxvi
List of Publications ........................................................................................................ xxxii
Chapter 1
Introduction to Emerging Communication Technologies ................................................................ 1
1.1 ... Introduction ................................................................................................................ 1
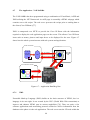
1.2 ... Emerging Communication Technologies ................................................................... 3
1.2.1 ......Wireless Fidelity .......................................................................................... 3
1.2.2 ......Bluetooth ...................................................................................................... 4
1.2.3 ......Intelligent Networks ..................................................................................... 5
1.2.4 ......Voice-Based Services ................................................................................... 6
1.2.5 ......Computer Telephony Integration ................................................................. 6
1.2.6 ......Ultra Wide Band .......................................................................................... 7
1.2.7 ......Zigbee........................................................................................................... 7
1.2.8 ......Wireless LAN ............................................................................................... 8
1.2.9 ......3G................................................................................................................. 9
1.2.10 ....4G............................................................................................................... 11
xi
1.3 ... Implications for In-Service Provision ...................................................................... 15
1.3.1 ......Standards ................................................................................................... 15
1.3.2 ......Deployment and Business Model ............................................................... 16
1.3.3 ......Occupational Health and Safety ................................................................ 17
1.3.4 ......Short Term Solutions.................................................................................. 18
1.3.5 ......Adopting Supply Chain Management ........................................................ 18
1.3.6 ......New Revenue with SMS and MMS ............................................................. 18
1.3.7 ......Future Directions ....................................................................................... 18
1.4 ... Conclusions .............................................................................................................. 19
Chapter 2
Scalable and Secure Wireless Communication Technology Implementation for the
Sydney Airport Corporation Limited (2001-2003) ........................................................... 21
2.1 ... Introduction .............................................................................................................. 21
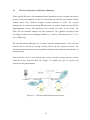
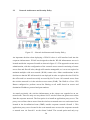
2.2 ... WLAN Architecture and Security Challenges ......................................................... 23
2.3 ... Network Architecture and Security Policy .............................................................. 24
2.4 ... SACL Wireless Authentication ................................................................................ 25
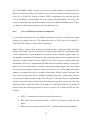
2.5 ... Wireless Data Privacy Enhancements ...................................................................... 26
2.6 ... Computerised Mobile Maintenance ......................................................................... 29
2.7 ... Wireless VPN Remote Access Solution .................................................................. 30
2.8 ... Wireless Voice over IP Pilot Program ..................................................................... 31
2.9 ... Tenant Wireless Connectivity .................................................................................. 32
2.10 . Public Wireless Internet Connectivity ..................................................................... 33
2.11 . Customer Satisfaction .............................................................................................. 35
2.12 . Conclusions and Future Projects .............................................................................. 38
2.13 . Projects Status .......................................................................................................... 39
xii
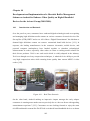
Chapter 3
Development and Implementation of Wireless Application for Securely Recording
Electricity Consumption for the Hong Kong Electricity Company (2004-2005) ............. 42
3.1 ... Introduction .............................................................................................................. 42
3.2 ... GSM Solution for Electricity Meter Reading .......................................................... 43
3.3 ... Problems with the GSM Network Solution ............................................................. 44
3.4 ... Solution for On-Site Power Meter Reading ............................................................. 46
3.5 ... Solution for Off-Site Meter Recording and Reporting System ................................ 50
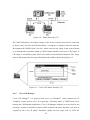
3.6 ... System Configuration .............................................................................................. 50
3.7 ... Design Considerations ............................................................................................. 51
3.8 ... System Hardware ..................................................................................................... 54
3.9 ... System Software ...................................................................................................... 55
3.10 . Conclusions .............................................................................................................. 58
Chapter 4
Design and Development of a PDA based Wireless Food Ordering System for the Box
Hill Institute (2005-2006) .................................................................................................. 61
4.1 ... Introduction .............................................................................................................. 61
4.2 ... Related Work ........................................................................................................... 62
4.3 ... Approach in selecting PHP / Mobile Technology.................................................... 62
4.4 ... Methodology ............................................................................................................ 64
4.5 ... System Architecture ................................................................................................. 66
4.6 ... PDA Client ............................................................................................................... 67
4.7 ... Centralised Relational Database (CRD) .................................................................. 68
4.8 ... Back-end Application Software ............................................................................... 69
4.9 ... Wireless Connectivity .............................................................................................. 70
xiii
4.10 . Security .................................................................................................................... 72
4.11 . Limitations ............................................................................................................... 73
4.12 . Lessons Learned ....................................................................................................... 73
4.13 . Future Work ............................................................................................................. 74
4.14 . Conclusions .............................................................................................................. 75
Chapter 5
Design and Development of a Visitor’s Personal Guide using iPod for the Box Hill
Institute (2006) .................................................................................................................. 76
5.1 ... Introduction .............................................................................................................. 76
5.2 ... Background .............................................................................................................. 77
5.3 ... Personal Guide Design ............................................................................................. 79
5.4 ... Content Page ............................................................................................................ 79
5.5 ... Alternative Operating Systems for Apple’s iPod ..................................................... 80
5.6 ... An alternative iPod operating system ...................................................................... 81
5.7 ... Advantages ............................................................................................................... 82
5.8 ... Future Trends ........................................................................................................... 83
5.9 ... Conclusions .............................................................................................................. 83
Chapter 6
Design and Implementation of an Innovative Student Attendance Recording and
Retrieval Application (SARRA) for the Box Hill Institute (2006-2007) .......................... 84
6.1 ... Introduction .............................................................................................................. 84
6.2 ... Related Work ........................................................................................................... 86
6.3 ... Project Justification .................................................................................................. 87
6.4 ... Student Attendance Recording Process ................................................................... 88
xiv
6.4.1 ......Current Process ......................................................................................... 88
6.4.2 ......Proposed Process....................................................................................... 90
6.5 ... Application Prototype .............................................................................................. 91
6.6 ... System Architecture ................................................................................................. 92
6.6.1 ......Design Overview ........................................................................................ 92
6.6.2 ......Cisco VoIP Phones and there Comparison ............................................... 93
6.6.3 ......Cisco Call Manager ................................................................................... 95
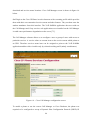
6.6.4 ......Application and Web Server ...................................................................... 97
6.7 ... The Application – VoIP SARRA ............................................................................. 98
6.7.1 ......XML............................................................................................................ 98
6.7.2 ......VB.NET ...................................................................................................... 99
6.7.3 ......HTTP ........................................................................................................ 100
6.7.4 ......Database .................................................................................................. 101
6.8 ... Development Environment .................................................................................... 102
6.9 ... Project Constraints and Limitations ....................................................................... 105
6.9.1 ......Constraints ............................................................................................... 105
6.9.2 ......Limitations ............................................................................................... 105
6.9.3 ......Development of Options Due to Limitations ............................................ 106
6.9.4 ......Preferred Option ...................................................................................... 108
6.10 . Evaluation .............................................................................................................. 109
6.11 . Lessons Learned ..................................................................................................... 110
6.12 . Future Work ........................................................................................................... 111
6.13 . Conclusions ............................................................................................................ 112
xv
Chapter 7
Design and Development of a New Three Layered MAC Architecture for the NEXT
GEN Mobile Terminals for the Aricent Group (2007-2009) .......................................... 113
7.1 ... Introduction ............................................................................................................ 113
7.2 ... Proposed New NEXT GEN MAC Layer ............................................................... 113
7.3 ... Mobility Management Sub-layer ........................................................................... 115
7.4 ... Resource Management Sub-layer .......................................................................... 117
7.5 ... QoS Management Sub-layer .................................................................................. 119
7.5.1 ......QoS Manager ........................................................................................... 119
7.5.2 ......Traffic and Flow Control Module ............................................................ 130
7.5.3 ......Packet Flow Scheduling ........................................................................... 132
7.6 ... Implementation Methodology ................................................................................ 133
7.7 ... Simulation and Results........................................................................................... 135
7.8 ... Conclusions ............................................................................................................ 138
Chapter 8
Modular Data Link Layer (M-DALL) for NEXT GEN Mobile Terminals Enabling
Wireless Aware Applications: A Platform Independent Software Design for the Aricent
Group (2008-2009) .......................................................................................................... 139
8.1 ... Introduction ............................................................................................................ 139
8.2 ... Related Work and Proposed Concept .................................................................... 140
8.3 ... High Level Requirements ...................................................................................... 141
8.4 ... M-DALL Interface Architecture ............................................................................ 142
8.4.1 ......The Application Layer Interface .............................................................. 143
8.4.2 ......The Network Layer Interface ................................................................... 144
8.4.3 ......The Transport Layer Interface ................................................................. 145
xvi
8.4.4 ......The Physical Layer Interface ................................................................... 145
8.5 ... M-DALL Software Architecture ............................................................................ 145
8.5.1 ......Common Data Function Framework (CDFF) Software Architecture ..... 147
8.5.2 ......Handover Controller ................................................................................ 151
8.6 ... M-DALL Enhanced Services ................................................................................. 154
8.6.1 ......M-DALL for Unlicensed Mobile Access (UMA) ...................................... 154
8.6.2 ......M-DALL for IEEE 802.21-based Media Independent Handover (MIH) . 155
8.6.3 ......M-DALL for Voice ................................................................................... 156
8.6.4 ......M-DALL for Battery Life ......................................................................... 157
8.6.5 ......M-DALL for Power Saving ...................................................................... 157
8.6.6 ......M-DALL Storage Library ........................................................................ 159
8.7 ... Conclusions and Future Work................................................................................ 159
Chapter 9
Development and Implementation of DLNA-enabled Mobile Terminal and Home
Gateway offering an Adaptive QoS framework for the Digital Home Environment to
Cater for Multimedia Services for the Aricent Group (2009-2010) ................................ 160
9.1 ... Introduction ............................................................................................................ 160
9.2 ... Design Approach .................................................................................................... 161
9.2.1 ......Device Discovery ..................................................................................... 162
9.2.2 ......Device Removal ....................................................................................... 162
9.2.3 ......Bandwidth Allocation............................................................................... 162
9.2.4 ......Bandwidth Re-allocation ......................................................................... 162
9.3 ... Proposed Adaptive QoS Framework ...................................................................... 162
9.4 ... Bandwidth Allocation Policy ................................................................................. 163
9.5 ... QoS Manager ......................................................................................................... 164
xvii
9.6 ... Traffic Classification .............................................................................................. 165
9.7 ... Service Class Manager ........................................................................................... 167
9.8 ... Real-Time Traffic Manager ................................................................................... 168
9.9 ... QoS with Feedback Mechanism ............................................................................ 168
9.9.1 ......A/V Synchronisation Module ................................................................... 169
9.9.2 ......Receive Side Video Rendering ................................................................. 170
9.9.3 ......Send Side Video Frame Timestamp Generation ...................................... 170
9.9.4 ......Example: Streaming on Mobile over DLNA-HG ..................................... 170
9.10 . Media Distribution System with QoS .................................................................... 172
9.10.1 ....Media Server Device ................................................................................ 173
9.10.2 ....DLNA -HG Device ................................................................................... 173
9.10.3 ....Media Renderer Device ........................................................................... 174
9.10.4 ....Example: Media Distribution .................................................................. 175
9.11 . Prototype Implementation and Results .................................................................. 177
9.12 . Conclusions ............................................................................................................ 180
Chapter 10
A Heuristic Buffer Management Scheme on Android to Enhance Video Quality on
Digital Handheld Devices for the Aricent Group (2009-2010) ....................................... 182
10.1 . Introduction and Rationale ..................................................................................... 182
10.2 . Design Approach .................................................................................................... 183
10.3 . System Model ........................................................................................................ 184
10.4 . Existing System ...................................................................................................... 185
10.5 . Proposed System: Heuristic Buffer Management Technique ................................ 186
10.5.1 ....Variable Length Decoding (VLD) Engine Method .................................. 189
10.5.2 ....Shared Cache Method .............................................................................. 190
xviii
10.5.3 ....Direct Memory Access Method ................................................................ 190
10.6 .... Test Bed ............................................................................................................... 191
10.7 .... Performance Evaluationa and Memory Requirements ........................................ 192
10.8 .... Time Measurement .............................................................................................. 194
10.9 .... Conclusions.......................................................................................................... 195
Chapter 11
Conclusion ....................................................................................................................... 197
References ....................................................................................................................... 199
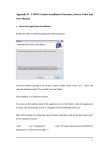
Appendix A – FIWOS System Installation Procedure, User Manual and Source Codes 209
Appendix B – VoIP SARRA Source Codes and Cisco XML Objects ............................ 211
xix
Table of Figures
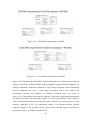
Figure 1-1 – CRE in 4G networks ..................................................................................... 12
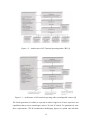
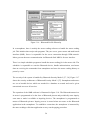
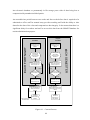
Figure 1-2 – Architecture of 4G Terminal operating under CRE...................................... 13
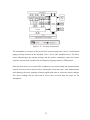
Figure 1-3 – Architecture of 4G terminal operating under reconfigurable context........... 13
Figure 2-1 – Existing SACL Wired Communication Network ......................................... 22
Figure 2-2 – Wireless and Wired Network Security ......................................................... 23
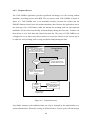
Figure 2-3 – Network Architecture and Security Policy ................................................... 24
Figure 2-4 – SACL Wireless Authentication – LEAP ...................................................... 26
Figure 2-5 – Computerised Maintenance Management System ........................................ 29
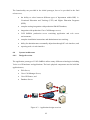
Figure 2-6 – VPN Authentication Process ........................................................................ 30
Figure 2-7 – Wireless VoIP Pilot Program ........................................................................ 31
Figure 2-8 – Public Wireless Internet Connectivity .......................................................... 34
Figure 2-9 – SACL Wireless Deployment ........................................................................ 36
Figure 2-10 - Total Wireless Connectivity ........................................................................ 37
Figure 3-1 – A schematic of electricity distribution and transmission in Hong Kong ...... 42
Figure 3-2 – Connection of GSM modem ......................................................................... 43
Figure 3-3 – Typical layout of a shopping mall ................................................................ 44
Figure 3-4 – Typical layout of a large restaurant .............................................................. 44
Figure 3-5 – Typical layout of a multi-storey office block ............................................... 44
Figure 3-6 – Electricity meters in a secure rack ................................................................ 45
Figure 3-7 – Automatic meter reading and reporting system using GSM and Bluetooth . 46
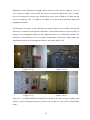
Figure 3-8 – (a) GSM and Bluetooth modules mounted on the wall; (b) power supply
main switch; (c) power distribution panel in a metal rack; and (d) rear view of power
distribution panel ............................................................................................................... 47
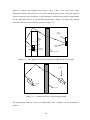
Figure 3-9 – Line diagram of reflected signal path of Bluetooth wireless link ................. 48
xx
Figure 3-10 – Antenna directivity and propagation path ................................................... 48
Figure 3-11 – Off-site Meter Recording and Reporting System ....................................... 50
Figure 3-12 – Class 2 Configuration ................................................................................. 53
Figure 3-13 – Class 1 and Class 2 combination ................................................................ 53
Figure 3-14 – Class 1 Configuration ................................................................................. 53
Figure 3-15 – Class 1 Bluetooth module design for power meter ..................................... 55
Figure 3-16 – Bluetooth Profile Hierarchy ........................................................................ 56
Figure 3-17 – Security Architecture .................................................................................. 57
Figure 3-18 – Operation of OMR software ....................................................................... 58
Figure 4-1 – Mobile Applications: Architecture, Design and Development ..................... 63
Figure 4-2 – Layout of Fountains Restaurant .................................................................... 65
Figure 4-3 – Logical Wireless Network Diagram ............................................................. 65
Figure 4-4 – System Information Flow Diagram .............................................................. 67
Figure 4-5 – Table Summary……………………….........................................................63
Figure 4-6 – Add Meals Sub-Menu ................................................................................... 68
Figure 4-7 – Back-end GUI ............................................................................................... 69
Figure 4-8 – Wireless PDA Connectivity .......................................................................... 71
Figure 4-9 – Alternate printing option............................................................................... 72
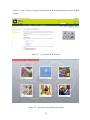
Figure 5-1 – Innovation Walk Website ............................................................................. 78
Figure 5-2 – Sections of the Walk of Innovation .............................................................. 78
Figure 5-3 – Sample Main Function created using “C” Programming Language............. 81
Figure 5-4 – Design of a Main Menu ................................................................................ 82
Figure 6-1 – Current Process ............................................................................................. 89
Figure 6-2 – Proposed Process .......................................................................................... 90
Figure 6-3 – Application design overview ........................................................................ 92
Figure 6-4 – Phone Protocols ............................................................................................ 95
xxi
Figure 6-5 – Cisco VoIP Phone Interface .......................................................................... 95
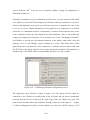
Figure 6-6 – Cisco Call Manager Configuration Screen ................................................... 96
Figure 6-7 – Application Data/Msg flow .......................................................................... 98
Figure 6-8 – XML Coding ................................................................................................. 99
Figure 6-9 – HTTP Response & Request ........................................................................ 100
Figure 6-10 – Database logic ........................................................................................... 101
Figure 6-11 – SQL Database ........................................................................................... 102
Figure 6-12 – Laptop – A configurations ........................................................................ 103
Figure 6-13 – Laptop – B configurations ........................................................................ 103
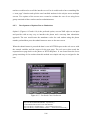
Figure 6-14 – Call Manager Emulator configuration screen ........................................... 104
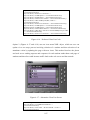
Figure 6-15 – Preferred Class List Screen ....................................................................... 106
Figure 6-16 – Preferred Class List Code ......................................................................... 107
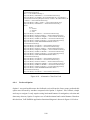
Figure 6-17 – Alternative Class List Screen .................................................................... 107
Figure 6-18 – Alternative Class List Code ...................................................................... 108
Figure 6-19 – VoIP SARRA Application Functional Diagram ....................................... 109
Figure 7-1 – Challenges and related solutions in the proposed MAC architecture ........ 114
Figure 7-2 – Proposed new NEXT GEN MAC Layer .................................................... 115
Figure 7-3 – QoS Management Sub-layer ....................................................................... 120
Figure 7-4 – Queue Management .................................................................................... 122
Figure 7-5 – MAC Management Interface ...................................................................... 123
Figure 7-6 – Radio Link Control Data Flow Diagram .................................................... 124
Figure 7-7 – Radio Link Control Software Architecture ................................................. 125
Figure 7-8 – Actual Data Flow through IP ...................................................................... 129
Figure 7-9 – Traffic and Flow Control Module ............................................................... 131
Figure 7-10 – MAC Implementation Methodology ........................................................ 134
Figure 7-11 – OFDM Physical Layer Model .................................................................. 135
xxii
Figure 7-12 – Simulation Result for Uplink .................................................................... 136
Figure 7-13 – Simulation Result for Downlink ............................................................... 136
Figure 8-1 - M-DALL Concept ....................................................................................... 140
Figure 8-2 – M-DALL High level Requirements ............................................................ 141
Figure 8-3 – M-DALL Interface Architecture ................................................................. 143
Figure 8-4 – M-DALL Software Modules ...................................................................... 144
Figure 8-5 – Link Layer Architecture.............................................................................. 146
Figure 8-6 – Layer 2 Interface Architecture .................................................................... 147
Figure 8-7 – CDFF Software Architecture ...................................................................... 148
Figure 8-8 – Handover Controller in M-DALL............................................................... 150
Figure 8-9 – M-DALL for UMA ..................................................................................... 155
Figure 8-10 – M-DALL for IEEE 802.21-based MIH .................................................... 156
Figure 8-11 – M-DALL for Power Saving ...................................................................... 158
Figure 9-1 – DLNA Enabled Home Gateway with QoS Support ................................... 161
Figure 9-2 – Proposed Software Modules in Adaptive QoS Framework ........................ 163
Figure 9-3 – Interface of Adaptive QoS Framework within Services Layer................... 167
Figure 9-4 – Execution Process for QoS Framework ...................................................... 169
Figure 9-5 – Execution Process of QoS Framework ....................................................... 171
Figure 9-6 – Media Distribution between Gateway, Server and Renderer ..................... 172
Figure 9-7 – QoS negotiation between DLNA-HG, Media Server and Mobile Devices 173
Figure 9-8 – Test Bed Setup ............................................................................................ 176
Figure 9-9 – Experimental Test Environment ................................................................. 178
Figure 9-10 – Throughput of Video Streaming without QoS Framework ...................... 178
Figure 9-11 – Throughput of Video Streaming with QoS Framework ........................... 179
Figure 9-12 – GUI for media content sharing running over DLNA enabled M-DMP
and M-DMS ..................................................................................................................... 179
xxiii
Figure 9-13 – DLNA based Video Player streaming the media running over DLNA
enabled Android and Windows mobile devices .............................................................. 180
Figure 10-1 – Real Time Scenario ................................................................................... 182
Figure 10-2 – System Architecture .................................................................................. 184
Figure 10-3 – Existing Middleware System Model ........................................................ 185
Figure 10-4 – Proposed Middleware System Model ....................................................... 187
Figure 10-5 – Component Architecture on PVMF on Zoom2 Platform ......................... 189
Figure 10-6 – Component Architecture of Zoom2 .......................................................... 191
Figure 10-7 – Results shown on Zoom2 board using Heuristic Buffer Management
Scheme ............................................................................................................................ 192
Figure 10-8 – DSP RAM requirements on OMAP ......................................................... 193
Figure 10-9 – Cortex RAM requirements on OMAP ...................................................... 193
Figure 10-10 – Performance Analysis ............................................................................. 194
xxiv
List of Tables
Table 4-1 - Centralised Relational Database ..................................................................... 69
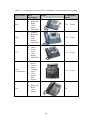
Table 6-1 – Comparison of selected Cisco VoIP Phones for Application Development .. 94
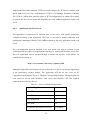
Table 6-2 – Server Software Requirements ....................................................................... 97
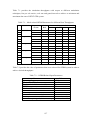
Table 7-1 – Mode related OFDM Parameters for different Data Throughputs ............... 137
Table 7-2 – OFDM Related Input Parameters ................................................................. 137
xxv
List of Acronyms
1G
First Generation
2G
Second Generation
3G
Third Generation
4G
Fourth Generation
A/V
Audio Video
AAA
Accounting, Authentication and Authorisation
ACK
Acknowledgement
ADSL
Asymmetric Digital Subscriber Line
ADT
Average Decoding Time
AES
Advanced Encryption Standard
AMPS
Advanced Mobile Phone Systems
AP
Access Point
API
Application Programming Interface
ARM
Acorn RISC Machine
ARQ
Automatic Repeat Request
ASP
Active Server Pages
ATD
Automatic Call Distribution
ATM
Asynchronous Transfer Mode
BCP
Basic Call Processing
BCSM
Basic Call State Model
BER
Bit Error Rate
BHI
Box Hill Institute
BRS
Baggage Reconciliation System
CDF
Common Data Functions
CDFF
Common Data Function Framework
CDMA
Code Division Multiple Access
CIP
Channel Interface Processor
CLP
China Light and Power Limited
CMMS
Computerised Maintenance Management System
CPU
Central Processing Unit
CRD
Centralised Relational Database
CRE
Composite Radio Environment
xxvi
CRM
Customer Relationship Management
CSD
Circuit Switching Data
CSV
Comma Separated Value
CTI
Computer Telephony Integration
DB
Dynamic Bandwidth
DHCP
Dynamic Host Configuration Protocol
DLLF
Data Link Function Framework
DLNA
Digital Living Network Alliance
DMA
Direct Memory Access
DMP
Digital Media Player
DMS
Digital Media Server
DMZ
De-Militarised Zone
DPF
Digital Picture Frame
DSP
Digital Signal Processor
DS-UWB
Direct Sequence Ultrawide Band
DTG
Decoding Time Gaps
DVB
Digital Video Broadcasting
DWDM
Dense Wavelength Division Multiplexing
EAP
Extensible Authentication Protocol
EAP-TLS
EAP Transport Layer Security
Ec/Io
Energy per Chip to Total Receive Power
EDGE
Enhanced Digital GSM Evolution
EMI
Electromagnetic Interference
ESP
Encapsulation Protocol
EU
European Union
FER
Frame Error Rate
FHS
Frequency Hopping Sequence
FHSS
Frequency-Hopping Spread-Spectrum
FTP
File Transfer Protocol
GPP
General Purpose Processor
GPRS
General Packet Radio Service
GSM
Global System for Mobile
GUI
Graphical User Interface
HC
Handover Control
xxvii
HDTV
High Density Television
HG
Home Gateway
HTML
Hyper Text Mark-up Language
HTTP
Hyper Text Transfer Protocol
HTTPS
Hyper Text Transfer Protocol over Secure Socket Layer
I/O
Input/Output
ICT
Information Communications Technology
IEEE
Institute of Electrical and Electronics Engineers
IIS
Internet Information Services
IM
Instant Messaging
IN
Intelligent Networks
INAP
Intelligent Networks Application Part
IP
Internet Protocol
IPTV
Internet Protocol Television
ISM
Industrial, Scientific and Medical
ISP
Internet Service Provider
IVR
Interactive Voice Response
J2EE
Java 2 Platform Enterprise Edition
J2ME
Java 2 Platform Micro Edition
JAIN
Java APIs for Integrated Networks
L2TP
Layer Two Tunnelling Protocol
LAN
Local Area Network
LEAP
Light-weight Extensible Authentication Protocol
LLC
Logical Link Control
LNA
Low Noise Amplifier
LTE
Long Term Evolution
MAC
Medium Access Control
MAP
Mobile Application Part
MCU
Microcontroller Unit
MIC
Message Integrity Check
MIH
Mobile Independent Handover
MMS
Multimedia Messaging Service
MPEG
Moving Pictures Experts Group
NAK
Non-Acknowledgement
xxviii
NEXT GEN
Next Generation
ODBC
Open Database Connection
OFDM
Orthogonal Frequency Division Multiplexing
OMAP
Open Multimedia Application Platform
OMR
Off-site Meter Reading
PA
Power Amplifier
PAN
Personal Area Network
PBX
Private Branch Exchange
PC
Personal Computer
PCS
Personal Communication System
PDA
Personal Digital Assistant
PDCP
Packet Data Convergence Protocol
PDU
Packet Data Unit
PHP
Personal Home Page or Hypertext Pre-processor
PMP
Portable Media Player
PoS
Point of Sale
PSTN
Public Switched Telephony Network
QoE
Quality of Experience
QoS
Quality of Service
QM
QoS Manager
R&D
Research and Development
RADIUS
Remote Authentication Dial-In User Service
RAT
Radio Access Technology
RB
Radio Bearer
RF
Radio Frequency
RLC
Radio Link Control
RSCP
Received Signal Code Power
RSSI
Received Signal Strength Indicator
RTP
Real-time Transport Protocol
RTT
Round Trip Time
RX
Receiver Module
SACL
Sydney International Airport Corporation Limited
SAR
Specific Absorption Rate
SCP
Service Control Point
xxix
SD
Secure Digital
SDK
Software Development Kit
SDU
Service Data Unit
SIB
Service Independent Building Block
SIG
Special Interest Group
SLEE
Service Logic Execution Environment
SLP
Service Logic Program
SMS
Short Messaging Service
SNDCP
Sub-Network Convergence Data Protocol
SNR
Signal to Noise Ratio
SQL
Server Query Language
SSI
Signal Strength Indicator
SSID
Service Set Identifier
SSL
Secure Socket Layer
SSP
Service Switch Point
TAFE
Technical and Further Education
TDM
Time Division Multiplexing
TDMA
Time Division Multiple-Access
TFTP
Trivial File Transfer Protocol
TKIP
Temporal Key Integrity Protocol
TTI
Transmission Time Interval
TX
Transmission Module
UMA
Unlicensed Mobile Access
UMTS
Universal Mobile Telecommunications Systems
UPnP
Universal Plug and Play
USB
Universal Serial Bus
UTP
Unshielded Twisted Pair
UTRAN
UMTS Terrestrial Radio Access Network
UWB
Ultra Wide Band
VB
Visual Basic
VLD
Variable Length Decoding
VoIP
Voice over Internet Protocol
VPN
Virtual Private Network
VWLAN
Virtual Wireless Local Area Network
xxx
WAMP
Windows Apache MySQL PHP
WAN
Wide Area Network
WAR
Wireless Access Router
WCDMA
Wideband Code Division Multiple Access
xxxi
List of Publications
[1]
Keyurkumar J. Patel, Vijay Singh, “Services for Third and Forth Generations:
Technologies and Implications”, in the Proc. International Conference on Computer,
Communication and Control Technologies: CCCT’03, vol. 4, pp. 97-102, July 31,
August 1-2, 2003, Orlando, Florida, USA.
[2]
Keyurkumar J. Patel, Steven McCubben, “Addressing Wireless Security Issues
during Implementation of Wireless Applications in a Highly Mobile Organisation”,
Savoie, M.J., Chu, H.W., Patel, K., Tran, N. & Ahmad, A. (editors) in the Proc.
International
Conference
on
Computing,
Communications
and
Control
Technologies: CCCT’04, vol. 7, pp. 13-18, Aug. 14-17, 2004, Austin, Texas, USA.
[3]
Keyurkumar J. Patel, Steven McCubben, “Implementation of Wireless Technology
in a Highly Mobile Organisation: Challenges and Issues”, in the Proc. 8th World
Multi-Conference on Systemics, Cybernetics and Informatics: SCI 2004, vol. 13, pp.
309-314, July 18-21, 2004, Orlando, Florida, USA.
[4]
Keyurkumar J. Patel, Steven McCubben, “Implementation of Secure Wireless
Communication Technology in a Highly Mobile Organisation: Challenges and
Issues”, Journal of Personal Wireless Communications, vol. 35, no. 3, pp. 255-267,
Nov. 2005, Kluwer Academic Publishers, U.S.A. ISSN: 0929-6212.
[5]
Keyurkumar J. Patel, “Successful Implementation of Emerging Communication
Technologies in a Mobile-Intense Organization: A Case Study of Sydney Airport
Corporation Limited (SACL)”, Handbook of Research in Mobile Business:
Technical, Methodological and Social Perspective. Hershey, PA, USA: IDEA Group
Publishing (IGP). (As a book chapter)
[6]
Keyurkumar J. Patel, Wing K. Tam, “Application of Bluetooth for a Secure Electric
Meter Reading in an Urban Environment”, in Proc. Wireless Personal Multimedia
Communications: WPMC’05, Sept. 17-22, 2005, Aalborg, Denmark. (IEEE
Conference)
[7]
Keyurkumar J. Patel, Wing. K. Tam, “A Secure Electric Meter Reading Application
using Bluetooth”, in Proc. IASTED International Conference on Networks and
Communication Systems: NCS 2005, pp. 149-154, April 18-20, 2005, Krabi,
Thailand.
xxxii
[8]
Wing K. Tam, Keyurkumar J. Patel, Nguyen Tran, “Developing Wireless
Application for Secure Electric Power Meter Reading using Bluetooth”, in Savoie,
M.J., Chu, H.W., Patel, K., Tran, N. & Ahmad, A. (eds) Proc. International
Conference on Computing, Communications and Control Technologies: CCCT’04,
vol. 7, pp. 23-27, Aug. 14-17, 2004, Austin, Texas, USA.
[9]
Keyurkumar J. Patel, Andrew Y. J. Lee, “Realistic simulation of a wireless signal
propagation in an urban environment”, the International Journal of Simulations,
Systems, Science and Technology (IJSSST), vol. 10, no. 6, pp. 1-5, November 2010,
ISSN: 1473-804x online, 1473-8031 print.
[10] Keyurkumar J. Patel, Umesh Patel, Andrew Obersnel, “PDA based Wireless Food
Ordering System for Hospitality Industry – A Case Study of the Box Hill Institute”,
Wireless Telecommunications Symposium – WTS 2007, CalPoly, Pomona, California,
USA, April 26-28, 2007. (IEEE Conference)
[11] Keyurkumar J. Patel, Umesh Patel, “iPod as a visitor’s personal guide”, in
Encyclopaedia of Mobile Computing and Commerce, David Taniar (editor), vol. 2,
pp. 365-368, 2007, Idea Group Inc., Hershey, PA, USA.
[12] Keyurkumar J. Patel, S. Nocker, C. Tolson, “Development of an Innovative VoIP
Student Attendance Recording Application (VoIP SARRA), accepted in the
Australasian Journal of Engineering Education (AJEE), vol. 16, no. 2, pp. 87-99,
2010.
[13] Keyurkumar J. Patel, S. Vijay Anand, Suman Kumar S. P., “A novel QoS platform to
ensure efficient media delivery to DLNA enabled Android based devices”, accepted
in the 2010 IEEE International Conference on Wireless Communications,
Networking and Information Security (WCNIS 2010), 25-27 June 2010, Beijing,
China. (IEEE Conference)
[14] Keyurkumar J. Patel, S. Vijay Anand, Suman Kumar S. P., “A novel scalable
architecture for efficient QoS to cater IMS services for handheld devices based on
Android”, accepted in the Fourth International Conference on Next Generation
Mobile Applications, Services and Technologies (NGMAST 2010), 26-29 July 2010,
Amman, Jordan. (IEEE Conference)
[15] Keyurkumar J. Patel, S. Vijay Anand, Suman Kumar S. P., “Aggregate functional
software architecture on Android for end-2-end real time interactive content
xxxiii
management to cater IPTV services on digital handheld devices”, the Fourth
International Conference on Next Generation Mobile Applications, Services and
Technologies (NGMAST 2010), 26-29 July 2010, Amman, Jordan. (IEEE
Conference)
[16] Keyurkumar J. Patel, S. Vijay Anand, Suman Kumar S. P., “A heuristic buffer
management scheme on Android to enhance video quality on digital handheld
devices”, the Fourth International Conference on Next Generation Mobile
Applications, Services and Technologies (NGMAST 2010), 26-29 July 2010, Amman,
Jordan. (IEEE Conference)
xxxiv
Chapter 1
Introduction to Emerging Communication Technologies
1.1
Introduction
Telecommunications service providers form an integral part of communications
infrastructure. This infrastructure forms the backbone of modern-day services, such as
connection to the internet service provider (ISP) via T1, virtual private network (VPN),
switching, routing etc. Equipment manufacturers, swings from prosperity to downturns
have been reflected in their respective stock performances [1]. However, the more recent
and sudden slowdown, particularly in capital spending on networking equipment, has
resulted in massive corporate restructuring and workforce realignment in the information
communications technology (ICT) industry. Through merger and acquisition strategies,
major telecom equipment suppliers such as Cisco, Alcatel-Lucent, Juniper, Qualcomm
and Nortel, expanded their product portfolios globally.
First generation (1G) mobile was analogue voice and offered no roaming or security. In
the 1990s, mobile services based on digital mobile technologies ushered in the 2G of
wireless that we have today. In the US, these were referred to as personal communication
systems (PCS) and used technologies such as time division multiple-access (TDMA),
code division multiple access (CDMA) and global system for mobile (GSM). The main
focus of wireless mobile services has been voice telephony. However, in recent years
there has been growing interest in data services as well. While data services are available
over advanced mobile phone systems (AMPS), these are limited to quite low data rates
(<10 Kbps). Higher speed data and other advanced telephone services are more readily
supported over the digital second generation (2G).
2G cellular networks were introduced in early 2000 and included mobile systems such as
GSM communication and their evolutions, often called 2.5G systems such as enhanced
digital GSM evolution (EDGE), general packet radio service (GPRS) and IS136 [1].
These systems are based on TDMA technology. 2G systems essentially offered the same
service, voice with the advantages of digital transmission and global standardisation,
including roaming and tighter security. Taking 9.6 Kbps as the data rate available for 2G,
2.5G offers higher rates anything from 14.4 Kbps at launch to a maximum of 160 Kbps.
1
More importantly, 2.5G also offers ‘always-on’ and per packet charging (as is the case
with i-mode).
Anticipation that average revenue per user would continue to decline, 2G wireless service
operators looked to third generation (3G) broadband services as the next promising
opportunity to maximise business growth. 3G mobile networks known as universal
mobile telecommunications systems (UMTS and CDMA2000) based on code division
multiple access (CDMA) technology that provides speed up to 2 Mbps. Wireless
equipment manufacturers invested heavily in the research and development (R&D) of 3G
system equipment and handsets [2]. Spending on 3G product and system development by
most of the major wireless equipment manufacturers has curved upward steeply [2].
As 3G equipment manufacturers continued to promote and encourage 3G capabilities and
full-colour video wireless handsets, wireless service providers, investors and consumers
became excited and anxiously awaited the arrival of 3G.
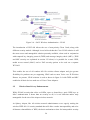
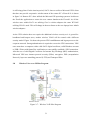
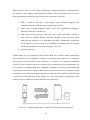
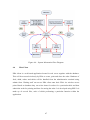
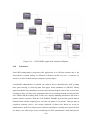
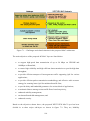
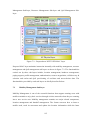
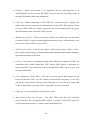
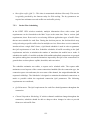
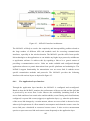
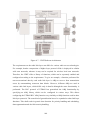
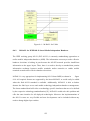
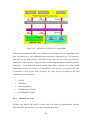
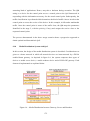
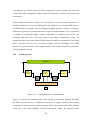
The major expectation from the fourth generation (4G) of wireless communication
networks is to be able to handle much higher data rates, which will be up to 1 GB in the
wireless local area network (WLAN) environment and 100 MB in cellular networks. A
user, with a large range of mobility, will access the network and will be able to seamlessly
reconnect to different networks, even within the same session. The spectrum allocation is
expected to be more flexible and spectrum sharing among the different sub-networks is
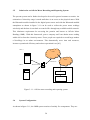
anticipated [3]. In such a composite radio environment (CRE), it is anticipated that there
will be a need for more adaptive and reconfigurable solutions on all layers in the network
[4].
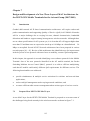
The sudden economic slowdown at the end of 2001 and again in 2008 caught almost
everyone off-guard. The telecom industry suffered severe downturns in sales and revenue.
The following factors were responsible [1-5]:
2G/3G/4G license auctions;
uncertain 2G/3G/4G profitability;
network over-build and competition;
heavy debt among telecom start-ups and dot coms;
2
1.2
B2C and B2B investment spending cuts; and
write-offs on acquisitions and many more.
Emerging Communication Technologies
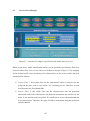
1.2.1 Wireless Fidelity
Wi-Fi is the popular name for the wireless Ethernet 802.11x standard for WLAN. It
allows collections of personal computers, dumb terminals and other distributed computing
devices such as personal digital assistant (PDA) etc, to share common resources and
peripherals. One of the most popular LAN technologies was Ethernet. Over the years, the
IEEE has approved a succession of Ethernet standards to support higher capacity LANs
over a diverse array of media [5].
The two most fundamental 802.11x family are 802.11a which operates at 11 Mbps in the
2.4 GHz band and 802.11b which operates up to 54 Mbps in the 5 GHz unlicensed
spectrum band. Other 802.11x standards include 802.11g which offers up to 100 Mbps in
the 2.4 GHz band; 802.11e which adds quality-of-service support to manage latency
which is important for supporting voice telephone; 802.11h solves problems like
interference with satellites and radar using 5 GHz; and 802.11i which adds security
features of Wi-Fi protected access (WPA) by replacing wired equivalent privacy (WEP).
802.11i uses advanced encryption standard (AES). WLAN operate using unlicensed
spectrum in the 2.4 GHz band. The current generation of WLAN support up to 512 Mbps
data rates within 100 meters of the base station. Most typically, WLAN are deployed in a
distributed way to offer last-hundred-meter connectivity to a wired backbone corporate or
campus network. Typically in a corporate environment, WLAN are implemented as part
of a private network. The base station equipment is owned and operated by the end-user
community as part of the corporate enterprise, campus, or government network. In
general, use of the network is free to the end-users that is, it is subsidised by the
community as a cost of doing business, like corporate employee telephones.
Although each base station can support connections only over a range of a hundred
meters, it is possible to provide contiguous coverage over a wider area by using multiple
base stations. A number of corporate business and university campuses have deployed
such contiguous WLAN [5]. Still, the WLAN technology was not designed to support
3
high-speed handover associated with mobile users moving between base station coverage
areas.
In the last couple of years numerous service providers are offering Wi-Fi services for a fee
at hotels, airport lounges, and coffee shops. In addition, there is a growing movement of socalled “Free Nets” where individuals or organizations are providing open access to
subsidized Wi-Fi networks [6].
1.2.2
Bluetooth®
Bluetooth® is a short-range wireless technology designed to enable short range
communication without the need for computers, entertainment systems and other smart
electronic devices to correctly set up a complete two way communication system on the
first try [7]. Bluetooth tech low-power uses frequency-hopping spread-spectrum (FHSS)
communication in the 2.4 GHz industrial, scientific, and medical (ISM) band, in which
unlicensed devices are permitted to communicate in most countries of the world.
Bluetooth (Ericsson trademark) takes its name from Harald Blatland, a Danish king born
in AD908. An Ericsson-led consortium including IBM, Intel, Nokia, and Toshiba, have
developed the technology. A second group, the Bluetooth special interest group (SIG) was
then formed to promote the technology and comprised 1371 member companies in early
January 2000 [7].
Bluetooth technology permits devices to communicate with each other, synchronise data,
and connect to the Internet at high speeds without wires or cables. A Bluetooth radio and
baseband controller can be installed on a device that links to a universal serial bus (USB)
port, a PC Card, or integrated on a system board to add Bluetooth functionality to a
computer or other host device. Bluetooth air interface is based on a nominal antenna
power of 0 dBm (1 mW) with the extensions for operating at up to 20 dBm (100 mW)
worldwide [8]. This interface complies with ISM band rules up to 20 dBm in America,
Japan and most European counties. The Bluetooth radio uses frequency hopping method
to spread the energy across the ISM spectrum in 79 hops displaced by 1 MHz, starting
from 2.402 GHz and stopping at 2.408 GHz [9]. SIG completed the work to harmonize
this 79 channel radio to work globally and has instigated changes within Japan, Spain, and
other countries [8].
4
There are also worries that the part of the radio spectrum used by Bluetooth is becoming
too crowded. A report by Aegis Systems® said that Bluetooth, other wireless networking
systems, microwave ovens, outdoor broadcast units, and radio-based CCTV unit may all
interfere with each other [10]. Another potential drawback for Bluetooth is speed.
Bluetooth sends information at about 725 Kbps. By comparison, cell phones in the next
few years are expected to go faster than 2 Mbps.
1.2.3
Intelligent Networks
Intelligent Networks (IN) service model was the first step to releasing service control
from the hands of switch manufacturers and as such presented telecom operators with a
new vehicle for realising services that enhanced the basic call control capabilities of
stored program control switches [11]. IN rely on the decoupling of a number of telephone
switch functions from the stored program controller, renamed a service switch point
(SSP). The functions left behind in the SSP are called the basic call state model (BCSM).
The functions separated out are incorporated into a centralised service execution
environment as a service independent building block (SIB) called the basic call
processing (BCP) function. The services, constructed from SIBs to form a service logic
program (SLP), run inside this environment called the service logic execution
environment (SLEE), inside a physical platform called the service control point (SCP).
All of this distributed processing is facilitated by a protocol called Signalling System
Number 7 (SS7) [11]. The remote method invocation protocol that runs on top of SS7 is
known as the intelligent network application part (INAP). Mobile telephone networks
implement a protocol on top of SS7, called the mobile application part (MAP). This
protocol is the glue that allows mobile networks to support roaming subscribers. The
combination of IN and mobile networks come together to deliver the wireless intelligent
network (WIN).
The core software of an SCP, the service logic is generally bespoke to a specific
manufacturer’s SLEEs services written for one manufacturer’s SCP are not readily
transportable to another manufacturer’s product [11]. This arrangement has been changed
to soft switches and application servers are utilising common application frameworks
such as Java APIs for Integrated Networks (JAIN) and Java 2 Enterprise Edition (J2EE)
which allow developers to create services based on a common (manufacturer
independent) set of libraries and application programming interfaces (APIs).
5
1.2.4
Voice-Based Services
Call centres, the workhorse of telephone sales and customer care where agents answer
calls from customers, make extensive use of voice server based services to provide
customer filtering, in-queue announcements and self-serve services for customers. Call
centre services are performed on specialist interactive voice response (IVR) platforms
[11] either on the customer’s premise or on in-net platforms provided by a
telecommunication operator. The in-net platforms incorporate features on intelligent
peripherals.
The cost of implementing the circuit switched based services meant that smaller
customers have been excluded from this marketplace and only the larger call centres or
companies who are able to afford it, can implemented automated services.
1.2.5
Computer Telephony Integration
Computer Telephony Integration (CTI) signalled the move from automatic call
distribution (ACD) or private branch exchange (PBX) only services, where call routing
decisions are made by proprietary routing engines configured through text-based
terminals, to a new era in call routing and configuration [11]. The ability to utilise
corporate databases such as those held by marketing to segment the inbound calls based
on the market segmentation of the customer. CTI has also created the ability to integrate
multiple call centres in different physical locations into a single entity. The combination
of CTS and intelligent network services has created the ability for call centres to route
calls across national and international boundaries transparent to the caller [11].
There are essentially two types of CTI, first-party call control and third-party call control.
First-party call control is where a computer takes over the role of a telephone handset’s
functions and links the basic call functions of a handset (make call, release call, transfer,
hold, caller number presentation) to a software package that provides database integration.
Third-party call control is a much more powerful capability, allowing a computer to
control and monitor a large collection of telephone sets via a special interface connected
directly to the PBX or ACD. This link instead of carrying telephony signalling messages
6
carries status and control messages about all the events occurring in the PBX or ACD,
from on – and off-hook messages from handsets through to call arrivals on trunks and call
queue events. This control messages allow the computer system to establish new calls,
terminate exiting calls and even control the destination of newly arriving calls.
The first generation of CTI products brought about the control of circuit switch based
PBX and ACD allowed for increasing complexity over the control of call routing through
the use of information from customer databases. Second generation CTI allows for the
integration of systems that provided a view of the customer and their relationship with the
customer relationship management (CRM) tools, web collaboration and email routing
with conventional time division multiplexing (TDM) platforms. Future generation CTI is
combining Voice over Internet Protocol (VoIP), electronic CRM (eCRM) and IP voice
servers to bring a level of integration beyond that which was previously possible to create
packet telephony call centres [11].
The future generation CTI servers will combine the ACD routing capabilities and will go
beyond this to provide a truly integrated solution for ‘contact’ routing [11]. Presently, this
is a new service that has gained significant interest in the telecommunications and Internet
industries as a means of combining location-based information with the instant
communications of Instant Messaging (IM).
1.2.6
Ultra Wide Band
Ultra Wide Band (UWB) was praised excessively as a replacement for Bluetooth, as it
offers much higher data speeds (currently 40 to 60 Mbps). The IEEE 802.15.3 committee
is tasked with developing one ultra-wideband PAN standard, but it not been able to
converge on DS-UWB (direct-sequence) or MB-OFDM (multiband orthogonal frequency
division multiplexing) since neither side has been able to gather the necessary 75%
support [3].
1.2.7
Zigbee
This radio technology gained acceptance for a very little time by the sensor networks
community [11]. Zigbee operates under unlicensed band of 2.4 GHz worldwide. It has a
capacity of achieving raw data transmission of 250 Kbps for 10 channels to 20 Kbps for 1
channel. Transmission distance is in the range of 30 to 245 feet with constraints like
7
power and environmental characteristics. The most recent application of this technology
is electricity meter readings in Seoul, South Korea with the help of Ember’s smart chip
and NURI Telecom.
Whilst writing of this thesis, Zigbee and WiMax have emerged with suites of commercial
products, in particular for the energy sector. Some of the world’s leading utilities, energy
service providers, product manufacturers and technology companies are supporting the
development of Zigbee Smart Energy1.
WiMax is seen as a “last mile” broadband wireless access alternative to cable modem
service, digital subscriber line (DSL) or T1/E1 services. There is no global license
spectrum from WiMax but the WiMax Forum has published three licensed profiles at 2.3
GHz, 2.5 GHz and 3.5 GHz to drive an effort towards standardisation and lower the cost
of implementation. Intel® has been the driver of the WiMax adoption. Mainly, due to
number of chipset are developed by Intel®. Like all wireless technologies, WiMax can
operate at either higher bitrate or longer distance but not both. Smart Grid is an aggregate
of multiple networks and multiple power generation companies with multiple operators
and distributors. Smart Grids increases the connectivity, automation and coordination
between suppliers, consumers and networks that perform long distance and local
distribution functions. In US, WiMax has been promoted heavily by GE Energy® used for
GridnetTM and SmartStreetTM. In Australia, energy market is regulated by the Australian
Energy Regulator (AER). AusGrid (previously Energy Australia) is contracted to develop
SmartGrid SmartCity project. AusGrid uses WiMax but not will not roll out WiMax for
Smart Metering, instead will use long term evolution (LTE) technology. However, SP
AusNet® is the only corporation known in the world to date to plan and implement
WiMax for Smart Metering using Channel 7 subsidiary Vivid Wireless®2.
1.2.8
Wireless LAN
While 3G promises broadband wireless Internet access data services in the future, IEEE
802.11 Wireless LAN (WLAN) technology is becoming increasingly available in
1
Zigbee alliance, Zigbee Smart Energy Overview, assessed on 09 February 2012 from
http://www.zigbee.org/standards/zigbeesmartenergy/overview.aspx
2
Impaq Consulting, “Review for WiMax for Smart Metering and other applications Rev 1.0”, 12 April
2011.
8
enterprises and public locations such as airports, restaurants, hotels, and other public
places. The popularity and proliferation of WLAN can be attributed to the following
factors [3]:
need for Internet access outside the office or home
growing popularity of notebook PCs and PDAs
availability of enterprise virtual private network applications
high rate of data transfer (e.g., 11 Mbps or 54 Mbps)
affordably priced equipment
compatibility with existing LAN protocols (IP compatible)
no operating license or frequency usage fee required (ISM band)
The emergence of WLAN has changed the view of existing wireless services competition,
and it has negatively impacted the deployment of 3G networks [3]. However, since the
strength of 3G is in its wide-area coverage and high speed mobility, WLAN could
complement 3G networks by providing subscribers with a variety of service capabilities
in the future.
The 2.4 GHz ISM band is fairly congested. With IEEE 802.11n, there is the option to
double the bandwidth per channel to 40 MHz which results in slightly more than double
the data rate. However, when in 2.4 GHz, enabling this option takes up to 82% of the
unlicensed band, which in many areas may prove to be unfeasible.
IEEE 802.11n-2007 wireless networking standard was amended and published in October
2009 to IEEE 802.11n-2009. IEEE 802.11n improves network throughput over the two
previous standards, namely 802.11a and 802.11g with a significant increase in the
maximum net data rate from 54 Mbps to 600 Mbps (slightly higher gross bit rate and
slightly lower maximum throughput) with the use of four spatial streams at a channel
width of 40 MHz. IEEE 802.11n standardised support for multiple-input multiple-output
(MIMO) and frame aggregation, and security improvements, among other features.
1.2.9
3G
The first commercial offerings of 3G services began in Japan in October 2001. 3G
extends these data rates up to 3.6 Mbps and support several simultaneous Quality of
9
Service (QoS) classes for multimedia delivery [3, 6 and 11]. 3G has been dominated by
the air interface technology and the spectrum available to deploy it around the world.
3G is a technology for mobile service providers which combine wireless communications
and the Internet. Mobile services are provided by service providers that own and operate
their own wireless networks and sell mobile services to end-users, usually on a monthly
subscription basis. Mobile service providers use licensed spectrum to provide wireless
telephone coverage over some relatively large contiguous geographic serving area.
Historically, this might have included a metropolitan area. Today, it may include the
entire country. From a user perspective, the key feature of mobile service is that it offers
(near) ubiquitous and continuous coverage. That is, consumers can carry-on telephone
conversation while driving along a highway at 100 km/h. To support this service, mobile
operators maintain a network of interconnected and overlapping mobile base stations that
handover calls as those customers move among adjacent cells. Each mobile base station
may support users up to several kilometres away. The cell towers are connected to each
other by a backhaul network that also provides interconnection to the wireline public
switched telecommunication network (PSTN) and other services. The mobile system
operator owns the end-to-end network from the base stations to the backhaul network to
the point of interconnection to the PSTN (and, perhaps, parts thereof).
Ongoing controversy about the likely migration to 3G for developing countries, two main
standards have been proposed, UMTS also known as Wideband CDMA (WCDMA) and
CDMA 2000. CMDA2000 is a relatively simple upgrade of existing CDMA technology.
If CDMA2000 succeeds and WCDMA does not, or if CDMA2000 succeeds much more
quickly than WCDMA, any European Union (EU) policy that may have assumed
WCMDA or locked operators into WCMDA may prove to be a very costly public policy
decision [6]. So, not only there is a historical question about the relative advantages of the
European and North American approaches to standardisation policy for 2G but also a
current policy questions about the 3G bands. There are a number of differences between
CDMA 2000 and WCDMA. However, CDMA2000 is a natural migration from CDMAOne, which WCDMA is essentially incompatible with any existing technology [7].
10
1.2.10
4G
Mobile device technology and advanced software, together with the influence of the
Internet, are creating a vast array of Web-based services to which people want easy, 24hour access from any location. Microprocessors are rapidly becoming smaller, faster,
more power-efficient, and less expensive, which means they will be used more often and
in more places to create a host of intelligent devices that will increase access to those
services. Wired and wireless bandwidth is expanding at a rapid rate, providing the final
component necessary to create “universal connectivity” among all of these new devices
and instant availability of the information and services they help to deliver. Carrier
technologies such as 3G, CDMA and GPRS are now readily available in many countries.
The key differentiator for 4G is speed offering from 2 Mbps to 1 Gbps using orthogonal
frequency division multiplexing (OFDM) and space-time coding [4]. Since this view of
4G is about defining a whole new system, it also means that, a new radio access network
needs to be developed [16], and perhaps a new core network as well, to support the new
air interface. This should be based on IP and a new spectrum must be identified and
assigned in which the 4G systems can operate. Without doubt, however, 4G networks will
be based on IP transport just as 3G was based on asynchronous transfer mode (ATM) in
the 1990s and GSM on 64 Kbps TDM technology in the 1980s. The only real question is
whether IP itself will have evolved out of recognition or will have been replaced by a
newer networking technology [11].
In my opinion, moving beyond 2011, technology road map and time frame should justify
the final definition for 4G i.e. 4G = 3G + IPv6 + Seamless Mobility + Interoperability +
Rich Multimedia Experience. This poses a new concept of providing management of
wireless systems. Multiple Radio Access Technology (RAT) standards are used in
wireless communication. Figure 1-1 shows a generic composite radio environment in 4G
networks which can be roughly categorised in four sets, cellular networks, and broadband
radio access (BRAN), digital video broadcasting (DVB) and satellite communications,
and adhoc and sensor networks with emerging applications.
11
Figure 1-1 – CRE in 4G networks [4]
Figures 1-2 and 1-3 show the architecture of a terminal capable of operating under CRE
and architecture of a terminal operating under reconfigurable context respectively. The
terminals include software and hardware components (layer 1 and 2 functionalities) for
operating within different systems. The word ‘terminal’ can mean anything from fixed
telephone to set-top boxes or an integrated handheld cellular phone. The higher protocol
layers, in accordance with their peer entities in the network, support continue to access IPbased applications. Different protocol stacks can further enhance the efficiency of the
protocol stack. There is a need to provide the best possible IP performance over wireless
links, including legacy systems [4].
12
Figure 1-2 – Architecture of 4G Terminal operating under CRE [4]
Figure 1-3 – Architecture of 4G terminal operating under reconfigurable context [4]
The fourth generation of cellular is expected to achieve high levels of user experience and
capabilities that previous technologies such as 2G and 3G lacked. To quantitatively state
these requirements, ITU-R benchmarked challenging figures for uplink and downlink
13
traffic that would be supported by 4G networks. These include peak data rates of up to
100 Mbps for high mobility and 1 Gbps for non-mobile devices, an all-IP packet network,
use of scalable channel bandwidths from 5 to 40 MHz, spectral efficiencies of at least 3
bit/s/Hz and support for smooth heterogeneous network handover and high quality
multimedia transmission. To meet these challenges, two parallel technologies are under
development and testing namely long term evolution (LTE) Advanced, standardized by
3GPP [12] and Mobile WiMax (802.16m), standardised by IEEE [13]. These technologies
feature functionalities like carrier aggregation [14], Orthogonal Frequency Division
Multiple Access (OFDMA), enhanced Multiple-Input Multiple-Output (MIMO)
capabilities, link adaptation, frequency selective scheduling, multipoint transmission and
relaying [15]. With all these capabilities put to work, user experience with multiple
services will increase and operators would be able to attract more customers. But all this
comes with complexities in handling a large number of users running a multitude of
services [16].
Operators would specifically be interested in selling their network capabilities by offering
granular services targeted to different consumer markets. This would then be supported by
policy and charging functionalities to handle user traffic consistent with their service level
agreements [17]. User-service prioritization hence becomes of prime importance for
properly distributing the available network resources. Service prioritisation is not a single
step function but instead is strongly coupled with other major Quality of Service (QoS)
enabling entities in the network. Determining these relationships and the methods that
could be adopted for prioritisation is an emerging challenge [18-20]. The goal of moving
into the 4G solution is also motivated by the fact that operators need to provide
multiservice offerings to users in contrast to the previously used single service so that the
users can have more options to choose the service which suits them best [16-20].
Examples of such multiservice offerings include multimedia telephony, social
networking, e-gaming and mobile TV [18].
The competition is to provide the highest level of QoS to the users and leverage the
system to perform near to or better than the IMT-Advanced standard. Both LTEAdvanced and Mobile WiMax should be true broadband networks that provide data rates
equal or greater than even the most reliable wired technologies like Fiber-to-the-Home
14
with optimised QoS provisioning [19]. All this should come with reduced network
operating cost and compatibility with other systems [16].
Prioritisation itself defines a way of giving more importance to users that have paid more
and are expecting higher service level availabilities from the operators [21]. The
customers may have different types of subscriptions with the operator and at times it
becomes difficult to properly classify the users with priority and much more difficult if
the subscriptions are on a traffic type basis [22, 23]. Prioritisation, while depending on the
traffic mix being dealt with; always puts the operator on the safe side since it tends to
avoid any congestion events in case of user over-loads [23, 24].
1.3
Implications for In-Service Provision
1.3.1
Standards
It has long been accepted in the telecommunications industry that standards are required
to govern the physical, electrical, and procedural characteristics of communication
equipment. Whereas communication equipment vendors recognize that their equipment
will generally interface to and communicate with other vendors’ equipment. Computer
vendors have traditionally attempted to monopolize their customers. The proliferation of
computers and distributed processing has made that an untenable position. Computers
from different vendors must communicate with each other and with the ongoing evolution
of protocol standards; customers will no longer accept special-purpose protocol
conversion software development [7]. For 3G, there is a relatively small family of
globally sanctioned standards [25], referred to as IMT-2000. At the time, there was still an
uncertainty as to which of these will be selected by service providers.
Example 1: In the US, it was originally hoped that the PCS spectrum licenses would be
used to provide many new types of wireless communication and data services, not just the
type of highly mobile service for which it has been used principally to date. In Europe,
GSM was adopted as the 2G standard for mobile networks and began to be deployed in
the early 1990s, before the PCS spectrum was auctioned in the US where different service
providers adopted multiple and incompatible standards for their 2G service
offerings [7, 25].
15
Example 2: The European Telecommunications Standard Institute published the SGM
standard 1990 and by 1995 it had become the de facto standard in Europe. This is in
contrast to the US where multiple incompatible standards were adopted [7, 25].
1.3.2
Deployment and Business Model
With respect to deployment, 3G and 4G will require substantial investment in new
infrastructure to upgrade existing 2G networks. Towers and backhaul network will still
remain useable. For Wi-Fi, it is hoped that deployment can piggyback on the large
existing base of WLAN equipment already in the field. In contrast to 3G, Wi-Fi access
can emerge decentralised, bottom-up fashion. While the prevailing business model for 3G
services and infrastructure is vertically integrated. This opens up more possibility for
heterogeneous and complex industry chain model [6]. In contrast to mobile, WLANs were
principally focused on supporting data communications.
However, with the growing interest in supporting real-time services such as voice and
video over IP networks, it is possible to support voice telephony services over
WLANs [30]. This has implications for the magnitude of initial investment required to
bring up WLAN or 3G wireless service and for the network management and operation
support services required to operate the networks. However, it is unclear at this time
which type of network might be lower cost for equivalent scale deployments, either in
terms of upfront capital costs (ignoring spectrum costs) or on-going network management
costs.
With Bluetooth, it seems that almost every company that is capable of designing a
semiconductor chip has published a roadmap of its Bluetooth silicon extending several
years into the future [26]. The chip roadmaps even include dates, capabilities, and silicon
technologies. Scores of companies have announced products. If 10% of those products are
successful, the Bluetooth market would be enormous. Currently there are more than 40
Bluetooth products that are approved by the Bluetooth SIG. The first of these products
was approved in June 2000 and the majority of these products have been approved to
date. At this point, there are few products that can be widely used, but as stated earlier, the
explosive growth of the market will potentially fuel quick adaptability and adoption by
numerous users [27].
16
The cost to produce the chipsets was estimated to decrease significantly over the same 6year period from $42.20 in 2000 to $13.15 in 2005 [27]. This cost reduction, along with
the growing mobile workforce, encouraged new and innovative uses of Bluetooth
technology.
1.3.3
Occupational Health and Safety
There are a number of national and international regulations, standards, and
recommendations dealing with electromagnetic exposure in the radio frequency range.
The limits are generally very similar and are usually based on recommendations from the
World Health Organization (WHO) and the International Radiation Protection
Association (IRPA). The limits have been set with a wide margin in order to protect
people from any known negative health effects of both short-and long-term exposure to
electromagnetic fields.
The safety margin is sometimes as high as 50, i.e. the limits are set at 50 times lower than
the level at which one knows that heating related effects can begin to occur [7, 25]. When
a radio transmitter is close to a person as may happen in the case of Bluetooth, the highest
power absorption per unit mass in a small part of the body is established and compared
with the basic limits given in the standards. This parameter is known as the specific
absorption rate (SAR) [7].
The worry about Bluetooth multiplies from the fact that the frequency used by Bluetooth
to establish radio links happens to be the same frequency as any household microwave
ovens’ use. The key difference is that the Bluetooth radio is extremely low power.
Investigation as to the potential health risks is an ongoing concern with Bluetooth as well
as cell phones and many other radio emitting devices.
The maximum exposure levels from Bluetooth products are well below the prescribed
safety limits. The risk of Bluetooth devices causing electromagnetic interference in
sensitive electronic equipment, e.g. medical devices, is minimal because of the very low
output power. In late 2001, Bluetooth was cleared against human health risk [8].
17
1.3.4
Short Term Solutions
Many companies failed completely after the telecom bubble burst in late 2000, the overall
industry was severely damaged. Further, questionable accounting practices and
subsequent bankruptcies have led to an erosion of investor confidence in the entire
telecommunications industry [5]. Few factors which may put Telcos back in business are
provided below.
1.3.5
Adopting Supply Chain Management
Focusing on core competency and sub-contracting non-core functions has become a
global trend. Dell Computer’s success strategy in the PC industry is a role model for the
telecommunications industry [27].
1.3.6
New Revenue with SMS and MMS
In light of uncertain prospects for 4G rollout and the difficult financial situations of many
wireless carriers, it might take several years before 3G wireless platforms are completely
established that can deliver promised multimedia services. Currently, SMS has become
popular among cell phone users. Enhancement to SMS is MMS, which allows subscribers
to transmit pictures, music, or video clips, as well as transfer files among mobile phone
subscribers.
1.3.7
Future Directions
In the next few years, I envisage major investments (by those that can) and divestments
by business that are refocusing their strategies and preparation by telecoms operators to
move their networks from the current TDM based infrastructures to packet based systems.
In the UK, Vodaphone® has publicly committed resources in 3G/4G mobile networks and
an enhanced packet based backbone networks, respectively [29]. This trend will continue
over the next many years and it will not take too long to transform the networks from the
PSTN to the multimedia future with more players both existing and new entrants such as
ISPs and ITSPs deriving revenue from voice and data services and competing with
conventional telecoms operators.
The largest force of change in the industry now is the declining margin from basic voice
services, as they reach commodity status. That is not to say there is no revenue left in
18
voice, just not as much profit. Telcos have embraced the future generation network
infrastructures as a means of transforming their businesses to seek new higher margin
products with quality of IN service.
Bandwidth has also reached a state of excess. Technologies such as dense wavelength
division multiplexing (DWDM) have created a surfeit capacity in anticipation of the
broadband future [30]. The future has not transformed as fast as the original market
hyperbole forecast. The upshot is an industry waiting for something to happen. The
something is broadband access to eat up all this backbone capacity with revenue
generating services. The broadband local loop has been slow to start in all but Singapore,
caused by weak regulators and strong incumbents [10]. USA and UK has seen a number
of competitive local access providers suffer because of the combination of the slow
process of unbundling and a major decline in expected demand [30]. Transmission
bandwidth may increase more in the future, particularly considering the potential of fiber
optic technology. If the above empirical rule were to hold, the data rate of the next few
decades will be:
Year 2010
Year 2030
1011 b/s
1012 b/s
Considering that the bible, when coded with an 8-bit character set code, results in
approximately 40,000,000 bits, we would transmit the content of 250 bibles per second in
1990; 2500 bibles per second in the year 2010; and 25,000 bibles per second in the year
2030 [31].
1.4
Conclusions
Communications technologies have increased the speed with which we can communicate
at a rate that far exceeds the increase in travel speeds over the last century. When a new
ICT technology is announced, it usually takes only few months before products starting to
appear in the market. In order to achieve the full operational efficiency of IP networks, the
vision of an “all IP” network has been promoted by the industry.
“Energy Efficient Technologies” and “Enhanced Mobility Management” are hot R&D
topics in Next Generation (NEXT GEN) IP deployment. Significant R&D funding is
19
already invested among telecom manufacturers desiring to develop new IP technologies
and equipment ranging from IP customer premise equipment gateway to IP core network
and IP network management system. Over the years, huge amount of capital will be
invested in the telecom industry, resulting in too many companies producing too many
products.
While the economic slowdown continues, more bankruptcies and mergers can be
expected. Smaller, weaker carriers cannot survive, and the assets of bankrupt companies
will be sold to the remaining stronger players. Vodaphone, Sprint and Verizon are looking
to become a major force in the 4G mobile telecommunications by building a new 4G
infrastructure, unencumbered by having to write off investment in existing 2G, 2.5G and
3G equipment. This enforced slowdown is good news. At least, this change of pace “in
comparison” will sustain for a while.
20
Chapter 2
Scalable and Secure Wireless Communication Technology
Implementation for the Sydney Airport Corporation Limited (20012003)
2.1
Introduction
Sydney Airport’s aviation history began in 1919 [32]. Sydney Airport is 93 year old site
and 8 kms far from Sydney CBD. It serves 8.7 million international and 15.5 million
domestic passengers per year. The site consists of 886 hectares of area consisting three
runways (3962 m, 2438 m and 2530 m). It has five terminals with 34 international,
31 domestic and five airfreight gates.
At the Airport Council International (ACI) World Assembly in Santiago in November
2000 the airport community expressed the importance of a Wireless Infrastructure at
Airports managed by the Airport Authority [33]. The following resolution was agreed
upon:
“Airport Operators should assert control over the use of Wireless Infrastructure at
Airports, both inside and outside terminal buildings. Tenants, concessionaires and others
should use a common infrastructure for wireless managed by the Airport Operator. In
return for this exclusivity, Airport operators should constantly evaluate competing
technologies, so as to maintain low costs, increased capacity and security in line with
demand for the benefits of all tenants, concessionaires and others”
With this endorsement from the ACI and the fundamental limitations of three wireless
channels for the IEEE 802.11 spectrum, the Sydney Airport Corporation Limited (SACL)
embarked on the challenge of becoming the sole provider of Wireless Infrastructure at the
International Terminal and Airfield. Past experience indicated that business customers
preferred to install their own networks, and wireless still an evolving technology with no
ratified security standards and ease of deployment gave SACL a unique challenge. In
early 2001, 120-access points within the International Terminal (Terminal 1) and at
various sites on the airfield within its existing wired network as shown in figure 2-1 were
deployed [33].
21
22
Figure 2-1 – Existing SACL Wired Communication Network
2.2
WLAN Architecture and Security Challenges
With a typical Wireless LAN, transmitted data is broadcast over the air using radio waves
because of this, the boundary for SACL’s network has moved and is now located in many
airfield remote sites. Without stringent security measures in place, the wireless
infrastructure is equivalent of putting Ethernet ports everywhere. Sydney Airport WLAN
implementation in early 2001 deployed Cisco Aironet 350 Series Access Points. The
IEEE 802.11b standard adopted uses the unlicensed 2.4x gigahertz frequency band
providing only three non-overlapping channels (1, 6 and 11) with data-rates of 1, 2, 5.5
and 11 Mbps [34].
WLAN deployment challenge was to ensure that the implementation of the wireless
network did not breach its existing security policies for the corporate network. The
wireless network infrastructure was regarded in much the same fashion as the Internet, an
un-trusted zone.
Even with this view, it was ensured that wireless network security protects wireless
virtual local area network (WVLAN). Figure 2-2 outlines the type of wireless and
network security implemented.
Figure 2-2 – Wireless and Wired Network Security
23
2.3
Network Architecture and Security Policy
Figure 2-3 – Network Architecture and Security Policy
An important decision when deploying a WLAN is how it will interface back into the
corporate infrastructure. WLAN was designed so that the WLAN infrastructure access is
located outside the corporate firewalls as shown in figure 2-3. This approach creates more
administration, with the configuration of the external access network consisting of router
access lists and firewall rules, though still remains manageable, as it was not required to
maintain multiple wide area network (WAN) remote sites. Other considerations in this
decision are that the WLAN network is not deployed in order to replace the wired LAN in
the office and is a network not solely accessed by SACL users. All external access from
the wireless network is via the wireless access router (WAR). The WAR is a Cisco 3550
Router configured to perform access-list filtering on all traffic based on source and
destination IP address, protocol and port numbers.
As stated previously, the wireless infrastructure at the airport was regarded as an untrusted zone. There are only two ways that a SACL wireless client can gain access to data
from the corporate network. The first option is to install an application proxy server. The
proxy server allows data to move from the wireless un-trusted zone to a semi-trusted zone
located in the de-militarised zone (DMZ) outside corporate network firewall 1. This
application proxy server located in the semi-trusted zone accesses the corporate network
or trusted zone via firewall 1 on the clients’ behalf. The second option and only way
24
resources can be accessed directly from an un-trusted to a trusted zone is via the use of a
VPN. A VPN is established between SACL’s wireless client and the Cisco VPN
concentrator connected in parallel to the PIX firewall located in the DMZ. Both of these
methods are described in detail in section 2.7.
2.4
SACL Wireless Authentication
Originally SACL only offered a Cisco proprietary wireless security solution of lightweight extensible authentication protocol (LEAP) for all tenants and concessionaires
utilising SACL’s Infrastructure. The LEAP utilises a 128 bit dynamic WEP key along
with remote authentication dial-in user service (RADIUS) username and password
authentication.
The WEP key is dynamically assigned from one of two RADIUS servers (Cisco Secure
ACS 2.6 or greater) when an authenticated user associates with an access point (AP). This
WEP key is again negotiated between the client and the RADIUS server after a preconfigured period set on the RADIUS server. At present, this period is set at less than 10
minutes.
The new firmware software introduced by Cisco for their AP support the termination of
802.1q trunk. This allows a trunk to be provisioned between the AP and an Ethernet
switch; the end-result allowing users in a WVLAN cell to belong to different VLAN.
With the use of different VLANs, user traffic is segmented per group (i.e. per VLAN)
with the use of differentiated security policy per VLAN.
The service set identifier (SSID) is used to map the client to the WVLAN. RADIUS
attributes passed in between the Access Point can also override this mapping if the users
is not authorised for that SSID. Up to 16 WVLANs can be supported on each AP.
25
Figure 2-4 – SACL Wireless Authentication – LEAP
The introduction of WVLAN allows the use of non-priority Client Cards, along with
different security models. Although it was believed that the Cisco LEAP solution is still
the most secure and manageable solution presently available, when used in conjunction
with temporal key integrity protocol (TKIP) and message integrity check (MIC), (TKIP
and MIC security are explained in section 2.5 below) it is possible for a static WEP,
media access control (MAC) and or EAP security options to be used on a separate
WVLAN.
This enables the use of all vendors 802.11b wireless clients adaptor and give greater
flexibility for products not yet supporting LEAP such as most Voice over IP Wireless
Phones. At present, LEAP solution is used as shown in figure 2-4 with TKIP and MIC
enabled as all their devices make use of Cisco Client Adapters.
2.5
Wireless Data Privacy Enhancements
While WLAN security that relies on SSIDs, open or shared-keys, static WEP keys or
MAC authentication is better than no security at all, it is not sufficient and/or truly
manageable for the size of the airport wireless network.
At Sydney Airport, like all wireless network administrators were eagerly waiting the
wireless IEEE 802.11i security standard that will allow vendor interoperability and solve
all known vulnerabilities of WEP, the basic mechanism to date for interoperable security
26
of Wireless 802.11b products. The IEEE 802.11i standards were published at the end of
2003. The Wi-Fi Alliance represented by many of the wireless vendors and in conjunction
with the IEEE, has driven an effort to bring strongly enhanced, interoperable Wi-Fi
security to market in the first quarter of last year. The result of this effort is Wi-Fi
protected access (WPA). WPA is a specification of standards based on interoperable
security enhancements that strongly increase the level of data protection and access
control for existing and future wireless LAN systems.
WPA was designed to run on existing hardware as a software upgrade and is derived from
and will be forward compatible with the IEEE 802.11i. One of the 802.11i components
not required in WPA is AES support. AES replaced 802.11’s WEP initialisation vector
RC4-based encryption under 802.11i specifications. Migrating to AES encryption
required hardware changes, so this was deferred by the Wi-Fi Alliance until the formal
standard is in place to give vendors and customers some breathing room. However,
802.11i will require hardware changes regardless of whether WPA gets deployed in the
near future or not.
Cisco was awarded WPA certification on the new internetworking operating system (IOS)
software available for both the 1100 and 1200 series AP range, with firmware for the 350
Series APs, installed at the airport. Until the release, it was planned to use Cisco’s
proprietary solution that features a subset of the 802.11i draft. Cisco has developed an
802.1x authentication type called extensible authentication protocol (EAP) Cisco
Wireless, or Cisco LEAP. APs can be configured to support Cisco LEAP and all 802.1x
authentication types, including EAP Transport Layer Security (EAP-TLS provides for
certificate based mutual authentication that relies on client-side and server side digital
certificates).
With 802.1x authentication types such as LEAP and EAP-TLS, mutual authentication is
implemented between the client and a RADIUS server. The credentials used for
authentication, such as a log-on password, are never transmitted in the clear, or without
encryption, over the wireless medium. Another benefit of 802.1X authentication is
centralised management of WEP keys. Once mutual authentication is successfully
completed, the client and RADIUS server each derive the same WEP key, which will be
used to encrypt all data exchanged. The result is per-user, per-session WEP keys. AP
27
software running at the airport provides several enhancements to WEP keys that have
formed part of the WPA. These WEP enhancements include Cisco’s pre-standard TKIP
and support for MIC.
When TKIP, also known as key-hashing support, is implemented on both the AP and all
associated client devices, the transmitter of data hashes the base key with the IV
(Initialization Vector of RC4 Key Scheduling Algorithm) to create a new key for each
packet. By ensuring that every packet is encrypted with a different key, key hashing
removes the predictability that an eavesdropper relies on to determine the WEP key by
exploiting IVs.
When MIC support is implemented on both the AP and all associated client devices, the
transmitter of a packet adds a few bytes (the MIC) to the packet before encrypting and
transmitting it. Upon receiving the packet, the recipient decrypts it and checks the MIC. If
the MIC in the frame matches the calculated value (derived from the MIC function), the
recipient accepts the packet; otherwise, the recipient discards the packet. Using MIC,
packets that have been (maliciously) modified in transit are dropped. Attackers cannot use
bit-flipping or active replay attacks to fool the network into authenticating them, because
the MIC-enabled client and APs identify and reject altered packets.
In early to mid-2000, hackers used three main types of attacks against wireless networks.
They are denial of service (DoS), address resolution protocol (ARP) poisoning or
spoofing and WEP key-cracking. Upon realisation of these types of attacks, SACL had
few options. They were installation latest hardware firewalls from Cisco along with third
party safety softwares and manual defence mechanisms. An administrator can guard
against the attack using any number of radio frequency spectrum management tools,
which sample the airwaves and determine the channel which is being jammed by ARP
spoofing or DoS. Administrators could then dynamically reassign the channel used by
their access equipment and restore service to the wireless network. However, as new
protocols came into effect, SACL network was continuously upgraded by employing trimode wireless routers that operates with the 802.11g, 802.11i and later 802.11n protocols.
Hence, SACL was adequately equipped and prepared to resist hacking attacks.
28
2.6
Computerised Mobile Maintenance
The initial deployment of the wireless network within Terminal 1 and the airfield
coincided with the Mobile Maintenance Project. The Project utilised the wireless network
to track and complete maintenance work in the field. Maintenance staff at Sydney Airport
uses the computerised maintenance management system (CMMS) also known as
MAXIMO. Figure 2-5 shows schematic of the CMMS. The one limitation about
MAXIMO was its inability to follow staff to the job. Previously “Work orders” or job
sheets were printed directly off the system and then taken into the field by the relevant
trade staff or technician. Once the work was completed, the sheet was completed
manually and the written data then entered in MAXIMO, either on return to the workshop
or at the end of shift.
Figure 2-5 – Computerised Maintenance Management System
The mobile solution utilising an industrialised handheld PDA eliminates re-entry of data
and has a positive follow-on effect in allowing more accurate reporting and a paperless
system. With the limitation of VPN clients for PDA’s at the time of delivery for the
project an application proxy server was installed within SACL’s semi-trusted DMZ area
to proxy wireless client requests to the MAXIMO Application Server. The PDA used was
fitted with a Cisco Client Adaptor card and set up to use LEAP. The only changes from
the initial installation is the upgrade of wireless client driver to utilise Cisco’s TKIP and
MIC security enhancements configured on the Access Points.
29
2.7
Wireless VPN Remote Access Solution
In December 2002, SACL embarked on a corporate remote access solution. The solution
enables corporate users to access the corporate network with all desktop applications from
broadband internet access, corporate dialup and wireless access. By placing the wireless
infrastructure access outside the corporate firewalls, allows best usage of remote access
VPN solution. The implemented solution integrates a Cisco VPN 3000 Concentrator,
Microsoft 2000 Certificate Server, Microsoft VPN Client, USB Port Token, and
centralised remote PC firewall (ZoneLabs Integrity®) to provide strong security, ease of
use and centralised management. The original goal was to utilise the Cisco VPN Client
which allowed cooperative reinforcement with the remote PC firewall.
The ZoneLabs VPN enforcement feature ensured that the VPN users can only connect to,
and remain connected to the network as long as the client is running a verified version of
ZoneLabs firewall agent and the client is enforcing the most up to date security policy.
Figure 2-6 – VPN Authentication Process
The Cisco VPN client used was incompatible with a few of the corporate applications
which required the Client to have a virtual adaptor IP address in order to ftp data from a
server back to the remote PC. Cisco released a VPN client that has a virtual adaptor which
30
is still being piloted. In the interim period, SACL chose to utilise a Microsoft VPN client
that does not provide cooperative reinforcement of the remote PC’s Firewall. It is shown
in figure 2-6. Remote PC’s have utilised the Microsoft XP operating system to lock down
the ZoneLabs application to ensure the user cannot shutdown the Firewall. As all the
wireless users within SACL are utilising Cisco’s wireless adaptors the same WVLAN
utilising LEAP is used. This will change in the near future as the new laptops have inbuilt
wireless adapters.
As the VPN solution does not require the additional wireless security as it is geared for
broadband and hotspot users, another wireless VLAN will be created with a different
security model. Figure 2-6 shows the present VPN establishment and logon process to the
corporate network. Strong authentication is required to secure the VPN connections. VPN
users must have a computer with a valid SACL digital certificate, valid Windows account
or USB eToken with SmartUser certification to successfully establish a VPN connection.
After the use of valid Digital Certificate for Internet Key Exchange (IKE) authentication,
Microsoft VPN uses internet protocol security (IPSec) encryption, ESP (encapsulation
Protocol), layer two tunnelling protocol (L2TP) and Transport IPSec.
2.8
Wireless Voice over IP Pilot Program
Figure 2-7 – Wireless VoIP Pilot Program
31
The third device that was trialled across its wireless LAN was a piloting of wireless IP
phones and undertook a Voice over IP (VoIP) trial. The schematic for the same is
depicted in figure 2-7 above. This pilot program included the deployment of wireless
handsets that ran over the Terminals live wireless network. The wireless IP handsets used
were spectra-link phones. These phones did not support LEAP so a dedicated WLAN
with static 128-bit WEP was set up across the International Terminal. This WVLAN was
also given the highest QoS on each access point to ensure phone calls would not drop out
if a wireless access point is supporting multiple clients.
Knowing the security vulnerabilities of static WEP SACL combined MAC level security
on the Wireless VLAN. MAC level security on the Cisco Access Points can be centrally
managed by the Cisco Secure ACS RADIUS Servers. This is performed by entering the
MAC address of the phone as a user and password in the RADIUS server. The security
solution is not ideal though the only means available at the time of the pilot. Cisco latest
release of software for the 1100 and 1200 Access Points has a feature known as fast
secure roaming. This feature allows EAP authentication to be used for Wireless Voice
over IP.
2.9
Tenant Wireless Connectivity
The wireless infrastructure is a shared medium for both the airport and its tenants, it was
necessary to establish connections back into the tenant’s own corporate network.
Figure
2-8 shows how the connection is implemented indicating demarcation points. A range of
IP addresses is assigned to each tenant who will either hard code or utilise DHCP servers.
Every tenant utilising wireless Infrastructure will be given a dedicated 100 MB
unshielded twisted pair (UTP) routed connection to the WAR. Within the WAR
access-lists filtering on IP address, protocol and port numbers are configured.
It was advised that the 100 MB Ethernet port be connected to the tenant’s network via
their own firewall. The tenant is responsible for any additional security measures such as
VPN using their own wireless clients. The tenant is set up with their own WVLAN that
can be given a security policy that best meets their needs or device capabilities.
32
Until, the introduction of WVLAN there was only one option that was to use Cisco Client
Adaptors utilising LEAP. This interoperability proved to be challenging with one of the
International Airline Lounges already entered into a commercial agreement with an ISP to
provide wireless internet access to their frequent flyer members.
As the airport could not control the public users’ client adaptor card, an interim solution
was put in place. Other tenants wanting to utilise Symbol ® barcode scanning devices were
informed the warranty on the device would be void if they replaced the wireless adaptor
with a Cisco Card. With the release of WVLAN, two organisations utilising SACL’s
wireless network were able to use Symbol® devices with Symbol® wireless client
adaptors. Both are using static WEP with Symbol’s own VPN solution AirBEAM Safe®.
2.10
Public Wireless Internet Connectivity
A public wireless network was deployed to allow high speed internet connectivity to any
public users as shown in figure 2-8. The airport is strategically well placed to target this
market of mobile professionals. SACL have partnered with ISPs to offer their existing
customers and new subscribers all the internet services including email, Web browsing
and connection back into their corporate networks via secure VPN. Like most hot spots,
the wireless public LANs are set to open authentication with no WEP key encryption
configured.
The portal page login for the subscriber is made by opening a secure socket layer (SSL)
encrypted session hypertext transfer protocol over secure socket layer (HTTPS). The
difference between most hotspots is that the airport hosts three unencrypted WLANs on
each of its access points. As the airport had the wireless infrastructure installed, it made
commercial sense to cater for multiple service providers instead of the usual approach for
ISPs grabbing of real estate.
33
Figure 2-8 – Public Wireless Internet Connectivity
The commercial model with each of the ISP is based on revenue share of subscriber
usage. The subscriber can be classified as retail and wholesale. A whole sale customer
refers to a subscriber who is signed with a roaming partner of the ISP. To cater for
multiple ISPs proved quite challenging.
The technical challenges of routing users down different internet service connections,
government regulations on IP interception rules in Australia, and the airport not wanting
to lawfully become an ISP led to the decision of running multiple WVLANs. The latest
350 IOS firmware for Cisco APs allows for multiple unencrypted VLANs. Therefore, the
control of the access point infrastructure and WLAN services on the airport site was
maintained while being responsible for ensuring the WLAN technical capability of the
network. Each ISP is provided with a non-broadcast unencrypted WLAN with their
nominated SSID as set up in their other hotspot sites. This WLAN will be connected to
the ISP’s gateway service infrastructure. The ISP will ensure compliance with the relevant
government regulations.
This compliance will mean that they will solely be responsible for interception of all IP
traffic pertaining to their WLAN on the airport site. The ISP shall provide a nonrepudiable system for reporting and auditing of the airport hotspot Site. The system shall
be accessible in real or close to real-time. The airport require on-line data such as billing
34
or RADIUS accounting records that detail each users IP session time along with data byte
usage.
2.11
Customer Satisfaction
SACL have a number of different customers utilising the wireless infrastructure. Internal
use of the wireless network has been limited to laptop uses and trials of SIP VoIP
telephones. The laptop users range from Security officers working on the airfield to staff
moving between terminals. The laptop users can access all desktop applications with the
use of VPN. Remote access solution for broadband users is identical to the wireless
implementation. The SIP VoIP phone trial has been limited due to time constraints of
other projects running.
From the experience, I would say it worked just as good if not better than the GSM
coverage within the Terminal building. Unlike GSM, a poor signal did not drop-out a
phone call. External users come in the form of public Wireless internet subscribers. SACL
has partnered directly with two ISPs – Telstra and Optus. In order to facilitate this model
and provide competition on pricing between the providers, the end user has had to suffer
due to the technology short comings. This has been caused by the inability to broadcast
multiple SSIDs.
New users are required to manually configure their SSID settings in order to connect to
unrestricted internet service of Telstra and Optus. The latest Cisco codes are released at
regular interval to allow multiple broadcast SSIDs. Figure 2-9 depicts wireless coverage
as of early 2004 and total wireless connectivity diagram is shown in figure 2-10.
35
Figure 2-9 – SACL Wireless Deployment [Courtesy of Ausway Maps]
36
37
Figure 2-10 - Total Wireless Connectivity Diagram
2.12
Conclusions and Future Projects
The security interoperability challenges are being addressed by Wi-Fi Protected Access
range of Wi-Fi products based on the upcoming IEEE802.11i standard. With the WPA
and ultimately 802.11i standard implementation in place, the need for add-on solutions
such as VPN may be deemed unnecessary in some Enterprise WLAN environments.
Other future enhancements not referenced here include the release of 802.11g Wireless
Access Points. 802.11g can ideally deliver 54 Mbps maximum data rate and offer an
additional and compelling advantage – backward compatibility with 802.11b equipment.
This means that 802.11b client cards will work with 802.11g access points and 802.11g
client cards will work with 802.11b access points. Because 802.11g and 802.11b operate
in the same 2.4 GHz unlicensed band, migrating to 802.11g will be an affordable choice
for Sydney Airport with existing 802.11b wireless infrastructures [Figure 2-10].
One drawback is that 802.11b products cannot be “software upgraded” to 802.11g
because 802.11g radios will use a different chipset than 802.11b in order to deliver the
higher data rate. However, like Ethernet and Fast Ethernet, 802.11g products can be comingled with 802.11b products in the same network. Sydney Airport will continue to
provide solutions to business needs by utilising innovative and leading edge technology.
Future applications include Mobile Self Service, Check-In Kiosks, Radio Frequency (RF)
Bag Tags, Wireless Point of Sale (PoS), Wireless Stock Take, WVoIP, and Government
requirements for baggage reconciliation by end of 2007.
SACL’s main revenue source from wireless comes from the Baggage Reconciliation
System (BRS) [33]. This system is used by the baggage handlers to scan bags with the use
of symbol handheld devices to ensure a match between bags and passengers on the
aircraft. As with most evolving technologies vendor interoperability and adoption of lose
standards has created a few minor issues that are been resolved with input from both
Symbol and Cisco. The system has been operable since the beginning of last year. SACL
also have a number of tenant utilising similar technology as the BRS for stocktaking and
are talking with Airlines who see wireless as a cheap alternative to upload maintenance
reports and catering records when docking the aircraft. Previous methods have been low
speed connections offered by GSM modems.
38
The advances in the 802.11i standard have only been recent and SACL have not had an
ample opportunity for testing and hence continue to utilise a VPN solution. Due to this
inability to carry out testing the move to a new office area has not been timely and meant
that SACL have data outlets wired to the workstation desks. Other factors affecting this
are due to some of SACL’s applications are not geared for wireless even at 54 Mbps as
they require application downloads from the Server. Once testing and these application
issues are resolved, the adoption of AES encryption is believed to be seen as the addition
of VPN security as being a thing of the past.
It will also provide the opportunity to move some of the wireless infrastructure inside the
corporate firewall. SACL’s first use for 802.11i is a bridging solution for a Contract
Office located out in the airfield. The ability to provide AES encryption across a link will
negate the need for complicated encryption solutions for either end user or network
administrator. So far, it is safe to say that the wireless technology will play an important
part in the future of Sydney Airport’s Total Journey Experience.
2.13
Projects Status
In 2006, complete e-Tag automation of the ground transport access system was
developed, with commissioning targeted by the end of calendar 2006. This initiative will
enhance transport efficiency through the terminal roads and pick-up zones, and further
reduce ground transport management operating costs.
Check Bag Screening Project was $90 million upgrades of the baggage systems in T1 and
T2 is in the final stages of completion. The system has been operational in T1 since 1
January 2006 as required by the Federal Government. The work to provide additional
redundancy and backup systems is in the final stages of testing. The T2 work was trialled
and tested in September 2006 and made available in early 2007. To improve asset and
financial management, SACL upgraded its maintenance management systems with the
latest version of the Maximo Asset Management System (MXES), introduced a new
Oracle-based project management system and started work on a new energy metering and
billing system. SACL also upgraded the T2 data network.
39
In 2007, new technologies such as LED taxiway lighting, radio frequency identification
bag tag scanners and wireless VoIP equipment were trialled which have the potential to
lower costs, improve productivity and improve service to customers. To improve data
management, communications and system efficiency, Sydney Airport upgraded its data
network capacity from one gigabit per second to ten gigabits per second and upgraded the
storage capacity from 20 Tb to 80 Tb to accommodate the additional closed circuit
television cameras and higher resolution digital footage. As a part of a continuous
improvement process, help desk and fault management process to the Maximo Asset
Management System were migrated. Additionally, a new energy and water metering and
billing system were completed.
In 2009, new maintenance workshops and project offices to replace facilities that had to
be demolished to make way for new aircraft parking bays were completed. The new
workshops include state-of-the-art equipment for testing airport lighting products,
including a photometric laboratory and an electronic mobile airfield lighting monitoring
system.
Australian Government mandated security screening procedures to restrict the carriage of
liquids, aerosols and gels onto international flights commenced on 31 March 2007. This
new security measure required Sydney Airport to provide additional passenger screening
infrastructure as well as contracting and training 100 new passenger screening staff at T1.
A further security initiative was the commencement of 100 percent checked bag screening
for all flights from T2. This involved the design and construction of a $37 million system
capable of screening 3,600 bags per hour and involved training of additional 45 staff.
Sydney Airport was able to commence 100 percent screening ahead of the Government
mandated target date of 1 August 2007. T1 has operated with 100 percent checked bag
screening since 31 December 2004.
Sydney Airport continues to work cooperatively with the Australian Federal Police on the
implementation of a unified airport policing model for the airport. This was a key
recommendation of Sir John Wheeler’s 2006 review of airport security and policing
arrangements. This initiative involves an Airport Police Commander, intelligence and
investigative units, and a counterterrorism first response service along with specialist
airport community policing. A major airport security service contract was tendered and
40
awarded in December 2006 for the provision of various aviation security functions
including passenger and checked baggage screening at T1 and T2, perimeter vehicle
patrols, access control, guarding and security surveillance monitoring. The contract was
designed to provide enhancements to airport security outcomes through improvements in
the management and supervisory structure, staff training and competencies along with a
strong performance management regime. An improvement to the background checking
arrangements for Aviation Security Identification Card was made with the introduction of
a centralised Government background checking unit. Sydney Airport has been working
closely with the Attorney General’s Department and the Office of Transport Security to
design significant changes to the current airport identification application process. The
next phase of this project will see the development of a new database with on-line
applications and seamless integration with the new background checking unit.
41
Chapter 3
Development and Implementation of Wireless Application for Securely
Recording Electricity Consumption for the Hong Kong Electricity
Company (2004-2005)
3.1
Introduction
Hong Kong Electricity Company Ltd (HEC) and China Light and Power Ltd (CLP)
employ several personnel to collect and record the electricity meter readings in and around
greater Hong Kong. Human errors are easily created due to manually recording a large
number of meter readings. It is time and resource consuming. There are the cases that some
meters are installed inside a private house, a private front yard or back yard. The power
company staffs will not be able to record the meter readings if the owner or occupancies
are not in their houses. In some cases, it is not so easy to make arrangement with the owner
or occupiers for meter reading. Estimation of electricity usage is commonly used. It may be
a large deviation from the actual reading and hence, customers make complaints which
trigger administrative overheads which results in financial loss to the company. In some
cases, some electricity meters are installed near the ceiling in many old buildings and that
makes it necessary to have a ladder to record usage reading. This is not a convenient
procedure and creates an occupational, health and safety issue. There are cases in Hong
Kong that the dwelling owners or occupiers refuse to allow entry to the power company
staff members on property. In this instance, it is very difficult to get an actual record of
electricity usage. Hence, energy generation and distribution contractors pay high cost for
inefficient operation for electricity meter reading. Figure 3-1 represents a general
schematic of electricity distribution and transmission in Hong Kong.
Figure 3-1 – A schematic of electricity distribution and transmission in Hong Kong
[courtesy of HEC]
42
This necessitates periodic automatic reading of electricity through a mobile communication
network. The communication channel can be a fixed line telephone, a trunk radio or a
mobile channel. Fixed telephone line is not convenient due to the need to install a
telephone cable in the meter room. In many cases, customers do not allow the installation
of any telephone cables on their properties. Wireless technology can be an ideal solution
for this issue. Mobile communications system is used in many countries for the same
purpose as it eliminates the requirement to install a private wireless network. It is not
expensive and there is no need to build another network when there is a working mobile
network. In this investigation Global System for Mobile Communication (GSM) network
is used. However, the solution presented is applicable to other mobile networks. At
present, modern electricity meters are manufactured with serial port for GSM modem. The
locations of meter rooms are usually poorly covered by a GSM network and this prevents
an easy implementation of an automatic electricity meter reading system. A solution using
Bluetooth® and GSM technologies to make a wireless connection between a meter room
and a mobile network access interface is proposed and investigated for the feasibility in the
following sections.
3.2
GSM Solution for Electricity Meter Reading
The GSM solution for electricity meter reading is shown in figure 3-2 below.
Antenna
Electricity
Meter
GSM Modem
Serial
Interface
Figure 3-2 – Connection of GSM modem
The GSM modem is connected to a server in the control centre by a GSM network. The
server in the control centre handles the power meter reporting operation. It sends a
command to request a set of readings from the meter. The data received can be real time or
pre-recorded. The server is programmed to obtain data periodically. This is quite flexible
and the readings can be programmed in any time interval.
43
3.3
Problems with the GSM Network Solution
It is very common in large and densely populated cities that the electricity meter room is
located in the ground floor or the basement and mainly in the center of the building. The
mobile coverage is usually poor in meter rooms. Figures 3-3, 3-4 and 3-5 show typical
layout of the most common building in an urban area. These buildings are usually poor for
mobile coverage for an automatic electricity meter reading solution using GSM.
Shop
Shop
Meter Rack
Corridor
Shop
Shop
Shop
Transformer
Shop
Shop
Figure 3-3 – Typical layout of a shopping mall
Lift
Wash
Room
Wash
Room
Lift
Meter Room
Figure 3-4 – Typical layout of a large restaurant
Lift
Lift
Lift
Meter Room
Figure 3-5 – Typical layout of a multi-storey office block
44
The problem is further complicated by the fact that a power meter is usually placed inside a
metal rack as shown in figure 3-6 below. The metal rack tends to further reduce the signal
strength of the mobile network. In general, a site is not suitable for installation of GSM
modem if the measured signal strength is lower than -88 dBm at the meter location.
Unfortunately, an investigation of the signal strength shows that it is invariably below
-
88 dBm in meter rooms.
Figure 3-6 – Electricity meters in a secure rack
One solution to this problem is to use a cable to make the physical connection between a
GSM modem and a meter. This is definitely not convenient. Besides this, some customers
do not allow the installation of any additional cable on premise. Wireless solution seems to
be the solution in this case. But there are many factors that affect the choice of wireless
system. They are propagation distance, interference, building structure, indoor layout,
power supply, and cost and licensing requirements. Most customers prefer to use a wireless
link in unlicensed frequency band, the industrial, scientific and medical (ISM) band
because this band is accepted globally.
Bluetooth technology is the good contender because it operates in the ISM unlicensed
radio frequency (RF) band and it has a complete protocol stack [35] with reliable RF link
[36] and efficient security algorithm [37, 38]. The cost of Bluetooth solutions is also
competitive [37]. A Bluetooth link has to make a connection through concrete walls. In
some cases, the line of sight path is blocked by metal rack in the meter room. Multiple
reflection paths are the standard mode of propagation. The high voltage transformer will
45
also be a factor because the GSM signal is interfered by the high voltage impulse from the
transformer. It increases the bit error rate and hence affects the reliability of the wireless
link. The design of this kind of Bluetooth devices have to be robust to maintain a reliable
communication in such a poor radio environment. The design work itself involved desktop
analysis and field trials to meet Bluetooth hardware and software specifications for this
application. Bluetooth Class 1 RF design is necessary together with error correction and
packet retransmission technique in software.
3.4
Solution for On-Site Power Meter Reading
Using a Bluetooth wireless link, the meter and GSM modem can be placed in different
locations to solve the GSM coverage problem. Figure 3-7 shows the system configuration
of an automatic power meter reading system using GSM and Bluetooth Technology.
The central control office in the above diagram is the control office of HEC/CLP. The
server in a central office will send the command to meters through PSTN, GSM and
Bluetooth Link to request the power usage reading. Digital meters will respond to the
server with the required data upon receiving the command. The control centre handles a
large number of meter readings. Each digital electricity meter has a unique identity code so
that the server can correctly verify and validate.
Meter
GSM
Network
Bluetooth
Link
PSTN
Central control office
Bluetooth
Module
Modem
GSM
Module
Server
Figure 3-7 – Automatic meter reading and reporting system using GSM and Bluetooth
This system is simple and reliable. The major concern in the design is the Bluetooth
propagation link and security. The communication between the meter and the GSM
modem is working a complicated propagation environment. During trials, in most cases,
46
Bluetooth wireless link passes through a thick concrete wall as shown in figures 3-8 (a to
d). To ensure a reliable wireless link for such an environment, Bluetooth Class 1 module
has to be employed to increase the transmission power from 0 dBm to 20 dBm and the
receiver sensitivity from -75 dBm to -85 dBm. It increases the penetration depth and
propagation distance.
Consideration was given to the placement of antenna which was carefully selected and
directivity of antenna was designed realistically. A directional antenna is preferred since it
improves the propagation quality for this application due to two Bluetooth modules are
installed in fixed locations [39]. An accurate computation of the major signal paths also
significantly improves the propagation distance and signal quality [39].
Figure 3-8 (a)
Figure 3-8 (b)
Figure 3-8 (c)
Figure 3-8 (d)
Figure 3-8 – (a) GSM and Bluetooth modules mounted on the wall; (b) power supply main
switch; (c) power distribution panel in a metal rack; and (d) rear view of power distribution
panel
47
Figure 3-9 depicts line diagram from figures 3-8(a), 3-8(b), 3-8(c), and 3-8(d). Since
Bluetooth module is required to be very near or inside the power meter casing, the physical
antenna cannot be large and hence, a patch antenna is selected and considered appropriate
for the application due to its directional characteristics. Figure 3-10 shows the antenna
placement and directivity from the scenario in figure 3-9.
GSM
Modem
Metal
Rack
Meter
Bluetooth
Module
Window
Bluetooth
Module
Concrete Wall
Figure 3-9 – Line diagram of reflected signal path of Bluetooth wireless link
Antenna
Antenna
Concrete wall
Figure 3-10 – Antenna directivity and propagation path
The propagation path loss (Lp) of two Bluetooth Class 1 module can be calculated as
follows:
48
Consider the line of sight case. The path loss in an indoor open area is,
Lp = 36 log(4d/) – 46.7 dB
(3.1)
where,
Transmission power = 20 dBm
Antenna gain = -3 dBi
Receiver Sensitivity = -90 dBm
Propagation loss = -78 dBm
Propagation range = 100 to 105 m
The attenuation of a thick concrete wall with thickness of 25 cm ranges from 20 dB to 30
dB. A signal path will be attenuated 30 dB in the worst case if it passes through a concrete
wall. The propagation range will become 20 m in this case. If antenna has a gain of 2 dBi
instead of -3 dBi, the propagation distance will be approximately 30 m. As shown in figure
3-10, the signal is reflected twice from the wall and ceiling and then pass through a thick
concrete wall, the calculation of signal strength is complicated.
Multi-ray propagation model tool must be used to calculate the signal strength and hence
the propagation distances [39]. In addition to hardware design, the link distance can also be
improved by software. The following two techniques help improve the signal propagation
range,
use of a single time slot DM1 and implement retransmission can reduce the chance
of being interfered and hence effectively lengthening the propagation distance; and
implementation of retransmission of failed data block in the application layer in
addition to the default retransmission of packet in the baseband of Bluetooth.
The next problem of concern is the security of the link. It is not desirable for anyone
holding a Bluetooth device to collect data from the meters. The Bluetooth modules
installed between the electricity meter and the GSM modem must form a trusted device
pair with data encrypted and hence, the encryption is based on the SAFER+ algorithm
which is proven to satisfy most secure applications. Physically, both Bluetooth devices
were set for not to be discovered by other Bluetooth devices.
49
3.5
Solution for an Off-site Meter Recording and Reporting System
The present system can be further developed to be used in general customer scenarios. An
estimation of electricity usage is made until there is an access to the physical meter. With
the Bluetooth module installed in the digital power meter and with the Bluetooth enabled
smartphone as shown in figure 3-11 can be used to collect the power meter readings
wirelessly and the data is sent back to central office through any available mobile network.
This eliminates requirement for accessing the premise and known as Off-site Meter
Reading (OMR). With this framework, power company staff can obtain meter reading
within 100 m from the electricity meter. Fewer people are required to record large number
of dwellings in an urban environment. This dramatically saves time and resources,
increases operational efficiency and reduces operational cost [40].
Meter 1
GSM
PSTN
GSM RF link
Meter 2
Bluetooth link
Smartphone
Modem
Server
Central control office
Figure 3-11 – Off-site meter recording and reporting system
3.6
System Configuration
As shown in figure 3-11, the OMR system consists of mainly five components. They are:
50
Bluetooth enabled digital electricity meter;
Bluetooth enabled Smartphone;
GSM mobile network;
PSTN; and
a server modem unit.
GSM network is used here to describe the concept due to the fact of its huge coverage
worldwide. Other networks such as IS-95, PDC or DAMP etc, can also be accessed for this
purpose. The system uses a modem connected to PSTN. It is a circuit switching data
(CSD) application. It can be a packet data network connected to the internet with GPRS
and mainly dependent on the system operating cost.
There are two wireless links in the system. Bluetooth wireless link is a short range piconet
for meter readings collection and a GSM link is used to send the data to central office. As
shown in figure 3-11, the smartphone can initiate sessions with many meters at a time.
Every meter can be identified by their Bluetooth address. The Bluetooth addresses are
stored in the memory of the smartphone. The power company staff will need to first select
a region of the meter locations in the smartphone and a list of meter addresses will be
displayed. The staff can click the meter addresses to build a Bluetooth piconet. Meter
readings can then be collected through the piconet. Due to the limitation of the Bluetooth
protocol [35, 36], a piconet can only include seven meters. Therefore, there will be many
piconets of seven meters. A user of the smartphone can select a piconet every time. Once
the meter readings are stored in the smartphone, they can be sent to the central control
office by the GSM network. The meter reading collection can be completed in a short time
at the user’s finger tips.
3.7
Design Considerations
The Bluetooth specification allows for three different types of radio powers. They are
Class 1, Class 2 and Class 3. These power classes allow Bluetooth devices to connect at
different ranges. Class 3 is a low power class of 1 mW radio. The radio links of Class 3
devices can communicate up to 10 m.
51
However, human bodies, furniture, concrete walls etc, absorb microwaves, reception may
not be reliable at the limit of this range. So, when using 1 mw radios, a more realistic
distance for reliable operation in a normal room will probably be 5 m. This only provides a
low cost, low power communications solution which has a sufficient range to replace a
cable. For Class 2 devices, communication distance is a maximum of 20 m but a more
realistic distance was found to be 10 m. The maximum realistic range for a Class 1 at 100
mW radio is found to be about 100 m.
The electricity meters are installed in a wide range of environments. Some meters are
installed inside a private house, a private front yard and back yard. The meters may be
placed a long distance away from the power company staff holding the smartphone taking
meter reading. Some meters are put in a concrete room located at the center of building.
The wireless links need to have the capability to penetrate concrete wall. In considering the
standardisation and worldwide availability, Bluetooth technology is chosen for this
application and feasible to design a Class 1 Bluetooth module for the electricity meters.
Due to the added power amplifier (PA) and low noise amplifier (LNA), Class 1 Bluetooth
solution has better penetration capability and longer propagation distance than other
classes of Bluetooth solutions. The maximum guaranteed distance of Class 1 Bluetooth
wireless link is 100 m. Anyway, class 1 Bluetooth devices are higher cost and power
consumption than Class 2 and Class 3 because of the added microwave PA and LNA.
It was a judgement call to use appropriate smartphone for this application. Almost all the
Bluetooth smartphones are designed in Class 2 for battery power saving. An external
Bluetooth module is needed to upgrade the smartphones to Bluetooth Class 1 and this
increases the cost.
Considering cost and the nature of application, three system configurations as shown in
figures 3-12, 3-13 and 3-14 were considered. It was the most realistic approach to find the
correct configuration of Bluetooth Class.
52
75dB
BT Meter
Class 2
BT phone
Class 2
Po = 0dBm
S=-75dBm
Po = 0dBm
S=-75dBm
75dB
Distance = 10 m
Figure 3-12 – Class 2 Configuration
110dB
BT Meter
Class 1
BT phone
Class 2
Po = 20dBm
S= -90dBm
Po = 0dBm
S= -75dBm
75dB
Distance = 50 m
Figure 3-13 – Class 1 and Class 2 combination
110dB
BT Meter
Class 1
BT phone
Class 1
Po = 20dBm
S= -90dBm
Po = 20dBm
S= -90dBm
110dB
Distance = 200 m
Figure 3-14 – Class 1 configuration
Figure 3-12 shows a low cost system configuration. A Class 2 Bluetooth module is
installed in electricity meter. It is also not necessary to employ external Class 1 Bluetooth
module for smartphone. This configuration has propagation distance of 10 m. It is only
suitable for very short range data communication such as taking electricity meter readings
installed near the ceiling or stairs of old buildings.
Figure 3-13 shows a Bluetooth Class 2 and Class 1 combined configuration. The electricity
meter is equipped with Class 1 Bluetooth module while the smartphone is just the standard
class 2 Bluetooth phone. The distance between the phone and meter can be 50 m
maximum.
53
If the measurement must be taken 100 m away, it is necessary to employ full Class 1
solution as shown in figure 3-14. The distance for Line-of-sight can be up to 200 m but in
most cases it will affect by objects of environment for such long distance. The system is
specified to 100 m coverage distance although it can be longer. An external Class 1
Bluetooth module is necessary for smartphone. The external module is usually a modified
secure digital (SD) card using standard SD input/output (I/O) interface. Electricity meter
should have a Class 1 Bluetooth module installed.
An antenna is a critical component to affect the coverage distance of the Bluetooth system.
As it is not much space for the antenna in both electricity meter and smartphone, small
antennas are usually employed. The gain of such small antennas is -3 dBi to -4 dBi. This is
the reason for the specified propagation distance is shorter than the calculated value.
3.8
System Hardware
The major hardware devices of the system are the digital electricity meter, Bluetooth
module for meter, smartphone, Bluetooth SD card for smartphone, modem and server. The
server can be a PC running Windows 2000 server or Windows server 2003. The modem
can be an ADSL modem, cable modem or even dial up modem. The smartphone can be a
common smartphone product in the market with Bluetooth inside. The digital electricity
meter is supplied by manufacturer such as Elster Metering Limited. The two Bluetooth
modules were design to install in meters and smartphones.
Figure 3-15 shows Class 1 Bluetooth module hardware design installed inside a digital
electricity meter. A 16-bit microcontroller unit (MCU) is used to handle the Bluetooth
communication link for meter readings collection. Class 2 Bluetooth module can be a
commercial module solution in the market or designed by using Bluetooth chipsets. PA
and LNA are used to increase the transmission power to 20 dBm and improve the
sensitivity to -90 dBm.
The Bluetooth module in the smartphone side is similar except the interface is SD I/O
rather than RS232. For Class 2 Bluetooth solution, power amplifier and LNA are not
necessary for a module. No external Bluetooth module is needed for Bluetooth enabled
smartphone.
54
Figure 3-15 – Class 1 Bluetooth module design for power meter
3.9
System Software
The system software for off-site meter recording solution is formed by two parts both
running simultaneously – one in a smartphone and the other in the electricity meter. Both
smartphone and power meter uses Bluetooth serial profile for communication [36]. Figure
3-16 shows Bluetooth profile hierarchy. Serial Profile is a basic profile for many other
advanced profiles. Only the RS-232 characteristic is applied for the system proposed here.
The serial profile provides RS-232 serial cable emulation for Bluetooth device. In this way,
legacy applications do not have to be modified to use Bluetooth, they can simply treat a
Bluetooth link as a serial cable link. It is suitable for the developed application in the meter
reading system.
55
Figure 3-16 – Bluetooth Profile Hierarchy
In a smartphone, there is mainly the meter reading software to handle the meter reading
job. This includes three major sub-programs. They are server, power meter and multi-mode
interface (MMI). Server is responsible for the server connection through GSM network.
Meter governs the meter communication via Bluetooth link. MMI is for user interface.
There is a simple scheduler program to handle the meter reading job in the meter side. The
scheduler is responsible to scan the Bluetooth device, handle authentication, send meter
data on receiving the commands from smartphone and store the meter reading history as
preset by a user.
The security of the system is handled by Bluetooth Security Mode 2 [37, 38]. Figure 3-17
shows the security architecture of Bluetooth Security Mode 2 [37]. Smartphone and meters
are set as bonded devices which are marked in a database as trusted and can be given
unrestricted access to all services.
The operation of the OMR software is illustrated in figure 3-18. The Bluetooth transceiver
in meter is programmed to be the slave of Bluetooth piconet and periodically enter inquiry
scan state to make it available to inquiring devices. The smartphone is programmed as
master of Bluetooth piconet. Inquiry process is started when user turns on the Bluetooth
application in the smartphone. To establish a connection, the smartphone is instructed by
the meter readings collection application to carry out the paging procedure.
56
Figure 3-17 – Security Architecture
The smartphone as a master of the piconet first enters the page state, where it will transmit
paging message directed at the intended “slave” device (the intended meter). The Slave
meter acknowledges the paging message and the master smartphone enters the master
response sub state and responds with its frequency hopping sequence (FHS) packet.
Once the slave meter receives the FHS, it updates its own clock timing and synchronisation
word or an access code reference before entering the connection state. After authentication
and ciphering, the meter readings collection application starts to collect the meter readings.
The meter readings will be sent back to server once received from the meter by the
smartphone.
57
Inquiry
Response
Page (ID)
Response (ID)
FHS
POLL
NULL
Authentication & Ciphering
Readings Request
Meter Readings
Readings Request
Meter Readings
Meter Readings
Reading received
End Readings Collection
End Readings Collection
Disconnection
Serial Link
Bluetooth SPP link
GSM Mobile link
Figure 3-18 – Operation of OMR software
3.10
Conclusions
Traditionally, fairly large size manpower is coordinated by electricity companies to record
the electricity meter reading. It is a costly job and easy to get errors in some readings. In
some cases, companies are unable to access the private dwellings due to either animals or
security devices and so are required to estimate the power usage. In this chapter an
innovative solution developed simplifies required task by using Bluetooth. Electricity
meter recording can be performed at ease and efficiently from Bluetooth enabled
smartphone connected via GSM/PSTN network with Bluetooth enabled electricity meters.
By using either on-site or off-site solutions, human error is eliminated for a faulty meter
reading and not required to estimate the electricity usage. As a result, HEC/CLP has
reduced the operation cost dramatically. Good signal strength was a challenge as meter
rooms are usually poorly covered by the mobile network coverage especially, when they
58
are located in the basement. The on-site power meter reading solution proved to be a good
solution where cable connection is possible but not convenient due to its intrusiveness.
Mobile network modems in a location having a good coverage signal can use on-site power
meter reading solution.
The OMR solution provided in this chapter integrates the Bluetooth and mobile networks
for electricity meter readings. The smartphone is the key device to bridge the Bluetooth
network and Mobile network for recording of electricity meter readings. The cost of the
system is low. It involves only two hardware designs which are the Class 1 Bluetooth
modules for meters and smartphone. The development and system cost are low. This new
idea improves the efficiency of meter reading work and also dramatically reduce the
resource and operation cost. With this system, power company staff can finish the meter
reading collection in a very short time at his or her finger tip. The idea has been accepted
by a power company in Hong Kong. Bluetooth wireless technology seems to be the best
option available for this application due to its fully standardised protocol and reliable
performance. Commercial systems based on this prototype have been built and tested. To
date, overall performance of this solution was found to be satisfactory.
Difficulties still exist due to the propagation environment, which are caused by the
complicated indoor propagation patterns, signal shielding, signal attenuation and multipath
interference. It found that a directional antenna is preferred to increase the propagation
distance and a propagation model is needed to compute the signal propagation patterns so
that the antenna can be set pointing to the direction with the maximum signal strength.
Automatic retransmission for negative acknowledgement must be enabled in both in the
baseband and the application layer so that a reliable data link can be established. The
solutions developed are not only limited to electricity usage application. It can also be
applied to automatic gas and water usage readings. The Bluetooth is mainly applied in
mobile headset currently. The integration of Bluetooth and mobile technologies such as 3G
and 4G can generate many valuable applications.
Today, mobile applications for energy sector have grown immensely. There are several
applications available for the domestic utility segment. The most famous is the iPhone
App. The eQ-3 (a German company) has designed a program that controls windows,
radiators, light switches and dozens of other household appliances at the touch of a button.
59
Control4 (a US company) offers a home management system that automatically dims the
light when you’re watching a movie. It is also capable of blocking a PC and/or TV when
kids are doing their homework. It can be operated by iPhone and iPod Touch. Ecobee,
Lutron and Tendril offer similar smart phone applications. Just as the use of smart phone
technology with multiple consumer applications has transformed the telecommunications
industry and the way people communicate, so too will the smart grid revolutionise the
energy industry and the way people use energy.
60
Chapter 4
Design and Development of a PDA based Wireless Food Ordering System
for the Box Hill Institute (2005-2006)
4.1
Introduction
As mobile devices become smaller, cheaper, better and more connected, they are changing
the way people access and work with information [41]. The convenience and powerful
functionality offered by mobile devices, such as PDA, has encouraged many industries to
find benefits in using them. Wireless and handheld devices abounded, as vendors pitch
their common themes of one-to-one computing, instant communication and, anytime,
anywhere information access [41]. Originally, the PDA was intended to be an electronic
version of a “personal organizer”, however, with the introduction of more powerful CPUs,
operating systems and memory, today's PDA are being customised for various
applications. Unlike desktop PCs and laptops, mobile devices have many constraints such
as screen display size, interaction techniques and bandwidth over mobile networks [42].
Despite these constraints, PDAs are the preferred mobile device for business applications
because they are highly portable, have ability to communicate with PC and can access
information from remote location.
Recent studies [43, 45], have documented the potential of PDAs to affect the quality of
patient care within the healthcare industry. It has been shown that the potential for a robust
handheld computing to positively affect the outpatient ambulatory clinical setting is
enormous [43]. The ability to link data on a PDA (client) to a central database (server)
allows unlimited potential in developing point-of-care applications and systems for patient
data management [44]. It is demonstrated that several potential uses of PDAs as learning
tools including reading course materials, as a communication tool, for supporting activities
including real-time conferencing [45].
Web-based applications provide access to data and services from a remote server, which
may in-turn access databases distributed across the enterprise network or the
Internet [46]. Web-based applications are the preferred method of accessing data remotely
because they provide solutions that are easy to administer and are user-friendly. The use of
Internet protocols and subsets of World Wide Web formatting and coding standards for
61
wireless applications shortens the development cycle drastically and frees up developers to
concentrate on more important issues [47].
The food ordering process in a restaurant requires the coordination of simple tasks.
Instructions flow mainly from customers to waiters then to kitchen staff, then to bar and
finally to cashier [48]. In a medium to large and busy restaurant it is always difficult to
coordinate the entire process without having an efficient ordering system. Errors in
ordering processes lead to incorrect meal preparation and prepared in a sequence are nonconsumable and added cost to the business [49]. Web-based wireless applications on PDA
are instantly available and subsequently extremely mobile. Data on PDAs is continuously
saved; this supports incremental order creation which user finds convenient [50].
Advantages associated with the adoption of wireless technologies in restaurant
environments include increased efficiency, greater speed of service, enhanced usability,
improved accuracy, increased productivity and raising business image [48 – 51].
4.2
Related Work
A number of PDA based mobile applications have been designed, implemented and
developed for commercial use in a restaurant environment. Easy-Order® was one of the
first e-commerce applications of pervasive technology developed to interact with the
mainframe computers [51]. Wireless web-based ordering system named iMenu® [52], is
one of the first approaches that use wireless multi-tiered Internet architecture to build
commercial pervasive computing systems in the restaurant industry. Developers have
selected .NET platform as programming environment, C# as the programming language
and active server pages in .NET (ASP.NET) for the user interface [52]. Using PocketMate®
[53], orders can be sent directly from the table to the bar or kitchen, which ensures that
customers receive their orders faster and are happier. PocketMate has provision for an
extra drink to be ordered to increase the dollar per head [53]. It is developed as a platform
independent application using Java Macro Edition (J2ME) and MySQL.
4.3
Approach in selecting PHP / Mobile Technology
Good decisions about selecting a technology from variety of choices needs to be based on
a realistic understanding of current performance and how limitations can be
62
addressed [54]. There are other mature technologies adopted by mobile content providers
for interactive and complex applications development. PHP was decided to use as one of
main programming technology and decision was based on the facts like,
PHP is useful to develop a user-friendly, cross platform language and
compatible interface with the range of operating systems;
unlike other scripting languages PHP is more like programming languages,
which has functions, variables etc;
PHP works on the majority of the web servers with performance similar to
ASP. Windows Apache MySQL and PHP (WAMP) server was used which
made the task simpler as it is embedded with PHP configuration. Application
was designed to work in a web server-database environment and the language
was developed purely to serve the web pages [55], and
In-house expertise.
Unlike iMenu [49], my approach in-line with the BHI was to build a simple, stand-alone
and web-based wireless application. Connectivity between client and server is continuous
in two-tiered web-based client-server architecture. A “session” is a connection established
by PDA via access point to the server and then server transmits processed information via
access point to an appropriate printer. Within the restaurant, sessions are independent and
no interactive sessions are required. Web client requests and web server responses consist
of multiple series of discrete requests and responses that allow the transfer of data between
a mobile web client and web server (Figure 4-1). This data transfer mechanism is best
suited for devices with browser and valid network connectivity.
Figure 4-1 – Mobile Applications: Architecture, Design and Development
63
Other mobile application development platforms like JSP, ASP, Java Servlets, CGI-bin,
J2ME and PHP can be used to develop web-based applications interacting with mobile
devices. Recently, most popular are J2ME and C# for .Net platform because they provide a
complete application-programming framework on PDAs. However, the decision of not to
choose these programming languages was based on the fact that J2ME uses mobile
information device profile functionality (MIDP). MIDP lets developer create small
applications called Midlets. Midlets provide richer, interactive sessions which are portable,
downloadable and robust [56]. But Midlets consume considerable storage and memory
space which has long initial download times and the programming methodology is
complex. J2ME applications are portable and available on anything that runs Java Virtual
Machine [57]. As discussed earlier application development in J2ME is slightly more
complicated than developing a page length code compared with web-based technologies
such as XHTML, cHTML, PHP, JavaScript etc. Furthermore, consideration was given to
learning environment for students as a part of project base learning for application
development and later, it can be implemented in training restaurant with ease.
4.4
Methodology
At Box Hill Institute, the teaching and learning strategy is to support classroom teaching
with skill based activities. In line with this strategy, hands-on experience and methodology
used for this project should be based on laboratory experiments. Applied research was of
considerable importance. Its strength as a research strategy is that they allow the
investigator to make strong claim about findings [52].
Layout of the Fountains Restaurant at the Box Hill Institute is shown in figure 4-2. The
layout is an important design consideration for understanding the technical operation of the
Fountains Innovative Wireless Food Ordering System (FIWOS). The restaurant consists of
bar area, serving area, demonstration theatre and a kitchen. All operational areas of the
restaurant directly interconnect the main waiting floor, making it an efficient layout.
64
Figure 4-2 – Layout of Fountains Restaurant
FIWOS network has been designed around a single access point situated in the middle of
the restaurant (Figure 4-3).
Figure 4-3 – Logical Wireless Network Diagram
All food orders that are entered into the handheld devices by waiting staff are then
transmitted wirelessly to the printers in the kitchen and bar, where the appropriate orders
are printed, and the administrative terminal, where the orders are logged. This
communication is provided through the WAP, which will act as the bridging point between
the wireless and wired networks. One of the advantages of this network design is that any
of the devices that are connected to the access point are mobile and can be moved around
65
without affecting connectivity. This is crucial, as any lack of connectivity will impact the
operation of the system.
4.5
System Architecture
Scripting languages require browser software on the client device. A browser interface is
easy to access static content or displaying the list of application and services. A web
browser on a PDA sends a GET request for information to the web server. The client
browser also submits information to the web server using POST request. Part code written
in PHP for a PDA client is shown in figure 4-8, to clearly describe how web client request
and web server responses coordinate the wireless communication. Considering learning
environment for students both within the area of application development and then use of
application in training sector, I selected technologies which were easily available, reliable
and popular even to the novice users. FIWOS has been developed using 802.11g, PHP,
JavaScript, Microsoft Access and Visual Basic (VB). PHP is a cross platform language,
compatible with the range of operating systems. It was designed to work in a web serverdatabase environment and the language was developed purely to serve the web pages [54].
System architecture (see figure 4-4) includes following components:
Application software written using PHP and JavaScript for PDA user interface and it’s
communication with centralised database located on a server or PDA client.
Centralised relational database (CRD) developed using Microsoft Access.
Back-end application software (BAS) was written using VB to administer database
from the administrative terminal.
Wireless connectivity using 802.11g,
o between a PDA client and a web server, and
o between a PDA client and wireless printers.
66
Figure 4-4 – System Information Flow Diagram
4.6
PDA Client
PDA client is a web-based application located in web server together with the database.
This will be accessed wirelessly by PDA to create, print and close the order. Database of
food, drink, orders and tables will be handled from the administrative terminal using
admin-client. Waiting staff can access PDA client onto their PDA via wireless access
point. Based on database they can select items for orders for a particular table and then
submit the order for printing and later for storing the order. It is developed using PHP. It is
made up of several files, each of which performing a particular function within the
application.
67
Figure 4-5 – Table Summary
Figure 4-6 – Add Meals Sub-menu
Table Summary (Figure 4-5) is the first page user will see when they logon to the ordering
system. This will display table status. To start a new order, select a vacant table from the
list and press “Create Order” button and Add Meals (Figure 4-6) page will appear. “Finish
order” button will close the order and print it to appropriate locations such as kitchen, Bar,
Cashier. To get the latest table status press “Refresh List” button. Meals can be selected or
removed from the list and then can be added into the order using “Add Meals” page shown
in figure 4-6.
4.7
Centralised Relational Database
Microsoft Access database was used to develop a simple CRD. Database is the core of the
whole FIWOS ordering system. PDA client will communicate with the database to get the
information for the system. It contains the database to store data and the graphical user
interface to access the database. Important feature of this database is a table of tables which
keeps track of status on each table in the restaurant. On each order submitted by the PDA,
the table changes its vacant status to occupied status with the ability to reopen the same
order for modification. Reports can be generated efficiently on number of orders taken.
Table 4-1 lists various tables created for CRD.
68
Table 4-1 - Centralised Relational Database
Tables
Description
Entrees
Maintains no of entrees available
Mains
Maintains no of mains available
Desserts
Maintains no of desserts available
Drinks
Manages drinks available
Tables
Maintains table status and numbers associated
Orders
List total no of orders, it’s value and date
OrderDetails Maintains order status, content and its number
Users
4.8
List no of users with username and passwords
Back-end Application Software
Graphical user interface (GUI) as shown in figure 4-7 is created for administration purpose
of the system. Administrative person can have permission to login to this system can make
changes to the database. It has an ability to change passwords and also add new users and
passwords to the systems.
It contains several interfaces to view, add, edit, delete items of the database and can store
photos for appropriate items. Also this system has a report generating facility to get
printable reports of items and summaries. Back end application was design to keep it
simple so that using this feature even a cook or chef or a manager can amend menu, prices
and total number of dishes reflecting seasonal flavours and market demand.
Figure 4-7 – Back-end GUI
69
4.9
Wireless Connectivity
Secure wireless connectivity between a PDA client and a web server and between a PDA
client and wireless printers is an important aspect of this project. Functions PrintOrder and
PrintTest in the “Scripts.php” file of the PDA client defines the printing functions that
determine how each of the receipts are formatted and printed to a particular printer. These
functions are presented in figure 4-8. A wireless LAN is created using 802.11g enabled
wireless access point. Based on radio frequency, wireless capability of PDA transmits the
data in real time to a web server. For restaurant environment, mobility is required only
within the floor area of the restaurant and so wireless LAN is a good choice. Java Script
functions are added to help PHP to implement printing functionality. Functions PrintOrder
and PrintTest in the “Scripts.php” file of the PDA client defines the printing functions that
determine how each of the receipts are formatted and printed to a particular printer.
function PrintOrder($printername, $tableno,
$printitems, $printqty) {
$handle = printer_open($printername);
printer_start_doc($handle, 'Order');
printer_start_page($handle);
$tablefont = printer_create_font(“Arial”, 72, 48,
500, false, false, false, 0);
$headingfont = printer_create_font(“Arial”, 72, 48,
500, false, true, false, 0);
$bodyfont = printer_create_font(“Arial”, 72, 48,
200, false, false, false, 0);
printer_select_font($handle, $tablefont);
printer_draw_text($handle, “Table: $tableno”, 350,
50);
$y = 100;
printer_select_font($handle, $headingfont);
printer_draw_text($handle, 'Item', 0, $y);
printer_draw_text($handle, 'Qty', 1000, $y);
$y = 200;
$fontsize = 72;
printer_select_font($handle, $bodyfont);
for($x = 1; $x <= count($printitems); $x++) {
$y+=$fontsize;
printer_draw_text($handle, $printitems[$x], 0, $y);
printer_draw_text($handle, $printqty[$x], 1000,
$y);
}
printer_delete_font($tablefont);
printer_delete_font($headingfont);
printer_delete_font($bodyfont);
printer_end_page($handle);
printer_end_doc($handle);
printer_close($handle);
}
function PrintTest() {
$p = printer_open('HP 6200 Network');
printer_set_option($p,
70
PRINTER_PAPER_FORMAT,
PRINTER_FORMAT_A4);
printer_start_doc($p, “Testpage”);
printer_start_page($p);
$pen =
printer_create_pen(PRINTER_PEN_SOLID, 1,
“000000”);
$font = printer_create_font(“Courier”, 37, 19,
PRINTER_FW_NORMAL, false, false, false, 0);
printer_select_pen($p, $pen);
printer_select_font($p, $font);
for ($i = 0; $i < 4600; $i+=100) {
printer_draw_line($p, $i,0,$i,6700);
printer_draw_text($p,$i,$i,0);
}
for ($i = 0; $i < 6700; $i+=100) {
printer_draw_line($p, 0,$i,4600,$i);
printer_draw_text($p,$i,0,$i); }
printer_delete_font($font);
printer_delete_pen($pen);
printer_end_page($p);
printer_end_doc($p);
printer_close($p);}
Figure 4-8 – Wireless Connectivity for a PDA Client
Figure 4-9 depicts a snap shot of “PrintTest.php” file is an included file in the application
that provides some alternative printing ability in the case of printer to accept RAW data
from “Scripts.php”. The main difference between this file and the print functions defined
in the “Scripts.php” file is that this is written in a JavaScript.
<script language=“JavaScript”>
var gAutoPrint = true; // Flag for whether or not to
automatically call the print function
function printSpecial()
{
if (document.getElementById != null)
{
var html = '<HTML>\n<HEAD>\n';
if (document.getElementsByTagName != null)
{
var headTags =
document.getElementsByTagName(“head”);
if (headTags.length > 0)
html += headTags[0].innerHTML;}
html += '\n</HE' + 'AD>\n<BODY>\n';
var printReadyElem =
document.getElementById(“printReady”);
if (printReadyElem != null)
{
html += printReadyElem.innerHTML;}else
{alert(“Could not find the printReady section in the
HTML”);
return; }
html += '\n</BO' + 'DY>\n</HT' + 'ML>';
71
var printWin = window.open(““,”printSpecial”);
printWin.document.open();
printWin.document.write(html);
printWin.document.close();
if (gAutoPrint)
printWin.print(); } else
{ alert(“Sorry, the print ready feature is only
available in modern browsers.”);
}}</script>
//// To be added to controls
<div id=“printReady”>
<p>Hello World! Your Printable Page Content Goes
Here</p>
</div>
<form id=“printMe” name=“printMe”>
<input type=“button” name=“printMe”
onClick=“printSpecial()” value=“Print this Page”>
</form>
//// To be added to controls
Figure 4-9 – Alternate printing option
Complete FIWOS system installation procedures, source codes and user manual are
provided at Appendix A.
4.10
Security
Web-based wireless ordering system can be provided efficiently with high level security
and implemented effectively for the same, [48] proposed that web-server should reside in a
special subnet or “demilitarised zone” which then can be attached to the firewall. The
firewall performs protocol level filtering to allow connection from authorised users only.
The developed system has been tested within existing wireless LAN environment which
uses 802.11b/g enabled wireless access points.
Today, very few access points incorporate WEP encryption and most wireless routers are
sold with WEP turned off. Security analysts have criticised WEP’s inadequacies, and the
US Federal Beaureu of Investigation (FBI) has demonstrated the ability to break WEP
protection in only three minutes using tools available to the general public. To overcome
these issues, WPA and WPA2 were created which protects data and privacy [58]. It is
based on IEEE 802.11i standard. For this application, it was observed that no real threat
with the food ordering system which has an in-built WPA2 encryption-decryption protocol
within the access point or wireless router. This mechanism allows hardware addresses
(MAC addresses) to be configured for wireless access to retrieve and store on the server.
72
4.11
Limitations
After configuring the equipment the testing was done successfully using two PDAs.
Testing using more than two PDA is not done yet however, considering simple operation I
do not see any technical hurdles. At present, this system does not provide opportunity to
monitor stock and inventory control for the restaurant. If implemented in a day long busy
restaurant then recharging PDA battery(s) would be a challenge. Finally, connectivity is
done using static IP addresses and MAC addresses of PDA are stored in access point. Due
to present vulnerabilities in wireless technology, it may not make this system entirely
secure enough to defend itself against attacks. However, considering nature of application,
I strongly believe WPA is secure enough for food ordering transactions.
4.12
Lessons Learned
This project met all scope and cost goals. The project cost was approximately $25,000 or
approximately 50% of the approved budget. The project team often got bogged down on
several occasions with on-going modifications to the system. Throughout this project, there
seems to be no shortage of enthusiastic suggestions emanating from the members of the
team. There was lots of consideration and respect for opinion within the group that allowed
each team member’s idea to be explored in detail. One of the things that went right is the
communication between team members. In addition to the problem of being unable to
source test equipment, the project came across a situation where none of the team had
sufficient knowledge or ability in wireless application programming. There were several
attempts to hire an industry professional to come and demonstrate client/server
applications however, there were several scheduling issues.
It was difficult to come to an arrangement with a time that stakeholders could meet on a
regular basis for the training. The team has learned from the beginning that there are going
to be a lot of aspects of the project that will not be able to be completed immediately with
the existing skills set. With this in mind, the team has very effectively learned how to
retrieve information through their own research through books, magazines, the Internet and
above all using self-initiative. From a project manager’s perspective, I endeavour to ensure
that some of the more fundamental documentation is agreed upon and delegated as tasks
from day one. There were some difficulties with this during the project as most of the
73
project management and documentation areas were fairly new or had not been previously
put into practice. Also, during the first two weeks of the project, I focused more on
establishing the team and its roles and responsibilities for the deliverables so that there
would be a much more solidified platform moving forward in the project.
4.13
Future Work
In addition to PDA and wireless technology, the location identification feature provided by
GPS can be integrated to FIWOS to deliver latest information from to waiters on the floor.
Research has been done to integrate these technologies for the development of the
PDA/GPS guide system for tourism industry has been done [58]. Alternate development
for client-side print control needs to be explored further. Implementation into hospitality
environment will make wireless ordering system more efficient. The restaurant business is
not consistent every day of the week. Coordination of orders submitted by multiple PDAs
would be efficient with the implementation on queuing principle especially during peak
time. Location Based Tourism System (LBTS) and GPS have been explored separately for
use in tourism industry [59].
Further research can be done to see the possible implementation of LBTS together with
GPS in existing system and apply new system in highly mobile food industry, for e.g. pizza
delivery. Once hospitality students learn this new way of taking food orders and processing
financial bills then the challenge would be to optimise the system by using their feedback.
Currently this system has no interface with standalone financial system. Interesting thing
would be to develop a total solution customising according to clients requirements at the
Box Hill Institute interfacing with their financial and business activity reporting.
Furthermore, mobile applications can use message queue applications with the store-andforward mechanism. This will allow user update to be placed in the message queue if no
connection has been established prior to the communication. The application software
written for this keep sending messages until it is successful.
74
4.14
Conclusions
This chapter presented applied research based on laboratory experiments to demonstrate
how mobile devices such as PDA can be effectively used in hospitality environment and
educators should consider how they use the technology for routine teaching, innovation
and creativity. It was proved that a simple, an effective and readily available technologies
can be appropriately amalgamated to create user-friendly application at very low cost.
Low cost applications are useful in learning environment especially, considering publicly
funded institutes. FIWOS has been tested for its functionality into special purpose built
wireless communication laboratory. Two Dell® Axim™ PDAs were used, one Linksys®
WAP11 Wireless Access Point, one Dell® Desktop PC with Windows XP® running on 512
MB RAM and Pentium® 4.4 GHz processor and a Brother® Wireless Multi-function colour
printer. Stakeholders were involved to test each stages of this project. Results of various
tests were documented as a part of effective learning process. Pervasive computing and in
particular, mobile wireless application development is now part of the Box Hill Institute’s
higher education programs.
75
Chapter 5
Design and Development of a Visitor’s Personal Guide using iPod for the
Box Hill Institute (2006)
5.1
Introduction
Over the past few years use of mobile devices has been increased for various purposes.
Apple released its first iPod on October 23, 2001, a breakthrough MP3 player. Apple’s
latest iPod is available today which is considered as Portable Media Player with many
functions providing rich multimedia experience. It focuses on the playback of digital video
as well as storing and displaying pictures and video [60]. Since then, iPod has been
successfully and effectively used for various purposes including media player, bootable
drive, external data storage device, a PDA replacement and for Podcasting.
Academic and tourism are two areas where the use of mobile device is encouraged to gain
benefits from the technology. For academic use of iPod, its recording and storage
capabilities has been explored by some educational institutes across the US. According
to [61], iPod supports individual learning preferences and needs, easy-to-use tool for
recording interviews, field notes and small group discussions etc. Tourism industry is also
identified as a potential area to use mobile technologies. Dublin Tourism discovered use of
iPod as a Portable Tourist Guide which then followed by their neighbour Scotland in 2003
[62].
Sales of interactive portable MP3 player have increased explosively since last few years. In
2005, Information Media Group predicted that sales will continue to increase at the rate of
45% for next six years [63]. The iPod is currently the world’s best-selling digital audio
player and increased its popularity in Australia seven fold [60]. Greg Joswiak, the
worldwide vice president of iPod marketing said, “As of August 2005, market share in
Australia is 68% of digital player market”.
With the increasing use of digital media together with the handheld devices, this iPod
application will eliminate need of a human guide and will provide entertaining experience
to visitor. It will be very useful for landmark tourist destinations such as aquarium,
museum etc. There will be a huge demand as increasing flow of tourists in Australia.
76
Tourism Australia 2010 report says increase of total tourists from 9.982 million in 2009 to
18 million in 2010 [64].
5.2
Background
Tourism is an important activity for human life as a source of pleasure and reserved for
holiday period. Several new places are visited by numerous people every year. Prominent
tourist spots are usually places such as an art gallery, a palace, a commercial destination
such as stock market, a parliament house etc.
Every new visitor suffers from preconceptions and anxiety on their lack of knowledge
about the visiting site. This acts as a barrier and must be overcome before effective and
enjoyable experience can take place. Thus far, the tourism industry in Australia has
promoted via various communication mediums such as location maps, information centres,
interactive touch screens, video screens etc. Tourism has been a popular area for mobile
information systems and other PDA based systems [65].
Audio and video has been neglected or underused as a leaning medium in recent
years [66]. A general view is that video is a better tool for leaning than audio. Animation
and interactive media like simulations can attract attention but they proved to be expensive.
Hearing is an astoundingly efficient skill according to [67].
Portable media players such as PDA and iPod can provide information anytime and
anywhere. These devices come with their own hard-drive and eliminate transportation of
storage devices, which is a requirement for video communication. iPod with in-built
speakers and microphone make it easier to record and playback information stored into its
hard-drive. Besides its popularity and ease of use, listening to an iPod and similar devices
at public places is socially accepted.
At Box Hill Institute (BHI) it was realised the use of iPod as a part of “Innovation Walk”.
The “Innovation Walk” is developed with the aim of showcasing the institute’s prized
innovations. Career teachers, overseas visitors, students, industry and government
dignitaries and community can undertake the walk independently or as a guided tour.
77
Figure 5-1 and 5-2 shows concept of the Innovation Walk and its snap shot from the BHI
website.
Figure 5-1 – Innovation Walk Website
Figure 5-2 – Sections of the Walk of Innovation
78
5.3
Personal Guide Design
The visitor’s personal guide itself will be in the form of an iPod that can be programmed to
give details of a defined list of locations, as well as playing an audible narration of each
featured location. This will allow visitors to navigate the visitor’s site on their own with the
use of the iPod. Following technologies can been considered initially to program the iPod
as per the requirements:
create an application in J2ME on java platform porting it to the iPod.
install a variant of Linux (more on this later) and modifying its operation to create the
system from this platform; and
create a text-based guide on the iPod.
Text-based option is the easiest way with some limitations and given preference on the
basis of the estimated time and skills available. To get multiple text pages to run is a fairly
simple concept. It requires a specifically named file located under the “Notes” folder that
acts as an index page, from which the menu would be created and all other note will be
created. As discussed earlier iPod as storage devices can easily be connected to a computer
via the USB port and the drive that is mounted for the iPod can be navigated easily from
the “My Computer”.
5.4
Content Page
Open up the “Notes” folder and create a new file called “Main.linx”. File name as
“Main.linx” is required for two reasons. The first reason is that by naming the file “Main”,
the iPod will automatically display the page as an index, rather than providing a list of
available files to open. Secondly, the extension “.linx” of the filename defines the method
used to display on the iPod screen a link to another text file.
The iPod has two methods of displaying a link. The default is to have a link created within
a text file appear as a hyperlink, similar to that of an html webpage with the word or
sentence underlined. The second method is to display the links as an actual menu item on
the iPod. This method would be ideal for the contents of the visitor’s guide.
79
Once the “Main.linx” file has been created and located correctly, the next step will be the
contents of the main page. This will create the major links to each of the locations that will
contain information. This is achieved by opening up the “Main.linx” file in Notepad and
entering the following:
<title>
5.5
Alternative Operating Systems for Apple’s iPod
Currently there are two main alternatives to Apples’ iPod Operating System iPodLinux
(open source venture into porting Linux onto the iPod) and Rockbox (an open source
replacement firmware for mp3 players).
iPodlinux [68] and Rockbox Operating System [69] are able to replace the Apples’
Operating System and still maintain the same functionality. The alternative operating
systems are capable of playing MP3’s and other audio formats, videos and reading notes.
The main difference between Apples’ Operating System is that iPodlinux and Rockbox
can:
play video games;
run applications;
develop your own applications without requiring commercial development
tools; and
programmers can develop their own applications or modify/customise existing
iPodlinux GPL applications.
Certain Linux applications are recompiled to run on the iPod without modification. Both
alternatives to Apples iPod Operating System have a following of enthusiastic
programmers and developers who have figured the workings of the five generations of the
iPod. Developers and programmers of the iPodlinux have contributed a lot to an Open
Source operating system by setting up internet relay chat rooms, news groups, forums,
wikis and websites. Sourceforge [70] hosts the source code and development comma
separated value (CSV) tree, which is maintained by the iPodlinux core developers.
Documentation of the iPod hardware components such as microcontroller, display,
memory, battery and so on is now accessibly to everyone. Rockbox Operating System
developers thank the hard work of iPodlinux project because if it wasn’t for iPodlinux
80
documentation and developers the Rockbox Operating System may have never been ported
to the iPod.
5.6
An alternative iPod operating system
iPod as a visitor’s personal guide project initially was looking at the bleeding edge mobile
Java J2ME application technology to fulfil its requirements. After research it was
discovered that, there are other ways to implement a tour guide on an iPod. The research
found iPod Notes, iPodlinux and Rockbox.
iPod Apple Operating System is proprietary and therefore close source.
iPodLinux and Rockbox are open source Operating System that has been
written under the GNU General Public License.
iPod Apple OS only supports a crippled html language in “Notes” which allows
the development of interactive Notes that can contain pictures, video and text.
How iPod can be programmed for iPodLinux?
Programming for iPodLinux is done in C programming language and as a prerequisite the
standard functions and libraries must be used. Here is an example of the “Hello World”
code using the printf function from stdio.h library. Using notepad or a C application, the
following can be entered to get desired code:
Start off by including the pre-compiler derivative includes statement:
#include <stdio.h>
Next, to create the main function from which the code to print “Hello World”
will be inserted (Figure 5-3).
int main (int argc, char **argv)
{
printf (“Hello World!\n" );
return 0;
}
Figure 5-3 – Sample Main Function created using “C” Programming Language
81
Save the code you have entered into notepad using the filename of hworld.c.
The step is to compile hworld.c using the arm complier tools,
arm-elf-gcc hworld.c -o hworld -elf2flt
Execute “hworld” on the iPod running iPodlinux. It will display “Hello World”
to the iPod screen. Once you are happy with your application it can be
packaged as a module and inserted into the Podzilla menu structure.
Developed prototype application using an Apple iPod is shown in figure 5-4.
Figure 5-4 – Design of a Main Menu
5.7
Advantages
This application on iPod will:
eliminate need for a human guide;
provide a self-guided tour with entertainment to visitors;
lead to interactive customer service;
provide flexibility to tourists to tour the area as per their own need, time and
interest; and
82
achieves a great tourists turnaround time as no need to wait for some predefined
number of tourists.
5.8
Future Trends
This concept can be further developed to provide visitors with the information in languages
other than English, in a multicultural community environment. Also enhancement to the
application can be made to discover the possibilities of porting iPodLinux platform on
current version of iPod, which is not done thus far. Further to that possibilities of using
iPod on commercial environment like PDA will be investigated. Cost effective solution
can be implemented at various landmark tourist destinations such as mines, aquariums,
museums etc, and in near future will replace existing expensive technologies.
5.9
Conclusions
It is demonstrated that iPod can be used as an innovative and cost effective tool. To realise
the use of iPod as a visitor’s personal guide, iPod’s simple user interface was designed
around a central scroll wheel can be explored for the navigation and recording/ playback
facility. It provides latest information to visitors. Furthermore, iTunes can add entertaining
experience with preferable music while using it as a personal guide.
I realised that I had found a solution that was not only easier, but innovative which helped
me progress my research in ways I didn’t even knew that I can with an iPod. Results of this
research are being used to further fine-tune the end-product that is to use as a visitor’s
guide. Further investigations and other ideas spinning-off from the core idea are on-going
research topics within BHI.
83
Chapter 6
Design and Implementation of an Innovative Student Attendance
Recording and Retrieval Application (SARRA) for the Box Hill Institute
(2006-2007)
6.1
Introduction
The persistence of high rates of absenteeism is a major concern for all levels of education
providers. Educators strongly believe that a consistent school attendance is essential for
educational success, with low standards of academic achievement, including low levels of
English language and literacy skills, almost universally attributed by teaching staff to high
levels of absenteeism among the student body.
Several notable factors that influence student attendance and grades are motivation, prior
grade point average (GPA), self-financing by students, hours worked on jobs, quality of
teaching, and nature of class lectures. These factors lead to student behaviour, teacher
attributes, and course characteristics on class attendance and performance [71].
At the Box Hill Institute (BHI), attendance for international students needs to be reported
using the approved method to BHI’s International Student Office. It is mandatory that
international students shall meet the 80% attendance. One of the significant priorities for
BHI was the application development to reduce time, error and administration overheads
on reporting of attendance to government agencies in order to comply with regulations,
especially with Educational Services for Overseas Students (ESOS) Act 2000.
While the World is moving towards an entirely unified voice and data network, Voice over
Internet Protocol (VoIP) is becoming increasingly popular. Converging voice, data and
video networks are providing many positives for business and individuals alike. At present,
nine Victorian State’s Technical and Further Education (TAFE) colleges are looking to
deploy VoIP or have already completed rollouts. Eventually there will be an estimated
9,000 VoIP handsets in action in State of Victoria. This deployment allows convergence of
a number of technologies including; unified messaging services, virtual classrooms
utilising videoconferencing, Internet Protocol Television (IPTV) and other customised
services [72].
84
BHI faces the common technology issues that constrain other institutes, limited funding
and staff resources. Added challenges were that some students’ families need their child’s
attendance and results to be communicated spontaneously, some students lack a home
computer and/or Internet services.
In late 2005, BHI fully implemented Cisco’s voice system designed for the educational
environments that handles large call volumes without frequent busy signal; enables
deployment of phones in every classroom; provide rich voicemail capabilities and
effectively support its customer – staff and students. In 2007, Institute had over 22,000
equivalent full time students, over 800 equivalent full time staff, eleven major departments
and four campuses which mainly relied on funding from the Victorian State Government
from Schedule Contact Hours (SCH). BHI offers more than 500 full time and part time
courses which range from one week short courses up to two years diplomas and a
maximum of three years degrees in several specialties. Budget and staffing constraints
required that the new applications created and implemented on existing funded
infrastructure to maximise return on investment and reduce administration overhead.
Implementation of new applications should be incremental and appreciable. Also its
management and maintenance be both centralised and efficient thus, eliminating the need
for the frequent and costly service visits by contractors.
Due to the complex-hybrid and manual procedures involved in the present system, it was a
challenging task to come up with an innovative solution designed around available
Information Communications Technology (ICT) infrastructure. There are many VoIP
solutions available commercially. At first, Avaya®, 3Com® and Cisco® products were
investigated. Cisco infrastructure was present at BHI and this made the decision easier as a
preferred development platform. With respect to the voice quality, high performance and
reliability, systems integration, simplicity and speed of management Cisco’s telephony
products were preferred comparatively.
Cisco acquired VoIP company Selsuis Systems® in the late 1990s and released their own
version (or second generation) of phones in 2000 with HTTP and XML capabilities. Using
XML®, it allowed Cisco to deliver a user friendly interface with additional functions which
provided the user with an interactive experience with their phone. The biggest advantage of
85
Cisco VoIP phones is that they are completely open for any third party software
development and customisation [73].
This chapter aims to provide an in-depth technical in-sight into development of innovative
student attendance recording application using emerging communication technologies.
Development of Voice over Internet Protocol Student Attendance Recording and Retrieval
Application (VoIP SARRA) for the BHI is presented. This chapter demonstrates
application programming, test bed setup, design considerations, design decisions, future
plans as well as creative usage of emerging communications technologies. Developed
application combines Cisco VoIP telephony and network systems, integrates it with
existing database systems with the aim to provide BHI’s management with a cost effective,
efficient and secure way to record and retrieve student attendance data. This project is a
success and when fully integrated within existing system, it will provide BHI with a cost
effective and efficient student attendance recording and reporting system. It is concluded
that this application has a potential for use in recording and retrieving student attendance at
other Australian education providers.
6.2
Related Work
There are several other competitive products in the market for student attendance recording
and management applications for use in education sector. These products are primarily US
based and are not user friendly to customise for the Australian education system. Some of
the examples of attendance recording software found in the market are,
Phone Top K-12 (Attendance Manager®)
Sirius – School (RollMarker®)
Phone Top K-12, Attendance Manager®, is a US designed application which combines
student attendance recording with other functions such as visitor tracking and student
information [74]. This has been developed for the Cisco IP Phone and integrates
comprehensively with their other education based products, although does not integrate
with Australian based database systems.
86
Another example is the Australian based Sirius’ School – RollMarker® application, which
is part of their Schools in Sync portfolio. This program has integration into some of the
current database systems, although it does not integrate with the Student Management and
Recording Tool (SMART®) database system. It also provides access to data entry from a
number of devices including networked PC, pocket PC and laptop [75]. The Department of
Education & Training (DET) was trialling Sirius solution in 2007 [76]. 16 high schools in
Australia were using this system in 2007 and they are all based on non-Cisco IP Phone.
6.3
Project Justification
An executive decision was made to develop “an innovative solution” and “maximise return
on investment” using newly installed Cisco VoIP phones. If computers were used as
human machine interface (HMI) using HTML or even XML application, I believed that
this would not have contributed to an innovation solution as several off-the-shelf
application are available to achieve the end state. Furthermore, due to complexity and
sensitivity of the SMART system, it was decided to give only minimum access or one-way
submission access to teachers to SMART. This was accomplished by Cisco VoIP phones,
where individual IP addresses were given data retrieval rights in addition to successful
teachers logging process. Only submit right was awarded to teachers after secure
authentication. This mechanism was programmed in a Cisco Call Manager® and a web
server. Section six and following sections explains this mechanism.
BHI is Cisco Systems®, Apple® and Microsoft® academy training centre and hence, all
class rooms have different computer systems with distinctively different hardware profiles.
To add a newer application to work on both MAC and PC architectures will further
complicate existing network systems. Furthermore, quite a few class rooms are isolated
from production network due to delivery of advanced network systems courses. Therefore
recording attendance using Cisco VoIP phones installed in all classrooms makes obvious
decision.
The VoIP SARRA application was proposed with a view to replace the current process of
student attendance recording system at BHI. The application shall provide functionality for
teachers and administrators to view scheduled classes for the day on Cisco VoIP phone
(installed in every classroom) and to update the class attendance via a user friendly
87
interface. The final implementation of the application into the BHI environment aims to
adequately meet its needs to,
more efficient service for teachers and students to record attendance;
reduce cost – they will be redeemed through a more efficient solution;
enable more up-to-date data obtained from the system; and
real time reporting of class roll information.
These criteria will be met by replacing the current, lengthy and manual system that is in
place throughout BHI’s campuses with the VoIP SARRA application and data entry
system. VoIP SARRA interfaces with an existing and in-house developed – SMART
database system.
6.4
Student Attendance Recording Process
6.4.1
Current Process
There are over three different processes in place for student’ attendance recording at BHI.
Each education department has its own requirements and procedures. These procedures
require significant manual work from teachers and administrators causing lengthy delays to
enter the data and sometimes it compromises data security and integrity. Two of these
procedures are detailed in figure 6-1 in form of a flow chart. It shows how administrators
perform large amounts of data entry manually and generate teaching rolls on a fortnightly
basis every semester.
TAFE education courses enrolment process is similar to the higher education enrolment
(degree courses) process at Universities. For example, TAFE teachers create their own
rolls and as such variations on the standard roll. They are required to hand-in attendance
sheets every semester, whereas on the other hand, degree teachers do not create their own
roll books and hand in their completed attendance sheets at the end of each teaching
periods or semesters.
Issues were identified of possible human error, data loss, security and integrity in manual
processes. Having a paper based system for storing of data either temporarily prior to entry
88
into electronic database or permanently in file storage poses risks of data being lost or
compromised by unauthorised third parties.
An extended time period between two weeks and four weeks before data is required to be
submitted to office staff for manual entry provides teaching staff with the ability to alter
data after the date of the class and compromises data integrity. It also means that there is a
significant delay for teachers and staff to access this data from the SMART database for
routine administration purpose.
Degree
Students
Administration staff
generate paper roll for
all subjects using
SMART
Administration staff
generate paper roll for
all subjects using
SMART
Teaching staff
are provided
paper roll to mark
attendance
Teaching staff
are provided
paper roll to mark
attendance
Teachers take attendance
each class and mark
details on paper roll
Teachers take attendance
each class and mark
details on paper roll
Change
Change
Teaching staff
review all paper rolls
Teaching staff
review all paper rolls
Submit
Change required to
Submit
Teachers give
completed class roll to
administration staff
Teachers give
completed class roll to
administration staff
International administration
staff enter attendance
details into electronic
database
Degree administration staff
file all paper roles in Filing
Cabinet
Student
Attendance
Data stored in
SMART
Student
Attendance
Data stored in
Filing Cabinet
attendance data
Figure 6-1 – Current Process
89
EACH SEMESTER
EACH FORTNIGHT
International
Students
6.4.2 Proposed Process
The VoIP SARRA application provides significant advantages over the existing student
attendance recording process at the BHI. The new process with VoIP SARRA is shown in
figure 6-2. VoIP SARRA acts as an immediate interface between the teacher and the
SMART database which stores all student attendance data. Because the application can be
run from any Cisco VoIP Phone within the institute the teaching staff can enter students
attendance for the class electronically and immediately during the class time. Teachers can
then choose to save their data and submit later that day. The setup of VoIP SARRA was
configured in a way that it only allows teachers to access the classes for the current day to
be edited to avoid teaching staff revising and further manipulating the data.
Process Occurs
Daily
Teaching staff take attendance
each class and enter into
Attendance Tracker Application
on IP Phone in classroom & save
Data
Complete?
No
Teaching staff daily review
attendance data on IP Phone
Yes
Teaching staff submit attendance
data on IP phone to SMART
database
Student
Attendance
Data stored in
SMART
Administration staff manually
enter attendance data into
SMART Database
Change required to
attendance data
Figure 6-2 – Proposed Process
Any further changes to the submitted data can only be changed by the administrator or a
system administrator. Electronic storing of all data means it is more space efficient storage
90
of data and less chance that the data can be compromised or lost provided backup of
electronic data should take place on a regular basis.
6.5
Application Prototype
Significant amount of work was completed during 2007 in order to have the VoIP SARRA
application ready for the demonstration. The tasks that were carried out for the prototype
stage were,
a completed prototype application VoIP SARRA for Cisco VoIP Phones;
an in-depth research and documentation pertaining to selection of an
appropriate development software and programming language;
the development and testing of the application;
develop the application’s main functions in association with a mirror SMART
database, thus avoiding any interruption to production SMART database; and
provide a regular project progress, project and management reports in the form
of presentations, meeting minutes and documentation.
Using mirrored SMART database the prototype application provided the following
functions,
teacher login;
class selection from classes scheduled for that day for the logged in teacher;
display class lists with student ID;
attendance recording for students in selected class;
saving of class attendance data to dummy database (updateable within the same
day of attendance taken);
submission of final class attendance data to replica SMART database;
integration with Cisco Call Manager Emulator; and
tested and verified compatibility with Cisco phones; 7940, 7960, 7970 & Cisco
Communicator Softphone and basic help files.
91
The functionality not provided in the initial prototype, but to be provided in the final
release were,
the ability to select between different types of department within BHI, i.e.
Vocational Education and Training (VET) and Higher Education Programs
(HEP);
complete testing integration with production SMART database;
integration with production Cisco Call Manager server;
VoIP SARRA production server consisting application and web server
environments;
complete installation instructions and administrator/user training;
ability for administrators to manually adjust data through PC web interface; and
reporting tools via web interface.
6.6
System Architecture
6.6.1
Design Overview
The application prototype of VoIP SARRA utilises many different technologies including
Voice over IP hardware and applications. The basic physical components used to build the
application are,
Web Server,
Cisco Call Manager Server,
Cisco IP Phones, and
Database Server
Database Server
CISCO IP PHONE
7970 SERIES
Web Server
(Attendance Tracker Application)
Internal Network
1
2
ABC
4
GHI
5
JKL
3
DEF
?
6
MNO
+
8
9
PQRS
TUV
WXYZ
*
7
0
OPER
#
Cisco IP Phone
User
Cisco Call Manager
Figure 6-3 – Application design overview
92
The VoIP SARRA coding is stored on a web server. When initiated it sends and receives
HTTP to and from the phone. The phone receives its services menu and points to the web
server via a Trivial File Transfer Protocol (TFTP) configuration file retrieved from the
Cisco Call Manager which handles all of the phones call functionality. The web server
retrieves information and writes information to the mirror SMART database server. Figure
6-3 shows how this system interacts at the basic physical level.
6.6.2
Cisco VoIP Phones and there Comparison
As previously mentioned, the VoIP SARRA application uses the Cisco IP Phone digital
display as its output to the user. The Application runs on 79XX series Cisco models i.e.
7940/7960/7970. Table 6-1 depicts their comparison.
Model 7906 is a basic phone and have four buttons and a single line black and white
display. This model was not selected due to limited display and was not programmable.
Cisco Communicator is programmable, touch screen, mouse clickable, Internet ready, six
line displays with buttons. This model is a top of the range and expensive product and used
mainly by executives, thus not chosen. Model 7970 are less expensive and have almost all
functionality like Cisco Communicator but BHI did not install this model in classrooms.
Model 7970 were mainly used by executive management and managers, thus not selected
for testing and prototyping. However, codes developed for the VoIP SARRA with minor
changes in existing codes can be executed on this model. Finally, models 7940 and 7960
were selected for the trials due to installed separately in majority of classrooms, both are
we bit expensive than the basic model 7906. However, 7940 and 7960 are programmable
and have two and six lines of black and white displaying capacity respectively. The only
difference between 7940 and 7960 is the number of vertical side buttons. All models of
phone utilises the following protocols as shown in figure 6-4, of which HTTP was only
focused,
HTTP – Communication between phone and web server
RTP (Real-Time Transport Protocol) – Sends voice packets to and from the
phone
Skinny Client Control Protocol (SCCP) – Communication with Call Manager
93
Table 6-1 – Comparison of selected Cisco VoIP Phones for Application Development
Phone Model
No
7940
Brief
Picture
Description
Standard
Black and
White
2 lines
display
with button
7960
7970
Cisco
Communicator
7906
Compatibility
Status
Yes – Tested
Standard
Black and
White
6 line
display
with button
Yes – Tested
Colour
Touch
screen
6 line
display
with button
Yes – Tested
Software
Phone
Colour
Mouse
Clickable
screen
6 line
display
with
buttons
Yes – Tested
Black and
White
1 line
display
No
94
Figure 6-4 – Phone Protocols [72]
The 7940/7960 phones can display images on the screen, but they must first be converted
to binary pairs and then hexadecimal digits. A program is supplied with the Software
Development Kit (SDK) from Cisco Inc., which converts any image in the correct format
to its hexadecimal equivalent which is called Channel Interface Processor (CIP) image. A
CIP image is essentially a plain ASCII text similar to hexadecimal characters. The image
must be black and white and a specified depth and width are depicted in figure 6-5.
Figure 6-5 – Cisco VoIP Phone Interface [72]
6.6.3
Cisco Call Manager
Cisco Call Manager® is a purpose built server on Windows® which controls the IP
Telephony system and its users. It is generally a Windows 2000 or UNIX based server
running the Call Manager application. Cisco Call Manager hardware was not used for the
prototype, instead an emulator software which performs the basic functions was used as
required by the Cisco IP phone. Emulators enable services usage such as TFTP file
95
download and services menu locations. Cisco Call Manager screen is shown in figure 6-6
below.
Staff login to the Cisco IP Phone in each classroom with a roaming profile which provides
them with their own customised services menu and other features. They can then enter the
student attendance from this interface. The VoIP SARRA application does not reside on
the Call Manager and if any services web applications were installed on the Call Manager
it could cause performance degradation on the server [73].
The Call Manager software allows us to configure a user or group of users with access to
particular services. A service relates to a menu item on the services menu which points to
an URL. Therefore services menu item can be assigned to point to the VoIP SARRA
application and have this viewable only by selected teaching staff (mainly coordinators).
Figure 6-6 – Cisco Call Manager configuration screen
To enable a phone to use the correct Call Manager or Cisco Emulator, the phone was
required to be configured to accept a Dynamic Host Configuration Protocol (DHCP) IP
96
Address and then enable alternate TFTP server and configure the TFTP server address with
the IP Address of your Cisco Call Manager (CCM) or Call Manager Simulator (CMSim).
The CCM or CMSim then sends the phone a TFTP configuration file which tells it where
to point to for the services menu and ultimately the VoIP SARRA application on the web
server.
6.6.4
Application and Web Server
The application is required to be installed onto a web server with specific parameters
configured relating to the application. This may or may not be shared with other web
applications, although preferably VoIP SARRA should be the only application on the web
server.
The web application must be installed in its own virtual web page to prevent it from
conflicting with any other web applications that may be running on the same server [60].
The web application can be reached through a normal web browser or the phone, for
example by navigating to,
http://<servername>/<directory>/splash.ASPX
Although, high traffic load testing was not performed, it is safe to say that the application
is not particularly resource hungry. The application will run on any server or PC
compatible with Windows Server or Windows XP Operating systems. The application has
been tested to run on both Windows 2003 server and Windows XP. The required
components are listed in table 6-2.
Table 6-2 – Server Software Requirements
Required Applications
Version
ASP.NET
2.0
VB.NET
2.0
.NET Framework
2.0
Cisco SDK
NA
IIS (Internet Information Services)
4.0 or above
97
6.7
The Application – VoIP SARRA
The VoIP SARRA has been programmed using a combination of Visual Basic, ASPX and
XML utilising the .NET framework. An ASP page is essentially a HTML webpage which
contains server side scripts. The web server processes the scripts prior to sending data to
the client (Cisco IP Phone) [77].
XML is transported over HTTP to provide the Cisco IP Phone with the information
required to display the web application pages on the screen. This allows Cisco IP Phone
items such as menus, pictures and input boxes to be displayed for the user. Figure 6-7
shows how the whole system interacts with sub-systems and applications.
SMART DATABASE
WEB SERVER
ASP.NET
VB.NET
IIS
DB CONNECTION
Oracle SQL
Database
ODBC
XM
CALL MANAGER SERVER
L
UR
L
RE
SP
ON
SE
RE
QU
ES
T
RETRIEVE & INPUT DATA
TFTP FILE
CONFIG REQUEST
Cisco Communicator
(Softphone)
Figure 6-7 – Application Data/Msg flow
6.7.1
XML
Extensible Mark-up Language (XML) builds on the basic structure of HTML, but is a
language in its own right. It was created by the W3C (World Wide Web consortium) to
improve and enhance HTML past its current capabilities [78]. There are quite a few
software applications and networking protocols utilised to deliver information from the
database to the phone via the web application. The web server runs the VB code within the
98
ASPX webpage. XML is generated from the ASPX/VB code and is essentially what is sent
to the phone as a dynamically generated XML file. Figure 6-8 illustrates an example of
XML code as received by a web browser.
XML and HTML are both tag based although HTML tags are predefined (~100 tags) and
XML tags are completely customisable and has none predefined. XML provides access to
web pages and similar content without the high intensive overhead that html has [78].
Figure 6-8 – XML Coding
The Cisco IP Phones only understand predefined XML objects which are developed by
Cisco and will return an error if the data it receives is not in the correct format. It is
important that the following code is included in each ASPX.vb file so that the phone
knows what kind of content to expect and is sent in the HTTP header.
Response.ContentType = "text/XML" [72]
6.7.2
VB.NET
Visual Basic .NET (VB.NET) is an object-oriented computer language and is the recent
version of Microsoft’s Visual Basic® [79]. It is commonly known as Rapid Application
99
Development (RAD) programming language [80]. This language was selected due to its
strengths when combined with ASP.NET/Open Database Connection (ODBC) [80],
compatibility with the chosen hardware, software and database systems and product
availability. VB.NET’s was also considered with regards to ease of programming for
beginners.
Considering the code for VoIP SARRA is written in VB.NET and XML; outputs is
dynamically created and send to the client i.e. Cisco IP phone. The in-depth application
logic is handled from VB.NET and connections to the database are managed via ODBC
framework.
6.7.3
HTTP
Hyper Text Transfer Protocol (HTTP) is the protocol used to send messages between the
phone and the web server.
The phone requests the next URL and the server responds with the URL data. Figure 6-9
shows the interaction between the web server and the phone via HTTP request and
response.
Cisco IP Phone
Executes Code &
displays
R e sp o
Requ
n se XM
L
filenam
erhost/
rv
e
/s
:/
tp
est: htt
e.aspx
Web Server
(Attendance Tracker Application)
Figure 6-9 – HTTP Response & Request
The HTTP request consists of: either a GET or POST method and also describes the client
and its HTTP abilities, i.e. version of HTTP supported. The HTTP response consists of
information about the web server and the content type that is it submitting to the client.
The header also includes the length of the response.
100
6.7.4
Database
The database that was used for the development was a replica version of the SMART
database. The SMART database runs is deployed on Oracle database version 9.0i.
Application uses ODBC protocol to connect with the SMART database. The VoIP SARRA
application connects to the database by passing the username and password as input by the
user on the phone interface. Teachers are given read only access to the database and as
such are not able to modify data after they have submitted it to the system.
Start
1. Take Attendance
2. Update Attendance
3. Submit Attendance
Take Attendance
1
Default menu (with
option for attendance
record)
Student
Status
3
Store into
temp table
1. Student1 [ ]
2. Student2 [ ]
3. Student3 [ ]
4. Student4 [ ]
Display
Splash screen
Submit
Attendance
Get Data from
temp table
When complete
Clear Data from
Both temp table
1. Login
1. User Name
2. Password
1. Class 1 (Tuesday
13/03/07) 12:30)
2. Class 2 (Friday
16/03/07) 09:00)
Update Attendance
2
clear Data
from
temp table 2
Figure 6-10 – Database Logic
101
Student
Status
Store into
temp table 2
1. Student1 [P]
2. Student2 [L]
3. Student3 [E]
4. Student4 [A]
When complete
Teachers are able to save attendance data prior to final submission but must submit same
day. Database logic and SQL Database are shown at figure 6-10 and 6-11 respectively.
Figure 6-11 – SQL Database
6.8
Development Environment
Development environment was created with the view to being a portable environment that
all programmers involved in the project could use at home or at BHI or at work to
maximise the flexibility for ease of development. As all stakeholders had laptops, the
development task was carried out independent of location.
Cisco Softphone Communicator was used such that testing of developed application
without the need of the actual hardware phone itself can be done. This proved a very good
idea and incorporation of physical phone was not required until the final phase of the
demonstration of the solution. A couple of trials on Softphone were all that was needed in
order to run the application on the physical phone. By using two laptops (namely A and B)
different types of environments were created on each, this means that all stakeholders in
turn tested the compatibility of the application and related components on two different
systems. Cisco Communicator Softphone shared the host PC’s IP address and a separate
Dynamic Host Configuration Protocol (DHCP) for physical phones (7940, 7960 & 7970).
102
This required that a DHCP server be setup in order for phones to obtain a dynamic IP
address. In the development and testing phases, VMware® running Windows2000 Server®
with DHCP server enabled was used.
LAPTOP – Windows XP
VMWARE – Win 2K Server
Web Application
Cisco Communicator
(Softphone)
Database
CMsim
Microsoft Visual Web Developer 2005
Development Application
Figure 6-12 – Laptop – A configurations
LAPTOP – Windows XP
Web Application
Database
Cisco Communicator
(Softphone)
CMsim
Microsoft Visual Web Developer 2005
Development Application
Figure 6-13 – Laptop – B configurations
Laptop A setup contained a VMware image with Windows 2000 Server installed running
the web application, the Oracle database and CMSim. VMware is very useful because you
can easily make backups of the image and transport from one VMware client to another. A
hub was required with Laptop A setup when connecting a physical phone due to the
VMware program running on the laptop requiring an Ethernet port. Visual representation is
depicted in figure 6-12. Laptop B setup contain web application, database, CMSim®, Cisco
Softphone® and Microsoft Visual Web Developer 2005® components on the one operating
103
system, Windows XP® with web server functions enabled. Laptop B configuration is
illustrated in figure 6-13.
Generally, an emulator is a piece of hardware used for tests; it is self-contained, and is able
to be hooked to some kind of development environment whereas a simulator is a piece of
software that duplicates as precisely as possible the processor so anybody can “run” codes
to see if it is correct. Usually simulators are developed for new architectures to test them
out before it is committed to silicon. Occasionally, a vendor will let customer have access
to the simulator to help speed development for that architecture. Due to the mobile and
compact development environment, it was decided to use Cisco Call Manager Emulator®
and CMSim, to provide the call manager functions to the phones rather than a real call
manager server or call manager express running on a router. This meant that a small
application can be run from any of the computers or VMware sessions which could send
the TFTP file to the phone with the service menu instructions included. The application is
included in the Cisco SDK which is downloadable from the Cisco Inc. website.
Figure 6-14 – Call Manager Emulator configuration screen
The application main interface is show in figure 6-14. The phone devices which are
connected to the CMSim are usually listed in the left pane and any device information
retrieved from the device is listed on the right (Type, State, IP Address etc) pane. The
name of the CM Name where the CMSim is running, in this case is the name of
Laptop
A. When configuring the phone for the emulator you insert the CM IP, Laptop A’s IP
104
address in as the TFTP Server address. You can disconnect devices, soft reset and hard
reset them from this interface.
6.9
Project Constraints and Limitations
Due to number of constraints, there were few limitations during development of VoIP
SARRA. The implementation environment at the BHI, both technical and procedural has
significantly influenced the progressive decisions made with regards to the application
development and technologies used. Some limitations were purely due to Cisco VoIP
phone hardware and some limitation rose mainly due to software coding limitations.
6.9.1
Constraints
Constraints for the project were,
6.9.2
BHI’s current student attendance procedure;
BHI’s proposed future Attendance Policy and Procedure;
application requirements from BHI Staff;
state of BHI’s hardware and software systems including database integration;
time restrictions;
procurement cost;
Cisco VoIP Phone software and hardware limitations; and
level of technical knowledge of project stake holders.
Limitations
Cisco IP Phones are engineered so that they understand a number of predefined XML
items. This type of static configuration makes most coding tasks much simpler as the
objects are predefined and it’s just a matter of programming the VB.NET code around the
dynamic data would be preferred to display on the phone. On the other hand this can be a
setback for customised applications as it restricts the usage of only predefined XML
objects and set parameters.
When developing the code for the student list and to enter attendance screens, it was found
that only up to maximum of five menu items per screen were available. This meant that the
105
teachers would need to scroll the interface as well as it would need to have something like
a “next page” function and split the total enrolled students in the subject across multiple
screens. Two options of the screens were created to evaluate the ease of use using focus
group consisted of three teachers and two administrators.
6.9.3
Development of Options Due to Limitations
Option 1 (Figures 6-15 and 6-16) is the preferred option, uses an XML object as an input
and provide with an easy way to interface the phone and a one-step data submission
approach. The user would enter the attendance value for each student using the phone
number pad and then press the submit button to move to the next screen.
When the submit button is pressed the data is sent in HTTP:Request to the web server with
the entered variables and the request for the next page. The web server then sends the
requested next page back to the phone as HTTP:Response. It was found from the focus
group consisting of few teachers that this method was simple and easy to navigate for the
user.
Figure 6-15 – Preferred Class List Screen
' CALL A FUNCTION TO GET THE DATA OUT OF THE DB
Response.Write(RS2XML(dReader, "InputItem"))
' CONTINUE THE OUTPUT TO THE PHONE
Response.Write("<SoftKeyItem>" + Environment.NewLine())
Response.Write("<Name>Submit</Name>" + Environment.NewLine())
106
Response.Write("<URL>SoftKey:Submit</URL>" +
Environment.NewLine())
Response.Write("<Position>1</Position>" +
Response.Write("</SoftKeyItem>" + Environment.NewLine())
Response.Write("<SoftKeyItem>" + Environment.NewLine())
Response.Write("<Name>Clear</Name>" + Environment.NewLine())
Response.Write("<URL>SoftKey:<<</URL>" +
Environment.NewLine())
Response.Write("<Position>2</Position>" + Environment.NewLine())
Response.Write("</SoftKeyItem>" + Environment.NewLine())
Response.Write("<SoftKeyItem>" + Environment.NewLine())
Response.Write("<Name>Back</Name>" + Environment.NewLine())
Response.Write("<URL>http://192.168.57.10/SelectDBInput.aspx</URL
>" + Environment.NewLine())
Response.Write("<Position>3</Position>" + Environment.NewLine())
Figure 6-16 – Preferred Class List Code
Option 2 (Figures 6-17 and 6-18) uses an icon menu XML object, which an user can
update via a two steps process involving selection of a student and then selection of an
attendance value by updating the page with new icons. This method involves the phone
and web server sending requests and responses for each student rather than each page of
students and therefore could increase traffic load on the web server and the network.
Figure 6-17 – Alternative Class List Screen
dim i as integer
Response.Write("<CiscoIPPhoneIconMenu>" +
Environment.NewLine())
Response.Write("<Title>Class: " & classname & "</Title>" +
Environment.NewLine())
107
Response.Write("<Prompt>Select Student and Attendance</Prompt>" +
Environment.NewLine())
For i = 0 To studentcount Step 1
Response.Write("<MenuItem>" + Environment.NewLine())
Response.Write("<IconIndex>" & iconindexnum(i) & "</IconIndex>" +
Environment.NewLine())Response.Write("<Name>" & studentname(i) &
"</Name>" + Environment.NewLine())
Response.Write("<URL></URL>" + Environment.NewLine())
Response.Write("</MenuItem>" + Environment.NewLine())
Next i
'Icons
' 0 = Absent
' 1 = Present
' 2 = Late
Response.Write("<IconItem>" + Environment.NewLine())
Response.Write("<Index>0</Index>" + Environment.NewLine())
Response.Write("<Height>8</Height>" + Environment.NewLine())
Response.Write("<Width>4</Width>" + Environment.NewLine())
Response.Write("<Depth>2</Depth>" + Environment.NewLine())
Response.Write("<Data>FFFFFFFFFFFFFFFF</Data>" +
Environment.NewLine())
Response.Write("</IconItem>" + Environment.NewLine())
Response.Write("<IconItem>" + Environment.NewLine())
Response.Write("<Index>1</Index>" + Environment.NewLine())
Response.Write("<Height>8</Height>" + Environment.NewLine())
Response.Write("<Width>4</Width>" + Environment.NewLine())
Response.Write("<Depth>2</Depth>" + Environment.NewLine())
Response.Write("<Data>FFFFFFFF00000000</Data>" +
Environment.NewLine())
Response.Write("</IconItem>" + Environment.NewLine())
Response.Write("<IconItem>" + Environment.NewLine())
Response.Write("<Index>2</Index>" + Environment.NewLine())
Response.Write("<Height>8</Height>" + Environment.NewLine())
Response.Write("<Width>4</Width>" + Environment.NewLine())
Response.Write("<Depth>2</Depth>" + Environment.NewLine())
Response.Write("<Data>0000FFFFFFFF0000</Data>" +
Environment.NewLine())
Response.Write("</IconItem>" + Environment.NewLine())
Figure 6-18 – Alternative Class List Code
6.9.4
Preferred Option
Option 1 was preferred because the feedback received from the focus group preferred this
option was favoured by teachers compared with Option 2. Option 1 was realistic, simple
and easy to navigate. It only requires using horizontal buttons for navigation, selection and
data entry whereas, Option 2 requires use of both horizontal and vertical buttons. Based on
this decision, VoIP SARRA application functional diagram is shown in figure 6-19 below.
108
Figure 6-19 – VoIP SARRA Application Functional Diagram
6.10
Evaluation
From BHI management’s perspective this application is an efficient solution due to the
observations recorded during an informal evaluation carried out over a semester (12
weeks) in a class of third semester computer systems degree.
Considerable administrative overhead was reduced due to administrative staff avoiding
time spent entering or retrieving data from paper based attendance to SMART. During
paper based/hard copy attendance records retrieved from frequent visits to the record room,
resulting in delay. In some cases, attendance sheets were missing from the records and later
were found with the teaching staff. In this case, enquiry handling staff had to call back to
parents with the response. With the VoIP SARRA, SMART provided the queried data on
demand while parents enquiring in a real time (on phone or in person). Thus provide an
expedient customer service. An average reduction of almost two hours per week per
administrative staff for work processes related to attendance recording was noted. In total,
two hours were reduced per week (considering one EFT administrative staff dedicated for
109
degree student service). For BHI this is considerable amount of time saving per
administrative staff. Attendance record is sent electronically to parents’ email ID on
consent provided by a student however; this feature was not trialled due to legal issues.
Teaching and management staffs can query SMART during an audit without relying on
administrative staff to reproduce paper based attendance records. Mandatory reporting of
attendance records to external agencies was made simple and easy due using one of the
features of the VoIP SARRA which sends queried period of attendance by the BHI’s
Registrar to requesting agency via web interface.
Comparison was made between same students of the third semester who were in second
semester previously. Total class size was 18 students in both semesters of 24 contact hours
each. During comparison between paper based records (i.e. second semester) and
electronic records (i.e. third semester), it was found that an average weekly attendance
increased between minimum of 5.6% to a maximum of 33.4%. During the third semester,
there were few varied and exceptional circumstances which involved couple of students
faced welfare issues. These resulted in their absence in lectures, labs and tutorials for few
consecutive weeks. Those weeks were not compared in this evaluation. Consideration of
public holidays was given. This comparison was for teaching period only, assessment
period of two weeks at the end of the semester was not considered. Some of the students
were curious to know the new system and after understanding the VoIP SARRA, they took
keen interest in proposing their own creative ideas to further develop the VoIP SARRA.
Complete sources codes for the VoIP SARRA system is provided at
6.11
Appendix B.
Lessons Learned
This project was completed covering all statement of work, on time and well under budget.
The project cost was approximately $10,000. Throughout this project, there seems to be no
shortage of enthusiastic suggestions emanating from the members of the team and students
of BHI. There was lot of consideration and respect for opinion within the group that
allowed each team member’s idea to be explored in detail. One of the things that have gone
right was communication between team members whenever there were meetings among
stakeholders. The team learned from the beginning that there are going to be a lot of
aspects of the project that will not be completed immediately with the existing skills set.
110
With this in mind, the team had very effectively learned how to retrieve information
through their own research through books, magazines, the Internet and above all using selfinitiative. From a project manager’s perspective, I ensured that some of the more
fundamental documentation was agreed upon and delegated as tasks from the beginning.
Initially, I focused more on establishing the team and its roles and responsibilities for the
deliverables so that there would be a much more harmonious environment to move
forward.
6.12
Future Work
VoIP SARRA was developed using BHI degree students and staff, in kind contribution of
subject matter experts (SMEs) from Cisco Inc. and Microsoft Inc., so the development cost
was not a major constraint or consideration for VoIP SARRA. BHI is only one of the four
Super Cisco Academy Training Centres (Super CATC) in the World. BHI is also a
Microsoft Academy® and the first Apple Academy® in Australia. All hardware and
software used for the application development were donated by the Cisco Systems®. and
the Microsoft®. If similar solution was to be developed commercially then the development
cost is estimated to be between AUD 100K and AUD 150K. Due to these reasons, VoIP
SARRA makes a cost effective solution for the institute.
A basic interface for models 7940 and 7960 were trialled in this project. In future, it is
planned to add full support for the 7970 VoIP phone by utilising all of the extra features
such as graphical interface and touch screen inputs. It is also envisaged to develop this
product for commercial purpose so that an inbuilt phone model recogniser with alternate
code depending on which ever Cisco phone model being used will identify connected
phone model and use determined sets of codes accordingly for successful interface. This
will give flexibility to use any Cisco VoIP phone models and hence will be advantageous.
Full load testing is also planned. Furthermore, there is a potential for creating additional
reporting tools using VoIP SARRA and back-end database systems. User manuals for
teachers and maintenance manuals for administrators are planned.
111
6.13
Conclusions
The implementation result after evaluation period of VoIP SARRA has been successful
and demonstrated that innovative applications can be developed and implemented in an
education environment to make student attendance data readily available which saves time
and resources. From the evaluation, I conclude that the BHI is a better place for improved
and modern record keeping facility.
The VoIP SARRA project was successfully built and demonstrated to satisfy BHI’s
management with its requirements and to provide a novel solution by amalgamation of low
cost and readily available emerging technologies. It was planned that in late 2008, BHI’s
Information System Advisory Committee will roll out a project to integrate VoIP SARRA
at Institute wide in live production environment with other systems currently in use.
Many issues and restrictions were encountered and surfaced during the execution of the
project and the team learnt several lessons. The team can use new information discovered
in future commercial development of the VoIP SARRA. Although the project was
challenging and frustrating at times, the team enjoyed challenges and became more
determined to complete this project creatively and effectively. The VoIP SARRA is
dependent on Cisco VoIP Call Manager® and Cisco VoIP Phones® as it was developed
considering the hardware as a primary constraint and the software as a secondary
constraint.
112
Chapter 7
Design and Development of a New Three Layered MAC Architecture for
the NEXT GEN Mobile Terminals for the Aricent Group (2007-2009)
7.1
Introduction
Gradual shift towards all IP based communication architecture will require end-to-end
packet communication and supporting Quality of Service (QoS) in 4G Mobile Networks
will be a major challenge due to varying bit rates, channel characteristics, bandwidth
allocation and handover support among heterogeneous wireless networks. Although there
are no robust specifications for 4G systems yet, it is clear that 4G will support higher data
rates than 3G and data rates are expected to reach up to 100 Mbps on a downlink and
20
Mbps on an uplink. Several 4G/3G Network architectures have been proposed in various
research papers [81 – 91]. Review of this architecture has identified scope for improvement
in the key areas of new protocol with more focus on mobility, resource QoS management.
In this chapter, the approach is towards identifying a new software protocol for the Mobile
Terminal. One of the new protocols identified in the 4G mobile terminal, the Packet
Switching Medium Access Control (MAC) protocol is to achieve efficient multiplexing
such that 4G mobile could satisfy different QoS requirements for different services. The
following functionalities are addressed:
provide simultaneous & multiple service activation for real-time and non-real-time
applications;
end-to-end QoS management under varying network conditions; and
to ensure efficient radio resource management when various types of services coexist.
7.2
Proposed New NEXT GEN MAC Layer
A new MAC layer for the NEXT GEN Mobile Terminal is proposed to overcome some of
the challenges being faced currently in the wireless networks as shown in figure 7-1.
113
Figure 7-1 – Challenges and related solutions in the proposed MAC architecture
The main objectives of the proposed 4G MAC layer are listed below:
to support high-speed data transmission of up to 20 Mbps on UPLINK and
100Mbps on Downlink;
to ensure high reliability and high efficient data transmission to provide high data
throughput;
to provide efficient transport of heterogeneous traffic supporting QoS for various
applications;
to provide efficient packet transmission methodology and effective radio resource
strategy for ensuring better QoS for multimedia traffic flow;
to provide delay and bandwidth guarantees for various kinds of applications;
to maintain fairness among various traffic flows based on priority;
enhanced mobility management;
on-demand bandwidth management; and
enhanced security.
Based on the objectives shown above, the proposed NEXT GEN MAC Layer has been
divided in to three major sub-layers as shown in figure 7-2. They are, Mobility
114
Management Sub-layer, Resource Management Sub-layer and QoS Management Sublayer.
Figure 7-2 – Proposed new NEXT GEN MAC Layer
Proposed MAC layer maintains interaction internally with mobility management, resource
management and QoS management sub layers as shown in figure 7-2. The functionalities
carried out by these sub-layers include, location management; handover management;
paging support; profile management; authentication; resource negotiation; cell discovery &
selection and end-to-end QoS provisioning of real-time and non-real-time data. The
functionalities provided by each sub-layers are briefly described below:
7.3
Mobility Management Sub-layer
Mobility Management is one of the essential functions that support roaming users with
mobile terminals to enjoy their services through wireless networks when they are roaming
into a new service area. Mobility management contains two major related components,
location management and handoff management. The former concerns how to locate a
mobile node, track its movement and update the location information while the latter
115
focuses mostly on the control of the change of the mobile node’s access point during active
data transmission. The functionalities of Mobility Management Sub-layer are,
Location Management, supports services like location registration, location paging and
location update procedure. Location management includes locating roaming terminals
in order to deliver data packets despite the fact that their locations may change from
time to time. The essence of location management is constituted by the mechanism for
mapping the name of the mobile node to its IP address. Operations of location
management include,
o Location Registration, also known as location update or tracking i.e. the procedure
that the network informs the mobile node through special messages by including
the location information entries stored in some databases in the networks.
o Location Paging, also known as location searching. In most cases, location
information is stored in databases and is only the approximate position of a mobile
device. Location paging is then the procedure that when calls/packets need to be
delivered to the target mobile device, the network tries to find the mobile devices
exact locality.
Node Discovery & Selection, synchronises with the network, MAC initiates the
selection process with the desired base station. The process has been divided into
channel synchronisation, authentication message exchange, registration, and smooth
connectivity. Upon completion of the network selection process, the MAC layer creates
one or more service flows to send data to the Base Station based on the trigger from the
application layer.
Profile Management, stores mobile terminal profiles and application profiles. Static
profile holds information that does not change very often and includes mobile terminal
profiles, applications and its QoS requirements. Dynamic profile holds information
such as current QoS network parameters like bandwidth, delay, jitter, packet loss and
throughput.
116
Handover Management, controls the change of mobile terminals attachment to a
foreign network in order to maintain connection with the moving terminal during active
data transmission. Operations of Handover Management include,
o Handover Triggering, initiates handover process according to conditions which
includes signal strength deterioration, bandwidth decrease or insufficiency, new
better connection available, cost and quality trade-off, flow stream characteristic,
network topology change, etc., Triggering may even happen according to a user’s
explicit control.
o Fast Handover, should be quick enough in order to ensure that the mobile node can
receive data packets at its new location within a reasonable time interval and to
reduce the packet delay as much as possible. This is extremely important for realtime services.
o Seamless Handover, should minimise the packet loss rate to zero or near zero. Fast
handoff and seamless handoff together sometimes referred to as smooth handover.
While the former concerns mainly packet delay, the later focus more on packet loss.
o Movement Detection and Prediction, i.e. mobile node’s movement between different
access points can be detected and predicted so that the next network that will soon
be visited is able to prepare well in advance and packets can even be delivered
before and/or during handoff simultaneously to the old attachment point.
o Handover Control, adopts different mechanisms for the handover control. Typical
example include, mobile controlled or network controlled, Layer 2 or Layer 3triggered handover.
o Packet Routing, changes the delivering route of the succeeding data to the new
connection path in the mobile terminal after the new connection has been
successfully established.
7.4
Resource Management Sub-layer
117
The MAC entity manages the Radio Resource by logically splitting it into two parts,
First portion of bandwidth, named, Radio Bearer (RB) is negotiated with the
network and, once allocated by the network, the MAC layer maps the QoS class
with respective RB.
Second portion of bandwidth, named Dynamic Bandwidth (DB) can dynamically
vary depending directly on the QoS for specific applications; this MAC Traffic
class is used to map the best effort class of the IP layer.
Resource management requires allocation/de-allocation of resources to sustain a
communication session. The allocation/de-allocation is carried out within the serving
domain and along the communication path between peer end terminals, before and during a
session. The functionalities provided by resource management in general and its sub-layers
are briefly described below:
Bandwidth Manager/Traffic Classification – Applications with very different
characteristics and network requirements compete for bounded network resources.
Often, the result is that critical transactional applications suffer unacceptable levels of
performance degradation during network congestion. However, bandwidth manager
enables users to allocate required bandwidth, thereby providing dramatic improvement
in throughput for critical data. Before bandwidth allocation can be performed, MAC
layer must identify the traffic that is travelling through it. This process is called traffic
classification and it has been categorised as Multimedia traffic, File transfer Traffic,
Web traffic, Interactive traffic and Best effort traffic. The details are explained in
section 7.2.3.1.3.
Resource Allocation, responsible for the Radio Resource, thus, generates bandwidth
requests to allocate RB for a specific traffic flows by reserving them. It performs
resource handling which is adaptive to amount of traffic. It controls and receives some
measurement parameters from the physical layer and performs control of the radio
resource by differentiating the service classes. Finally, it reports the measurement
results to the network.
Power Control, is based on the principle that a mobile has a concatenated uplink and
downlink phase, and that the transceiver will enter a low power-operating mode for the
118
remaining time. Although this strategy has a negative effect on the capacity of the
channel, it allows the mobile to turn the power off from the wireless interface for a
longer period. This choice was made since in a mobile multimedia environment, it is
more important that connections have a certain QoS than highest possible bandwidth.
Connection Re-establishment, is the process to generate connection between the mobile
terminal and the new cellular network. The main task of the operation relates to the
discovery and assignment of new network connection based on the handover strategy.
Security, Protocol should support performing accounting, authentication and
authorisation (AAA) services
7.5
QoS Management Sub-layer
The QoS management sub-layer establishes, maintains and releases wireless connections
between the base-station and the mobile and also provides support for handover and
mobility services. Multimedia networking requires at least a certain minimum QoS and
bandwidth allocation for satisfactory application performance. This minimum QoS
requirement has a wide dynamic range depending on the user’s quality expectations and
application usage modes.
A QoS management sub-layer receives transmission requests from the mobiles. The key to
providing QoS for these connections will be the scheduling algorithm that assigns the
bandwidth. The functionalities of QoS management sub-layer software module are traffic
& flow control, real-time traffic management, packet flow scheduling, radio link control
functionalities and QoS manager. The detailed explanation on all software modules is
provided in the following sub-sections.
7.5.1
QoS Manager
Applications contact the QoS manager when setting up a connection. The QoS manager
will inform the applications when they should adapt their data streams when the QoS of a
connection has changed significantly. Figure 7-3 conceptually illustrates the role of
adaptive applications in the QoS Management Sub-layer.
119
QoS
Negotiations
QoS
Initialization
QoS
Manager
Source
Application
QoS
Re-allocation
QoS
Change Request
Data
Flow
Sink
Application
External Events:
Channel Conditions/Buffer
Status
Figure 7-3 – QoS Management Sub-layer
The application requests a new connection for a certain service class that defines the media
type (e.g. video, audio, data), interactivity model (e.g. multimedia browsing,
videoconference), and various QoS traffic parameters (e.g. required bandwidth). The
service classes allow multimedia sessions to transparently adapt the quality of the
connection when the available resources change marginally without the need to further
specify details and without explicit renegotiations.
Network resource allocation is done in two phases. First, the QoS manager checks the
availability of resources on the base-stations coverage area at connection setup. The
necessary resources are estimated based on the required service. The new connection is
accepted if sufficient resources are estimated to be available for the connection to operate
within the service contract without affecting the service of other ongoing connections.
Otherwise, the connection is refused. Second, while the connection is in progress, dynamic
bandwidth allocation is performed to match the requirements of interactive traffic and the
available resources. When the available bandwidth changes (because congestion occurs, or
the error conditions change drastically), the QoS manager reallocates bandwidth among
connections to maintain the service of all ongoing connections within their service
contracts. The QoS manager located in QoS Management Sub-layer is configured
according to applications & network specific QoS requirements and resource availability.
The QoS manager module functionalities are briefly described below:
QoS Mapping: performs the function of automatic translation of QoS at different levels
of application requirements.
120
QoS Monitoring: allows tracking the ongoing QoS levels. QoS Monitoring function
compares the actual measured traffic against the agreed QoS profile so that the traffic is
handled appropriately. The measured traffic measures the actual burst rate and amount
of packets in the buffer against the CIR (Committed Information Rate) and PIR (Peak
Information Rate).
Flow Scheduling: manages the forwarding of flows in an integrated manner.
Flow Policing: observes or monitors whether the QoS required by a user is being
maintained or not.
Flow Synchronisation: requires controlling the precise timing of multimedia
interactions.
QoS Maintenance: compares the monitored QoS against the expected performance and
then performs tuning operations on resource modules to sustain the delivered QoS.
QoS Degradation: issues a QoS indication to the user by the QoS maintenance
mechanisms.
The mandatory parameters are monitored for ensuring better QoS for various applications
in the QoS Management sub-layer. They are as follows:
Throughput: is the amount of data transferred from one place to another, specifically
the bit rate that the connection can achieve.
Latency or Delay: is the amount of time it takes for a packet to travel from its source to
its destination
Jitter: is the delay variation experienced by data frames, with respect to the average
delay.
121
Frame Error Ratio (FER): is defined as the percentage of frames, with non-recovered
errors, with respect to the total frames received correctly. A frame is a service data unit
received by a high layer.
Bit Error Rate (BER): is the percentage of bits, with non-recovered errors, divided by
the total number of bits that have been transmitted, received or processed over a given
time period.
QoS Management consists of three tasks, Queue Management, MAC Management and
Scheduler.
7.5.1.1 Queue Management (QM)
QM deals with the length of packet queues, while scheduling algorithms determines which
packets to send next.
Figure 7-4 – Queue Management
The QoS Management solution is shown in figure 7-4 which employs different scheduling
algorithms in order to support the following service requirements:
Associate packets into service flow
Define QoS parameter for each service flow
Dynamically establish QoS-enabled service flows
Associate QoS service flow with logical connections
122
Define transmission ordering and scheduling on the air interface.
7.5.1.2 MAC Management
Software block as shown in figure 7-5 has the task of buffering the signalling packets and
forwarding them to the Physical layer depending on the signalling channel to be used (i.e.
common or dedicated).
Figure 7-5 – MAC Management Interface
The functionalities of MAC management are listed below,
maximum QoS for each type of application
subscriber preferences for certain services
preferred end-user QoS for each application
transmission capabilities (e.g. delay, bandwidth, jitter)
Information components transmitted on the uplink during connection request are,
terminal / source id and destination id
connection type and QoS information
payload length / data segment size
payload status
123
The MAC Manager handles establishment or release of connections requested by the upper
layer. In case of establishment, a new RB is created; state variables and timer values are
initialised according to the configuration setup. In case of release requested, all the relevant
protocol parameters, state variables and timers are released. The MAC manager also takes
care of communicating to network to get the IP address and other parameters to establish
IP connectivity during initialisation of the MAC Protocol.
7.5.1.2.1 Radio Link Control (RLC)
The RLC Protocol used is a Windows® based selective repeat Automatic Repeat Request
(ARQ) technique. The ARQ algorithm uses a selective retransmission technique using a
fixed window size. The RLC layer receives an acknowledgment after transmitting the
whole block of data. The ACK packet contains a flag bits to indicate whether a particular
packet transmission was successful or unsuccessful. Unsuccessful packets are retransmitted by appending those packets in the next data block. A retransmission timer is
used to compensate a lost ACK packet. Retransmission timer value is selected based on the
expected ACK packet arrival time. The RLC data flow diagram is shown in
6.
Figure 7-6 – Radio Link Control Data Flow Diagram
124
figure 7-
Figure 7-7 depicts the software architecture of the RLC Module considered for the 4G
MAC layer. Detail descriptions of each sub-component are explained below:
Figure 7-7 – Radio Link Control Software Architecture
7.5.1.2.1.1 Transmission Module (TX)
The TX Module performs the segmentation function where a single Service Data Unit
(SDU) is segmented into different Packet Data Unit (PDU). This module forms the
Layer 2 PDU from the SDU received from the upper layers and takes care of the data
transmission in uplink. The TX Module takes care of the functionalities like segmentation,
concatenation, padding, ciphering and multiplexing of PDU. They are briefly described
below:
Segmentation – Performs segmentation of variable-length higher layer SDU into
smaller RLC PDUs. This process is undertaken to allow efficient use of available
bandwidth relative to the QoS requirements of a connection service flow.
Concatenation – If the content of an RLC SDU does not fill an integer number of RLC
PDU, the first segment of the next RLC SDU may be put into the RLC PDU in
concatenation with the last segment of the previous RLC SDU.
125
Padding – When concatenation is not applicable and the remaining data to be
transmitted does not fill an entire RLC PDU of a given size, the remaining portion of
the data field shall be filled with padding bits.
Ciphering – When transmitting a MAC PDU on a connection that is mapped, the
sender shall perform encryption and authentication of the MAC PDU payload. When
receiving a MAC PDU on a mapped connection, the receiver shall perform decryption
and data authentication of the MAC PDU payload.
Multiplexing of PDUs – Preserves the order of higher layer PDUs that were submitted
for transfer by RLC using the acknowledged data transfer service. If this function is not
used, out-of-sequence delivery is provided.
Transfer of user data – Used for conveyance of data between users of RLC services.
RLC supports acknowledged, unacknowledged and transparent data transfer. Setting of
QoS controls transfer of user data.
Packing – The process of combining multiple MAC SDUs into a single MAC PDU. On
connections with variable length MAC SDU, Packed PDU contains a sub-header for
each packed SDU. On connections with fixed length MAC SDU, can save up to 10%
of system bandwidth.
Cyclic Redundancy Check (CRC) – The CRC covers the generic MAC header and the
Payload of the MAC PDU. The CRC shall be calculated after encryption; i.e. the CRC
protects the Generic Header and the ciphered Payload. A service flow may require that
a CRC be appended to each MAC PDU carrying data for that service flow.
Ciphering – Prevents unauthorized acquisition of data.
MAC Protocol Data Unit Formats – The MAC PDU is the data unit exchanged
between the MAC layers of the BS and the Mobile Terminals. A MAC PDU consists of
a fixed-length MAC header, a variable-length payload and CRC.
126
Transmission & Reception of MAC PDUs – Incoming MAC SDUs are formatted with
segmentation and/or packing, before being conveyed over one or more connections.
After traversing the air link, MAC PDUs are reconstructed back into the original MAC
SDUs so that the format modifications performed by the MAC layer protocol are
transparent to the receiving entity.
7.5.1.2.1.2 Configuration Module
The configuration request from Layer 3 is handled depending on the request from the
upper layer i.e. whether establishment, re-establishment, modification or release. The
configuration handler does the required configuration in the configuration table. In case of
establishment requested by Layer 3, State variables and Timer values are initialized
according to the specified parameters. In case of modification, all the protocol parameters
indicated are modified and rest of the state variables and timer values are kept intact. In
case of release requested by Layer 3, all the protocol parameters, state variables and timers
are released. Various parameters used in configuration module are,
Configuration Parameters Updation: Whenever upper layer posts a primitive for
initialization or termination of the entity, the Configuration database is updated.
Synchronisation/Initialization Procedure: Process of exchanging SYNC and ACK
control frames for synchronisation and initialisation.
Frame Formation: Formation of RLC frame according to the formats defined and
adding appropriate fields.
Frame Validation: Frames received are validated before further processing.
Control Unit Processing: Received control frames are handled in control unit.
4G Wireless terminals are envisioned to provide QoS guarantees and thus, the MAC layer
must efficiently evaluate the available resources and perform access in such a way that the
QoS requirements of applications and user are satisfied.
127
7.5.1.2.1.3 Receiver Module (RX)
The receiver module at the receiving side receives the PDU and forms the SDU. RX
performs the reassembly of PDU received in one Transmission Time Interval (TTI), SDU
formation, Duplication Detection and Error Detection by sequence number checks. They
are briefly described below:
Reassembly – If the segmented frames are received, the reassembly procedure is
performed before storing it in the re-sequencing buffer or delivering it to upper layer.
Error correction – Provides error correction by retransmission (for example, Selective
Repeat, Go Back N, or Stop-and-Wait ARQ) in acknowledged data transfer mode.
Duplicate detection – Detects duplicated received RLC PDU and ensures that the
resultant higher Layer PDU is delivered only once to the upper layer.
Flow control – Allows an RLC receiver to control the rate at which the peer RLC
transmitting entity may send information.
Sequence Number check (Unacknowledged data transfer mode) – Guarantees the
integrity of reassembled PDU and provides a mechanism for the detection of corrupted
RLC SDU through Sequence number checking in RLC PDU when they are
reassembled into a RLC SDU. A corrupted RLC SDU is discarded.
Decryption – When receiving a MAC PDU on a mapped connection, the receiver shall
perform decryption and data authentication of the MAC PDU payload.
ARQ Schemes – ARQ processing is the process of retransmitting MAC SDU blocks
(“ARQ blocks”) that have been lost or garbled. The 4G MAC uses a sliding window
based approach, where the transmitter can transmit up to a negotiated number of blocks
without receiving an acknowledgement. The receiver sends acknowledgement or
negative ACK messages to indicate to the transmitter, which SDU blocks have
successfully been received and lost. The transmitter retransmits blocks that were lost
128
and moves the sliding window forward when SDU blocks are acknowledged. The
Automatic Repeat Request (ARQ) protocol is used, consisting,
Positive acknowledgement – The destination returns a positive acknowledgement to
successfully received, error free PDU.
Retransmission after time-out – The source retransmits a PDU hat has not been
acknowledged after a predetermined amount of time.
Error detection – The receiver detects error (this function is actually performed by the
MAC layer) and discards damaged PDU, sending a negative acknowledgment to ask
the source to transmit again the PDU as shown in figure 7-8. Two kinds of ARQ are
used in the MAC Layer: stop-and-wait and Go-back-N.
Figure 7-8 – Actual Data Flow through IP
7.5.1.2.2
Buffer Management Module
The operation of RLC involves forming PDU from SDU at the transmitting side and
reassembly of the PDU into SDU at the receiving side.
The rate at which data is
transmitted may be less than the rate at which data is received. All these necessitate the use
of buffering. Various buffers used in the RLC entity operation are briefly explained below:
129
Control Buffer: All control related frames e.g. SYNC, NAK (Non-Acknowledgement)
are queued for transmission.
Re-Transmission Buffer: A copy of the transmitted frame is stored in the retransmission buffer to be used for retransmission.
SDU Buffer: This buffer holds the Data received from upper layer intended to be
processed by MAC sub-layer.
Re-sequencing Buffer: Frames received in the forward direction are stored in this buffer
to be re-sequenced and delivered to Upper layer.
NAK List: Non-Acknowledgement list consists of the frame sequence numbers for
which the retransmission has been requested. The NAK/Abort timer values are also
maintained in the list corresponding to each NAK control frame.
MAC/PHY Interface Buffer: Frames that are to be transmitted from MAC are put in the
MAC/PHY interface buffer.
7.5.2
Traffic and Flow Control Module
The main functionalities of traffic & flow control software modules are to support realtime traffic management in maintaining larger bandwidth and higher speed of operation.
This module identifies efficient packet transmission mechanism to provide flexible
wireless access schemes for multimedia services with reliable QoS assurance and provides
enough radio resources for a new multimedia request to ensure the QoS requirement
without degrading the service quality for current service.
130
Figure 7-9 – Traffic and Flow Control Module
The traffic and flow control module is shown in figure 7-9, classifies the traffic into five
separate classes. They are,
Multimedia traffic (QoS 1) – This traffic of application includes Multimedia streaming,
VoIP (Voice over Internet Protocol), teleconferencing and other multimedia traffic.
This class requires large bandwidth, small delay and jitter. High priority should be
given to this class and the bandwidth should be reserved when the application is
running.
File transfer traffic (QoS 2) – FTP application is a typical traffic flow example and this
requires large throughput. It is not sensitive to delay and delay jitter. This class should
be suppressed if it coexists with higher priority traffic.
Web traffic (QoS 3) – This class includes normal web browsing. It should not be overstarved by other traffic because active user interaction is involved. Hence a fair portion
of bandwidth should be reserved but the priority is assigned as not important.
Interactive traffic (QoS 4) – This class includes delay-sensitive traffic of applications
like e-mail access, games. It should be transmitted with minimal delay because of their
sensitive characteristic to round trip time (RTT).
131
Best-effort traffic (QoS 5) – This class is transmitted with best effort only. This service
is typically provided by the Internet today for Web surfing. The key parameters are
required are minimum reserved traffic rate and traffic priority.
7.5.3
Packet Flow Scheduling
In the NEXT GEN wireless terminals, multiple information flows with various QoS
requirements can be forwarded to the MAC layer at the same time. Due to various QoS
requirements, these flows can be served using different application types of traffic flows
that are most suitable for each flow. During the decision process, the decision block may
end up selecting a specific traffic class for multiple services. Since these services cannot be
interleaved into a single MAC frame, a QoS-based scheduler is used in order to guarantee
the QoS requirements of each flow. Scheduler schedules all traffic according to the QoS
requirements and tries to minimise the number of transitions the mobile has to make. It
schedules the traffic of a mobile such that all downlink and uplink connections are grouped
into packets taking into account the limitations imposed by the QoS of the connections. In
general there are three phases: uplink, downlink, and reservation.
The scheduler maintains two tables, a request and a schedule table. The request table
maintains several aspects of the current connections handled (like the connection type, the
connection queue size and status, the error state of the channel, the assigned bandwidth, the
requested reliability). The Scheduler is designed to maintain the admitted connections as
much as possible within the negotiated connection QoS parameters. The following
requirements are considered,
QoS Guarantee: The QoS requirements for each flow should guarantee throughout the
connection.
Channel Dependent Scheduling: If wireless channel conditions change throughout the
connection, scheduler should be able to adapt to these changes in order to provide
fairness to each traffic flow.
132
Dynamic Behaviour: If the number of traffic flows assigned may vary during the
course of scheduling, the scheduler has to be easily configurable to adapt to these
dynamic changes.
Delay: End-to-end delay of all packets received by the MAC and forwarded to the
higher layer.
Load: Total number of bits received from the higher layer. Packets arriving from the
higher layer are stored inside the MAC Layer buffer.
Throughput: Total number of bits sent to the higher layer from the MAC layer. The
data packets received at the physical layer are sent to the higher layer if they are
destined for this station.
Scheduling algorithm: Determines the transmission time for the packet in each queue to
provide QoS assurance, which will influence the delay of services. In order to address
the requirements of the scheduler in NG wireless terminals, Bin Sort Fair Queuing
(BSFQ) scheduler is proposed in order to accommodate the unique characteristics of
the wireless medium based on one of the ideas presented in [85].
7.6
Implementation Methodology
Generally, the MAC layer will be implemented as a single task in the operating system
used in the mobile terminal device and this section briefly explains about the additional
software handlers been required in terms of handling the messages from higher and lower
layers. The handlers required are Primitive Handler, Message Handler, Error Handler,
State Handler and Timer Expiry Handler as shown in figure 7-10. The functionalities of all
the handlers are briefly explained below:
Primitive Handler – For every signal received, there is a Primitive Handler. The
Primitive handler takes the MAC signals from the MAC queue. The Primitive Handlers
depending
on
the
state
invoke
the
respective
state
handlers.
If
say,
MAC_CONNECTION_REQ Primitive Handler is invoked then it will first decode the
133
message received. Depending on the message type the message handlers are invoked.
Also Timer Expiry Handler is invoked to maintain the timers present in each state.
Figure 7-10 – MAC Implementation Methodology
Message Handler – The Message Handler receives the decoded message from the
Primitive Handler. Depending upon message type, the respective procedures are
followed. The message handler first selects the entity for which message is received
after that depending upon the state, corresponding state handlers are invoked.
State Handlers – The primitive handlers, Timer Expiry Handlers and Message
Handlers invoke the state handlers. Each state handler calls a function corresponding to
that state and processes the signals. The outgoing messages are encoded in the message
encoder and state of the entity is updated.
Error Handler – runs procedures to handle abnormal cases. It also consist Error
Handling and recovering mechanisms for signals and messages received. Message
handlers, State handlers or Primitive Handlers can invoke Error Handling procedures.
Message Encoder and Decoder – will interpret the message received as byte array, and
put the various message elements into the proper structures as required by the
particular message, and vice versa.
134
Scheduler – is responsible for scheduling packets from traffic queues at mobile
terminal for transmission on channel. Bandwidth allocated to each mobile terminal for
uplink transmission must be properly allocated to various uplink flows so as to satisfy
the QoS requirement.
7.7
Dispatcher – will route the signal to respective queue depending upon the message.
Simulation and Results
Simulated MAC layer functionalities with Orthogonal Frequency Division Multiplexing
(OFDM) system and the block diagram used in simulations block diagram is shown in
figure 7-11. Conceptually the physical layer can be described in terms of upper and lower
physical layers. The upper physical layer includes scrambling, channel coding,
interleaving, and modulation to form data symbols while the lower physical layer maps the
data symbols to frequency bins and forms OFDM symbols.
Figures 7-11 and 7-12 provides simulation results of the data throughput. It is shown that
the achieved data rate of up to 15.26 Mbps on the Uplink and 71.28 Mbps on the Downlink
for specific modulation technique with frame duration of 1ms can be achieved.
Figure 7-11 – OFDM Physical Layer Model
135
To achieve the maximum data rate of 20 Mbps on the Uplink and 100 Mbps on the
Downlink, various analysis & simulations were performed with the help of MATLAB®
Simulation Tool using OFDM System.
Uplink
Higher Layer- PDU 1
MAC - PDU 1
PDU2
MAC - PDU 2
MAC - PDU ‘n’
MAC
Header
MAC - SDU 1
Transport channel
UL-SCH (1 ms)
MAC - SDU 2
MAC- SDU 3
Padding
Transport Block (MAC- PDU)
Layer 1
Data
transmitted
at 15.36
Mbps
Figure 7-12 – Simulation Result for Uplink
Downlink
Higher Layer- PDU 1
MAC - PDU 1
Transport channel
DL-SCH (1 ms)
Header
MAC - SDU 1
PDU2
MAC - PDU 2
MAC - SDU 2
MAC - PDU ‘n’
MAC - SDU 3
Padding
MAC
Transport Block (MAC- PDU)
Layer 1
Actual data at
71.28MBps
Received data at
61.46MBps
Figure 7-13 – Simulation Result for Downlink
136
Table 7-1 provides the simulation throughputs with respect to different modulation
techniques, bits per sub carrier, code rate and guard interval to achieve to minimum and
maximum date rate of NEXT GEN system.
Table 7-1 – Mode related OFDM Parameters for different Data Throughputs
Mode Modulation Bits per Subcarrier
1
2
3
4
5
6
7
8
9
10
11
12
13
14
15
BPSK
1
1
1
2
2
2
4
4
4
6
6
6
7
7
7
QPSK
16 QAM
64 QAM
128 QAM
Code
Rate
1/2
2/3
3/4
1/2
2/3
3/4
1/2
2/3
3/4
1/2
2/3
3/4
1/2
2/3
3/4
Data rate (Mbps) for Different GI
1/4
1/8
1/16
1/32
6.75
9.0
10.12
13.5
18.0
20.25
27.0
36.0
40.5
40.5
54.0
60.75
47.25
63.0
70.87
7.50
10.0
11.25
15.0
20.0
22.5
30.0
40.0
45.0
45.0
60.0
67.5
52.5
70.0
78.75
7.94
10.58
11.91
15.88
21.17
23.82
31.76
42.35
47.64
47.64
63.52
71.46
55.58
74.11
83.37
8.18
10.90
12.27
16.36
21.81
24.54
32.72
43.63
49.08
49.09
65.45
73.63
57.27
76.36
85.90
Table 7-2 provides the value of parameters that were selected for OFDM system in order to
achieve desired throughputs.
Table 7-2 – OFDM Related Input Parameters
Parameters
Operating Frequency
Bandwidth (BW)
Total number of sub carriers (N)
IFFT Size
Number of Data sub carriers
Number of Pilot sub carriers
OFDM symbol duration (Ts)
Guard interval duration (Tg)
Total symbol duration (T)
Sub carrier spacing (f) = BW/N = 1/Ts
137
Values
3 GHz
20 MHz
256
256
216
40
12.8 usec
0.8 usec (Ts /16)
13.6 usec (Ts + Tg)
78.125 KHz
7.8
Conclusions
This chapter discussed the design aspects and implementation methodology in detail for
the proposed new MAC protocol for 4G networks. Discussion on simulation results for
various data rates with different modulation techniques to satisfy the 4G network QoS
requirements. This chapter introduced a new scheduling technique which can alter priority
to different types of traffic based on QoS requirements. This technique can easily be
configured to support for number of different priority traffic rather than few priorities such
that decision is made efficiently.
The proposed MAC protocol takes care of scheduling techniques, traffic & flow control,
mobility management, and packet access control and handover strategy. However, the
proposed protocol necessitates new base stations for 4G communications. Further study
and investigation supports vertical handover to other cellular networks in mobility
management sub-layer and new scheduling algorithms as a part of QoS Management sublayer for the NEXT GEN MAC layer implementation.
138
Chapter 8
Modular Data Link Layer (M-DALL) for NEXT GEN Mobile Terminals
Enabling Wireless Aware Applications: A Platform Independent
Software Design for the Aricent Group (2008-2009)
8.1
Introduction
Today, large number of wireless networks based on different Radio Access Technologies
(RATs) and standards are found. New RATs will be developed to complement those that
exist already today. Each RAT will have its strengths and weaknesses with respect to
capacity, cost, achievable data rates and support for end user mobility. Hence, no single
RAT will be able to fully support all services and user requirements. It can be anticipated
that within a few years’ time, a mobile terminal will have a choice of access technologies
via which it can connect to the mobile communication infrastructure. It will be a challenge
to allow for a mobile user to seamlessly communicate throughout multiple networks [92].
Therefore, a major requirement for the future is to achieve the cooperation of those
heterogeneous networks. Innovative mobile applications gain from these new possibilities
but the involved design complexity gets higher due to several reasons.
Firstly, the interfaces used to retrieve link-layer information drastically differ from various
technologies [92, 93]. Application programmers who want to run their implementation
over multiple RATs, e.g. WLAN as well as Bluetooth have to implement the network
related part for each technology from the beginning.
Secondly, the flexibility and functionality of these interfaces is severely limited [92, 93].
For example, link-aware mobile applications have to monitor characteristics of the wireless
connection themselves.
Thirdly, mobile operating system entities offering a flexible interface to track the
frequently changing conditions in the wireless communication are not available
today [94].
139
Finally, measurement results available from present device drivers are rarely
comparable [94]. Often only very specific and detailed data can be read out but no
performance QoS metrics are offered.
8.2
Related Work and Proposed Concept
Research studies [95 – 102] have focused on providing generic link layer APIs and other
studies [103 – 105] focused on generic protocol stack approach. Various approaches are
presented separately in different methodology. But my approach is towards providing an
integrated solution in the form of an M-DALL for the 3G/B3G mobile terminals. It
envisage to cover various aspects like measuring the signal strength and providing
handover facility to application layer; taking care of all Common Data Functions (CDF) in
a framework and support interface with other layer to measure and ensure the required
QoS. Based on user profile settings in a more practical and integrated way, it will provide
solution to Original Equipment Manufacturer (OEM) for easy implementation. Parameters
from Layer 2 (and above) to ensure a modular approach relevant to emerging technologies
were considered.
In this chapter, a new concept of a Modular Data Link Layer (M-DALL) is presented and
depicted at figure 8-1, where M-DALL enables a cooperation of different access networks
at the link layer.
Figure 8-1 - M-DALL Concept
140
So the issue is that not is single acceptable and useful reference API is provided in the
public domain [95, 96]. An M-DALL which provides an extendibility to permit different
underlying wireless interfaces and networking technologies that exist now and will emerge
in the future is proposed. One of the important emerging technologies is composite multimode radio [96]. Flexibility of mobile devices to operate in different modes of operation &
dynamically reconfigure will be made available through M-DALL.
8.3
High Level Requirements
The various requirements of the M-DALL are explained below as per figure 8-2.
Figure 8-2 – M-DALL High level Requirements
Hide the heterogeneity associated with the use of multiple RATs as well as the
properties and deficiencies of the radio link from the higher layer with respect to both
users and services.
Provide an API simplifying access to link layer information of the application layer.
Enable the integration of different RATs in a common Framework that would
seamlessly provide all functionalities inherent in conventional radio access networks
including handover, context transfer and QoS support.
Provide a set of generalised data layer control and processing functions, responsible
for efficient cooperation between RATs.
141
Provide a Unified interface to the upper layers and physical layers acting as a MultiRAT convergence layer.
Facilitate the LLC/SNDCP/PDCP/RLC/MAC/RLP functionalities of multiple RATs
supported, in order to maximise the Layer 2 performance.
Provide a modular architecture that readily caters for the integration and co-operation
of different types of existing and future RATs.
Support the service requirements of the higher layer traffic.
Provide enhanced services like Data Storage, Resource Optimisation, Content
Adaptation and power consumption method.
In addition to provide a uniform API, the architecture of the M-DALL has been designed
to fulfil the following requirements:
Extensibility: Proposed architecture should be able to easily integrate new Radio link
layer technologies, possibly providing new features.
Platform independent: Proposed Software architecture should be able to be integrated
on multiple software and hardware platforms.
Scalability: Proposed architecture should be light enough to be used on Mobile devices.
Battery life: Proposed architecture should not be a major source for battery power
drain.
8.4
M-DALL Interface Architecture
The proposed M-DALL is to provide software API that will hide network standards
heterogeneity behind a common set of functionality applicable to all types of networks. I
believe that such an API is a step forward in the direction toward intelligent radio aware
software that will be able to accommodate multiple radio standards in a seamless way.
Figure 8-3 shows the various interfaces of M-DALL with other layers like Application,
Transport, Network and Physical layers.
142
Figure 8-3 – M-DALL Interface Architecture
The M-DALL will help to resolve the complexity and interoperability problem related to
the large number of different APIs and methods used for accessing communication
interfaces, especially in the wireless domain. The M-DALL provides APIs from specific
link technologies to the applications or can include any higher layer protocols, middleware
or application software. It achieves this by regarding a link to be a generic means of
providing a communication service. Links are made available and configured through
application software to permit abstraction from specific platforms and technologies. The
M-DALL support functionality for transmission over an access link. It embeds access
specific transmission methods and protocols. The M-DALL provides the following
interfaces with various layers as depicted in figure 8-3.
8.4.1
The Application Layer Interface
Through the application layer interface, the M-DALL is configured and reconfigured.
Based on that, the M-DALL monitors the performance of the access link and the QoS that
is perceived by an access flow. It also observes the availability (including load) of the
access links and based on certain rules and thresholds (event filtering and classifications)
configured, it reports link events (triggers) to application layer, e.g. when the performance
of the access link changes by a certain amount, when a new access link is detected or lost,
when a QoS requirement of a flow cannot be met anymore and when the resource costs for
access link pass a threshold or resources become scarce. It also receives measurement
queries to report on access link and resource status frequently to the application layer.
143
8.4.2
The Network Layer Interface
The Protocol stack design and development of wireless terminals is a complex and
therefore it is a challenging issue. The M-DALL shortens the developing process of
wireless communications protocols. The Common Data Function Framework (CDFF) as
shown in figure 8-4 which is part of M-DALL receives Layer 3 PDUs from specific RATs
(like GPRS, UMTS, WLAN) provided by the upper layer. The CDFF performs the specific
task according to the configuration done by upper layers. For the transmission of Layer 3
PDUs, usually segmentation in smaller transmission units is performed.
Figure 8-4 – M-DALL Software Modules
The CDFF is the realization of the various protocol stacks as illustrated in figure 8-4, and
software architecture is designed in such a way, that the common functions of all wireless
protocol stacks are combined in CDFF. These common functions can be repeatedly used
with a different set of parameters corresponding to the specific Wireless communication
technology. The CDFF has interfaces with major sub layers like Radio Link control (RLC)
of UMTS, Packet data convergence protocol (PDCP) of UMTS, Sub-network dependent
convergence protocol (SNDCP) of GPRS, RLP of CDMA2K and Logical Link Control
(LLC) of WLAN. The CDFF specific functional part corresponds to various sub layers of
Layer 2 protocol functionality of specific RATs and the CDFF controls the underlying
configurations of different RATs.
144
8.4.3
The Transport Layer Interface
The M-DALL measures QoS parameters for various multimedia applications via the
Transport Layer Interface. This approach is to identify the traffic flows and configure the
QoS requirements for certain traffic flows via a separate control interface. This interface
allows having the QoS negotiation mechanism and applying common policies and methods
to provide the required service quality.
8.4.4
The Physical Layer Interface
The M-DALL provides a new API that enables technology-independent configuration and
flexible monitoring of lower layer settings and characteristics. M-DALL offers a powerful
query mechanism that enables applications to gather link layer information in a flexible
and usable manner. Additionally, mobile applications can register with M-DALL for
notifications and define specific conditions depending on the actual use case. Some of the
Multimedia applications could benefit from Physical layer interfaces which are sensitive to
varying QoS such as video conferencing, video streaming, video-on-demand and VoIPclients.
8.5
M-DALL Software Architecture
The most important requirement of M-DALL is the ability to acquire link-layer
information, provide common data functions and facilitate handover decisions. This
section introduces the software architecture of the M-DALL as an initial step in the
implementation for multi-mode capable mobile devices.
As shown in figure 8-5, the following are the additional software modules identified as a
part of the M-DALL:
Data Link Layer Framework (DLLF)
Common Data Functions Framework (CDFF)
Handover Controller (HC)
DLLF & its Interface Architecture
145
Figure 8-5 – Link Layer Architecture
Figure 8-6 presents a graphical overview of the different components involved in the
implementation of the DLLF which is part of M-DALL. It contains three main
components.
Queries,
Notifications, and
Commands.
DLLF query specifies a request made by an application to retrieve information about RAT.
A notification request is used to specify a condition that should trigger an asynchronous
notification. Finally a command is a request specifying an action that should be executed to
modify a link layer state. The following is an overview of the basic elements composing
the M-DALL architecture.
146
Figure 8-6 – Layer 2 Interface Architecture
The query manager module is in charge of analysing the queries and notification requests
coming from link users. The command manager module handles commands and forwards
it to corresponding link provider. The event manager module takes care of handling events
arriving from the link providers (new link arrivals, new value for a link characteristic) and
in particular of the evaluation of registered notification requests. Finally the storage
module, represented outside of the DLLF, is an optional component used to cache link
characteristics collected from various modules in order to prevent access to the drivers or
hardware for each query. The DLLF achieve a set of core functions that map the different
RAT link layer functions both vertically and horizontally.
8.5.1
Common Data Function Framework (CDFF) Software Architecture
The M-DALL deepens the concept of Layer 2 protocol stack software in the context of
wireless terminals. The CDFF which is part of M-DALL compromises common
functionality that is extended through specific parts of dedicated RATs like GPRS, UMTS,
CDMA2K and WLAN as shown in figure 8-7 and will serve as a basis for future protocol
stack development through reusable software components. Thus, the CDFF provides a
flexible design approach for realisation of existing and future wireless protocol stacks.
147
Figure 8-7 – CDFF Software Architecture
The requirements on the radio link layer can differ for various radio access technologies.
For example, header compression of higher layer protocol fields is deployed in cellular
wide area networks, whereas it may not be required for wireless local area networks.
Therefore, the CDFF offers a library of functions, which can be separately enabled and
configured according to the requirements. To give an example, a function performed for
non-conversational data by each radio link layer is ARQ to recover from transmission
errors by retransmitting erroneous data blocks. However, different ARQ are used in
various radio link layers, which differ only in details although the same functionality is
performed. The RLC protocol of UTRAN has generalised the ARQ functionality by
specifying an ARQ library, which can be configured in various ways. This allows
configuring the UTRAN RLC ARQ function very similarly to ARQ functions used in other
link layer protocols. The same kind of generalisation has to be expanded to other link layer
functions. This shall result in generic data function for priority handling and scheduling,
data segmentation and also link security handling.
148
Further, the main aim of CDFF is to gather these common parts in a single data link layer
and the targeted advantages of this CDFF are maintainability, code sharing and protocol
development through reusability. The following are the common functionalities considered
for the CDFF:
Queuing of incoming data;
Queue management with packet discard functionality;
Header compression of higher layer protocol fields;
Segmentation of higher layer datagram into transport blocks with sizes that are
suited for efficient radio transmission;
Dynamic scheduling of data for transmission;
Priority handling of data transmission;
Error handling with the help of FEC;
ARQ protocols Send and Wait ARQ, Go Back N ARQ or Selective Reject ARQ;
Correction of transmission errors;
Reassembly;
Concatenation;
Padding;
Transfer of user data;
In-sequence delivery of higher level PDUs;
Duplicate detection;
Flow control;
Sequence number check;
Protocol Error Detection and recovery;
Multiplexing of PDUs;
Ciphering;
Suspend/Resume function;
Header Compression; and
Buffer Management (N-PDU Buffering).
The functionality of the CDFF is explained with the architectural diagram as shown in
figure 8-7 and 8-8. The communication inside the CDFF is performed by employing
generic service primitives and PDUs.
149
Figure 8-8 – Handover Controller in M-DALL
The following functional blocks constitute the CDFF architecture:
Primitive Handler Module – This software module handles primitives received from
the Layer 3 protocols of different RATs validates and passes the information to RAT
Routing Handler.
RAT Routing Handler – The Routing handler gets the signals from the CDFF message
queue and stores in the SDU buffer. It also ensures that the Layer 3 PDU’s are handled
respectively based on RAT specific and communicates to TX Data Transfer module or
to RX Data Transfer Module for further processing.
TX Data Transfer Module – This module takes care of the data transmission in uplink.
It forms the Layer 2 PDUs from the SDUs received from the upper layers for the
respective RAT (e.g. UMTS, GPRS) and performs the segmentation function where a
single SDU is segmented into different PDUs. In addition, it performs the
concatenation, ciphering and multiplexing functionalities for specific RATs configured
by the upper layers.
150
Control Module – During data transfer, the Control Module performs the transmission
and flow control. It takes care of the Status PDU formation and Status report handling.
In the case of errors, the Control Module also performs the recovery through a reset
procedure for specific RATs.
RX Data Transfer Module – This module at the receiving side receives the PDU and
forms the SDU. It performs the reassembly of PDU received in one TTI. SDU
formation, duplication detection and error detection by sequence number check are
performed by this module and the data units are passed to respective Layer 3 RATs.
More specifically, the CDFF. It performs the following:
o provides a unified interface to the upper layers and physical layers acting as a
Multi-RAT convergence layer.
o controls the RLC/MAC functionalities of multiple RATs supported in order to
maximise the Layer 2 performance, while efficiently utilising the radio resources
allocated by the L3 – Radio Resource Protocol (RRP) of various RATs.
o provides a modular architecture that readily caters for the integration and cooperation of different types of existing and future RATs.
The proposed modular concept of a generic data link layer enables link layer functions for
future multi-mode capable handhelds and provides a flexible design approach for
realisation of existing and future wireless protocol Stacks.
8.5.2
Handover Controller
Offering of seamless handovers is one of the most important requirements for a complete
mobile system because of communication range is limited [106, 107].
Following are couple of examples for the RAT selection algorithm:
Select the radio access flow with the highest radio link quality (e.g. highest SNR). The
motivation here is to select a radio path with the best radio link conditions leading to
high quality communications.
Pre-defined priority list (e.g. preferred RATs and/or operators) that is used in selecting
the radio access flow.
151
Based on the above criteria, a complete and detailed functional analysis of the specific
detection is described below. The traditional handover algorithms use the received signal
strength as the main trigger for handover decisions. Examples for such attributes are listed
below. The following abstract detection basic parameters are identified:
link_quality (RAT, thr1): establishes if the radio link (downlink) with the RAT
specified has acceptable quality (better than threshold thr1);
QoS(type): evaluates a parameter (specified in the field type) representative of the
QoS provided by the serving RAT;
Neighbour (thr1): locates candidate RATs which offer a radio link of acceptable
quality;
RAT_selection (RAT): selects the best RAT with respect to link quality by making a
comparison between abstract performance metrics offered by the serving RAT and by
the vector of neighbour RATs;
HO_trig (type, thr2): gives an alarm if the QoS parameter (type) provided by the
serving VAP degrades behind the warning threshold (thr2).
Error rates (Bits, Frames or Packets): measured based on different units such as bits,
frames or packets.
Each of the above procedures is finally mapped through the adaptation modules into one or
more system-specific function calls. The selection of a RAT is the core of the whole
algorithm. Although several decision mechanisms can be implemented, choice was to use a
simple comparison between abstract performance metrics. Then, the algorithm is
represented by the possibility to dynamically set all the parameters involved in the
procedure. On one side, the user can specify the weights to be assigned to each interest
performance numbers, such as signal strength, cost, transmission rate, power consumption,
etc for the decision metric composition. On the other side, to avoid unnecessary
oscillations between two interfaces, the user can declare warning and optimal thresholds
for each performance indicator.
The critical aspects of HC is a collection of signal strength information from local physical
layers (from GSM, UMTS and WLAN), selection of specific RAT based on the
measurement parameters (like RSCP, RSSI, Ec/Io) and generate triggers for making
152
handover decisions. It provides facilities for continuous measurement of QoS parameters to
monitor the required QoS during the actual data flow and does the comparison of defined
QoS parameters with the actual QoS based on the type of services (e. g. video telephony,
video streaming). It continuously monitors and compares the QoS parameters with the
defined and actual parameters for the specific service. It also provides user selection by
providing an option for selecting the best network for downloading large data or media
files capable of supporting a higher data rate. It also makes smart decision to perform
vertical handover and invokes appropriate RAT in the Mobile Terminal for signalling and
actual data flow. As shown in figure 8-8, the following software modules are part of the
Handover Controller for providing seamless handover across different cellular networks:
Signal Strength Indicator (SSI)
Profile Manager (PM)
QoS Manager (QM)
The functionalities of each software module are explained below:
SSI – The SSI software module identifies and monitors the existing and alternative
RATs like GPRS and WLAN. The monitoring of the existing RAT should be done
continuously so as to check if the signal strength of the existing home network (GPRS)
and foreign network (WLAN) is above the threshold value, where it fails, it gives a
trigger to the Handover Connection Manager to perform smooth vertical handover.
PM – The PM is used to store user profiles, terminal profiles and network profiles. The
PM provides information about all types of cellular network profiles, User preferences
and QoS profiles as well as information on QoS actually delivered for active
application services. The Static profile holds information that does not change very
often and includes Wireless Networks, Applications and its QoS requirements. The
Dynamic profile holds the current information such as current QoS network parameters
like bandwidth, delay, jitter, packet loss and throughput.
QM – The QoS manager is responsible for measurement and monitoring of QoS
parameters like jitter, delay, packet loss, throughput and FER. Its main task is to store
the predefined QoS attributes in the information database, monitor and compare the
153
negotiated QoS parameters with the actual values such that if a change in the
negotiated value occurs, then initiate the triggers smart decision maker to perform a
vertical handover.
The M-DALL trigger for handover is an abstraction of a notification from the link layer to
the application layer that a certain event has occurred or is about to occur. The components
of an M-DALL trigger are the event that causes a trigger to fire, the entity that receives the
trigger and the parameter that is delivered with the trigger.
8.6
M-DALL Enhanced Services
In this section, some new ideas for possible new and enhanced services based on the usage
of the M-DALL are presented.
8.6.1
M-DALL for Unlicensed Mobile Access
M-DALL appears to be an appropriate solution to integrate approaches to unlicensed
mobile access (UMA) and IP wireless networks. As UMA enables the connection to
unlicensed spectrum networks via IEEE 802.11 or Bluetooth (PAN profile is required),
UMA could take advantage of M-DALL capabilities as shown in figure 8-9, to manage the
available links and to select the most adequate technology. Therefore M-DALL could be
integrated within the UMA mobile terminal architecture to manage the access to the
unlicensed spectrum links, facilitating the handovers between technologies. Despite the
fact that many of the previous features are already supported by M-DALL, the access to
the wireless networks within UMA managed by M-DALL would probably require a new
link in order to support the special needs of the wireless link for the UMA architecture.
154
Figure 8-9 – M-DALL for UMA
8.6.2
M-DALL for IEEE 802.21-based Media Independent Handover
The IEEE working group 802.21 (WG 802.21) is currently standardising approaches to
realise mobile independent handover (MIH). The information necessary to make effective
handover decisions is lacking in part because the 802.XX network provides insufficient
information to the upper layers. Thus, there is a need to develop a standard that permits
information exchange between mobile terminals and/or networks to enable mobile
terminals to make more effective handover decisions.
M-DALL is very appropriate for implementing 802.21-based MIH, as shown in
figure
8-10. All required features are supported by the latest M-DALL or could easily be added
when the final 802.21-standard is available. Additionally, M-DALL is able to further
abstract the link layer access and enable technology-independent handover-management.
The latest standard draft still relies on technology-specific interfaces that are to be defined
by the respective technology-standardisation [93]. M-DALL would solve this problem and
offer the same interface for all deployed technologies. Moreover the implementations of
the 802.21 events are very flexible and new developments can be included without any
need to change higher layer entities.
155
Figure 8-10 – M-DALL for IEEE 802.21-based MIH
Mobile devices running M-DALL for all deployed technologies allow the gathering of link
layer information in a well standardised and technology-independent way. The interfaces
used between the MIH function and different link layers are not clearly specified yet.
Additionally, those interfaces might partially be technology-dependent introducing further
complexity. Using M-DALL instead would solve these problems and allow media
independent analysis. The final set of standardised events was not yet decided at the time
of execution of this project. Some examples for events that are described in the draft
standard [80] are listed below:
Link Up
Link Down
Link Going Down
Link Parameters Change
Link Handoff Complete
8.6.3
M-DALL for Voice
M-DALL can improve the quality of voice calls as it differs by independently selecting
different RATs. The M-DALL role can be classified as follows:
156
Roaming Prediction: M-DALL can notify the voice application upon changes in detected
infrastructure (entering or leaving an access point) so that handover is anticipated.
Voice Quality Improvement: as the conditions of a RAT can vary over time (either due to
congestion or the wireless link becoming noisy), M-DALL can help monitoring the
dynamic network state and help the voice application take countermeasures. For example,
a different voice codec can be selected; or
in case of excessive packet losses, M-DALL can notify the voice application to
apply error concealment techniques (like Audio Adaptive Playout);
cross-layer optimisation techniques can also be used to fine tune MAC and PHY
parameters according to network condition estimates.
8.6.4 M-DALL for Battery Life
As presented in the description, the M-DALL storage maintains the attributes provided by
known link layers (bandwidth, signal strength, etc). The main issue is updating these
values while still limiting battery consumption due to polling or code execution. To reach
this goal, the following strategy is used. All attributes maintained in the M-DALL storage
have an associated timestamp indicating the last time they were updated. When a query
request is performed, the validity of the requested attribute(s) is specified in the query and
passed to the storage database (SDB). For each requested attribute, the SDB checks with
the associated attribute timestamp and the validity of the attribute. If the attribute is too
old, a query is forwarded to the corresponding application to retrieve the current version of
the attribute. This “lazy update” strategy enables the
M-DALL to keep the number of
queries to the bare minimum required by applications.
8.6.5
M-DALL for Power Saving
The power saving mechanism describes how M-DALL can collaborate with other layers to
reduce power consumption. The power saving mechanism describes an interface to mobile
applications and other higher layers and translates to the appropriate low-power states of
the wireless bearer used and it is depicted in figure 8-11.
157
Figure 8-11 – M-DALL for Power Saving
However, one of the design goals was to avoid introducing any new protocols between MDALL, Application and Physical Layer for power saving. Therefore, the proposed power
saving mechanism relies on existing interface API’s used by the DLLF link-layer protocols
to decide the desired power saving mode transition. The PS mechanism defines four
abstract modes of the connection between M-DALL, Application and Physical layers:
Active: the radio is in the active mode. The M-DALL has full IP connectivity and can
communicate in full speed.
Standby: the radio is in a power-saving state maintaining synchronisation. The MDALL must re-establish its connectivity upon becoming active again because timeouts
may occur depending on the selected parameters of the underlying bearer power-saving
state.
Hibernate: the RAT is in a deep-sleep state and other higher-layer network state may
be lost. So the Mobile Device Software must re-establish this state upon becoming
active again. Thus, the wake-up process is in general faster than establishing a brand
new connection.
Disconnected: The radio is off. No state is kept to restore the connection. A new
connection establishment process must be repeated.
158
8.6.6
M-DALL Storage Library
The M-DALL Storage library provides support for the caching of Radio link information
collected from the underlying RATs. To limit the memory footprint on memory
constrained devices, the M-DALL storage has been implemented from scratch and to be
flexible, the storage library has been implemented as a generic storage.
8.7
Conclusions and Future Work
In this chapter, the systems architecture and enhanced services of M-DALL was presented.
The M-DALL in terms of a collection of functionalities which enable and facilitate
efficient data link-layer inter-working among multiple radio accesses technologies was also
presented. The DLLF offering a common interface to monitor the characteristics of various
RATs was introduced. The M-DALL performs the generic functions by offering a common
set of functions in a CDFF, which is enabled by the specific RAT. The M-DALL is a
contribution towards the paradigm of future generation wireless networking to achieve
cooperation between different radio access networks and technologies. In future, it is
envisaged that the M-DALL will be the link layer which will be generally deployed in all
3G/4G mobile devices. This will enable seamless communication in a future of
heterogeneous networks.
In the near future, the immediate task would be refinement of the M-DALL software
architecture and fully working prototype implementation of M-DALL on different
platforms. The evaluation of enhanced services by means of analysis, simulations and
prototyping is a topic of ongoing and future work. Although, the intuitive M-DALL seems
practical, further work is required to test its effectiveness in the real-world environment. I
conclude that the proposed M-DALL is a stepping stone towards a unified solution
targeted for 4G systems. M-DALL manifests itself as a valuable framework by enabling a
cooperation of different access networks at the link layer, therefore adding to customer
satisfaction and opens multiple dimensions for revenue generation opportunities.
159
Chapter 9
Development and Implementation of DLNA-enabled Mobile Terminal
and Home Gateway offering an Adaptive QoS framework for the Digital
Home Environment to Cater for Multimedia Services for the Aricent
Group (2009-2010)
9.1
Introduction
Various access technologies like Wi-Fi and Bluetooth are used in the home network. In
designing and implementing a media distribution system in a converged home network
there are two design considerations. The first is the interoperability of media management
and control between different types of multimedia devices [108, 109]; and the second is the
Quality of Service (QoS) management for multimedia to satisfy user’s quality expectation
because multimedia applications such as Audio/Video (A/V) streams, voice and games are
bandwidth and delay sensitive [110 – 113].
The Home Gateway (HG) accommodates various international standards including Open
Services Gateway initiative framework (OSGi) [114], Digital Living Network Alliance
(DLNA) and the networking function of the conventional home gateway [108, 109]. HG is
used as a fundamental technique to support inter-networking, QoS, and safe use between
applications as well as a network for providing various intelligent services. HG not only
pursues the integration of middleware technology that automatically controls home
appliances and provides various services, but also convergence between data
communication and broadcasting. In addition, the DLNA-supported home media devices
are generally configured with private IP addresses based on Dynamic Host Configuration
Protocol (DHCP) or automatic IP addressing mechanism. Therefore, this arrangement
compromises the fact that multimedia transmission is not allowed when a DLNA device
with a private IP address receives and transmits media contents from/to the Internet. The
current generation of HGs provides insufficient QoS for meeting the demands of existing
and emerging multimedia applications and likewise provides insufficient bandwidth
management for optimum utilisation. Therefore, a home network service needs to support
different data service traffic apart from the control traffic ensuring required QoS.
160
Figure 9-1 – DLNA Enabled Home Gateway with QoS Support
Hence, to help solve these problems, this chapter presents in detail, a new adaptive QoS
framework for a DLNA enabled HG with the key features as illustrated in figure 9-1. They
are as follows:
bandwidth allocation policy,
QoS parameter mapping scheme,
different traffic classification,
a set of QoS Key parameters for measurement and controlling the multimedia traffic,
and
9.2
feedback technique for ensuring the better QoS in the digital home network.
Design Approach
This section gives an overview of the design for the new QoS Framework. As a general
requirement, the QoS Framework in a home gateway should allocate and manage
bandwidth for active home devices automatically and efficiently. Before explaining the
proposed QoS Framework for the DLNA enabled home gateway, the typical life cycle of a
smart home with four steps is introduced.
161
9.2.1
Device Discovery
The home gateway is able to discover new home devices in two ways using Universal Plug
and Play (UPnP) protocol either by sending an active search signal or by listening to
passive announcements generated by devices [115, 116]. Bandwidth requirements and
other characteristics of devices are also sent to the QoS framework at this step [117].
9.2.2
Device Removal
Upon removal of any devices from the home network, the QoS framework releases the
bandwidth occupied by that device [118].
9.2.3
Bandwidth Allocation
Firstly, configuration models are used to determine how much bandwidth and what priority
should be assigned to the device. If the bandwidth required is available, it is assigned to the
device. Otherwise, the QoS framework calls the bandwidth arbitrator to see if it is possible
to release some bandwidth from devices with lower priority [119]. If this is possible,
bandwidth is assigned, otherwise the device is deregistered.
9.2.4
Bandwidth Re-allocation
The modules within QoS framework responds to the bandwidth reallocation request.
However, it only reallocates bandwidth if it is available. Otherwise nothing is done [120].
9.3
Proposed Adaptive QoS Framework
This section gives an overview of the design of the proposed QoS framework. As a general
requirement, QoS framework in a DLNA-HG should allocate and manage bandwidth for
active home devices automatically and efficiently. Figure 9-2 depicts proposed software
modules in adaptive QoS framework.
162
QoS User
Defined
Policy
Application
Layer
Bandwidth
Allocation
Manager
A/V Sync
Module
QoS
Manager
Traffic
Classification
Manager
Adaptive QoS Framework
Real Time
Traffic
Manager
Ethernet
Service Class
Manager
Wi-Fi
QoS
Feedback
Manager
Bluetooth
Figure 9-2 – Proposed Software Modules in Adaptive QoS Framework
The proposed QoS Framework contains the set of identified software modules,
Bandwidth Allocation Policy
QoS Manager and its Key Mapping Parameters
Traffic Classifier
Service Class Manager
Real Time Traffic Manager
QoS with Feedback Mechanism
Audio/Video Sync Manager
The QoS Framework discovers and controls QoS for the devices connected in the home
network and is responsible for requesting and releasing the QoS assigned to various traffic
streams. In addition, the DLNA enabled Home Gateway provides interfaces for the Control
Point to initiate QoS setup, releasing and updating.
9.4
Bandwidth Allocation Policy
In this section, the bandwidth allocation policies are described that are part of the proposed
QoS framework and then the set of QoS parameters and its mapping to various application
are discussed and finally, the media distribution considering few multimedia use cases are
presented.
163
Bandwidth allocation policies are used for arbitration when the physical bandwidth is not
sufficient for all the traffic requested by DLNA devices. A set of common bandwidth
allocation policies should be followed in all models. These policies are:
Policy 1: Traffic with higher priority always gets the bandwidth.
Policy 2: Among the traffics with same priority, those non-isolated and nonbounded traffics are always reduced or suspended to release bandwidth.
Policy 3: Among the traffics with same priority, if all traffics are either isolated or
bounded, the latest one that gets it allocation is suspended to release bandwidth.
Policy 4: In exception of all above policies, security traffics, if exist, should never
be suspended to release bandwidth.
Bandwidth allocation is a complex issue in home networking environment, especially
when multiple devices are competing for bandwidth. The four major parameters need to be
considered while allocating bandwidth for various devices:
Characteristics of Traffic: Differentiation has to be made between delay sensitive,
delay jitter sensitive and throughput sensitive traffics.
Presence of Home User: If home users are not at home, traffics involving user
interaction should be given a lower bandwidth, and vice versa.
Presence of other Device Traffic: If bandwidth is insufficient, it should be allocated
to the devices with higher priority, unless manually configured by users.
9.5
QoS Manager
The QoS manager located in QoS Management Sub-layer is configured according to
applications, network specific QoS requirements and resource availability. The QoS
manager modules functionalities include the following:
QoS Monitoring allows tracking the ongoing QoS levels achieved by the lower
layers.
Flow Scheduling manages the forwarding of flows in an integrated manner.
Flow Policing observes or monitors whether the QoS required by a user is being
maintained or not.
164
Flow Synchronisation is required to control the precise timing of multimedia
interactions.
QoS Maintenance compares the monitored QoS against the expected performance
and then performs tuning operations on resource modules to sustain the delivered
QoS.
QoS Degradation issues a QoS indication to the user by the QoS maintenance
mechanisms.
In the proposed QoS Framework, a set of QoS parameters are considered and the brief
definitions of the key parameters are explained as follows:
End-to-End Delay: The time duration from the event when a data packet is
transmitted by a source to the event when it is received at the destination.
Delay Jitter: The delay between two successive data packets received at the
destination.
Bandwidth: The bandwidth reserved for a packet or a flow.
Throughput: Total number of bits sent to the higher layer from the MAC layer. The
data packets received at the physical layer are sent to the higher layer if they are
destined for this station.
Packet Delivery Ratio: The ratio between the data packets sent by a source and data
packets successfully delivered to the destination.
Load: Total number of bits received at the app level. Packets arriving from the
higher layer are stored inside the buffer.
Scheduling Algorithm: Determine the transmission time for the packet in each
queue to provide QoS assurance, which will influence the delay of services.
9.6
Traffic Classification
Before bandwidth allocation can be performed, DLNA-HG must identify the traffic that is
travelling through it and this process is called Traffic Classification. The proposed DLNAHG classifies the traffic into seven classes. They are,
Multimedia Traffic – This traffic includes IPTV streaming, VoIP applications, video
conferencing and other multimedia traffic. This class requires large bandwidth, small
165
delay and delay jitter. High priority should be given to this class and the bandwidth
should be reserved when the application is running.
Security Traffic – This traffic includes securities which normally work when the user is
outside the home. This class occurs periodically and frequently. Hence a relatively
small bandwidth but high priority should be reserved for this class.
Device Control Traffic – This traffic belongs to control signals for home appliance.
These are normally small and short messages. These signals appear at user request.
This class is assigned with high priority but with no bandwidth reservation
requirement.
File Transfer Traffic – Typical file transfer traffic is File Transfer Protocol (FTP)
traffic. Large throughput is required by this class. It is not sensitive to delay and delay
jitter. This class should be suppressed if it coexists with higher priority traffic.
Web Traffic – This traffic includes normal web browsing. It should not be over-starved
by other traffic because active user interaction is involved. Hence a fair portion of
bandwidth should be reserved but the priority is assigned as not important.
Interactive Traffic – This traffic includes delay-sensitive traffic of applications like
telnet. It should be transmitted with minimal delay because of their sensitive
characteristic to RTT.
Best-effort Traffic – This traffic is transmitted with best effort only. According to the
needs of the system and user, DLNA Gateway can classify traffic into other classes
such as DNS, mail, etc.
Other factors that can influence the allocation of bandwidth may also exist. This is greatly
depending on the future development of home technology. The proposed QoS framework
can cope with new technologies by expanding its bandwidth allocation models. In the QoS
framework, two models are proposed to handle users at home and users out of home.
166
9.7
Service Class Manager
Figure 9-3 – Interface of Adaptive QoS Framework within Services Layer
Based on the above traffic classification and as per the guidelines provided by DLNA on
network connectivity, four service classes are defined as shown in figure 9-3 by mapping
all the defined traffic class according to the characteristic of the service traffic and been
summarized as follows:
Service Class 1: this traffic class has the characteristic which is sensitive for the
delay and the jitter, such as voice traffic, A/V streaming service. Therefore, it must
be allocated to the fixed bandwidth.
Service Class 2: this traffic class has the characteristics that are generated
uncertainly such as the control packet for the home automation and sensitive for the
delay. It also has the small size packet. It is inefficient to reserve the bandwidth due
to its characteristic. Therefore, this type of traffic is transmitted using the prioritised
QoS mechanism.
167
Service Class 3: this traffic class requires the small delay and the large amount of
the bandwidth. For example, if a user wants web surfing or home networked game,
the user satisfaction is decreased as the delay is increased.
Service Class 4: in this traffic class, FTP, E-mail, periodic reports uses the huge
amount of the bandwidth because its generation is burst. This traffic is served based
on the best-effort.
9.8
Real-Time Traffic Manager
The Real-time traffic manager supports real-time traffic management in maintaining larger
bandwidth and higher speed of operation. The RTM identifies efficient packet transmission
mechanism to provide flexible wireless access schemes for multimedia services with
reliable QoS assurance. This module also provides enough Radio Resources for a new
multimedia request to ensure the QoS requirement without degrading the service quality
for current service.
9.9
QoS with Feedback Mechanism
Figure 9-4 shows a framework for adapting QoS using user feedback. The steps in the
framework are as follows:
The source (or) the user specifies the values of different QoS parameters with their
minimum/maximum values and tolerance limits.
The QoS parameters along with their respective values are given to the QoS
Manager.
If QoS Manager receives QoS parameters for a packet of the flow for the first time,
it sorts the parameters according to their relative importance or weights. After that,
the QoS Manager calls a method to take care of the parameter that is relatively the
most important. After that, it takes measures to take care of the next relatively
important parameter (if possible), and so on.
The packet is then delivered to the destination according to its QoS specifications
and the source is informed accordingly.
If the source or the user is satisfied with the QoS of the packet delivered, the next
packet is sent to the destination.
168
If the source is not satisfied with the QoS of the packet delivered, it informs the
QoS Manager about the change it wishes to have in the QoS. The QoS Manager
tries to adjust the QoS parameters accordingly.
Figure 9-4 – Execution Process for QoS Framework
Note that the source specifies the values of QoS parameters, their minimum and/or
maximum values, relative importance, and tolerance limit for each parameter. As
mentioned above, QoS Manager sorts the parameters according to their relative
importance. The QoS Manager calls appropriate methods for providing the QoS. The fact
that which method has to be called first depends upon the relative importance of the
parameters. Depending upon the relative importance of QoS parameters, different methods
are invoked.
The first and the foremost task that the QoS Manager needs to perform is sorting of the
QoS parameters according to their relative importance. Another set of input is the user
feedback, in case when some form of QoS has been provided to the flow but the user is not
satisfied with the QoS. Once the QoS parameters have been sorted, appropriate methods
are required to be called to provide the given level of QoS.
9.9.1
A/V Synchronisation Module
A/V Sync is one of the key aspects of the media flow between client and server. In the
proposed QoS Module, logic has been derived which would help in achieving the sync at
both the ends.
169
9.9.2
Receive Side Video Rendering
This section explains the logic used for rendering the video frames using the rendering
time stamps available for every frame with the real-time transport protocol (RTP) header
information.
The first frame is rendered as soon as it is decoded. The system time at this point is taken
as the reference time. Let this time be Tr. Let Td be the system time when a subsequent
decoded frame is available. Let Tp be the presentation time of the frame decoded at
instance Td. This time is relative to the first frame’s timestamp in media time units.
If (Td – Tr ) == Tp, render the frame immediately.
If (Td – Tr) < Tp, set a timer for (Tr – Td) == Te where, Te is the approximate
overhead for firing of the timer. In the timeout function, render the frame without
any checks.
If (Td – Tr) > Tp, frame is delayed for display. This condition should not occur if
all performance parameters are met.
9.9.3
Send Side Video Frame Timestamp Generation
This section describes the logic used for generating the video time stamps to be used in the
RTP headers. Based on the frame capture rate configuration, calculate the frame time
stamp whenever a frame is available. For the first frame, the time stamp shall be 0. For
subsequent frames, let ‘F’ be the capture rate in frame/second and let (Tr) be the frame
time stamp which will be calculated as (1/F) * 1000 milliseconds.
Current frame time Tf = Tr + Ta – where, Ta is initially 0, and Ta = Tf after every
calculation for a frame i.e. it contains the accumulated time. The advantage would be the
uniform timestamps for all frames.
9.9.4
Example: Streaming on Mobile over DLNA-HG
If a user wants to watch a movie on his mobile (from internet through streaming), the
following the actions are triggered in the system.
170
Figure 9-5 – Execution Process of QoS Framework
The diagram shown in figure 9-5 depicts the typical working model of the proposed QoS
Framework. It primarily emphasises on guaranteed QoS by solving dynamic programming
problems of bandwidth allocation by the proposed progressive optimality algorithm on
DLNA HG. Based on the classification presented in section 9.3, at every stage
recalculation and incorporation of information which propagates till the resource is
allocated to the control point is carried out. This information is used in the decision making
at successive stages. This can reduce communication overhead by reducing the available
choices at each stage. This intelligent traversal method between stages also incorporates
deterministic system state behaviour making it efficient.
The control point (mobile device) discovery is performed and the results are updated to the
QoS Framework.
Within the framework, firstly, the bandwidth allocation policy is applied to determine the
optimal bandwidth required for such application. For the above example, policy 2 or policy
3 may be applicable depending on the location of the user.
Secondly, subset of the key QoS parameters are selected which are applicable to the above
selected bandwidth policy. Ex: Route lifetime may not be a critical requirement of
171
streaming kind of applications. Hence, may take a backseat during execution. The QM
acting as a device for the control point acts as a control point to the QoS framework in
responding with the information necessary for the actual control point. Subsequently, the
traffic classification is performed which determines the kind of traffic class to invoke at the
control point to access the service of the device. In this example, it falls under multimedia
traffic. Once the control point is aware of the traffic class, the QM maps the parameters
identified in the stage 2, with the priority (if any) and assigns the service class to the
requested control point.
The process demonstrated in the above usage scenario shows a progressive approach to
obtain optimal and deterministic QoS.
9.10
Media Distribution System with QoS
In this section, the design of the media distribution system is described. Consideration was
given to a home network in which all network devices are interconnected by a DLNA
enabled home gateway. As depicted in figure 9-6, the system composes three types of
devices: a media server device, a media renderer device and a DLNA-HG gateway. Each
element is implemented as explained below.
Figure 9-6 – Media Distribution between Gateway, Server and Renderer
172
9.10.1
Media Server Device
The media server device contains a media server module and a QoS Framework containing
QoS device service module and a QM. The media server module stores multimedia
contents and provides the control point of media renderer device with content directory
service, connection manager, A/V transport and HTTP service. The QoS device service
module provides interfaces to query the static QoS capabilities and run time state of the
device. It requests the QM to assign Traffic class priority to a traffic stream identified by
{source port, destination port, source IP, destination IP} according to the Traffic
Importance number assigned by user. Then the QoS priority module assigns QoS userpriority to traffic streams according to Traffic Importance number to QoS user-priority
mapping table. Because both Traffic Importance number and QoS user-priority have values
from 0 through 7, the values of Traffic Importance number are mapped to the same values
of user-priority.
9.10.2
DLNA -HG Device
Figure 9-7 – QoS negotiation between DLNA-HG, Media Server and Mobile Devices
The above message sequence chart shown in figure 9-7 demonstrates QoS negotiations
between DLNA-HG, Media Server and Mobile devices. A typical use case shown above is
173
a new control point trying to access a service offered by mobile device. The control point
uses device discovery mechanism and requests the information about the services offered
by the mobile device. The mobile device intimates the QM about the status of the services.
The QM in-turn verifies the policy holder, priority list and the information obtained in the
response and updates the control point about the status. This way, QM has control
information about bandwidth usage, service usage on device and so on at all points of time.
The QM will then invoke the traffic classifier (Figure 9-5), for further processing. The
traffic classifier class in turn will determine which type of traffic class best suits the
request and allocates it. This information percolates down which is used for priority
classification and determining the service class that needs to be assigned to the control
point. The control point, on receiving this information also notifies the A/V source about
the type of service it will be using. This component interacts with the QM and ensures A/V
sync is achieved for that particular control point. The QM is updated on successful
completion of any operations like end of playback. The corresponding device is also
notified about the detachment of the control point.
9.10.3
Media Renderer Device
The media renderer device contains a media player, which a control point and a QoS
Management GUI are integrated in to a media renderer module, a QoS device service
module and QM. The media player is a multimedia player for various audio and video
formats such as MPEG-1, MPEG-2, MPEG-4, mp3, etc. By integrating the control point
and the QoS Management GUI into the media player, users can control media distribution
and edit QoS policies conveniently. The control point discovers media server devices and
displays media contents stored in them.
When a user selects media content in the browsed list and clicks the PLAY button, the
Control Point requests the QM to setup a QoS traffic stream providing the information of
source, sink and content to be streamed which contains a description of content QoS
requirements. After completion of QoS setup, the mobile device request the media server
device to stream the specified media content using HTTP protocol. User can add, delete
and modify QoS policy for a traffic stream through the QoS Management GUI. By saving
edited policies in the QoS policy holder of the DLNA-HG gateway, it provides a
174
centralised mechanism for enabling or disabling QoS policy for the entire network and for
classifying traffic according to information provided in the request for QoS for a particular
traffic stream.
QoS setup information for traffic streams and static QoS capabilities of multimedia devices
in the home network can also be browsed using the QoS Management GUI. The media
renderer module provides the control point with media rendering control service,
connection manager service and A/V transport service.
9.10.4
Example: Media Distribution
While a mother watching a stored movie in the digital media server using the media player
from the desktop in the living room, the movie transfer from the Digital Media Server to
the desktop is suddenly interrupted due to best-effort traffic generated by her kids. So she
stops playing the media and opens the QoS Management GUI from Desktop through the
media player. After finding that A/V traffic has the same priority as best-effort traffic, she
assigns higher priority to A/V traffic and resumes playing. She is satisfied with the
provided quality of service.
Figure 9-8 shows the test bed for the scenario described above. Network connectivity
among devices is Fast Ethernet (100 Mbps). The bandwidths of A/V stream and best-effort
traffic are 20 Mbps (one HD level MPEG2-TS stream) and 100 Mbps, respectively. An
Ethernet switch is used to allow the A/V stream and the best-effort traffic to share the
bandwidth of an Ethernet port of the DLNA-HG gateway. To illustrate the implemented
system in action, a media distribution usage scenario and describe the associated theory of
operation is presented.
175
Figure 9-8 – Test Bed Setup
When a user turns on the HDTV and DLNA-HG and then executes the media player
program, the control point of the home server discovers the digital media server and
displays media contents stored in it through the media player GUI.
After he or she selects a movie and clicks the PLAY button, the DLNA-HG control point
requests the QM to setup a QoS traffic stream by passing information such as Traffic Class
and Traffic ID to DLNA-HG Gateway. Then the QM requests the QoS policy holder
within the DLNA-HG Gateway to provide appropriate QoS policy for the requested traffic
stream.
Based on this QoS policy, the QM request the Digital Media Server to assign network
resources for the new traffic passing the traffic importance number of the QoS policy after
it queries the static QoS capabilities and run time state of the digital media server.
The QM module then requests to assign priority to a traffic stream identified Traffic ID
(source port, destination port, source IP, destination IP). After completion of QoS setup,
the control point requests the Media Sever module to stream the specified content.
176
When the DLNA-HG receives A/V frames generated by the digital media server after he or
she have assigned traffic importance number 5 to AV stream using the QoS Management
GUI, the Home Gateway puts them into the respective input port and output port.
When the DLNA-HG receives A/V frames, it treats the frames as Best effort and the
forwarding module puts them into the respective input port and output port.
9.11
Prototype Implementation and Results
In this section, experimental setup of the architecture shown in figure 9-9 is briefly
described. Experiments were conducted to verify its feasibility and evaluate the multimedia
streaming performance in a connected home environment with the proposed adaptive QoS
Framework on DLNA- HG as well as on a mobile terminal with digital media player. The
test bed was setup to measure the performance of multimedia streaming application.
DLNA Client is streaming at 400 Kbps multicast video from the DMS-1. DMS-2 is
running several FTP sessions at the same time. Two tests are done, one with an Adaptive
QoS framework, and the other without the framework. Performance of the DLNA-HG
without and with QoS framework is show in figure 9-10 and 9-11 respectively.
WMG160 was used as a gateway device (wireless multimedia gateway). UN55B8000XF
was used as a HDTV. Omnia SCH-i910 was used as a DLNA terminal. SENS X20 NT
X20 was used as a digital media server which included Intel Pentium® Mobile 740
(1.73GHz) processor, 4 GB RAM, 1 Tb HDD with Windows XP Professional as an OS.
All products used were sponsored by Samsung.
177
Figure 9-9 – Experimental Test Environment
Figure 9-10 – Throughput of Video Streaming without QoS Framework
It can be clearly noted from the figure 9-10 and figure 9-11 that without the QoS
framework, throughput of video stream decreases dramatically with the increasing number
of FTP sessions. With the proposed QoS framework, the bandwidth is maintained at a
constant level that guarantees the performance.
178
Figure 9-11 – Throughput of Video Streaming with QoS Framework
The performance characteristic for a trial problem of video streaming is summarised. The
same results are extrapolated and tested for various real-time scenarios providing
perceivable enhancement in QoS.
In the proposed architecture, the DLNA-HG acts as the server component for internetworking between the home network and the Internet. The home server has both a public
IP address for an external network interface and a private IP address on its local network
interface. The DLNA devices including DMS1, DMS2, and M-DMP are connected to the
private IP configured home network. The DMS devices within the home are connected to
the home server.
Figure 9-12 – GUI for Media Content Sharing running over DLNA enabled M-DMP and
M-DMS
179
The HTTP is used as a protocol to communicate between the DLNA-HG Server and
DLNA Agent via the Internet. The UPnP [110, 111] is used to gather and share media
information and content among DLNA supported A/V media devices connected in the
home network.
Figure 9-13 – DLNA based Video Player streaming the media running over DLNA
enabled Android and Windows mobile devices
9.12
Conclusions
DLNA-based media streaming application including the DLNA agent function that a user
inside of his home used for communicating with the DLNA-HG to dynamically obtain
device profiles is presented. Furthermore, service information pertaining to the DLNA
devices in-house for real-time access and to stream the media contents distributed over the
home is also presented.
The GUI of the application shown in figure 9-12 and figure 9-13 is implemented on
Android and Windows Mobile. Applications can be executed over M-DMP & M-DMS
enabled DLNA devices connected in the home network and then, implementation of the
GUI of the DLNA-based media sharing application on several DLNA capable devices was
performed. For example Digital Picture Frame (DPF) and Portable Media Player (PMP)
connected to the home network based on a Private IP including a DLNA Agent function.
The screened list items (Figure 9-13) provides a list of the DLNA devices and multimedia
contents distributed at the home.
180
A QoS-aware DLNA gateway enables quality-guaranteed internet services to be delivered
to
every
single
device
in
a
digital
home,
subject
to
overall
bandwidth
limitations [117 – 120]. In this chapter, design and development of a QoS framework for a
DLNA Gateway was carried out. The approach is considered innovative and experimental.
It is shown that a QoS-enabled DLNA gateway can support a group of applications by
allocating bandwidth based on application class or user-specified policy. The proposed
QoS Framework architecture for the DLNA-based Home Gateway gathers media
information and shares media contents among distributed DLNA-supported A/V media
devices in the home and hence improved QoS for the real time multimedia streaming.
Future work includes verification of the transmission and delay times for the real time
multimedia streaming which in my opinion is an important aspect for the streaming
quality.
181
Chapter 10
Development and Implementation of a Heuristic Buffer Management
Scheme on Android to Enhance Video Quality on Digital Handheld
Devices for the Aricent Group (2009-2010)
10.1
Introduction and Rationale
Over the past few years, consumers have embraced digital technologies and are acquiring
and managing high definition media content on various consumer electronic devices like
Set-top Box (STB), HDTV and so on. All of these “Digital Entertainment” has led them to
demand high definition content on resource constrained hand held devices [121]. In
response, the leading manufacturers in the consumer electronics, mobile device, and
personal computer marketplaces have banded together to stimulate technological
advancements in codecs, especially video codecs to create a working model solution for
their diverse products. Xvid is one such result which is widely adopted in the industry.
Xvid even though uses lossy compression techniques, is admired for its ability to provide
very high compression ratios while ensuring better quality than current MPEG-4 video
codecs [122].
Figure 10-1 – Real Time Scenario
On the other hand, Android making an impressive impact amongst the early adopter
consumers is ensuring mass market success precisely due to “the cost factor with appealing
entertainment experience” [123]. Consumers are now looking forward to enjoy the same
rich HD multimedia content like DivX/Xvid on Android based handheld devices as shown
182
in figure 10-1. This intensive surge has created a dramatic shift in the technology space
precisely due to stringent performance requirements. Design consideration of media
management framework for devices like HDTV is very different from resource constrained
handheld devices. The media buffer management used within framework can significantly
contribute to overall system overhead. In particular, the Packet Video of Multimedia
Framework (PVMF) makes use of nodes which caters to basic functionality of media
management is ineffective to achieve high end-to-end system performance for HD content.
Android having a modular architecture supports codecs as OpenMax compliant
components which might further contribute to the system delay [124]. This has turned out
to be a constraint for not utilising the underlying hardware like Zoom2 optimally.
Hardware platform like Zoom2 which have dedicated DSP processor to perform high
intensive operations like video decoding can offer high end-to-end system performance, if
coordinated well with multimedia framework components of the software platform [125,
126].
In this chapter, a heuristic buffer management scheme on Android is presented to address
and overcome above mentioned constraints. The said buffer management scheme ensures
uniform buffer allocation across source-decode nodes and between General Purpose
Processor (GPP) – Digital Signal Processor (DSP). The need for such a mechanism to
leverage the support offered by underlying hardware efficiently while optimally utilising
the multimedia framework for efficient resolution in a constant time factor is
demonstrated. A proof-of-concept architecture is also developed to verify the feasibility of
the approach.
10.2
Design Approach
Technological advancement in video quality, especially for resource constrained handheld
devices has led to experimentation of lossy compression techniques as well. However,
algorithms used to implement the codecs are often complex and require higher CPU
utilisation which may lead to frame drops or frames to be delivered late to rendering
component. This further degrades the overall system performance. In general, multimedia
frameworks like Packet Video in Android have intermediate shared buffers between
sources and decode nodes as well as between decode and sink to avoid such situations.
This buffer scheme suffices to cater to basic functionality like video playback. However,
183
with high definition content like Xvid codecs, this mechanism proves to be inefficient in
handling the complexities involved within the system [127, 128]. Initial investigations
reveal that, with these techniques the current systems tend to over utilise CPU to provide
better services to the end user, which may not be a desirable and effective way of to
improve the video quality. Hence, this problem is approached in a profoundly different
way which avoids over-utilisation of CPU at the same time optimal utilisation of
multimedia frameworks to achieve better video quality. It was ensured that a uniform
buffer allocation is done by having a One-to-One mapping of the number of shared buffers
between the GPP and DSP and between source-decode nodes based on processor speed of
underlying hardware and the limitations of the packet video framework. Android primarily
based upon an opaque delivery model. Applications and services can expose their
functionalities to the system, and at runtime, other applications can request these
functionalities. This model is particularly used to provide a co-ordination mechanism that
effectively takes advantage of the underlying platform like Zoom2 and effectively utilises
the design aspects of Android for easier portability and deployment of the solution.
10.3
System Model
In this section, insight on the codecs sub-system architecture of Zoom2 board running on
Android platform is provided. Then discussion on the existing buffer management
strategies within the PVMF multimedia framework of Android is presented. A detailed
analysis of factors alleviating performance bottleneck are examined.
Figure 10-2 – System Architecture
184
Consequently, an efficient heuristic buffer management scheme bridges the codec-sub
system and buffer management within framework uniformly to achieve high end-to-end
performance.
System architecture shown in figure 10-2 describes the codec-sub system architecture of
Zoom2 on Android. It has two building blocks, the ARM side core and the DSP side core
of OMAP chipset. Generally, video decoding being highly processor intensive operation, a
dedicated co-processor to perform this task is supported in the hardware. This co-processor
is capable of performing highly complex algorithms in minimum time factor very
efficiently and effectively. Two main design issues surface immediately. Firstly, the
scheduling of the source node within PVMF framework which is responsible for providing
data to decoder node may not necessarily coincide with the scheduling of the DSP
processor to get the decoded video output instantly. This results in degraded performance
for high definition content.
10.4
Existing System
Scheduler
Parser
Component
(DivX/Xvid)
OMX compliant
Decoder
(DivX/Xvid)
Rendering
Component
DSP / Bridge
Figure 10-3 – Existing Middleware System Model
Figure 10-3 depicts the working model of the existing system within Android. Secondly,
the DSP co-processor sees a continuous data burst at regular intervals often getting
overloaded for data processing while remaining idle for data at other times. This situation
occurs due to the non-availability of buffers incessantly. Hence, the proposed buffer
185
management scheme resolves these two issues by allocating uniform number of buffers
between source-decode nodes as well as between GPP-DSP blocks so as to avoid the
problems that might arise due to scheduling at different time instants.
System model shown in figure10- 3 outlines the middleware architecture of the existing
system within Android. The scheduler within the multimedia framework triggers the
source component for playback of multimedia content. The source component usually a
parser/network element will parse the file for local playback, extracts the encoded video
data and places in an intermediate buffer shared between the source and the decode
element in the pipeline. The number of buffers shared is controlled by the source
component. As a next step, the OMX compliant decoder component will retrieve the data,
performs video decoding using the DSP processor and then places it in the shared buffer
between the decoder and the renderer element. The main problem encountered with this
approach is the synchronisation between the decoding speed and the rate at which the data
is being placed in the shared buffer between source and decoder.
If the shared buffer is full, then the source component has two options. It can block itself
and wait for further notification from scheduler when the buffer is available. However,
blocking not being a good design approach especially for applications like streaming
involving network operations, the other option is to drop the data within the framework.
Either case leads to performance degradation of the system. The other issue is the
interaction among the components.
Once the pipeline is built as shown in figure 10-3, the media flow happens in a serial
fashion with minimum interference from the scheduler. This is particularly important to
handle synchronisation issues. In the proposed system shown below, it shows on how the
buffer management scheme will avoid such issues and improves the overall system
performance.
10.5
Proposed System: Heuristic Buffer Management Technique
Figure 10-4 shows the working model of the proposed system. Linux Controlled Media
Library (LCML) layer of Android acts as abstraction for communication between the
processors. The video data after decoding will be encapsulated in an OpenMax IL
186
compliant component so as to be able to use by the PVMF of Android. This multimedia
framework uses this OpenMax component for pipeline construction and for data flow in
the playback.
In the proposed system shown in figure 10-4, a heuristic buffer management scheme which
overcomes the problem detailed in the previous section is presented. In this method, four
buffers between the source component (parser in this example) and the OMX compliant
decoder node of Android framework are allocated. Initially all the four buffers are empty.
These buffers are populated when the data is available to the source component. To certain
extent, this solves the synchronisation problem between source and decoder components.
Scheduler
Heuristic Buffers - 2
Parser
Component
(DivX/Xvid)
OMX compliant
Decoder
(DivX/Xvid)
Rendering
Component
DSP / Bridge
Heuristic Buffers - 1
Figure 10-4 – Proposed Middleware System Model
Considering the worst case, if the data buffer tends to get full, a notification is sent to the
scheduler to intimate decoder about the condition. The decoding component then uses the
support provided by underlying hardware Zoom2 to have more than one (four in this case)
buffers shared between GPP and the DSP. This optimal number for buffer allocation yields
maximum throughput as it will be easier for the scheduler to manage and as a matter of
fact avoid frequent over/underflows. Such a setting ensures optimal usage of underlying
hardware resources (processor) at the same time also avoid overhead that occur due to
frequent re-scheduling. It must be noted that there is a one-to-one mapping of the number
of buffers between the source-decoder components and the ARM-DSP side buffers.
187
This approach guarantees a direct interaction of all the components within the pipeline and
the scheduler. The framework just facilitates the execution process by constructing the
graph and identifying correct components to be built in the graph. Hence, the same
technique is also followed between the decoder-render to achieve playback synchronisation
as well.
The multimedia framework architecture in Android is modular, meaning that it consists of
units that can be interchanged with each other to provide only the functionality you need.
In addition, it supports OMX specification to define its standard interfaces, you can write
new components (such as codecs), and easily incorporate new components. A node is the
basic building block of the Android multimedia framework. To process a multimedia file,
any application uses only the nodes it needs to get the multimedia data, process it, and send
it to a target device. A node is basically a generic object. Its functionality is determined by
the way it processes data, and the interfaces it implements.
An engine interface defines the set of methods that the framework expects nodes of a
specific type to have. For example, all nodes must implement the ThreadLogOn and
ThreadLogOff methods defined in the PVMFNodeInferface interface so that the library
can create and destroy them.
The implementation of an interface is declared as a structure of pointers to implemented
functions in a defined order. Each node can have multiple input and output channels, so if
you have a file format that's interleaved with more than one data stream, you can have as
many output data channels as the input data stream contains. This is how the MPEG
System parser works, for example – it parses MPEG System data into two streams, video
and audio. An MPEG System encoder filter works the opposite way; it has separate input
channels for sound and video, and one output channel.
188
Player
Application
Input File
Open Core
Multimedia Framework
Recognizer
Plug-in
Renderer
Component
OpenMax
IL Interface
Audio/
Video
Codec’s
File
Parser
Figure 10-5 – Component Architecture on PVMF on Zoom2 Platform
Because the multimedia architecture uses a “plug-in” framework concept, each node
component can easily be integrated (plugged in) with existing nodes in the system. As
shown in figure 10-5, Recogniser Plug-in performs the functionality of adding the newly
formed nodes to packet video framework. This component also addresses the issue of delay
that might be contributed at runtime in finding out the component. The architecture
considers and provides a way to handle interpolation of intermediate frames in an efficient
manner.
It extensively leverages the support provided by underlying platform by having a split
solution leveraging IVA2.2 and Cortex-A8 core. It emphasises effective utilisation of the
support provided by platform making a viable choice for handling blocking artefacts,
motion outliners.
105.1
Variable Length Decoding (VLD) Engine Method
Various measurement techniques have revealed that maximum CPU cycles and processor
time is taken while decoding a variable length encoded buffer. This process is called
variable length decoding. Hence, an optimisation or efficient mechanism to ensure VLD
189
contributes significantly to the overall performance improvement. Since these are CPU
intensive operations, a piece of hardware called VLD engine is provided by the underlying
chipset. For example, Zoom2 has this facility. The timing of configuring this VLD engine
is also important so as to ensure optimum power consumption as well. This parameter is
another method to assure improved performance for high quality codecs like DivX and
Xvid.
10.5.2
Shared Cache Method
The internals of the DSP architecture also provides an insight of the available of the shared
cache within DSP for better fine tuning. The cache size is the key parameter which needs
to be configured. On one hand, an excessive cache size will lead to more memory access
than needed and will degrade performance. On the other hand, if the cache size is less than
the needed memory then the cache misses will be high leading to memory issues. Hence,
there is a cache fine tuning method must be in place which varies for different type of
decoding technique, i.e. having cache size as a parameter will the GPP initialises the coprocessor is a good practice.
10.5.3
Direct Memory Access Method
The hardware/underlying platform generally specific to a category of devices have a
feature for Direct Memory Access (DMA). This feature is particularly useful as it avoid the
most expensive CPU operation of memory copy of the buffer from GPP to DSP side. This
means the DSP/GPP will use the DMA technique for exchange of data between them. This
saves considerable memory CPU time by avoiding memory related operations. Though it is
a common technique, this also comes with the overhead to the programmer as the memory
address spaces on the GPP and the DSP side is different i.e. an address 0x00024401 may
not exactly correspond to the same memory location on the DSP side memory. Hence, a
careful balance between the use of feature and the overhead incurred should be worked out
depending on the cost of CPU cycles saved between memory operation (in the first case
without DMA) and the Address Translation (second case with DMA).
190
10.6
Test Bed
To prove the feasibility of the architecture outlined above, a fully working prototype on
Zoom2 board is developed. The prototype has been tested on both the Android emulator,
based on ARM processor, was customised to model the typical functionalities and user
interface of an lVI, and also on the actual target Zoom2 hardware powered by Zoom2
platform. The memory requirement with such an implementation is also presented. It was
also noted that such a high end-to-end performance is achieved with a minimum increase
in footprint making it viable candidate for commercial deployment. Experiment was
executed in two phases.
encoder/decoder component level; and
at system level with Android as the software platform.
ARM Side
DSP Side
B
Application
A
Audio ARM
Aricent
Codec
ARM Codec
Socket Node (LCML)
OpenMax
IL
LCML
Open Core
Framework
BIOS Bridge API
OMX
Master Core
XDM
Complaint
Aricent
720P
Video Codec’s
(Decoder &
Encoder)
Figure 10-6 – Component Architecture of Zoom2
Time gaps are measured at point A and B in figure 10-6 shows the time between before
and after each frame decode call. As shown in figure 10-7, a snapshot of the result on
Zoom2 board is depicted. The said buffer management scheme was implemented and
tested on the actual hardware platform. The points “A” and “B” marked in red as shown in
Figure 6, gives us the integrated system level performance. The architecture considers and
provides a way to handle interpolation of intermediate frames in an efficient manner. It
also has an extendible design to handle very complex decoding algorithms like correlation
based BME for motion estimation.
191
Figure 10-7 – Results shown on Zoom2 board using Heuristic Buffer Management Scheme
It extensively leverages the support provided by underlying platform by having a split
solution leveraging IVA2.2 and Cortex-A8 core. It emphasises effective utilisation of the
support provided by platform making a viable choice for handling blocking artefacts and
motion outliners. The technique is also effective at managing the nodes of the PVMF
framework and the player/author engine scheduling mechanisms [129]. The technique can
be viewed as a solution to the optimization problem for any multimedia framework like
gstreamer, dshow as most multimedia frameworks work on pipelining concept.
10.7
Performance Evaluation and Memory Requirements
In this section, results from the experiments to characterise the adaptation performance
approach is presented.
OpenMax compliant encoder/decoder components were used in this project. Figures 10-8
and 10-9, shows the memory requirements on DSP and Cortex RAMS. The tables within
figures 10-8 and 10-9 are the result from the experiment. The adaptation performance is
measured with respect to both codec sub-system level and at system level.
192
Figure 10-8 – DSP RAM requirements on OMAP
Figure 10-9 – Cortex RAM requirements on OMAP
Figure 10-10 illustrates the performance analysis and number of resolution types obtained
from the experiment. It shows that the proposed approach supports flexible adaptation for
multiple multimedia framework dimensions. The memory footprint results demonstrate
that the adaptation can cover a wide range of products and is fine grained. The
performance statistics and numbers for different resolution types are shown in
figure 10-10. The numbers show that the approach yields better output than benchmarked
by industry standards. The performance quoted is for the Xvid and DivX Video codecs in
Linux environment which also includes the system overheads for rendering and A/V sync
wherever applicable [124]. The performance shown is for medium motion, medium
complex sequences. The decoder bit rate factor and all decoder input bit streams are
generated at 30 fps - 4~5 Mbps to handle Xvid.
193
Benchmark Measurement Test (BMT) Report
Platform
Dem
o
DivX
(Mobi
le
Theat
re
Profil
e)
XviD
(Port
able
Profil
e)
10.8
Codec components
OMAP 3430 SDP ES 2.0
Resoluti
on
Bit
rate
(mb
ps)
Audio
Codec
+
OpenM
AX
Fra
me
Cou
nt
640*480
1.4
AAC
720*480
3.1
1280*72
0
Decoding performance measured at
SN (A)
DivX Decoder
(Mobile
Profile)
XviD Decoder
(Portable
Profile)
Decoding performance
measured at System (B)
IVA 2.2 @ 430 Mhz
Remarks
Averag
e
(m.
Secs)
Total
(Secs)
Peak
(m.
Secs)
Perfor
mance
(FPS)
Averag
e
(m.
Secs)
Total
(Sec
s)
Perfor
mance
(FPS)
1801
16
28
23
69
33
60
30
Demo with
A/V Sync
AAC
1502
16
24
23
62
33
50
30
Demo with
A/V Sync
2.2
-
1500
33
50
47
30
33
50
30
Only Video
Playback
720p for HD
Profile
1280*72
0
2.3
-
1377
34
47
51
30
33
46
30
Only Video
Playback
Covering
B-Frames
640*480
1.4
AAC
1801
16
28
23
69
33
60
30
Demo with
A/V Sync
720*480
3.1
AAC
1489
16
24
41
62
34
50
30
Demo with
A/V Sync
720*480
(Bframes)
3.1
AAC
1376
21
29
33
47
33
45
30
Demo with
A/V Sync
2.8
AAC
3574
20
73
39
49
34
120
30
Demo with
A/V Sync
1280*72
0
4.3
-
1485
34
51
61
30
34
50
30
Only Video
Playback
720p for HD
Profile
1280*72
0
(Bframes)
4.2
-
1239
32
40
72
31
40
50
25
Only Video
Playback
720p for HD
Profile
Figure 10-10 – Performance Analysis
Time Measurement
The Time gaps are measured at point A and B in Figure 6 shows the time between: before
and after each frame decode call. The Gettimeofday function provided by the underlying
platform is used for measuring time to ensure the accuracy of the measurement. The
decoding time gaps (DTG) in mili-seconds are summed across the multiple decode calls
which considers the minute delay possible in the system.
The decode time frame is calculated as,
Decode time frame (T) =
Σ DTG / no. of frames displayed
(10.1)
The above mentioned performance figures have two important points worth noting:
the overhead for rendering both audio and video in synchronisation is also
considered; and
194
the performance statistics also considers the boundary cases with minimum Iframes and considerable B-frames. This case is particularly important because bframe prediction involves more CPU time for decoding compared to p-frames.
The frames per second (fps) and average decoding time (ADT) are calculated using the
formulae below:
FPS = Frame Count / Total Decoding time (seconds)
(10.2)
Average Decoding Time (in ms) = (Total decoding Time in seconds * 1000) / Frame Count
(10.3)
Since the rate at which encoded data is received and given out at decoder is only available
dynamically, and then only a portion of the media content is known. Approximation of the
optimal time by considering a finite context, i.e. number of packets/frames, from the
packet sequence number and time stamps is calculated.
A related concern is the finite number of bits allocated in each of the buffers to store the
decoded data. Stated another way, to truly realise an optimal timing would require a buffer
size big enough to hold all of the decoded frames of a presentation, and enough bits in each
buffer to hold exactly one frame uniquely. From the experiment, the buffer management
implementation suggests the optimal number of buffers to be four (4) for the most realtime applications like video streaming.
10.9
Conclusions
In this chapter, the issue of enhancing video quality on Android through heuristic buffer
management scheme is presented. The existing buffer management schemes are ineffective
to achieve high end-to-end performance, especially for high definition content. That said, a
heuristic buffer management scheme was proposed and tested to ensure efficient
synchronisation through uniform buffer allocation in multimedia framework and the
processors of underlying platform. Subsequently, this chapter validates the method by
demonstrating performance improvement of media delivery of HD codecs like Xvid/Divx
on Zoom2 platform based on Android. In-line with these endeavours, a proof-of-concept
195
architecture extending the Android platform to accommodate a new buffer management
scheme is demonstrated. An experiment to playback HD 720 p content on Zoom2 was
performed to verify the approach.
Thus, it can be concluded from the experiment results that the system is effective at
improving the video quality significantly. A related aim of this chapter is to inform the
scientific community about the design in new environments by benchmarking the
performance achieved using the buffer management method. Observations from
experiments also confirmed that the memory and CPU utilisation is low enough to be
deployed over a wide spectrum of handheld devices. Future work includes verification for
real-time applications like video conferencing where delay plays a major role. It is planned
to extend this novel architecture on different processors like Intel Atom processor to cater
for 4G and mobile internet devices.
Whilst finalising this dissertation, it was confirmed that the Intel® and Google® will work
together to optimise future versions of Google's Android® mobile software for Intel’s
“Atom” processors, hoping to speed the development and time-to-market of future Intelpowered smartphones [130].
It should be noted that heuristic buffer management scheme is only a minor technological
enhancement for giants like Google and Intel to be used in their products. However, the
decision to invest into mobile sector for both giants means a diversification from a
traditional PC/Web market to smart phone band-wagon. This means that the development
for the modern mobile communication system will be boosted by research and
commercialisation. Thus, safe to say that the commercial potential is end-less.
196
Chapter 11
Conclusion
This dissertation is my technological journey of past ten years. Communication
technologies have evolved from wired to wireless with many emerging applications.
During this time, I have tried to cope with the selected few technologies and created a
series of solutions. These solutions are based on amalgamation of multiple wireless
technologies and software development tools. The result is a range of innovative, pervasive
and cost effective solutions.
Investigations presented in this thesis via several chapters were applied research in nature.
Each project was ‘cutting edge’ and technically challenging at the time of execution.
Following is the summary of the contributions made in the thesis:
The thesis is a collation of experimental projects involving design, development and
implementation of innovative and pervasive applications using emerging communication
technologies for highly mobile organisations. A secure wireless technology was
implemented at the Sydney Airport Corporation Limited (SACL); a secure on-site and offsite electricity meter reading solutions were implemented for the Hong Kong Electricity
Company (HEC); design and development of wireless food ordering system, use of an iPod
as a visitor’s personal guide and voice over internet protocol (VoIP) for student attendance
recording and retrieval application (SARRA) were implemented for the Box Hill Institute
(BHI); a new three layered packet switching media access control (PCMAC) framework
was developed with the quality of service mechanism, a new modular data link layer (MDALL) was developed for a multiple radio access technologies (RATs), digital living
network alliance (DLNA) enabled mobile terminals integrated with home gateway was
developed, an adaptive quality framework using heuristic buffer management scheme on
Android was developed to enhance video quality for smart phones for the Aricent Group.
Data Communications as its practised today is fairly sophisticated and requires practical
knowledge of subjects ranging from common-carrier offerings, to communications
processors, to regulatory matters. This field is really growing rapidly but considered in its
infancy with the kinds of networks and applications for data communication that are
predicted for the future. Thus, a new breed of professional with multiple skills sets is
197
becoming more important in the telecommunication and ICT industries, commerce and
Government, so called “Enterprise Communications Specialist”. Before a data
communications system can be properly designed, managers must specify such operational
demands as traffic routes, message volume, urgency, accuracy, and language (medium or
type of codes).
Network wide QoS is needed to deliver priority service to higher-paying customers.
Service providers want to use QoS as a basis for offering various classes of services to
different segments of mobile professional end-users and residential end-users with fixed
budget.
While capital spending continues to decline, many telecom manufacturers will restructure
their corporations, trim workforces, better manage their suppliers and inventories, identify
core competitive advantages and focus on operating efficiencies that will improve
profitability. Operating with voice and data channels on the same private line can lead to
significant economies.
In order to create any applications based on the new emerging technologies, it must be
innovative, cost effective, user-friendly and interactive. The ability for end users to design
their own applications will be the arrival of true multimedia applications that combine
voice, video and data features into a single customised application.
New business models needs to be developed that enable full use and return on investment.
Broadband 3G/4G wireless manufacturers and service operators are already restructuring
and repositioning themselves to prepare for the next wave of opportunities and crisis. As
people head toward increase in bandwidth, processing power, storage capacity, distributed
computing, untethered oral, visual and haptic interfaces and independent of location – use
of ICT will continue to evolve. The only constant will remain is the ability to cope with the
emerging communication technologies.
198
References
[1]
R. Foroohar, “The Other Bubble”, Newsweek, pp.19-22, May 28, 2001.
[2]
C. Hu, “Keys for future network industry growth”, China Times Business
Newspaper, June 29, 2001.
[3]
P. Morreale, K. Terplan (eds), CRC Handbook of Modern Telecommunications,
2nd ed. Florida, USA: CRC Press, 2010.
[4]
S.G. Glisic, Advanced Wireless Networks – 4G Technologies. West Sussex,
England: John Wiley & Sons, 2006.
[5]
J. Cheng, J. Tsy, H. Yu., “Boom and gloom in the global telecommunications
industry”, Technology in Society, 2002.
[6]
W. Lehr,
L.
McKnight,
“Wireless
Internet
access:
3G vs.
Wi-Fi?”
Telecommunications Policy, vol. 27, pp. 351-370, 2003.
[7]
N. Gandal et al., “Standards in wireless telephone networks”, Telecommunications
Policy, vol. 27, pp. 325-332, 2003.
[8]
N. Erasala, D. Yen, “Bluetooth technology: a strategic analysis of its role in
global 3G wireless communication era”, Computer Standards & Interfaces, vol.
24, pp. 193-206, 2002.
[9]
J. Haarsten, “Bluetooth-the universal radio interface for ad-hoc wireless
connectivity”, Ericsson Review, vol. 3, no. 4, pp. 1-5, 1998.
[10]
J. Wakefield, “Bluetooth: what is the potential? Analysts Disagree”, ZDNet UK
News, April 1999.
[11]
N. Wilkinson, Next Generation Network Services, New York: John Wiley & Sons,
2002.
[12]
A. Ghosh, R. Ratasuk, B. Mondal, N. Mangalvedhe, T. Thomas, “LTE-Advanced:
Next Generation Wireless Broadband Technology”, Wireless Communications,
vol. 17, no. 3, pp. 10-22, June 2010.
[13]
B. Li, Y. Qin, C.P. Low, C.L. Gwee, “A Survey on Mobile WiMAX”,
Communications Magazine, pp. 70-77, 2007.
[14]
L. Zhang, Y.Y. Wang, L. Huang, H.L. Wang, W.B. Wang, “QoS Performance
Analysis on Carrier Aggregation Based LTE-A Systems”, in the Proc.
International Conference on Communications, Circuits and Systems (ICCCAS),
pp. 253-256, July 2010.
199
[15]
S. Parkvall, A. Furuskar, E. Dahlman, “Next Generation LTE – LTE-Advanced”,
Ericsson Review, February 2010.
[16]
H. Gebauer, A. Gustafsso, L.Witell, “Competitive Advantage through Service
Differentiation by Manufacturing Companies”, Journal of Business Research,
February 2011.
[17]
M. Alasti and B. Neekzad, J. Hui and R. Vannithamby, “QoS over LTE &
WiMAX Networks”, Communications Magazine, vol. 48, no. 5, pp. 104–111,
May 2010.
[18]
S. Bajaj, L. Breslau, S. Shenker, “Is Service Priority Useful in Networks?”, ACM
Sigmetrics, 1998.
[19]
Y. Wang, K. I. Pedersen, P. E. Mogensen and T. B. Sorensen, “Carrier Load
Balancing Methods with Bursty Traffic for LTE-Advanced Systems”, in the Proc.
of the 20th International Symposium on Personal, Mobile and Radio
Communications, pp. 22-26, Sept 2009.
[20]
M. Fiedler, T. Hossfeld and P. Tran-Gia, “A Generic Quantitative Relationship
between Quality of Experience and Quality of Service”, Networks, vol. 24, pp. 3641, April 2010.
[21]
R. Stankiewicz, A. Jajszczyk, “A survey of QoE assurance in converged networks
- Recent Advances in Network Convergence”, Elsevier Magazine, vol. 55, no. 7,
pp. 1459-1473, May 2011.
[22]
P. H. Vu, X. Nhan, H. Seung-Hoon, “Service Class-Aided Scheduling for LTE”,
in the Proc. 13th International Conference on Advanced Communication
Technology, pp. 39-43, Feb 2011.
[23]
K. Wu, W. Liao, “On Service Differentiation for Multimedia Traffic in Multi-Hop
Wireless Networks”, Wireless Communications, vol 8, no. 5, 2009.
[24]
M. Volk, J. Sterle, U. Sedlar and A. Kos, “An Approach to Modelling and Control
of QoE in Next Generation Networks”, Communications Magazine, vol. 48, no. 8,
pp. 126-135, August 2010.
[25]
J. Wakefield, “3G: It’s a Standards Thing”, ZDNet UK News, August 2000.
[26]
N. Muller, Bluetooth Demystified. New York: McGraw-Hill, 2000.
[27]
J. Quinn, “Bluetooth, Dell Technology Brief”, Dell Corporate Communications,
Austin, Texas, USA, 2001.
[28]
D. Wisely, P. Eardley, L. Burness, IP for 3G: Networking Technologies for
Mobile Communications. New York: John Wiley & Sons, 2002.
200
[29]
N.
Nakajima,
Y.
Yamao,
“Development
of
4th
Generation
Mobile
Communication”, Wireless Communications & Mobile Computing, vol. 1, no. 1,
January 2001.
[30]
W. Mohr, R. Becher, “Mobile Communications beyond Third Generation”, In
Proc. of the 52nd Vehicular Technology Conf. (VTC), 2000.
[31]
D. Minoli, Telecommunications Technologies Handbook. Norwood, MA: Artec
House, 1991.
[32]
http://www.sydneyairport.com/SACL/, accessed several times since 2001.
[33]
SACL Trim Document Reference: M2003/06745.
[34]
R. Bates, D. Gregory, Voice & Data Communication Handbook, 5th ed. New
York: McGraw Hill, 2007.
[35]
Bluetooth SIG, Specification of the Bluetooth System Core, Version 1.1, 22
February 2001.
[36]
Bluetooth SIG, Specification of Bluetooth System Profiles, Version 1.1, 22
February 2001.
[37]
C. Gehrmann (ed.), “Bluetooth Security White Paper”, White Paper Revision
1.01, Bluetooth SIG, May 2002.
[38]
T. Müller, “Bluetooth Security Architecture”, White Paper, Revision 1.0,
Bluetooth SIG, July 1999.
[39]
W.K. Tam and V.N. Tran, “Multi-ray propagation model for indoor wireless
communications”, IEE Electronics Letters, vol. 32, no. 2, pp. 135-137, Jan. 1996.
[40]
W.K. Tam, K.J. Patel and V.N. Tran, “Developing wireless application of secure
electricity meter reading using Bluetooth”, in the Proc. International Conference
on Computer Communication and Controls Technologies: CCCT’04, August 1417, Austin, Texas – USA, vol. 7, pp. 23-27, 2004.
[41]
S.C. Yuen and P.K. Yuen, “PDAs as Educational Power Tools”, Tech Directions,
p. 14, April 2003.
[42]
C.
Branigan,
Wireless,
handheld
solutions
prevail
at
NECC
2001,
http://www.eschoolnews.com/news/showStory.cfm?ArticleID=2865, 10 January
2007.
[43]
Z. Dejin, G. John, and H. John, “Generating mobile device user interfaces for
diagram-based modelling tools”, in Proc. 7th Australasian User Interface
Conference (AUIC2006), Hobart, Australia, vol. 50, pp. 91-98, 16-19 January
2006.
201
[44]
F. Sittig et al, “Techniques for identifying the applicability of new information
management technologies in the clinical setting: An example focusing on
handheld computers”, Journal of the American Medical Informatics Association,
pp. 804-808, 2000.
[45]
C. Aaron, S. Sunil, and T. Peter, “Development of a personal digital assistant
(PDA) based client/server NICU patient data and charting system”, in the Proc.
AMIA Symp, pp. 100-104, 2001.
[46]
J. Waycott, and A. Kukulska-Hulme, “Students' experiences with PDAs for
reading course materials”, Personal and Ubiquitous Computing, vol. 7, no. 1, pp.
30-43, 2003.
[47]
T.A. Yang and R.F. Grove, “Web-Based Application Development Course for the
Computing Curricula 2001/NC3 Track”, in Proc. Eleventh International World
Wide Web Conference, Hawaii, 2002.
[48]
R.G. Duncan and M.M. Shabot “Secure remote access to a clinical data repository
using a wireless personal digital assistant (PDA)”, in the Proc. American Medical
Informatics Association Symposium, pp. 210-214, 2000.
[49]
Y. Xiang, W. Zhou and M. Chowdhury “Toward pervasive computing in
restaurant”, in the Proc. First International Conference on E-Business and
Telecommunication Networks (ICETE 2004), Setubal, Portugal, pp. 312-317,
2004.
[50]
V. Stanford, “Pervasive Computing Puts Food on the Table,” IEEE Pervasive
Computing, vol. 2, no. 1, pp. 9-14, 2003.
[51]
R. Bellamy, C. Swart, W.A. Kellogg, J. Richards and J. Brezin, “Designing an egrocery application for a palm computer: Usability and interface issues”, IEEE
Personal Communications, vol. 8, no. 4, pp. 60-64, August 2000.
[52]
M. Prasad, E. Scornavacca and H. Lehmann, “Using wireless personal digital
assistants in a restaurant: impact and perceived benefits”, in the Proc.
International Conference on Mobile Business, vol. 00, pp. 69-75, 2005.
[53]
PocketMate,
http://www.ordermate.com.au/products/pocketmate.html,
22
February 2007.
[54]
F.
Turiso
and
J.
Case,
“Wireless
and
Mobile
Computing”,
http://www.dir.state.tx.us/pubs/wireless/wireless.html, 10 January 2007
202
[55]
P. Turner, G. Milne, M. Kubitscheck, I. Penman and S. Turner, “Implementing a
wireless network of PDAs in a hospital setting”, Personal and Ubiquitous
Computing, vol. 9, no. 4, pp. 209-217, 2005.
[56]
V. Lee, H. Schneider and R. Schell, Mobile Applications: Architecture, Design
and Development. New Jersey: Prentice Hall, 2004.
[57]
K. Read and F. Maurer, ‘Developing Mobile Wireless Applications”, IEEE
Internet Computing, vol. 7, pp. 81-86, 2003.
[58]
P. Hawking, A. Stein, P. Sharma, D. Nugent, L. Dawson and S. Foster;
“Emerging Issues in Location Based Tourism Systems”; in the Proc. the
International Conference on Mobile Business (ICMB’05), IEEE, 2005.
[59]
Y. Chen, Z. Yan, J. Huang, I. Peng and J. Zhan, “Implementation of PDA/GPS
based development platform and its applications in native education”; in Proc.
IEEE 2002 International Conference Communications, Circuits and Systems and
West Sino Expositions, vol. 2, pp. 1556 – 1560, 2002.
[60]
Apple Computers, http://www.apple.com, February 15, 2006.
[61]
K. Cheverst, et al. “Developing a Context-aware Electronic Tourist Guide: Some
Issues and Experiences”, in Proc. of CHI 2000, The Hague, ACM Press, pp. 1724, 2000.
[62]
D. Clark and S. Walsh, iPod learning. Brighton, UK: Epic Group, 2004.
[63]
Duke University, “Duke iPod first year experience”, http://www.duke.edu/ipod/,
17 February 2006.
[64]
Tourism
Australia,
Annual
Report
2009-201,
http://www.tourism.australia.com/en-au/aboutus/5172.aspx, 26 March 2011
[65]
Physorg,
“Portable
Tourist
Guide
now
on
Service”,
http://www.physorg.com/news10338.html, February 19 2005.
[66]
Audio, “In technologies and learning”, Scottish Council for Educational
Technology, Glasgow, pp. 24-25, 1994.
[67]
Tourism
“Visitors
Australia,
Arrival
http://www.tourism.australia.com/Research.asp?sub=0318&al=2100,
February 2006.
[68]
www.ipodlinux.org, 22 February 2005.
[69]
www.rockbox.org, 22 February 2005.
[70]
www.sourceforge.com, 22 February 2005.
203
Data”,
19
[71]
S. Devadoss, “Evaluation of factors influencing student class attendance and
performance”, American Journal of Agricultural Economics (USA), vol. 78, no. 3,
pp. 499-507, 1996.
[72]
R. Le May, “Vic TAFEs embracing VoIP”, ZDNet Australia 2006,
http://www.zdnet.com.au/news/communications/soa/Vic-TAFEs-embracingVoIP/0,130061791,139267152,00.html, 02 May 2007
[73]
D. Deel, M. Nelson, A. Smith, “Developing Cisco IP Phone Services: A Cisco
AVVID Solution”, Cisco Press, 2002.
[74]
Attendance Manager, http://www.phonetop.com/phonetop3.nsf/products_k-12, 02
May 2007.
[75]
Selected
by
DE&T
for
the
2003
Victorian
school
trial,
http://www.siriuslogic.com.au/, 02 May 2007.
[76]
Student Attendance, http://www.siriuslogic.com.au/attendance.htm, 02 May 2007.
[77]
“Definition of ASP”,
http://help.websiteos.com/websiteos_en/definition_of_asp.htm, 16 May 2007.
[78]
J. Webb, “Developing Web Applications”, Microsoft Press, 2003.
[79]
“Overview
of
Visual
Basic
2005”,
http://en.wikipedia.org/wiki/VB.NET#Visual_Basic_2005_.28VB_8.0.29, 30 May
2007
[80]
“VB.NET
vs.
Java
Comparison”,
http://help.websiteos.com/websiteos_en/definition_of_asp.html, 30 May 2007
[81]
C. Yeh, “ACENET: architectures and protocols for high throughput, low power,
and QoS provisioning in next-generation mobile communications,” in Proc. IEEE
PIMRC 2002, vol 2, pp. 779 -786, 2002.
[82]
B. Sadeghi, V. Kanodia, A. Sabharwal, and E. Knightly, “Opportunistic media
access for multirate ad hoc networks,” in Proc. ACM MOBICOM ’02, Atlanta,
GA, September 2002.
[83]
O. Sallent, J. Romero, R. Agusti, F. Casadevall, “Provisioning multimedia
wireless networks for better QoS: RRM strategies for 3G W-CDMA,” IEEE
Communications Magazine, vol. 41, no. 2, pp. 100 -106, February 2003.
[84]
S. Lu, V. Bharghavan, R. Srikant, “Fair scheduling in wireless packet networks,”
IEEE/ACM Transactions on Networking, vol. 7, no. 4, pp. 473-489, August 1999.
204
[85]
V. Huang, W. Zhuang, “QoS-Oriented access control for 4G multimedia CDMA
communications,” IEEE Communications Magazine, vol. 20, no. 3, pp. 118-125,
March 2002.
[86]
G. Holland, N. Vaidya, and P. Bahl, “A rate-adaptive MAC protocol for multi-hop
wireless networks,” in Proc. ACM MOBICOM ’01, pp. 236-251, August 2001.
[87]
R. Cusani, F. D. Priscoli, G. Ferrari, M. Torregiani, “A novel MAC and
scheduling strategy to guarantee QoS for-the new-generation WINDFLEX
wireless LAN,” IEEE Wireless Communications Magazine, vol. 9, no. 3, pp. 4656, June 2002.
[88]
El Gamal, C. Nair, B. Parabhakar, E. Uysal-Biyiklioglu, S. Zahedi, “Energyefficient scheduling of packet transmissions over wireless networks,” in Proc.
IEEE INFOCOM 2002, vol. 3, , pp. 1773 -1782, 2002.
[89]
P. Bisaglia, F. Boccardi, V. D’Amico, M. Moretti, B. Scanavino, D. Veronesi,
“On the capacity improvement of multiuser access techniques for fourth
generation cellular TDD OFDM based systems”, IEEE, 2005.
[90]
A. Hongwei Yang, “A Road to Future Broadband Wireless Access: MIMOOFDM based air interface”, Communications Magazine, January 2005.
[91]
R. Prasad, OFDM for Wireless Communication Systems. USA: Artec House
Universal Personal Publication Series, 2004.
[92]
Wireless World Research Forum, The Book of Visions 2001, Visions of the
Wireless World, http://www.wireless-world-research.org, December 2001.
[93]
IEEE Computer Society LAN MAN Standards Committee, “Draft IEEE Standard
for Local and Metropolitan Area Networks: Media Independent Handover
Service”, In IEEE P802.21/D00.01, July 2005.
[94]
WWI Ambient Networks, http://www.ambient-networks.org, 14 March 2008.
[95]
The GOLLUM-project, http://www.ist-gollum.org, 05 March 2008.
[96]
N. Niebert et al, “Ambient Networks Research for Communication Networks
Beyond 3G”, in the Proc. 13th IST Mobile and Wireless Communications- Summit
2004, June 2004.
[97]
J. Sachs, “A Generic Link Layer for Future Generation Wireless Networking”, in
the Proc. IEEE International Conference on Communications (ICC’03), pp. 134138, May 2003.
[98]
J. Sachs, A. Schieder, “Generic link layer”, 5th Meeting of the Wireless World
Research Forum, March 7-8, 2002, Tempe, Arizona, USA.
205
[99]
J. Sachs, “A generic Link Layer for Future Generation Wireless Networking”,
IEEE ICC, vol. 2, pp. 834 -838, 2003.
[100]
“Open source release of the Unified Link-Layer API”, http://ulla.sourceforge.net/,
04 April 2008.
[101]
G. P. Koudouridis et al, “Generic Link Layer Functionality for Multi-Radio
Access Networks”, IST Mobile and Wireless Communications Summit 2005, 2005
[102]
K. Dimou et al., “Generic Link Layer: A Solution for Multi-Radio Transmission
Diversity in Communication Networks Beyond 3G”, VTC, 2005.
[103]
M. Siebert, “Design of a Generic Protocol Stack for an Adaptive Terminal”, in
Proc. of the 1st Karlsruhe Workshop on Software Radios, Karlsruhe, Germany,
pp.31-34, March 2000
[104]
L. Berlemann, A. Cassaigne, B. Walke, “Modular Link Layer Functions of a
Generic Protocol Stack for Future Wireless Networks”, in Proc. of Software
Defined Radio Technical Conference, Phoenix USA, November 2004.
[105]
A. Cassaigne, “Design and Evaluation of Protocol Functions for the Data Link
Layer of a Generic Protocol Stack”, Diploma Thesis, Aachen University
(RWTH), 2004.
[106]
A.Wolisz and A. Festag (eds), “Optimization of Handover Performance by Link
Layer Triggers in IP-Based Networks; Parameters, Protocol Extensions, and APIs
for
Implementation”,
Telecommunication
Networks
Group,
Technische
Universitat Berlin, Tech. Rep., July 2002.
[107]
Gustafson and A. Jonson, “Always best connected”, Wireless Communications,
vol. 10 , no. 1, pp. 49-55, 2003.
[108]
“DLNA Home Networked Device Interoperability Guidelines version 1.0”,
Digital Living Networking Alliance, June 2004.
[109]
“DLNA Networked Device Interoperability Guidelines Expanded”, Digital Living
Networking Alliance, March 2006.
[110]
G. Pekhteryev, F. Matsubara “Content Aware Media Server for Multimedia Home
Network”, in Proc. IEEE Consumer Communications and Networking Conference
(CCNC), January 2007.
[111]
Y. Rasheed, J. Ritchie, “High-quality media distribution in the digital home”, Intel
Technology Journal, vol. 6, pp. 17-29, November 2002.
[112]
“UPnP AV Architecture V.83”, UPnP Forum, http://www.upnp.org, June 2002.
206
[113]
“Universal
Plug
and
Play
Forum:
UPnP
QoS
Architecture
1.0”,
http://www.upnp.org, March 2005.
[114]
D. Kang, K. Kang, S. Choi, J. Lee, “UPnP AV architectural multimedia system
with a home gateway powered by the OSGi platform”, in Proc. ICCE 2005,
pp.87-93, January 2005.
[115]
D. Kim, J. Lee, W. Kwon, I. Yuh, “Design and implementation of home network
system using UPnP middleware for networked appliances”, IEEE Trans.
Consumer Electronics, vol. 48, pp. 963-972, November 2002.
[116]
S. Choi, D. Kang, J. Lee, “An UPnP based Media Distribution System supporting
QoS in a Converged Home Network”, in Proc. Network Operations and
Management Symposium, Vancouver, pp., 1-4, 2006.
[117]
D. Qiu, “On the QoS of IPTV and its Effects on Home Networks”, in Proc.
Consumer Communications and Networking Conference (CCNC 2008), January
2008.
[118]
J. Guo, J. Zhang, W. Chen, “A dynamic QoS algorithm for wireless AV home
networks”, in Proc. Advanced Communication Technology (ICACT 2006),
vol.
3, pp. 20-22, February 2006.
[119]
S. Ando, M. Ohmoto, Y. Shimizu, “QoS technology for home networks”, in Proc.
Consumer Communications and Networking Conference (CCNC 2004), January
2004.
[120]
N. Goeminne, K. Cauwel, F. De Turck, B. Dhoedt, “Deploying QoS sensitive
services in OSGi enabled home networks based on UPnP”, in Proc. the 2006
International Conference on Internet Computing (ICOMP 2006), June 2006.
[121]
S. Moyer, A. Umar, "The impact of network convergence on telecommunications
software", Communications Magazine, vol. 39, no. 1, pp. 78-84, January 2001.
[122]
http://www.xvid.org/News.64.0.html?&cHash=0170b4e439&tx_ttnews[backPid]
=64&tx_ttnews[tt_news]=7, 22 September 2009.
[123]
Google, http://www.Android.com/, 22 September 2009.
[124]
http://elinux.org/Android_on_OMAP, 22 September 2009.
[125]
https://omapzoom.org/gf/download/docmanfileversion/40/850/BeginnersGuideAndroidonOmapZoom.pdf, 22 September 2009.
[126]
W. Enck, M. Ongtang, P. McDaniel, "Understanding Android Security", Security
& Privacy, vol 7, no 1, pp. 50-57, 2009.
207
[127]
S. Wolf, M. Pinson, “Video Quality Measurement Techniques”, NTIA Report 02392, June 2002.
[128]
A. Webster, C. Jones, M. Pinson, S. Voran, S. Wolf, “Objective video quality
assessment system based on human perception”, in Proc. of SPIE, 2003
[129]
Y. Yang, S. Hemami, “Generalized rate-distortion optimization for motioncompensated video coders,” Circuits and Systems for Video Technology, vol. 10,
pp. 942-955, September 2000.
[130]
Reuters,
“Android
to
run
on
Intel
processors”,
http://timesofindia.indiatimes.com/tech/news/hardware/Android-to-run-on-Intelprocessors/articleshow/9977156.cms, 14 September 2011.
208
Appendix A – FIWOS System Installation Procedure, User Manual and
Source Codes
Appendix A is provided on the compact disc attached with this dissertation. Appendix A
contains the following:
1.
Back-End Application Installation
2.
Web Server Installation in Windows XP Pro
3.
Configuration of Wireless Access Point 1200 to Default Settings
4.
PDA Configuration for the Front-end
5.
Setting a wireless Brother® printer
6.
PDA Ordering System
7.
User Manual for the Back-end Application
8.
Program structure for the FIWOS source codes is provided below:
The FIWOS software is made up of several files, each of which performing a particular
function within the application. These files are grouped into three categories; the main
directory, and the sub-directories “Components” and “Database”. The program files are
grouped into these categories using the following directory structure:
The following is a list of source code files and their relative directory for the FIWOS
software:
Filename
TableSummary.php
OrderSummary.php
AddMeals.php
AddDrinks.php
EditItem.php
Type
PHP Script
PHP Script
PHP Script
PHP Script
PHP Script
209
Directory
Main Directory
Main Directory
Main Directory
Main Directory
Main Directory
Database.php
EditOrder.php
Scripts.php
PrintTest.php
VarHandlerPost.php
VarHandlerGet.php
Fiwos.js
Fiwos.css
PHP Script
PHP Script
PHP Script
PHP Script
PHP Script
PHP Script
JavaScript
Cascade Style Sheet
Components
Components
Components
Components
Components
Components
Components
Components
Fiwos.mdb
Access Database
Database
210
Appendix B - VoIP SARRA Source Codes and Cisco XML Objects
Appendix B is provided on the compact disc attached with this dissertation. Appendix B
source codes are arranged as shown below:
1.
Background Code (Non-Interface)
2.
Splash Screen
3.
Login Menu
4.
Login Screen
5.
Class Selection Menu
6.
Class Submit/Update Menu
7.
Student Insert Input
8.
Student Update Input
9.
Login Help
10.
Login Help 2
11.
Insert DB (Non-Interface)
12.
Update DB (Non-Interface)
13.
Replica Database Configuration
14.
Cisco XML Objects
15.
Alternative Menu
211