1
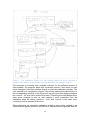
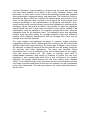
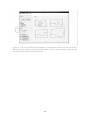
UPTEC STS 14029 Examensarbete 30 hp November 2014 FlyTracker: Design and Implementation of an Interactive Motion Tracking System Kristian Johansson Abstract FlyTracker: Design and Implementation of an Interactive Motion Tracking System Kristian Johansson Teknisk- naturvetenskaplig fakultet UTH-enheten Besöksadress: Ångströmlaboratoriet Lägerhyddsvägen 1 Hus 4, Plan 0 Postadress: Box 536 751 21 Uppsala Telefon: 018 – 471 30 03 Telefax: 018 – 471 30 00 Hemsida: http://www.teknat.uu.se/student At the department of neuroscience at Uppsala University one of the research groups are working with motion vision. Motion vision is how seeing animal species process moving objects in their visual fields and how they experience self motion by generating an optic flow. This is important for animals of all sizes, everything from large mammals to insects. At the neuroscience department at Uppsala University they are using flies in their research as these are easier to work with than larger animals. Behavioral output as a result of visual stimuli is what is studied in the project I have been involved in as a part of this thesis. This is done by a track ball setup. The setup consists of a cup with a light plastic ball in it, from the bottom of the cup light airflow is added to reduce friction between the ball and the cup. A fly is tethered on top of the ball in such a way that when the fly is trying to walk the ball instead rotates accordingly. The ball rotation can then be measured by two sensors, both of which have been extracted from an optical mouse. There is no available, ready-made, software for reading the raw mouse data from the two sensors and from that input reconstructs the virtual movement path of the fly using. Therefore the purpose of this thesis has been to design and implement a user friendly and functional software system that fulfill this requirement. The design was done according to the principles of user-centered system design although with less formal documentation. This proved to generate a very good result. The end-users were included in every phase of the development process and it really was a huge advantage for the development process. Although all of the methods made available by the theories were not followed religiously, especially regarding documentation, that just displayed the power of agile methods were quality is more important than documentation. And the evaluation at the end of the project showed that the level of usability was high. Handledare: Karin Nordström Ämnesgranskare: Iordanis Kavathatzopoulos Examinator: Elísabet Andrésdóttir ISSN: 1650-8319, UPTEC STS 14029 Sammanfattning På avdelningen för neurovetenskap på Uppsala universitet finns en forskningsgrupp som studerar rörelsesyn. Rörelsesyn är hur seende djurarter processerar rörliga objekt i deras synfält eller hur självrörelse uppfattas genom att generera ett optiskt flöde. Detta är viktigt för djurarter av alla olika storlekar, allt från människor och andra däggdjur till insekter. På Uppsala universitet forskar man på flugor eftersom det är lättare än att studera större djur. Beteende är ett av flera områden som är intressant att studera och i det forskningsprojekt som jag har varit en del av används datormöss som rörelsesensorer för att rekonstruera flugors rörelsebanor. Detta görs genom en så kallad ”track ball setup”. Konstruktionen består av en lätt plastboll som placeras i en bägare av proportionerlig storlek med ett lätt luftflöde från botten av bägaren. Luftflödet gör att friktionen mellan bollen och bägaren reduceras kraftigt. En fluga fixeras sen på toppen av bollen på ett sådant sätt att den kan röra benen fritt och när den försöker gå så börjar istället bollen rotera. Denna rotation kan sedan mätas upp av två datormöss. Det finns inte tillgänglig mjukvara som kan läsa in musdatan och räkna om denna till en fiktiv rörelsebana motsvarande flugans rörelse. Så syftet med detta projekt var att designa och implementera ett användervänligt interaktivt system som fyller dessa krav. Utvecklingen skedde enligt principerna bakom agil användarcentrerad system design. Det visade sig fungera utmärkt i detta fall. Slutanvändarna var involverade i alla steg I processen vilket var en stor fördel. I synnerhet visade det sig att den informella kontakten man kunde ha, när man som designer och utvecklare jobbade på samma fysiska plats som användarna, vara ovärderlig. Alla verktyg som användarcentrerad system design erbjuder användes inte kategoriskt, i synnerhet så producerades inte alla dokument som föreslås. Men det visar bara på kraften bakom den agila metodiken där kvalitet prioriteras och dokumentation går i andra hand. Utvärderingen i slutet av projektet visade också att användarvänligheten var hög även om det fanns mindre brister också. Den främsta bristen var att användaren tappar kontroll över muspekaren när experiment pågår eftersom flugan då är placerad på bollen och när den rör sig så rör sig också muspekaren. 1 Abbrevations GUI – Graphical User Interface HCI – Human-Computer Interaction CRT – Cathode Ray Tube 2 Table of contents 1. Introduction .................................................................................................................. 5 2. Background ................................................................................................................. 6 2.1 Motion vision at Uppsala University .................................................................. 6 2.2 Agile software development ............................................................................... 8 2.3 Adding user-centered practices ......................................................................... 8 2.3.1 Process structure ..................................................................................... 9 2.3.2 Phase 0 ..................................................................................................... 9 2.4 Usability ............................................................................................................... 10 2.5 Evaluating usability ............................................................................................ 11 3. Purpose and methodology ...................................................................................... 13 3.1 Purpose ............................................................................................................... 13 3.2 Choice of development process ...................................................................... 13 3.3 Implementation ................................................................................................... 13 3.4 Evaluation ........................................................................................................... 14 4. User-analysis and system design .......................................................................... 15 4.1 Requirements engineering ............................................................................... 15 4.2 Designing for usability ....................................................................................... 16 5. Implementation ......................................................................................................... 20 5.1 The Python module............................................................................................ 20 5.1.1 DAQ.py .................................................................................................... 20 5.1.2 Trigger ..................................................................................................... 21 5.2 The Matlab module ............................................................................................ 22 5.2.1 Model ....................................................................................................... 22 5.2.2 View ......................................................................................................... 23 5.2.3 Data ......................................................................................................... 24 6. Results ....................................................................................................................... 25 6.1 FlyTracker ........................................................................................................... 25 6.2 Evaluation ........................................................................................................... 27 7. Discussion ................................................................................................................. 29 7.1 Analysis and design........................................................................................... 29 7.2 Implementation ................................................................................................... 30 7.3 Evaluation ........................................................................................................... 30 8. Conclusion ................................................................................................................. 31 3 8.1 Issues................................................................................................................... 31 8.2 Future development ........................................................................................... 32 8.3 Concluding remarks ........................................................................................... 32 4 1. Introduction When designing a completely new software system there are many factors to consider. One of the most important ones is needs for the future end users. This is especially true for systems aimed a small group of users as it will provide the possibility to tailor make the software system to a much greater extent, due to the simple reason that there are fewer needs to accommodate. Depending on the background of the end user, restrictions can be put on the software system and demands might vary greatly. As a result of this, involving the user in the actual software development process can produce a superior software system. The option to involve the user in the entire process might not always be available, but if so, the user may be an invaluable asset in the software development process (Benyon 2010). Motion vision is very important for any seeing animal species. Motion vision is, for example, used to track moving targets or to estimate self motion from optic flow (Borst and Euler 2011). Getting a better understanding of motion vision is also important for developing robot vision found in advanced autonomous technology, such as self driving cars, air planes and different kinds of robots. Learning how motion vision is processed in for example insects is particularly interesting as they apparently process this rapidly despite having very limited brain capacity. Using insects for motion vision research is also easier than using vertebrates. Surprisingly enough, certain insects code for motion vision in a fairly similar manner as vertebrates do (Department of Neuroscience 2014). 5 2. Background 2.1 Motion vision at Uppsala University At the motion vision lab in the department of neuroscience at Uppsala University hoverflies are used for research. The project that I was involved in with this master thesis is focused on behavior research on hoverflies. The purpose of the experiments are to study the walking behavior of the flies as a function of different moving visual stimuli and in return get a deeper understanding of motion vision in flies. The main user of the experimental setup that was created for the project is a PhD-student who uses the setup for her research which will eventually be a part of her PhD thesis. There are different methods for studying behavior of hoverflies, for example you can film a fly's movement in a contained area while presenting visual stimuli to it and then do image analysis of the recorded material to get the behavioral data. A more novel and simpler technique is using a trackball setup to generate a virtual movement path. The advantage of this compared to filming the fly is that the data is a lot easier to retrieve while the disadvantage is that you cannot record flying behavior. However, depending on the experiment design flying behavior might not be needed. Trackball setups are frequently used for behavioral research and not only for flies (Takalo et al 2012) but could potentially be used for any kind of animal as long as the setup size is scaled accordingly. The setup (figure 1) in this project is built by using two optical sensors extracted from two high quality gaming mice. These are held in place in such a way that they are perpendicular to each other and aimed at the center of a cup where a light plastic ball is placed. Using light airflow streamed from the bottom of the cup the ball is hovering slightly to reduce friction to the minimum, and therefore it is very easy to spin, which is necessary for the fly to be able to rotate the ball using its legs. The fly itself is tethered so that it hangs low enough to be able to walk on the ball and high enough not to be pushed into it. Thus, when the fly is trying to walk it will not move but rather the ball will move and this can then be used to reconstruct the fly’s walking behavior. Furthermore, the fly is directed at a CRT monitor, which in the experiment is going to be used for showing visual stimuli. 6 Figure 1 – Blueprint for the trackball setup, the mouse sensors are on the circuit cards placed directly next to the ball perpendicular to each other. The fly will be tethered on top of the ball (Imperial College, London). As the fly is tethered and standing on a ball it cannot fly. It has three degrees of movement; it can translate in two dimensions namely thrust (walking forward) and sideslip (walking sideways). The third dimension of movement is yaw rotation (rotation on the spot in the x-z-plane). On the display monitor different kinds of visual stimuli will be shown and the movement of the fly will be recorded using the setup described above. The two mouse sensors on the trackball setup are used as simple motion detectors. The horizontal component of each mouse sensor (parallel to the x-z-plane in fig 1) will be used to measure yaw rotation, while the vertical components (parallel to the y-axis in fig 1) will be used to calculate translation. For this setup there was a need for software that can read the raw mouse data and decode these to the fly’s virtual delta movement coordinates. As there were little to none ready-made and available software alternatives for this purpose a new software system needed to be developed. 7 2.2 Agile software development Agile software development process is the name of software development methods that follow some certain guidelines for how he work should be performed. They are also considered to be the opposite of the other large group of software development methods, i.e. plan based processes (Beyer 2010). In plan-based methods, for example the waterfall model, all activities need to be planned and scheduled extensively before they are started. This process type has its advantages but is better suited for software that will not be used in a changing environment or in a safety-critical system, where they are essential (Sommerville 2010). In other words plan-based processes are much more sensitive to change either from the stakeholders or in the work environment. In contrast to this, trademarks of the agile methodology are rapid design, development and releases of working prototypes, welcoming changes in customer requirements, and a lot of informal face-to-face communication. Agile methods are basically the opposite of plan-based methods and the rapid releases make them more robust and not as sensitive to changing requirements (Paulk 2002). Agile methods were developed since plan based methods had poor performance. Large projects were planned ahead of time and during the project requirements changed and time schedules were too tight, which in the end lead to abandoned projects because it was not worth trying to update or restart the process (Beyer 2010). In many of the agile methodologies, for example Scrum, work is divided into shorter sprints. Sprints are initialized by choosing requirements to implement during that sprint. These requirements are then frozen for that time and when the sprint is over these should be fully implemented and testable. At the end of each sprint an evaluation session is held where the customer can test the working prototype and give feedback on the project. During this session there is potential for adding, removing or updating requirements, along with changing customer demands (Beyer 2010). 2.3 Adding user-centered practices Integrating user centered practices to the agile methodology will create an even more powerful development process. The definition of user-centered system design is user-involvement, as much as possible, throughout the entire process. Early on in the development process the goals of the user, the work environment and the work practices should be taken into account. Explicit design activities must take place and be done iteratively. Evaluation and testing of the design in the beginning before there is any working code can be done through prototyping. As the involved user often lacks knowledge of software engineering any documentation should be done in a notation that both the developers and the users can understand. Creating formal documentation is therefore not a goal in itself, much like the ideas behind agile software development (Benyon 2010). Finally a user-centered attitude should inspire the entire process and not be just a part of the early design phase (Göransson, Gulliksen 2002). 8 2.3.1 Process structure A suggestion for structure (figure 2) of an agile user centered systems design starts with a initial phase called “phase 0”, followed by the “release planning phase” and ending with a number of sprints (Beyer 2010). Figure 2 – A typical user-centered system design process. The release planning phase is basically just the phase where the sprints are allocated requirements or user stories. Sprints are repeated over and over again until the project is completed (Beyer 2010). 2.3.2 Phase 0 One of the first things to do in the initial phase is to start the user analysis. According to Beyer (2010) the best way to extract the necessary information about the user is simply to talk to them in their work environment. There are a few issues regarding communication with the users that are brought up by Beyer (2010) which the design team needs to be aware of. The first issue is that users are generally not good at describing their work process. Although they are domain experts, and know what they are doing they still might not be able to articulate what they are doing. A way around this issue is to observe the user in their work process, this way information they themselves had not thought of may surface (Lauesen 2005). The second issue is that users want to be nice and helpful and therefore not report major issues with a system that is already far into the development process. Availability is the third issue, the end users will be busy doing and therefore might not be available for meetings whenever the design team needs one. However, if it is possible the user should actually be considered a part of the design team to optimize the design (Beyer 2010). These are just a few of the issues that can arise and many of the others are mainly applicable when the system under development is an off-the-shelf product. Solving these issues will produce a better end result (Beyer 2010). There are many design activities that can take place during “phase 0”. A more formal user analysis tool is the contextual inquiry. This means that the design team performs an analysis of the end-user by observing them doing their actual work and seeing in what manner they perform these tasks. This is called a contextual interview. In this phase, design of the system is not in focus, but rather what the working environment looks like and how work generally is done in this particular context. The objective is not to look for problems but rather to understand the users and their needs (Beyer 2010). Using prototypes provide the user with a clear description of what the final interface is going to look like early on in the design phase. Prototypes are also 9 letting the user try navigating the interface, whether the designer is using lowtech prototypes such as paper prototypes or via some prototyping software creating an interactive interface without its actual functionalities. If the case is the former the designer can use post-it notes as pop-ups and cover invisible parts with paper and removing it as the user makes them visible by interacting with it. Paper prototypes are a good tool for giving the user a sense of the look and feel of the future system, without actually having to program a GUI. This makes it easier to do major changes to the structure of the GUI. As the project moves on these simple prototypes will not be sufficient. However, as the actual GUI is produced, the user can give feedback relating to the actual GUI instead (Benyon 2010). In the release planning phase the sprints are planned. First, the length of the sprints needs to be decided and this can vary depending on the size of the overall project. Implementation time is estimated for each requirement and when this is done each individual requirement can be allocated to a sprint. The cost estimation is a good way to divide the work evenly between the sprints (Beyer 2010). Each sprint starts with the development team planning the work for the current sprint. Although a work plan has been set up in the release planning phase it is still important to make sure that plan still is applicable. The early sprints will most likely not have changed that much from the original plan but later on as requirements change, sprint plans will change as well. As requirements can change over the course of the sprints programmers holiday are also added to the schedule. A programmer’s holiday just means some extra time added in case requirements are taking longer than expected (Beyer 2010). 2.4 Usability Usability is a very important concept of human-computer interaction and is a measurement you can use in an evaluation of a system’s user friendliness. Usability means that usage of the system should require as little effort as necessary when performing the tasks needed. The system should provide the user with necessary information and be organized in a natural way in the GUI (Benyon 2010). A short learning curve is also a feature of a system with high usability. Design principles are important tools for shortening the learning curve. Design principles are artifacts that are often found in similar systems that are easy to recognize for the users. This means simple artifacts such as “undo”-/”redo”buttons, “back”-buttons for navigating, and generally just placing interface items where they would be expected to reside in a similar system (Benyon 2010). Lausen (2005) defines six factors as definition of what usability is. The first one is “fit for use”, which basically means that the system can perform the needed tasks. The second one is “ease of learning”. The third one is task efficiency which means that the system provides efficient solutions for tasks. The remaining three are “ease of remembering”, “subjective satisfaction” and finally “understandability”. 10 Emphasis on usability tends to diminish in the software process for two main reasons. One is caused by the fact that the customer rarely specifies that they want a usable software system (they think it is implied). When the company delivers the finished software it may not be as user friendly as the customer might have expected (Gulliksen and Göransson 2004). Another issue that might arise is that usability experts normally only actively participate in the early parts of the software development process and not necessarily in the implementation and testing phase, since they are rarely software developers. One way to solve this is to have HCI experts that know enough programming to be able to participate actively in the implementation phase in particular, but also in the validation phase, where system requirements are validated (Gulliksen and Göransson 2004). 2.5 Evaluating usability A concrete method for evaluating a software system is by a user review. This means that the designer goes through the system with an expert user, and the user talks about the different tasks and whether there are problems with the presented solution or not. While this will give the developer a good grasp of the issues with the usability of the system the ease-of-use problems might not be discovered as an expert user can have learnt how to work around these issues (Lingaard 1993). Nielsen’s (1994) usability heuristics can be used as guidelines when evaluating a system’s or a prototype’s level of usability. The heuristics are: - Visibility of system status, which means that the system should always let the user know the current status of the system. - Match between system and real world. This means that words, colors and images should match their real world counterparts so that the user has an easier time recognizing system artifacts. - User control and freedom. The user should have as much control over the program as possible, flexibility is key to accommodate different types of users. - Consistency and standards. The system should follow standards and the user should not have to wonder what words and functions means. - Error prevention. The system should prevent the user from making errors that crash the program or destroys data. This can in some cases be in conflict with User control and freedom. - Recognition rather than recall. Have as much information as possible visible so that the user do not have to remember information. - Flexibility and efficiency of use. Using accelerators can speed up the system for frequent user. - Aesthetic and minimalist design. Information that is not needed in the current status of the system do not need to be displayed. 11 - Help users recognize, diagnose and recover from errors. Having clear and understandable error messages is important so that the user can understand what the problem is and how to fix it. - Help and documentation. For complex systems a user manual can provide the necessary information for dealing with issues that the system itself cannot solve. 12 3. 3.1 Purpose and methodology Purpose The motion vision lab needs a new user friendly system, FlyTracker, that can perform the tasks needed to study the walking behavior of a fly tethered on a track ball setup. To verify the goal of high usability, an evaluation of the finished software system was performed. As the system is going to be used in research over the coming years it is important that the usability is high as it does affect how much time is spent on doing experiments. A system with low usability will be more difficult to use and therefore actions will take longer to perform. 3.2 Choice of development process Since I, as a developer and designer, worked in the same lab as the stakeholders in the motion vision lab at Uppsala University, choosing an agile user-centered development process was natural. I did choose an agile method rather than a plan-based mostly because the project was not clearly defined yet, the lab had not used this kind of setup before and all experiments were not planned. This means that requirements probably would change over time as the software development process carried on. When requirements are changing rapidly over time an agile process is preferable over a plan-based (Sommerville 2010). Adding user-centered practices was also a natural choice as I was working close to the end users and thereby had the chance to involve them through the entire project. Letting the users be a part of the system development process will create a more powerful process (Benyon 2010). The initial phase of the project, also called “phase 0”, was devoted to the project description. This included finding and analyzing requirements of the software system, designing a suitable GUI and planning the implementation phase. The implementation phase was divided into four sprints of two weeks each. Each sprint was finalized by having a walk-through of the progress so far, where FlyTracker was tested by checking off the list of requirements for that particular sprint. This made it possible to get valuable user-feedback every second week and to make sure that the development was on track. Furthermore, this also made it important to divide the work such that functions (or requirements) were completely implemented during its respective sprint. In the middle of every sprint there was also a shorter check-up meeting where we discussed potential problems or changes to the requirements before they were fully implemented. The meetings with the stakeholders were very valuable as a few times it was clear that all requirements were not defined as actually wanted them to be but this was only discovered when they actually got to try the system. 3.3 Implementation The employees in the motion vision lab at Uppsala University are familiar with Matlab and have some experience with Python. Therefore there was a requirement that the software system was implemented in Matlab. Using Python for certain modules of the system was acceptable, as it was mandatory for a 13 few specific functions. Furthermore, it was straightforward to call Python scripts from Matlab so combining these programming languages was no issue. 3.4 Evaluation As FlyTracker is aimed at a small group of end-users, the choice of evaluation method was straightforward. Although FlyTracker will be shared with other universities the main user will still be in the motion vision lab. Evaluating the software from the perspective of the actual users is more important than evaluating the software from the perspective of naïve users in this particular case. Thus, after the implementation was done the main user tried FlyTracker for almost a month before an interview was conducted. This made it possible for her to find potential issues that needed to be fixed, but not long enough so that she learnt how to circumvent them. The interview was semi-structured. Although I knew what I wanted to find out, it was still a good idea to leave room for exploring issues that I had not thought about. So a semi-structured interview was preferred over the alternatives structured- and unstructured interview. The interview was not recorded. Although this is normally a good idea it was not necessary as I am working closely to the interviewee and could therefore follow up on unclear notes (Lingaard 1993). Nielsen’s ten usability heuristics were used as a guideline when writing the interview questions and were used for setting the goals and measurements of the evaluation (see Appendix A). In addition to the interview a user review was also performed were the main user went through the program and described the qualities of FlyTracker and identified any potential weaknesses. This gave a more detailed description of issues and how to solve them. A few other evaluation methods were considered, for example, having naïve users test the final system. However, due to time restrictions and that the endusers in the motion vision lab were prioritized it was not performed. 14 4. User-analysis and system design The software development process began with an initial analysis and design phase, “phase 0”. As the project was performed according to the guidelines of agile user-centered systems design there was no excessively long initial phase. Nevertheless, some up-front planning needed to be done. First I did requirements engineering where requirements were identified, analyzed and prioritized. The second step was to analyze and learn to understand the user and the environment, which was done through different kinds of work modeling techniques. The resulting work model can be described through different kinds of tools and artifact, but as stated by the agile manifesto (2014-05-26) no documentation for the sake of documentation. The final goal with the user analysis was to produce a design. In my case it was manifested by the system requirements specification and the paper prototype. The former was used to describe the overall functionality of the system. It was important that this was put to paper and formalized because of my lack of domain knowledge as it otherwise would have been a higher risk of misunderstandings between me and the stakeholders. The paper prototype was created to give the users an idea of how the GUI would look to give them the possibility to give feedback before I started implementing the actual system. 4.1 Requirements engineering The requirements phase was done in iterations in the initial phase, but continued to evolve during the implementation phase (see Appendix B). During the initial phase, “phase 0”, the end users and I had a few formal meetings where the main functionality that absolutely needed to be implemented was written down. These were, data recording and saving, which is natural as FlyTracker is essentially a data acquisition system. Another important function was that there had to be some sort of automatic triggering system since data needed to be recorded in certain time intervals. Also, there had to be an interactive calibration function, since hard coding calibration values would disable the possibility for the user to change the hardware setup. Less important functional requirements, as well as interface and non-functional requirements, were set during formal meetings and through informal communication. This way the requirements were more easily optimized, and new ones were discovered, as the project progressed. During the implementation phase the requirements were revised and reprioritized at the feedback sessions, which were held in the end of each sprint. The advantage of having highly available stakeholders was once again evident as there was always a possibility of getting immediate feedback on even the smallest thing. The fundamental requirements were that the system must be able to read and decode data from the mouse sensors to represent virtual fly movement coordinates. When the data have been transformed into a suitable format the 15 data should be saved to file. As the user needs to be able to get a sense of what is going on during the experiments there is also a need for a visual output in real time. The output should show instantaneous velocity of the fly and a virtual 2D-path representing the fly’s movements. Furthermore there needed to be a trigger system implemented, which automatically records data only when the visual stimulus was shown. For the full requirements specification document see appendix B. When the requirements were identified and defined they needed to be prioritized so that more important ones were implemented first and vice versa. Hence, the sprints were given a rough estimation of how long time they would take and then they were according to priority placed into a sprint during the release planning. 4.2 Designing for usability The contextual interview is suggested as an analysis activity by Beyer (2010) to study the user in their actual work environment. This can be done by both interviewing the user and watching them work. I continuously got the possibility to study the users and ask them questions about their work processes and what issues the environment produced. So during both “phase 0” and the implementation phase I used this technique to better understand the users. For example looking at how their current software systems are structured, how they are using them and what they thought about them. This way issues that did occur in their current work environment could be reduced in the final version of FlyTracker. What was discovered during these observing sessions is that keeping track of everything that was going on is important and it can often get a bit messy as there are a lot of things going on at the same time. Hence, I drew the conclusion that FlyTracker needed to keep track of time and saving data automatically. These are just a few of the helping functions that makes it more difficult for the user to mess up any results but not knowing which one is which or forgetting to save data. The paper prototype was made in two iterations before the first actual GUI, by using a combination of the open source tool Pencil and hand-made drawings. The prototype provided no interaction with the user but clearly specified what actions were possible and what they lead to (see figure 3). This was then shown for the end user and they had a chance to provide feedback. There were no drastic changes between the paper prototype and the final interface and the feedback received at from the paper prototype was mostly minor changes and discussing how the interactive calibration wizard should function. As it was not clear work modeling was performed later during the implementation phase. 16 Figure 3 - The calibration wizard (1/2). The starting point of an arrow represents a possible action and the end point what pressing that button, for example, leads to. The prototype is showing each possible outcome for the different buttons in each window. The program starts with a welcome screen. From there you can either navigate to the main window directly or start the calibration process. The user interaction is manifested in figure 3 by arrows leading from each button to the corresponding window. In the figure you can also see that design principles like “cancel”, “ok” and “next” buttons are used. This being the initial design there were some changes to this as well making it more consistent over the calibration steps by having “previous”, “next” and “cancel” in the order most commonly used in wizards of this form. When designing the interactive calibration wizard a work model needed to be created as the system proved to be difficult to calibrate and the process was not 17 obvious. Therefore it was necessary to analyze how the work was performed and what steps needed to be taken to get a fully calibrated system, and particularly, in which order. Hence, before the calibration wizard was designed and implemented a contextual inquiry was performed. The contextual inquiry is described by Beyer (2010) as a method for observing the work process of the users. In this particular case I needed to be a part of the work process since extensive knowledge of the implementation of FlyTracker was needed. Thus, myself and the main user performed a manual trial calibration to calculate all the necessary values. Doing this provided a good guide for what the calibration wizard should look like. It also made me aware of what values needed to be calculated to verify the calibration. For example, average error when using the calibration factor on all calibration trials. The calibration factor was calculated multiple times and after getting the average calibration factor the difference between each individual measurement and the average was. From that an average error could be identified. The main window was designed according to common design principles suggested by Benyon (2010), gathering all the controls to the left of the frame and the output to the right (see figure 4). As this type of display is not unusual, the selection of design is based on the fact that the user will quickly recognize the structure from other applications. The menu also provides further functionality that is not as essential to the actual experiments as the trigger, timer and control buttons are. The option to manually save data or enable/disable automatic data saving is removed to protect the user from forgetting to save experimental data. This is one of Nielsen’s ten usability heuristics, the system should prevent the user from making errors (Nielsen 1994). It is a tradeoff though as the user loses control over the system and this can create redundant data files from test runs for example, but this is preferable to the risk of losing data. The user can however, set a save path themselves in the file-menu. 18 Figure 4 – The main window final prototype. The structure is clean with the controls to the left and the output to the right which means the user will not have to look all over the window for certain functions or graph. 19 5. Implementation The implementation phase of the development of a system is the one that least involves the end-users, simply because they often lack the programming knowledge to contribute in a meaningful way. FlyTracker is implemented in Matlab and Python. The Matlab module provides the GUI and most of the calculations, while the Python module provides the core of the functionality. FlyTracker is platform dependent and can only be run in Ubuntu Linux. However, changes to the Python module could increase portability. Indeed, it would be fairly easy to replace the Python package as it is weakly coupled with the Matlab module. Matlab was a requirement from the lab. However, there is no easy way of reading the raw mouse data from the optical sensors in trackball setup the implementation of reading data needed to be done in another programming language. Python fulfilled that requirement though and the lab had some experience working with Python. Hence, it was also a fairly easy choice although there are plenty of programming language that were considered. 5.1 The Python module There are three files in the Python package: DAQ.py, idMouse.py and utilities.py. IdMouse is used purely for identifying the mice. Utilities.py provides useful classes for saving and loading to file, logging exceptions and performing some necessary data processing. 5.1.1 DAQ.py This is the main file where most of the essential functionality is placed. It consists of the parent mouse class called AbstractMouse, though not technically an abstract class. IdMouse and SensorMouse both inherit from AbstractMouse, which in turn inherits from Thread (see figure 5). SensorMouse provides functionality for reading raw mouse deltas and storing them in the global variable coordinates. IdMouse is used to identify which mice are the sensors and what mouse is the desktop mouse in the calibration step. The MouseHandler class runs in its own thread and is, as the name suggest, responsible for handling the mice. It initializes the mice and starts and pauses them accordingly. The MouseHandler is never stopped unless a stop command is sent from the Matlab application, except if you run FlyTracker with a timer then the run times are predetermined. As the data acquisition is run in the Python module, the user interaction is done in the Matlab module, and these modules needs to communicate. The command is sent via a named pipe, which requires Linux, and stops the listening thread. All mouse threads are set to daemon, which means that when all non-daemon threads have exited, the Python process will terminate. As the terminating threads will exit abruptly there is potential for minimal data loss, one or two data points which is acceptable. A couple of data points lost will not affect the reliability of the experiments according to the stakeholders. 20 Figure 5 – A classdiagram of the Mouse class tree and the MouseHandler. The Thread class is imported from the Python standard library. As data is read it is also saved into a temporary .txt-file. The data are saved as a json-parsed dictionary object. This object holds two x-values and two yvalues, one for each mouse sensor. The final value is a timestamp of data point. This temporary data file will be opened and read by the Matlab package, which processes and saves it in the final output format. The final saving is not done in real-time as it would be redundant, 5.1.2 Trigger The triggering system is a major part of the functionality of FlyTracker. A trigger is basically an on-/off-switch for when to record data. For example, if the user uses a network trigger the recording will not start when the user presses “Run”. Instead pressing run will open up a network socket that listens for commands from a trigger client. When a client sends a “start” command the recording 21 commences and runs until the client sends the “pause” or “quit” command, or alternatively the user presses “Stop”. The first triggering option is to use no trigger at all. In this case the user can manually control when FlyTracker is recording by pressing “Run” and “Stop”. There is also an option to use a timer as a trigger. This means that the user can set a time for how long FlyTracker records data, starting when “Run” is pressed. The last two triggering options were added because it was not really clear how experiments might be designed during the coming years. Hence, although they were not needed currently they were added as requirements just in case. The option to have no trigger was also very useful when debugging FlyTracker. 5.2 The Matlab module The Matlab module consists of two subpackages, model and view. 5.2.1 Model The model holds the files that process the data, first by loading the temporary data from the txt-file that is created in the Python module. Readdata.m is, together with the GUI-files, the most important part of the Matlab module. As the name suggests, this function reads the temporary data file and parses them into the correct format. The readdata.m file also plots the current data continuously, updating the plot every hundred data points. This frequency is fairly arbitrary and was used because it worked acceptably and the graph seemingly was updated in real time. If the number is lowered the plot will be even smoother but it will also be more demanding performance wise and if the number is increased it will not look as smooth but will be less demanding. What is important to note however is that it will not affect the data in anyway, this number only affect how the data is presented for the user. The raw data that are read are also transformed in the model package. Two equations are used to calculate virtual translation and yaw rotation from the sensors into the fly’s coordinate plane. Algorithm 1 calculates the translation vector of length two, containing x- and ymovement. Omega is the angle between a sensor and the fly’s forward direction and beta_ is the calibration factor: w_m = beta_.*[cos(omega),-sin(omega);sin(omega),cos(omega)]*[y2;y1]; (Alg. 1) Algorithm 2 calculates yaw rotation, where r is the radius of the ball and alpha_ is the calibration factor: w_mz = alpha_*t/(r); (Alg. 2) t is given by algorithm 3. t = (x1+x2)/2; if sign(x1) == -1 && sign(x2) == -1 22 t = max(x1,x2); elseif sign(x1)*sign(x2) == -1 if sign(x1) == -1 if abs(x1)<x2 if abs(x1)<t t = x1; end else if x2<abs(t) t = x2; end end elseif sign(x2) == -1 if abs(x2)<x1 if abs(x2)<t t = x2; end else if x1<abs(t) t = x1; end end end elseif sign(x1) == 1 && sign(x2) == 1 t = min(x1,x2); end (Alg. 3) The last algorithm processes the horizontal component of each mouse sensor to reduce the yaw signal when the fly is not rotating. This algorithm uses the hypothesis that when the values of the horizontal component of each sensor are very different or even having opposite signs the yaw signal should be reduced. This is logical since when the fly is trying to rotate the ball these values cannot have opposite signs. Saving is also done in readdata and is done at the end of each experiment instead of continuously. However, the temporary data file holds all necessary information to recreate the data. This means that if FlyTracker should exit unexpectedly, or be closed before the recording has been stopped, all data from that experiment can be recovered on FlyTracker start-up. The user will then be prompted to either recover the data or delete the temporary data file. This reduces the risk of the user making errors that could potentially cost her hours of data. 5.2.2 View All of the files holding functionality for the GUI and dealing with user interaction are placed in the view. The GUI was implemented using the Matlab Guide which is a drag and drop GUI building tool. This did significantly ease the interface implementation. The code for user interaction was then integrated into the autogenerated code parts. 23 5.2.3 Data The data are saved into .mat-files. Each file is initialized by pressing “Run” in FlyTracker and saved when the user presses “Stop”. Data that is recorded in between is saved into the same data file. If the user uses the network trigger, recordings can also be paused. Each pause then creates a new data block within the same mat-file. Data are saved into .mat-files with the filename of the current time. Each data file consists of one 5 x n cell where n is the number of data blocks. The elements of the first row in the cell consists of arrays of thrust delta position, second row is for sideslip delta position, third is for yaw delta position and the forth one is a time stamp. Each column represents data for that particular time stamp. The final row of the cell holds the starting time of that block, i.e. not an array, but rather a date and a time. 24 6. Results In this chapter the result of the design and implementation of FlyTracker is described as it is before the user evaluation. This is then followed by the result of the evaluation interview. 6.1 FlyTracker FlyTracker is run by opening up Matlab and entering “flytracker” in the command line. This will launch the welcome screen seen in figure 6. The first thing the user needs to choose is whether or not FlyTracker needs to be calibrated. If a calibration file exists and it corresponds to the current setup the user selects “Load config file” which will load the only existing calibration file, as there is no point in having several. If there is no calibration file, or the existing file is obsolete the user can start a new calibration process by pressing “Start configuration process”. If the user just wants to get to know the program and does not intend to conduct any experiments she can choose “Not now”, which will lead you to the main window but without being able to run a recording. A novice user might not realize that calibration is absolutely necessary or realize this but want to get a feel for how the interface looks without having to go through the calibration wizard. This solution protects the user from doing recordings with incorrect settings. Figure 6 – Welcome screen. This is the window that is displayed at the start of FlyTracker, providing the user with the options seen above. Figure 7 is a snapshot of the calibration wizard and arguably the most important step, together with yaw calibration. Calibration of thrust and sideslip is done by having the user rotate the ball to simulate the respective movement and using that data to calculate the calibration factor. It is therefore up to the user to make sure the distance the ball is rotated is correctly measured. As can be seen in the figure the next button is disabled. This will enable when the user has done at least three trials. The reason for this is to protect the user from thinking that it is enough to perform one run. A number of trials are necessary to reduce the effect of outliers. An average error is calculated for every run and displayed to the user. At least three runs are required to be able to proceed to the next step of the calibration wizard, in reality you probably need to perform more runs to 25 make the calibration factor statistically significant. However, having a very high number as mandatory could potentially create problems for users and in this case, how many measurements to make is left up to the user to decide. Figure 7 – Calibration of translational movement (thrust and sideslip). In this step of the calibration wizard the user should calibrate thrust and sideslip. Figure 8 is a screen shot of the main window during a recording which can be seen by the text of the run-button which says “Running..” instead of just “Run”. As one can see in figure 8 only minor changes were made from the earlier paper prototype (figure 4). The control buttons were moved to the bottom rather than the top, as this made it more in line with the natural flow of the task of starting a new recording. First the user selects a “trigger”, after which she sets the timer if that system is used, and finally the recording can be started. The user might lack control over the mouse pointer during experiments as the fly is trying to walk around, therefore both the “Run” and “Stop” buttons can be controlled via the keyboard (switching between them using tab). The menu also holds controls for setting save path, change plotting, and network settings for the network trigger. 26 Figure 8 – Main window. This is the final version of the GUI. As in the prototype the controls are placed to the left and the output to the right. The unit of the first three plots can be changed by the user, while the bottom right plot always displays a 2D-map. The three different plots that the user can select between are delta position, cumulative position over time and instantaneous velocity. In the help menu the user can also find a user manual for guidance to the different parts of the system. The trigger system could cause confusion for the naïve user and the help manual therefore provides a detailed explanation of the functionality. 6.2 Evaluation The interview was conducted as a semi-structured interview. Although I had provided some very specific questions it ended up being a discussion about the qualities and weaknesses of FlyTracker. Overall the usability was considered to be high and in particular the ability to see the fly’s movement in real time and as a 2D-plot was highly appreciated as that gave the user the ability to quickly and intuitively do a rough evaluation of the data. Also the data are saved in a convenient format for the user, which simplified the analysis. A few usability issues were discovered during the interview and most were trivial, such as suggestions of changing wording and moving a few menu items were brought up and also adding a bit more information of what is going on during the experiments. For example, by having FlyTracker display what data 27 block is currently being plotted during the experiment1. However, the major usability problem to be exposed was the fact that when the fly is placed on the ball and is moving the user loses control of the mouse cursor. It is however an issue that is possible to solve by for example disabling the mouse cursors of the two sensors. The calibration solution was discussed during the interview and although it was considered to be an ordeal, it was mostly due to the hardware part and not related to FlyTracker. In other words it was the inherit complexity of the experimental setup that was the problem and not something that the software solution could make easier. There were also a few issues with the user manual and the structure of it, for example how to quickly find information in it but this was fairly straightforward to change accordingly. 1 currently you can only select data block afterwards and thereby only then know how many there are 28 7. Discussion 7.1 Analysis and design During the whole project it was possible for me to involve the users in the development. According to the principles of user-centered design methods the design team should involve the user as much as possible. The ability to get continuous feedback was invaluable. In the beginning of the process I completely lacked domain knowledge, although I did learn a lot during the project, I was by no means an expert. This meant that communication with the users needed to be very clear as they themselves lacked deep knowledge of software design. Clear communication through design artifacts can shed light on uncertain requirements, and as it is common for users to not actually know exactly what they want, it is important to maintain good communication to minimize the risk of misunderstandings. This was the case regarding the calibration function of FlyTracker, the initial requirements were vague and only started develop when the paper prototype was tested. The prototype provided us with enough information for a discussion to take place. Furthermore we realized, at this point, that it could not be decided until we actually had access to the physical setup and a working program. In terms of documentation the focus were on the requirements specification and the paper prototype as these were the most important ones to communicate the early design to the users. After the implementation started the system itself could be used for evaluation. This proved to be more than sufficient in terms of formal documentation. The paper prototype was done by hand and therefore lacked actual user interaction as an electronic prototype would have provided. The paper prototype was however constructed with all possible interactions and showed the user what certain actions entailed. Also, given that the Matlab guide made it very easy to implement the GUI.2 It felt redundant to create an advanced electronic prototype as it would have been roughly as time consuming as to create the actual GUI. I do consider the ideas behind user-centered development practices to be good and involving the user is superior to the opposite. However, following the concrete descriptions of the specific activities was not always optimal. Instead, documentation was created as it was needed rather than as a self-serving purpose. The fact that I was working alone also meant that I did not need to communicate with other designers or developers which is also an argument for why less analysis and design artifacts were created. I think that it might differ though to when you do not have access to the users every day. If you, for example, only had weekly meetings with the stakeholders more formal analysis and design activities should take place. But having them close by meant you could draw something for the paper prototype or you could implement a function and if you are unsure you can just ask them what they wanted. Regarding the process structure I do think I should have shortened “phase 0” as my initial phase was for three weeks of the project. The main reason was because I did not produce a large amount of analysis and design 2 The Matlab guide is a drag-and-drop GUI implementation tool 29 documentation. Starting the sprint phase a few weeks earlier would have let me get earlier and quicker feedback on the paper prototype and the early versions of the actual program. This also supports the choice I made of using an agile method rather than a plan-based method. As there was a lot of changes made to the requirements during the project a plan-based development process would have lead to problems during the implementation phase. This implementation phase would also have started a lot later in that case which means there would have been less time to fix any issues. 7.2 Implementation The relatively weak support for object oriented programming in Matlab did produce a few problems in terms of code quality. The coupling is lower in the Python module but that part as well could certainly have been optimized further with a more thorough design. The modularity between the Python and the Matlab package are, however, high. Having high code quality is important in a situation like this as I will be moving on but FlyTracker will be used for years and potentially also be extended with new functionality. To make the job easier for future developers there are without doubt elements that can be changed in the current code, without migrating from Matlab. Overall the implementation went smoothly and it went quicker than I had initially planned for. That proved to be essential as solving the calibration issue took more time than we initially thought. There was also some waiting time before I could start with the calibration as all the necessary parts of the track ball setup were not available from the start. This pushed the calibration design and implementation to the last sprint, which was not optimal, as it was considered both difficult and to be of high priority. But since many requirements were implemented earlier than planned for it lead to me having almost four weeks dedicated to the calibration part. 7.3 Evaluation It was not completely obvious which evaluation method to use. More than a few were considered, but as the majority of the usage will, at least initially, be by the motion vision lab at Uppsala University. Doing an interview and a user review with the main user ended up being the selected method. This way I could go deeper into the functionality of FlyTracker to find any potential problems. Using Nielsen’s usability heuristics as a guideline for the questions was also a good way of covering important areas. The only drawback with doing this kind of interview is that there is a risk that the interviewee wants to be nice and will not point out certain drawbacks. I was afraid of this as I knew the interviewee well after working together for four months but I was wrong as the entire evaluation proved to be very productive. The majority of the minor usability problems that were brought up during the evaluation were fixed immediately as they were trivial. However, fixing the issue with the lack of control over the mouse cursor is a more complex task. It was discussed during the implementation phase but was not considered a big enough problem to deal with, as the user can control FlyTracker using the 30 keyboard. It was only when FlyTracker was actually used for real experiments that the problem was emphasized. This was due to the reason that it was not during the actual experiments, but rather between them, that the problem occurred. As the fly was still mounted to the setup it continued to move on the ball and thereby the mouse cursor moved accordingly. However, a potential solution would be to disable the cursors for the sensor mice which should be fairly straightforward in an operating system like Linux. The reason this problem was not discovered during the feedback sessions at respective sprint was that the problem is not so much during an experiment but rather between them. 8. Conclusion 8.1 Issues Although the project went smoothly most of the time and followed the predefined project plan there were quite a few challenges to overcome, some more problematic than others. Deciding on a platform for the development was the first issue. While Ubuntu provided a simpler solution for reading mouse data the software for National Instruments Data Acquisition (NIDAQ) cards did not work in Ubuntu (they do have support for other Linux implementations). NIDAQ cards were my initial solution for the triggering system as there already did exist an implementation for that in another data acquisition system that the motion vision lab was using. Hence, when deciding to use Ubuntu, the trigger became a new issue as using a NIDAQ card was no longer an option. Quite a few methods were considered, but using a network trigger seemed to be the best option. In reality it has high temporal precision and the only drawback is its portability. When using a network trigger the visual stimulus software needs to be edited so that it sends the correct signal at the correct moment. Using a network signal is a stable and sufficiently fast solution but using FlyTracker with another visual stimulus program was no longer trivial. However, as the main group of users currently resided in the motion vision lab at Uppsala University it was deemed the best option. The most difficult challenge to overcome was the calibration stage. Not only how to actually do the calibration physically, but also how to implement the interactive calibration wizard. There was a lot of time spent on solving issues like getting the ball to rotate around a stable axis and being able to measure the distance with high precision. While this was solvable and the error margin became smaller than five percent, which was low enough, a new issue followed where FlyTracker actually recorded a yaw rotation signal when the ball rotation corresponded to pure translation. This issue was discussed with a scientist at the Imperial College in London who has worked with a similar setup. According to him it was a problem that most groups that use a trackball setup have and it is not clear why. It seems like it is due to the fact that the sensor is not perfectly pointed to the equator of the ball. Nonetheless, it is not a major issue as this faulty signal can be adjusted for in the data analysis as long as it is known. 31 8.2 Future development For future development of FlyTracker it could be useful to do a more thorough evaluation of the software system by letting naïve users try it out. As FlyTracker is currently being shared with other research groups at other universities there is potential for novice users. A cooperative evaluation could be performed, where a number of naïve users (with similar background) could try it out and give feedback on usability. This way FlyTracker could be optimized even further. A cooperative evaluation where the user is given a set of tasks to complete using FlyTracker could be used as evaluation method. The evaluator can then study the user as she performs these tasks and ask questions about potential issues. A possible development of FlyTracker would be to transform the entire experimental set-up into a closed loop system. This means that as the visual stimulus is presented to the fly, the behavior is recorded by FlyTracker, and as a function of the behavior, new visual stimuli are calculated. A closed loop experiment would set high demands on low latency on FlyTracker and as the system is developed now, with both a Matlab and Pyhon module, it would be difficult to satisfy these demands. An alternative would be to migrate all data processing to the Python module (and only display the result in Matlab). This would cut a lot of time, as transfer of data between processes is currently the most time consuming part of FlyTracker. It would still be necessary to transfer the data to the Matlab module, but as this would only be for displaying the output, the time critical element would disappear. Migration to Python would also mean better support for increasing the modularity and decreasing coupling. There is definitely work needed to be done in this area to make extensions easier to implement. 8.3 Concluding remarks In conclusion, the purpose of the project was to develop a user friendly and functional software system for tracking moving insects and reconstruct a virtual movement path. As the evaluation revealed the purpose has been fulfilled. The choice of methodology also proved to be satisfying as the project was perfectly suited for working in accordance with the principles behind user-centered software design. The users were involved from day one and had a major part in the final design of the system. I do think that involving the users was a huge benefit for producing a good product. In the case of this project it was fairly easy to let the users be a part of the development throughout the process. However in larger projects, where the amount of end-users are hundreds or even thousands of people, designing a system that works well for everyone is a complex task as you cannot tailor make it for one person. Therefore, a lot of time should be spent on user analysis, work modeling and other analysis activities. However, in this thesis it was fairly easy to optimize the performance of FlyTracker and then minimize the workload for the users because they were so few. Hence, the result was a functional and user friendly software system. 32 Bibliography Printed sources: Benyon, David “Designing interactive systems – A comprehensive guide to HCI and interaction design”, 2nd ed., Pearson Education, 2010 Beyer, Hugo “User-Centered Agile Methods”, Morgan & Claypool Publishers, 2010 Borst, A and Euler, T “Seeing Things in Motion: Models, Circuits, and Mechanisms”, Neuron 71, September 2011 Gulliksen, Jan and Göransson, Bengt “Användarcentrerad systemdesign”, Studentlitteratur AB, 2002 Gulliksen, Jan and Göransson, Bengt ”The Usaiblity Design Process – Integrating User-Centered Systems Design in the Software Development Process”, Software Process Improvement and Practice, 2004 Lauesen, Soren “User Interface Design – A Software Engineering Perspective”, Pearson Education, 2005 Lingaard, G “Usability Testing And System Evaluation – A guide for designing useful computer systems”, Chapman & Hall, 1993 Moore, Richad, Taylor, Gavin, Paulk, Angelique, Pearson, Thomas, van Swinderen, Bruno and Srinivasan Mandyam, ”FicTrac: A visual method for tracking spherical motion and generating fictive animal paths”, Journal of Neuroscience Methods, 14 Nielsen, J “Usability Inspection Methods”, Ed. Nielsen J & Mack R L, 1994 Paulk, Mark, “Agile Methodologies and Process Discipline”, Research Showcase at Carnegie Mellon University, 2002 Sommerville, Ian, “Software Engineering”, Pearson Education, 9th Edition, 2010 Takalo, Jouni, Piironen, Arto, Honkanen, Anna, Lempeä, Mikko, Aikio, Mika, Tuukkanen, Tuomas, Vähäsöyrinki, Mikko, “A fast and flexible panoramic virtual reality system for behavioral and electrophysiological experiments”, Scientific Reports, March 22, 2012 Web -sources: The agile manifesto, http://agilemanifesto.org/ The Department of Neuroscience (2014), http://www.neuro.uu.se/research/physiology/neurophysiology-of-motion-vision/ 33 Appendix A: Interview questions General questions - How much have you used FlyTracker? Whats the best thing about the system? What is the worst thing? If you could change one thing what would that be? Do you feel you got a good grasp of all the functionality Do you feel you know where to look for specific functions in FlyTracker? The interface - Is the interface letting you know what is going on? Is the look and feel of the system familiar (are names of functions, buttons and texts understandable, placement of buttons and structures)? Functionality - Do you feel that you have to be careful not to cause FlyTracker to go into a errenous state? Do you feel that there are limitations to the functionality and you have to work around them? Do you feel that the documentation is sufficient? User manual - Have you used the user manual? If yes: - Did it answer your questions? Was it easily navigateable? 34 Appendix B: System requirement specification Non-functional requirements 1 Usability requirements 1.1 There is a GUI Priority: High 1.2 GUI shows relevant experimental output and lets the user select which ones to view Priority: Medium 1.3 GUI is clear and follows usability heuristics Priority: High 1.4 What graphs to display can be selected by the user Priority: Low 1.5 There is a specific interface for the set-up calibration system Priority: Low 1.6 Help and documentation is available for the system Priority: Medium 1.7 Code is well documented Priority: Medium 1.8 System is portable Priority: High 2. Performance requirements 2.1 Delay between mouse input and when the system records data input is low or can be calibrated for, such that it doesn't affect experimental data Priority: High 2.2 System performs well over longer experiments Priority: Low 35 2.3 System displays output in real time Priority: Medium 3. Other 3.1 Software is easy to maintain Priority: Medium 3.2 Data is saved in standard format Priority: High 3.3 Timing of trigger and sensor inputs is correlated Priority: Low 3.4 All data files are timestamped at the start of recording Priority: High Functional requirements 2.1 Set-up calibration Precondition: Hardware setup including sensor placements relative to center must be done and known. Trigger: Upon start up, program will alert the user in a clear fashion that calibration is required for running the software successfully. Options between loading an existing calibration file or creating a new one are presented to the user. If no calibration file exist, the user must calibrate so it is not possible to access the main functionality until this has been done. Flow: After selecting “create new calibration file” the calibration screen appears, Here input fields for ball radius (or diameter) exists. The user can also input the sensor placement relative to each other and to the center of the ball. Finally, the user can run experiments where the ball is moved and the distance moved will be showed in form of sideslip, thrust and yaw. Alternate flow: If the old calibration file is loaded, before this is executed a warning pop up appears with information emphasizing the need of correct calibration. Result: After calibrating, the system is fully functional and correctly calibrated. Priority: High 2.2 Mouse identification 36 Precondition: Data calibration is done and both sensors are connected to the computer. Trigger: The user selects “calibrate mouse function” in the GUI. If the user has not identified the mice and tries to start the system the user will be prompted to do the calibration before being able to run the experiment. Flow: A new window opens where the user can select which two mice to use to read data from for the experiment. When selecting two there will be a output showing which one is selected by activating the sensor corresponding to the given mouse selection on screen. Alternate flow: Load old calibration from file and info pop-up appears emphasizing the importance of correct settings Result: Sensor data will now be read from the correct mice and execution of experiment can commence. Priority: High 2.3 Data are saved to file Precondition: Directory path for where to save data is set. Trigger: A recording is started. Flow: Data is saved iteratively to file. Alternate flow: Any I/O-error or errors related to corrupt data leads to an errormessage for the user providing details of what went wrong. Result: Data is saved into file and the user is informed of that fact, or an error message describing the problem will be provided for the user. Priority: High 2.4 Data can be recorded using trigger Precondition: Set-up calibration and mouse identification is done Trigger: “Use trigger” is selected and “start recording” is pressed. Flow: System will wait for trigger signal before starting recording. Alternate flow: Result: A recording is saved to file. Priority: High 2.5 Data can be recorded without trigger 37 Precondition: Data and mouse calibration is done. Trigger: In settings, record without trigger is activated. Recording is triggered by user pressing “start recording”. Flow: User presses start, recording is ongoing until stopped or timer runs out. Alternate flow: Result: Recording is shown in plots selected by the user. Priority: Medium 2.6 User can view fly movement on a 2D map Precondition: A successful recording must have been done. Trigger: User has selected to view data in this particular format. Flow: As the recording starts the 2D-trajectories are drawn as long as the system keeps on recording. Data plotting stops, but is still visible when the recording is terminated (for whatever reason). At any point the user can clear the map and it will start redrawing from scratch. Alternate flow: Data is corrupted and makes no sense to present in this format. In this case an error-message will pop up informing the user what is going on. Result: A 2D map is displayed. Priority: Low 2.7 User can view fly thrust, sideslip and yaw Precondition: A successful recording must have been made. Trigger: The user has selected to view data in this particular format. Flow: As the recording starts the data are drawn as long as recording. Data plotting stop, data are still visible when the recording is terminated (for whatever reason). At any point the user can clear the plot and it will start redrawing it from scratch. Alternate flow: Data is corrupted and makes no sense to present in this format. In this case an error-message will pop up informing the user whats going on. Result: Graphs for each speed dimension is shown. Priority: Low 2.8 User can stop recording using keyboard as input device Precondition: A recording must be going on. 38 Trigger: The user presses key for stopping recording (standard space, can be set in system though). Flow: When the user sends the stop command the recording stops and the mouse cursor is once again under the control of the user. Alternate flow: Result: Recording stops Priority: Medium 2.9 A timer can be used to dictate recording interval Precondition: Set-up calibration and mouse identification must be done. Trigger: User has selected to record data in this particular format. Flow: Alternate flow: Result: Priority: Low 2.10 There is a python client for network triggering Precondition: Network triggering is selected as a trigger option. Trigger: Flow: Alternate flow: Result: Priority: High 2.11 User can set port and hostname for trigger server Precondition: Trigger: Flow: Alternate flow: Result: 39 Priority: Low 2.12 User can start recording Precondition: Trigger: Flow: Alternate flow: Result: Priority: High Requirements sorted by priority High: There is a GUI which will have necessary user input GUI is clear and follows usability heuristics Delay between mouse input.... Data are saved in standard format All data files are timestamped Set-up calibration Mouse identification Data can be saved to file by the user User can start recording Medium GUI shows relevant experimental output.... Help and documentation is available for the system System displays output in real time Code is well documented Software is easy to maintain User can stop recording using keyboard as input device 40 Low: There is a data buffer for mouse inputs What graphs to display can be selected by the user System performs well over longer experiments User can set timer on recording via user interface User can view fly thrust, sideslip and yaw User can view fly movement on a 2D map Sprint planning Sprint 1: Calibration GUI Main GUI Mouse calibration User can start recording There is a python client for network triggering Implement trigger solution Sprint 2: All data are time-stamped at certain intervals Data can be saved User can view fly movement speed (thrust, sideways, yaw) Sprint 3: Setup calibration User can set timer on recording Sprint 4: User can stop recording using keyboard as input device What plots to display can be selected by user in a drop down menu 41 User can set port and view hostname for trigger server via the GUI User can view object movement on 2D-map User manual User can choose between data blocks to show System is portable User can set save-path GUI settings are saved at shutdown 42