1
TTM8000
Time Tagging Module
with 8-Channels
Release 4.4.2 – April 16th, 2015
1/60
TTM8000
Table of Contents
Introduction:...................................................................................................................................................... 3
What is a TTM8000?................................................................................................................................... 3
What's the use of a TTM8000?.................................................................................................................... 4
Key features:................................................................................................................................................ 5
TTM8000 Hardware.......................................................................................................................................... 6
Front Panel Elements.................................................................................................................................. 6
Back Panel Elements................................................................................................................................... 7
Getting Started with the TTM8000.................................................................................................................... 9
Setting up the Network Interface:................................................................................................................. 9
Setting up Qt:............................................................................................................................................. 10
Booting the TTM8000:............................................................................................................................... 11
Selecting an optimal measurement mode:.................................................................................................12
Sample Application: Jitter Measurement................................................................................................... 14
Sample Application: Correlation Measurement.......................................................................................... 24
Sample Application: Event Clustering / Bursts........................................................................................... 33
Sample Application: Using Multiple TTM8000 boards...............................................................................35
Using the User I/O Pins of the TTM8000:.................................................................................................. 39
Provided Command-Line Applications:...................................................................................................... 41
ttmcmd – Configure/Control Timetagging Modules...............................................................................41
ttmcnvt – Receive Measurement Data.................................................................................................. 47
ttmmerge – Merge TTM Data from several TTM8000 boards...............................................................48
ttmclkcalib – Reference Clock calibration.............................................................................................51
Custom Applications....................................................................................................................................... 52
TTM Application development on Windows:.............................................................................................. 52
TTM Application development on Linux:.................................................................................................... 52
TTM Application development on Mac OS X:............................................................................................ 53
TTM Application development for Raspberry.............................................................................................53
Electrical and environmental specifications:................................................................................................... 54
Power connector / cable:................................................................................................................................ 54
External display connector / cable (optional):................................................................................................. 54
Parallel IO – connector:.................................................................................................................................. 55
Analog IO - connector:.................................................................................................................................... 55
Signal connectors:.......................................................................................................................................... 55
Warnings:........................................................................................................................................................ 55
Trouble Shooting............................................................................................................................................ 56
Setting up a Network interface under Linux.................................................................................................... 58
Firewalls on Linux........................................................................................................................................... 59
TTM8000
2/60
Introduction:
The 8-channel Time Tagging Module TTM8000 can be used to measure the timing of digital events (rising
and/or falling edges) with high to extremely high resolution (depending on the chosen measurement mode)
on up to 8 digital signals for a wide range of logic families.
What is a TTM8000?
A TTM8000 is an electronic device, that can be used to measure the timing of electronic pulses on up to
eight external digital inputs with high resolution.
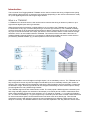
While the actual technical solution is slightly different, we can think of the TTM8000 as a counter that is
incremented at a very high, constant rate (forming a clock with high resolution). The TTM8000 constantly
monitors the levels on all the external inputs and when it detects a transition (low-to-high or high-to-low) on
any input it records the number of the input, the direction of the transition and the current value of the high
resolution clock in an event table inside the TTM8000. The contents of this event table is then sent via
standard Gigabit- Ethernet (UDP/IP) to a connected PC (Windows/Linux/Mac) where the events are then
processed by suitable software (e.g. to detect patterns in the recorded events).
While it is possible to record all edges on all eight inputs, it is not mandatory to do so. The TTM8000 can be
fully configured to record only selected edges for selected inputs, thus drastically reducing the number of
entries in the event table (and thus drastically reducing the effort needed to process the table). Furthermore
the definition of high- and low-signal levels can be configured individually for each external input to directly
process signals from many different logic families.
The TTM8000 supports several measurement modes. The most popular I-Mode supports 8 external inputs
with rising and falling edges at a resolution of 82.3045ps (1/12.15GHz) and an 'infinite' measurement time.
Other modes (G/R/M) provide finer time resolution (2 x 12.15GHz for G-Mode / 3 x 12.15GHz for R-Mode /
3n x 12.15GHz for M-Mode (n < 31)) but support only 2 external inputs and have a limited measurement time
for each measurement (Note: Several measurement can follow each other without gap. Thus the total
measurement time is still unlimited, however the event timestamps from different measurements can not
easily be combined). The detailed features of each mode are explained in the “Key features” section below.
3/60
TTM8000
What's the use of a TTM8000?
Assume that we have some device(s) (up to 8 for the TTM8000) that generate electrical pulses. These
devices could be detectors that detect physical events in the external world (e.g. a photon detector, a Geiger
counter) and generate an electric pulse whenever an event occurs, or they could be electronic devices to
begin with that were designed to generate pulses sequences (e.g. a clock generator) or it could be an
internal signal (e.g. on a data/control bus) inside an electronic device.
The pulses generated by our devices may be highly periodic (e.g. a clock generator) or may be more or less
randomly distributed (Geiger counter).
Now we want to know if there is some correlation between the pulses from different devices and/or if there is
some auto-correlation in the pulse stream of a single device. If we receive a pulse from device X, does this
change the likelihood that we will also receive a pulse from device Y within a given time window? Do events
from devices X and Y usually (sometimes/always) occur together or are they mutually exclusive? What about
events from devices X, Y and Z together? If I received an event from device X, how long will it take before
the next event arrives from this device? What is the complete distribution function of the delay between two
events? Are the events actually randomly distributed (and we observe a perfect exponential distribution) or is
there some hidden connection between events that changes the distribution? Possibly we can assume that
the events are indeed perfectly randomly distributed, but our detector has some losses (maybe insensitivity
during a deadtime after an event was detected or dark count of events that are not actually there)? Are the
pulses generated by our frequency generator actually equidistant, or does the generator generate lots of
pulses that are slightly to short and then compensates with a single long pulse to obtain the correct average
pulse length? How much jitter is there?
All the above questions can be answered using a high resolution clock (in the case of the TTM8000, the
clock ticks at 12.15GHz in I-Mode and a multiple of 12.15 GHz in the other modes). Every time an event is
detected we take a quick peek at this clock and record the current timestamp along with an identification of
the device that was active. Thus we obtain a list of timetags, where each timetag identifies a pulse from a
specific device, and the time at which this pulse arrived at the TTM8000. These timetag are then sent (via
Ethernet) to a PC and can be processed there to answer all of the questions mentioned above.
For example if we wish to know how the events from two devices are correlated, we can subtract the
timestamps of their occurrences (within a given time window) and build a histogram of these differences. If
they are correlated, we will find a clear spike in the histogram.
If we wish to measure the jitter of our pulse generator, we shall subtract the timestamps of each pair of
successive timestamps and draw a histogram of these differences. For a good generator most differences
will be in just a few bins and the remaining ones in the bins nearby. A bad generator will show a wide
distribution around a single center bin. A very bad generator will show several center bins with a wide
distribution around them.
For some common questions the software that comes with the TTM8000 is sufficient to obtain a complete
answer (e.g. “How strongly are events of devices X, Y and Z correlated?”, “What is the distribution of delays
between events?” or ”How much jitter is there on the output of my pulse generator?”)
If you have a question that is very application specific, you will probably not be able to obtain the answer
using only the software that comes with the TTM8000. If these cases you will need to write your own
software to process the timetags. However since the documented source code of the TTM8000 software is
included in the TTM8000 distribution you have working code that gives you an environment that handles all
the setup / data-handling etc. allowing you can focus on your application specific processing.
TTM8000
4/60
Key features:
●
4 Measurement Modes:
I-Mode: 8 channels / 82.3ps Resolution / up to 3 years Measurement Range /
Up to 25MEvents/s per TTM8000, 10MEvents/s per channel sustained
180MEvents/s burst (max. 32 events/burst) / Trigger on rising and falling edges
G-Mode: 2 channels / 41.2ps Resolution / 65µs Measurement Range /
Up to 20MEvents/s per TTM8000 sustained / 180MEvents/s burst (max. 32 events/burst) /
Trigger on rising and falling edges
R-Mode: 2 channels / 27.4ps Resolution / 40µs Measurement Range /
Up to 20MEvents/s per TTM8000 sustained / 180MEvents/s burst (max. 32 events/burst) /
Trigger on rising or falling edges
M-Mode: 2 channels / 1.0 – 27.4ps Resolution / 10ps variance /
Up to 500k measurement intervals per second /
Trigger on rising or falling edges
●
Use internal reference crystal (standard crystal oscillator or optional oven-controlled crystal oscillator
(OCXO)) or external reference clock (10/20/40/80MHz)
●
Generate output reference clock (1/2/5/10/20/40/80MHz) for synchronization of multiple TTM8000s
or other devices.
●
Threshold voltage for each trigger signal and external clock individually controllable (+/-4.1V) to
accommodate a wide range of logic standards.
●
Each trigger input can either be high-impedance or can be terminated with a 50Ω resistor.
●
Measurements results can compensate different source delays (e.g. cable length)
●
8 Digital I/O Pins (3.3V) for controlling external devices
●
4 Analog Outputs (+/-4.1V) and 4 Analog Inputs (selectable 0..4.1V or +/-2V) for controlling external
devices
●
Built-In pulse generator for calibration (e.g. cable length measurements)
●
Convenient C/C++ API (TTMLib) for easy problem-specific application development with
comprehensive sample code.
●
Ready-to-Use software for Linux, Windows and Mac OS X (GUI and command line oriented) to get
you started as quickly as possible. The software is based on TTMLib and comes with full sources, so
that you can easily expand it to match your specific needs.
5/60
TTM8000
TTM8000 Hardware
The TTM8000 Module features various connectors and user interface elements on its front and back panel
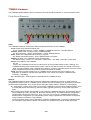
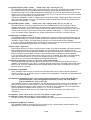
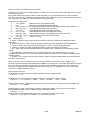
Front Panel Elements
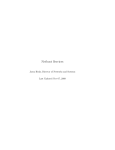
LEDs:
Stop 8
Stop 1
The TTM8000 features 8 multicolored LEDs that indicate the Status of the TTM8000.
● Link: Status of the Ethernet network link.
Green: Gigabit Ethernet link – Yellow: 100Mbit or 10MBit Ethernet link – Red: No Network
● Status: Status of the Connection to the TTM8000-Master.
Off: No Connection – Green: Single Master – Yellow: Multiple Masters
● Run: Status of the Measurement currently in progress.
Off: Ready (No Measurement) – Green: Measurement in Progress
● Buffer: Fill level of the TTM8000 internal timetag buffer.
Off: Buffer Empty – Green: 1%...49% filled – Yellow: 50%...87% filled – Red: 88%..100% filled
● Error: Error Status of the TTM8000
Off: Ok
Yellow: The TTM8000 can not lock its internal clock to the provided reference clock. Warning: The
TTM8000 will still provide measurement results, however they will erroneous and should not be used.
Red: The internal buffer of the TTM8000 has overflown. (The Error LED will become lit as soon as the
buffer overflows and will remain lit until the next measurement is started).
● A/B: The LEDs A and B usually have no TTM8000 specific purpose and can be used by your
application for whatever purpose seem appropriate. They can be set using the TTMLib function
TTMCntrl_c::SetLEDs().
● C: Heartbeat LED – Flashing green to indicate that the TTM8000 is alive.
Buttons:
The TTM8000 features 2 buttons that control the configuration loaded during power-up. After booting is
completed the buttons have no TTM8000 specific purpose and can be used by your application for whatever
purpose seems appropriate. They can be queried using the TTMLib function TTMCntrl_c::QueryKeys().
● *: Pressing the * button during power-up forces the TTM8000 to boot the factory default firmware. Thus
a module with broken firmware (e.g. after a firmware upgrade gone awry) can be made responsive
again.
● #: Pressing the #-button during power-up, will cause the TTM8000s network to be configured with the
factory defaults (IP-Addr: 192.168.1.60, Netmask: 255.255.255.0). This default network configuration
remains valid until the next reboot only. Thus, once you can access your TTM8000-board with this
default network configuration you will probably want to assign a permanent new network configuration
using TTMCmd's command “config network”.
Press the #-button during normal operation to reset the TTM8000 board. To prevent accidental resets
you will need to hold down the button until all LEDs are red before the reset is actually performed.
TTM8000
6/60
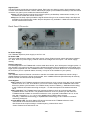
Signal Inputs:
The Signal Inputs provide the actual timing signals. Each input can either be used in high-impedance mode
or with a internal 50Ω termination resistor. Add a simple jumper (not an additional resistor!) to the termination
connector of a given input to enable the internal termination.
● Start: The Start Signal is used as time reference point by all Start/Stop measurement modes (i.e. all
measurement modes but I-Mode continuous).
● Stop 1-8: The Stop Inputs provided the signals whose timing is to be measured. Stop1 and Stop2 are
available for all measurement modes. Stop3 to Stop8 are only available in I-Mode and are inactive for
all other measurement modes.
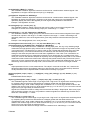
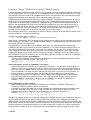
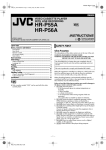
Back Panel Elements
Data7
GND
DC Power Supply:
The TTM8000 requires a power supply of 12V DC / 2A.
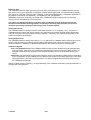
DC Power LED:
The Power LED shows the status of the power supply: Green: External power supply and internal voltages
Ok – Red: There is a power supply, however some of the voltages are out of spec. – Off: Power supply
missing.
Display (optional):
For some applications the TTM8000 will not be a stand-alone device, but it will be part of a bigger system. In
such situations it is useful to be able to have the buttons and status LEDs accessible from the outside of the
bigger system separate from the TTM8000s location. The Display connector allows such a remote display to
be connected. (This is a optional feature, that may or may be not be installed on your system).
Ethernet:
The TTM8000 requires a Ethernet connection to transfer commands and measurement results. Using a
Gigabit Ethernet connection is highly recommended, since 100Mbit/s Ethernet (Fast Ethernet) will severely
limit the number of events that can be processed.
Clock Signals:
● Ref. Clock In: The TTM8000 contains an internal reference clock, however it can also use an external
reference clock of 10, 20, 40 or 80 MHz. This can be useful to keep several TTM8000s and/or other
devices in perfect synchronization. Use TTMLib Library function TTMCntrl_c::SetExternClockConfig()
or the TTMCmd commands “set/config clocksynth...” to select the speed of the external reference
clock.
● Ref. Clock Out: The TTM8000 board can generate a reference clock to synchronize with other
TTM8000s and/or other devices. The generated reference clock is in perfect sync with either the
TTM8000 internal oscillator or the external reference clock. Its speed is selectable to be 10, 20, 50,
100, 200 or 500 kHz or 1, 2, 5, 10, 20, 40 or 80MHz using TTMLib Library function
TTMCntrl_c::SetExternClockConfig() or UpdateExternClockConfig() or the TTMCmd commands
“set/config clocksynth”.
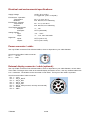
● Clock Status LED: The Clock Status LED shows the state of the TTM8000 reference clock.
Off: External clock valid, but Internal Clock used
Red: External clock input missing or invalid frequency, Internal Clock used
Green: External clock valid and in use.
7/60
TTM8000
Digital I/O Port:
The TTM8000 features 8 digital general purpose I/O ports (3.3V), that have no TTM8000 specific purpose
and can be used by your application for whatever purpose seems appropriate. The direction/value of these
pins can be set using the TTMLib function TTMCntrl_c::SetUserIO()/GetUserIO(), TTMUserIO application or
the TTMCmd commands “set digitaliodir”, “set digitalioout” and “get digitalioin”.
WARNING: These pins are directly connected to the TTM8000s internal FPGA without any protective
circuitry. Do not overload/short circuit these pins!
The analog and digital input ports on the back side of TTM-8000 are high impedance ports and
sensitive to electrostatic discharge. Before connecting or touching the pins make sure to touch
discharge yourself by touching the mounting screws of the back panel.
Analog Input Ports:
The TTM8000 features 4 analog input ports (selectable unipolar 0..4.1V or bipolar +/-2V), , that have no
TTM8000 specific purpose and can be used by your application for whatever purpose seems appropriate.
They can be queried using the TTMLib function TTMCntrl_c::GetADC(), the TTMUserIO application or the
TTMCmd command “get analogin”.
Analog Output Ports:
The TTM8000 features 4 analog output ports (+/- 4.1V), that have no TTM8000 specific purpose and can be
used by your application for whatever purpose seems appropriate. They can be set using the TTMLib
function TTMCntrl_c::SetDAC(), TTMUserIO application or the TTMCmd command “set analogout”.
Calibration Signals:
● Cal. Out (Calibration Out): The TTM8000 contains a built-in pulse generator that can generate Start
and Stop pulses. Calibration Out provides the generated Stop signal. Note that this Stop signal is not
internally connected to any Stop input. Use an external cable to connect it to the Stop input of your
choice.
● Start Out: The Start signal is used as time reference point by all Start/Stop measurements. Depending
on the configuration of the TTM8000 this can either be the signal from the Start signal input or the Start
signal generated by the built-in pulse generator. The Start-Out signal reflects the Start pulse used by
the TTM8000s internal logic.
Use the TTMLib function TTMCntrl_c::ConfigPulseGen() or the TTMCmd commands “pulsegen start/stop” to
configure the pulse generator.
TTM8000
8/60
Getting Started with the TTM8000
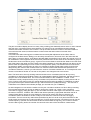
Setting up the Network Interface:
Configure a Ethernet Interface on your computer to operate in network 192.168.1.0/24.
Note: The TTM8000 does not support routing of Ethernet packets. Both the TTM8000 and your computer
must always be in the same subnet. You can later configure the subnet you wish to use, but this initial
configuration must be done in subnet 192.168.1.0/24.
Note: IPv6 is not supported.
You are strongly encouraged to use Gigabit Ethernet rather than a 100Mbit Ethernet Interface, since 100Mbit
Ethernet will reduce the number of events that can be processed to about 2.5MEvents/s.
Furthermore you should activate Jumbo Frames on your computer (if supported by your Ethernet interface)
and make sure that your operating system permits your receiving application to use large input network
buffers for the timetag UDP socket.
Directly connect the Ethernet Interface of your computer to the Ethernet Interface of the TTM8000 using a
CAT-6 patch cable.
Note: TTM8000 uses UDP/IP to transfer timetag data. Since UDP only offers unreliable service, it is strongly
recommended that you use a dedicated, direct connection between the TTM8000 and your computer, rather
than mixing TTM8000 traffic with other traffic on a switch/router that might lose packets.
Network Tuning for Linux:
If you are not sure how to set up a Ethernet interface under Linux, please take a look at the chapter “Setting
up a Network interface under Linux” in the appendix or ask your local system administrator.
Under Linux you can enable jumbo frames for network eth1 by using the command “ifconfig eth1 mtu 8000”.
When running Linux the size of network buffers is limited by the value stored in
/proc/sys/net/core/rmem_max. You should provide at least 8 MByte (rmem_max: 8388608), but 32 MByte
don't hurt when operating at very high event rates. Thus you can use “echo 33554432 >
/proc/sys/net/core/rmem_max” to immediately set the maximal size of the input buffer, however your setting
will be lost at the next reboot. You can also add the line “net.core.rmem_max = 33554432” to your
/etc/sysctl.conf file. This change will survive reboots, however the change will only become active at the next
restart of the network interface. So you will usually use both tricks together, one to get immediate results and
the other to make your change permanent.
All of the above performance hints require root/administrator privileges.
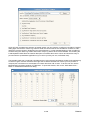
Network Tuning for Windows:
On Windows Jumbo Frames can be enabled in the properties dialog of the network adapter (LAN connection
→ Properties → Configure → Advanced → Jumbo Frames). The default maximum buffer size under
Windows is 1GByte and thus more than sufficient for TTM8000.
Windows comes with the Windows Firewall that tries to identify and discard dangerous network packets
before they can cause any harm to the Windows PC. Depending on the security configuration of your PC, the
Windows Firewall may ask the user if an application shall be allowed to access the network. Since the
TTM8000 Module is connected to the PC via Ethernet, all TTM8000 application need this privilege. When
requesting network permission Windows suggests that the application should get access to the “Windows
Domain” network, but not the “Work or Home” or “Public” network. Since the TTM8000 is (usually) connected
to its own network interface, that is probably not the “Windows Domain” network, you will need to allow
access for “Work or Home” and “Public” networks too. Otherwise the TTM8000 module will correctly take
your measurement and send network data to your PC, where the Windows Firewall will happily discard it
before it can reach the TTM8000 software.
Network Tuning for Mac OS X:
On OS X Jumbo Frames can be enabled in the network properties dialog (System Preferences → Network
→ Ethernet → Ethernet → Advanced → Hardware → Configure: Manually / MTU: Custom & 9000). The size
of the network buffer under OS X is limited by the system setting kern.ipc.maxsockbuf. You can query this
value using the command sysctl kern.ipc.maxsockbuf. Note that OS X reserves about 1/8 of the
quantity specified as maxsockbuf for housekeeping overhead. Thus we want 32 MByte for actual data, we
need to set maxsockbuf sufficiently bigger to compensate for this. Thus we can adjust maxsockbuf using
9/60
TTM8000
the command sudo sysctl -w kern.ipc.maxsockbuf=37752832 (for 32MByte max. network buffer +
4MByte housekeeping overhead + 4KByte rounding = 36MByte).
Note: The maximal acceptable value for maxsockbuf varies depending on the version of OS X. Newer
versions seem to implement an upper limit of 4MByte (which is also their default value). While it would be
nice to have a little more security margin when measuring very fast event sequences with TTM8000, 4
MByte will usually be sufficient too. Don't worry too much about this limitation.
Setting up Qt:
Qt is a popular library for building portable User Interfaces. It is available from http://www.qt.io for Linux,
Windows, Apple OS X and several other operating systems. The TTM8000 comes with two sets of sample
applications: TTMCmd and TTMCnvt are command line and/or script based applications that do not require
Qt. TTMCntrl and TTMViewer are GUI applications that are based on Qt and require the Qt4 libraries to run.
If you only want to run the provided executables, you just need to make the Qt libraries accessible to
TTMCntrl and TTMViewer. The required files are part of the TTM8000 software package and are located in
the TTM8000/qt/ folder for Linux, Windows and OS X.
Setting up Qt on Linux:
On Linux desktop system, Qt is usually preinstalled, so no additional effort is needed on your part. If this
should indeed not be true on your system, libQtCore.so, libQtGui.so and LibQtNetwork.so and various links
to map more specific version-specific names are part of the TTM8000 software package. Copy the files to a
location in your $PATH (e.g./usr/lib)
Setting up Qt on Windows:
On Windows you have to place the Qt Libraries (QtCore4.dll, QtGui4.dll and QtNetwork4.dll) either directly in
the folder that contains the TTMCntrl/TTMViewer exectuables or in a folder that is in the %PATH%.
Setting up Qt on Mac OS X:
On Mac OS X you should either place the folders QtCore.framework, QtGui.framework and
Qt.Network.framework with all the subfolders and contained files in the System framework folder
(/System/Library/Frameworks), or make that the folder “Qt Libraries” that is in the folder with the precompiled
OS X binaries stays in with the binaries.
If you are not satisfied to just run the provided executable and want to modify the sources to match your
specific needs, you will need to install the full Qt development package on your system. The Qt development
environment is not part of the TTM8000 software package. Download it from http://www.qt.io.
TTM8000
10/60
Booting the TTM8000:
Connect the provided power supply (12V DC, 2A) to the TTM8000.
Wait while the TTM8000 is booting. This will take about 5 seconds. Observe the following sequence of lights:
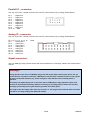
All LEDs yellow – Booting the FPGA
All LEDs red – FPGA booted
LEDs changing from red to yellow (left to right) – Bootloader: Erasing RAM
...LEDs changing from yellow to green (left to right) – Bootloader: Loading PowerPC application
...All LEDs dark – PowerPC Application startup.
...Link LED on – PowerPC Application ready (Green: Gigabit Ethernet detected Yellow: 100Mbit/10MBit Ethernet detected - Red: Missing Network)
If the LEDs change from yellow to green in a center-to-edge fashion (rather than left-to-right), then the
TTM8000 Board is running in Secure Mode. This means that the primary server software has been detected
as damaged (e.g. after a firmware update gone awry) and the backup software has been booted. The board
is fully functional, however you should update the primary software.
If the board does not boot at all, the primary server software might be damaged in a way that is not
recognized by the bootloader. You can enforce booting of the backup software by holding the *-button during
power-up. Keep the * -button pressed until booting is completed.
By default the TTM8000 module has an IP address of 192.168.1.60 with a subnet mask of 255.255.255.0.
You can change this later by using the TTMCmd application (see command: “config network ipaddr=...
netmask=...”). Confirm that your network is working fine by issuing a ping 192.168.1.60.
11/60
TTM8000
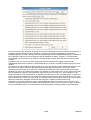
Selecting an optimal measurement mode:
The TTM8000 can measure data in 4 different modes (I-/G-/R-/M-Mode), that each have advantages and
drawbacks. The following guide shall help you select the best measurement mode for your application.
1) Do you need to measure continuous sequences of events (longer than (at most) 65µs), where the
timing of each event is measured on the same timescale (making it possible to determine the time
difference between any two events using a simple subtraction), or do your events always occur in
groups with a clearly defined Start event that is closely (max. 65µs) followed by (possibly zero) Stop
events that shall be measured with respect to this Start event (Every Start event defines its own
timescale / It is not possible to determine the relative offsets between two such timescales)? If you
need continuous measurements then continue your selection process at step 2) otherwise go to step
3)
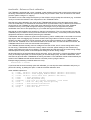
2) You should use “Continuous I-Mode”. This lets you measure rising and/or falling edges on up to
eight channels simultaneously with a resolution of 82.3045ps (1/12.15GHz). “Continuous I-Mode”
comes in two flavors: “Non-Compressed” and “Compressed”. In “Non-Compressed” mode each
recorded event is stored in a 64-bit data element (3bit channel / 1bit slope / 60bit timetag - 2 60 ·
82.3ps = 1098days). This format is very easy to interpret for any application that displays the events,
however it is also fairly bulky. Since all data must be transferred via Ethernet and (depending on
your network hardware and configuration (MTU-size)) Ethernet is limited to about 100MByte/s, you
can only transfer 12 MEvents/s. “Compressed I-Mode” uses the same basic measurement
parameters as “Non-Compressed I-Mode”, however we exploit the fact, that the high bits (beyond bit
27) of the timetags change only rarely (once every 11ms (=2 27 · 82.3ps)) and need not be transferred
for every timetag. Thus only one 32-bit word is transmitted for every timetag, and rarely another 32bit word is transmitted as the high bits change, resulting in an saving of almost 50% at high data
rates. Thus twice as many events can be recorded in Compressed I-Mode as in Non-Compressed IMode. Of course the receiving application will need to decompress the data it receives. However this
decompression is easy to implement (with a single TTMLib library call to TTMData_c::ExpandData())
and fast to execute. Indeed receiving and decompressing compressed data puts less load on the
local CPU than receiving uncompressed data, which requires twice as many network packets for the
same number of events. Thus “Compressed I-Mode” is definitely recommended over “NonCompressed I-Mode”
3) You will measure data by using one Start-channel whose events define the beginning of a new
timescale and one or more Stop-channels, whose event will be measured on these timescales. You
will not be able to determine the relative offsets between two timescales.
How many Stop-channels do you require? If you require more than two Stop-channels, you must
continue at step 4). If two Stop-channels are sufficient for your task, proceed at step 5)
4) You should use “I-Mode Start/Stop”. This will allow you to perform Start/Stop measurements with up
to 8 Stop channels at a resolution of 82.3ps. You can measure both rising and/or falling edges of
each signal and your Stop-events can occur up to 10.8µs (2 17 · 82.3ps) after their corresponding
Start-event.
5) You will perform Start-/Stop-measurements with just one or two Stop channels. What kinds of edges
do you wish to detect? Do you require both rising and falling edges (of the same channel) or is it
sufficient if you detect just the rising or the falling edge of each channel. If you require access to both
edges, proceed at step 6) otherwise go to 7).
6) You will perform Start-/Stop-measurements with just one or two Stop-channel using both signal
edges. You should use “G-Mode Start/Stop” that will give you a 41.2ps resolution for measurement
of up to 65µs (< 172.6µs = 222 · 41.2ps). As an alternative you can also use “I-Mode Start/Stop”, that
will give you a 82.3ps resolution for measurements of up to 10.8µs (2 17 · 82.3ps). In I-Mode every
measurement also contains an 8-bit Start Counter, so you can detect which Start Event the event
belongs to, an information not available in G-Mode.
7) You will perform Start-/Stop-measurements with just one or two Stop-channel using just a single
signal edge. You should use choose “R-Mode Start/Stop” that will give you a 27.4ps resolution for
measurement of up to 10µs (< 230.1µs = 2²³ · 27.4ps). As an alternative you can also use “I-Mode
Start/Stop”, that will give you a 82.3ps resolution for measurements of up to 10.8µs (2 17 · 82.3ps) or
TTM8000
12/60
“G-Mode Start/Stop” that will give you a 41.2ps resolution for measurement of up to 65µs.
There is also the option to use M-Mode, that gives you a resolution of down to 1ps. However the
variance of the result is 10ps, so the last few bits of a single measurement are more or less
worthless when using extremely high resolution and massive averaging of many measurements is
required to obtain optimal results. Furthermore M-Mode has another significant drawback: In all other
other modes, a Start-event can occur at any time and a new timescale starts when ever there is a
Start-event. In M-Mode you must define how long your timescale will be before you start your
measurement, a Start-event must not occur before the timescale of the previous Start-event has
expired (plus 1.2µs for post-processing) and you can have at most one Stop-event per channel after
any Start-event. Thus the maximal event rate is rather limited in M-Mode.
If you need more information about the various measurement modes, their advantages and limitations you
should look at the data sheet of the acam GPX-TDC chip that forms the core of the TTM8000 board. It can
be found at http://www.acam.de/products/time-to-digital-converters/tdc-gpx/
13/60
TTM8000
Sample Application: Jitter Measurement
Note: This demonstration is based on the applications TTMCntrl and TTMViewer which make use Qt4. Qt4 is
a cross-platform application and user interface framework available under LGPL (GNU Lesser General
Public Licence) from http://www.qt.io. It is part of many popular Linux distributions and is either installed by
default, or can easily be added using the package manager of your Linux system. Windows and OS X users
will need to download and install it manually. Please make sure Qt is installed on your system before
proceeding.
If you do not want to install the full Qt development system but just want to use TTMCntrl and TTMViewer
you will find the libraries needed to run these applications on the TTM8000-Installation CD. For Linux and
Windows you should copy the Qt library/DLL files to the same folder as the TTMCntrl and TTMViewer
applications. For OS X you should place the Qt frameworks in the System Framework folder. Note that you
will not be able to compile (modified) copies of TTMCntrl and TTMViewer without installing the full Qt
development system.
Use your signal generator to obtain a square wave of about 200kHz with a low signal level of about 0V and a
high signal level of 3V. Connect the output of your signal generator to the TTM8000 input Stop1.
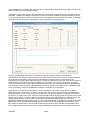
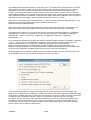
Start the provided GUI application TTMCntrl. TTMCntrl will automatically search for available TTM8000
devices on all network interfaces of your computer and will list all discovered devices in the drop-down menu.
Note: If TTMCntrl does not list your TTM8000 device, try clicking the “Re-Scan Net” button. If this does not
help try using “ping 192.168.1.60” (assuming you have not yet changed the TTM8000s IP address) to
determine if you have a working network connection.
TTM8000
14/60
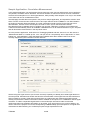
Select a “Module IP-Addr:” of “192.168.1.60” and click the “Connect” button to connect the GUI to the
TTM8000 device.
Now choose a “Measurement Mode” of “I-Mode (8 Chn. cont. / 82.3ps / 64 bit / compressed)” and a “Byte
Order” of “Little Endian (e.g. Intel x86/Alpha)”.
The Signal Input Level determines the threshold voltage that distinguishes low-/high-signal levels. Since the
signal from our signal generator is set to operate using signal levels of 0V and 3V a threshold of 1.5V
provides a nice distinction between low and high. Since 1.5V is a common threshold for TTM signals, we can
easily select then “TTL (+1.5V)” entry from the menu. If we had wanted a non-standard threshold, we could
have chosen “Custom” and entered our own voltage manually. Note that the threshold voltage selected this
way applies to all channels (which is fine for us, since we only have one signal). If we had several signals
that use different threshold voltages, we could chosen “Advanced” from the drop-box and then clicked on the
“Advanced Config.” button to open a dialog that lets us enter a different threshold voltage for each channel
(providing finer control at the price of more mouse-clicks).
We want to measure timing jitter between two rising edges of a signal. Thus we shall enable rising edges
and disable falling edges. Strictly speaking it would be sufficient to enable the rising edge of the one signal
that we are interested in, however it does not hurt to enable the others too. Note that the checkboxes for
Start are disabled, since “I-Mode cont.” does not use the external Start input.
We want to use the application TTMViewer to display the timetags that we will measure. Thus the timetags
shall be sent directly to a port (on our local PC, or any other PC in the local subnet of the TTM8000 board)
via UDP. We can also select “Receiver Req.” to avoid specifying the data target at this time. If we select
“Receiver Request” an application that wishes to receive the data, will request that the data be sent to its
port. Both approaches have their advantages: If you specify a port here, the receiver never needs to detect
the TTM8000 board and can fully concentrate on data processing. However if the receiver specifies itself as
target, the network connection between TTM8000 and receiver application is initiated by the receiver, and
should cause less trouble if a network firewall is active on the PC. Furthermore the selection of an available
UDP port is left to the operating system, thus avoiding collisions between multiple receiver applications
wishing to receive data from different TTM8000s (If we specify data targets explicitly collisions must be
avoided by careful manual assignment of UDP ports.)
If we wanted to record the timetags for later processing, we could also have them sent to TTMCntrl and have
them written to a file. Note that TTMCntrl will never overwrite an existing file. If it finds the filename already
used, it will append a counter to the filename (MyTimetags.dat becomes MyTimetags[2].dat, or if that is
already used too MyTimetags[3].dat up to MyTimetags[100].dat). In addition to this TTMCntrl supports
macros in filenames and will substitute %TIME%, %DATE% and %COUNT% with appropriate contents. Note
that macro names are case sensitive.
We have now successfully set up the data generation side of our sample application and can move on to the
data processing/evaluation side.
15/60
TTM8000
Start the application TTMViewer.
We will receive data directly from the network via UDP by telling the TTM8000 module that we want to
receive data from it. Thus we shall select a “Data Source” of Module IP-Addr and select the TTM8000
module just as we did when setting up the measurement in TTMCntrl. As an alternative we could have
selected a fixed UDP port on the local machine and expect that the TTM8000 be configured (using e.g.
TTMCntrl) to send its data there, or we could have used a file with recorded data.
Since we have only just started the TTMViewer application, but have not started the actual measurement, we
have not received any data and thus the Measurement Mode is also still unknown to TTMViewer.
Sometimes it is useful to filter the incoming data before performing the 'real' evaluation. We have already
selected the channels/edges that we want to observe when setting up TTMCntrl. Now we can perform
additional filtering.
Some sensors/detectors tend suffer from bouncing and create multiple pulses (on the same Stop-input) for a
single external event. Using a Deadtime Filter TTMViewer can make sure that only the first event of each
such group of events is processed and all others are discarded. Whenever TTMViewer processes an event it
checks if the previous event (on the same Stop-input) is further in the past than the channel-specific
deadtime. If it is, then we have the first pulse of a new group of pulses and keep the pulse. Otherwise this is
a subsequent pulse that will be discarded. Optionally the discarded event can retrigger the Deadtime Filter,
so that the deadtime counter starts over whenever a event is discarded.
TTM8000
16/60
If we use several Stop-inputs, some of the pulse sources (sensors/detectors) will work faster (have less
internal delay between the external event and the pulse generated by the detector) than others. Furthermore
some pulse sources will be connected to the TTM8000 with longer cables than others. Thus each channel
will have a channel-specific time delay between the external event that shall be monitored and the arrival of
the electronic pulse at the TTM8000. If we want compare the timing of the external events we need to
compensate for these delays. Thus TTMViewer can optionally add a channel-specific offset to the timestamp
of each event.
Finally we will often look of coincidences of events, i.e. look for pairs (or even tripplets...) of events that
occurred at (almost) the same time. Single events are often of no interest. Thus TTMViewer can eliminate all
single event, that have no neighbor on any other channel within a given time window. Note that we are
looking for neighbors on all channels here. In real-life we are generally more interested in correlations of
events on specific channels not any pair of channels. Thus this Single Event Filter is just a preliminary tool to
eliminate many uninteresting events quickly and without causing much CPU load, so that only a fraction of
the data remains for further processing.
However in our application we just have a single signal generator as our only event source. A signal
generator will/should create well-shaped pulses, so we don't need a deadtime filter. Since we have just a
single event source, we don't need to compensate channel-specific offsets to match the delays of multiple
sources and want to look at single events. Thus we shall leave all three filters disabled.
Our preparations are complete. We can press Start in TTMViewer to begin receiving timetags. We can press
“Start” in TTMCntrl to start sending timetags.
17/60
TTM8000
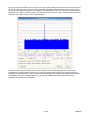
TTMViewer comes to life. We can see that TTMViewer automatically detected the type of measurement we
selected in TTMCntrl and starts receiving data.
If the TTMViewer does not come to life, there are basically three different reasons why this is so. Either the
TTM8000 does not produce any measurement data at all or the TTM8000 creates measurement data but
does not send it anywhere or the data is created and sent but it is lost on the net.
We can use the Buffer LED to check if the TTM8000 creates any data. If the LED is off, no data is created
and we need to check if the pulse generator actually creates pulses (Suggested configuration: 200kHz – 0
Volt Low / 3 Volt High Level) and these pulses are actually fed into one of the TTM8000's Stop inputs (NOT
the leftmost Start Input). The (factory installed) jumper at the Stop input should be in place and your pulse
generator should be set to drive 50Ohm. Be sure that you actually started the measurement in TTMCntrl.
We can use the Network Activity LED at the rear of the TTM8000 to check if the TTM8000 sends any data. If
the LED is permanently lit or flashing wildly then measurement data is sent. If it is off or just flashing
occasionally, then no measurement data is sent (and we see the effect of other traffic on the network). If in
doubt temporarily disconnect the Stop input and see if this brings the network activity to a stop too. If no
network data is sent, the TTM8000 might not know where to send it. Make sure that in the TTMCntrl's “Data
Destination” you have selected “UDP” and “Target Request”. Also make sure that you in TTMViewer's “Data
Source” section you selected “Module IP-Addr” and the correct TTM8000 Module (if you have more than one
TTM8000).
If measurement data is created and sent, but it is not received than it is probably lost on the network. We
know that the overall network communication works fine since we were able to discover the TTM8000,
connect to it and configure a measurement Thus the fault can not be missing/misconnected/broken network
cables, misconfigured network interfaces or other hardware trouble. Just the measurement data gets lost.
This is almost certainly due to a security restriction implemented on the local PC. If you are working on a
Windows PC, there is the Windows Firewall that is automatically installed with the operating system. When it
detects an application wanting to receive data from the net it may (depending on your local configuration) ask
if you which to permit this communication. By default it recommends to allow this communication only within
your domain network. However if you have installed a separate network interface just for TTM8000, this
network interface will not be a domain network interface and you will need to either make this network
interface a domain network interface or permit network traffic for other types of network interfaces too. The
Windows Firewall is very persistent and once a rule forbidding traffic is installed it will execute it. Even
turning the entire Firewall off does not take effect at once. Try the advanced setting page of the firewall
settings to see which rules are actually in effect. If you are not a Windows geek and/or don't have
administrator privileges on your local PC you should seek assistance from your local system administrator to
create suitable firewall rules for TTM8000 (Note to the system administrator: TTM8000 uses UDP/IP (not
TCP) with on ports 10501 and 10502 on the TTM8000 side, and arbitrary ports on the PC side).
Using the hints above, we have now hopefully brought TTMViewer to life.
We received our data via UDP. Since only a single process can consume a given UDP packet, we consumed
this information. However it might be useful to write the timetags to file (while watching them) and/or pass
them on to a different process for further processing (daisy-chain). Both options are available in TTMViewer
using either the original data as received from the net or the modified/filtered data after it has passed through
the Deadtime Filter, Offset Adjustment and/or Single Event Filter.
TTM8000
18/60
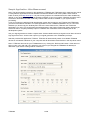
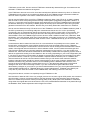
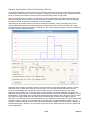
Now we know that TTMViewer is receiving some data, however we do not yet know anything about the
timetags received. We shall therefore click on “Show Event Counters” to open a window showing how many
events are recorded on which channel.
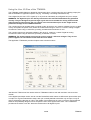
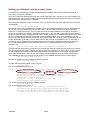
In the “Event Counter” window we see the total number of timetags received as well as the number of
timetags received within the last second for each channel as text and graphically. In the following
screenshot, we can easily spot locations where network packets were lost due to external CPU overload.
19/60
TTM8000
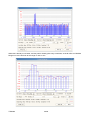
If we have several sources that send events at different frequencies we can also compare their relative event
rates. However if one event source is much faster than another source, the diagram for the slower source
can be compressed into a few (or even a single) pixel and become unreadable. Thus there is a option to
scale each curve independently to use the full height of the diagram (best for showing variations of the event
rate of a single channel over time) or to scale all curves so that the highest curve uses the full height of the
diagram and all other curves use the same scale (best for comparing the relative rate of various event
sources).
The Event Counter window shows the current event frequency as text and some history in the graph,
however if we want to perform long-time measurements the start of the event counter history will long have
scrolled out of view before we finish our measurement. Thus it will be useful to record the signal rates to a
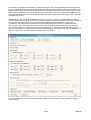
logfile, that we can check later to see how our signal sources behaved over time. To set up logging click on
“Config. Log”.
Here we can define the name/path of the log-file. Note that TTMViewer will never overwrite an existing file. If
it finds the filename already used, it will append a counter to the filename (MyStatistics.dat becomes
MyStatistics[2].dat, or if that is already used too MyStatistics[3].dat up to MyStatistics[100].dat). In addition to
this TTMViewer supports macros in filenames and will substitute %TIME%, %DATE% and %COUNT% (or
%CNT%) with appropriate contents. Note that macro names are case sensitive.
Furthermore we can choose how often TTMViewer will write data and if logging is automatically
started/stopped when data collection is started/stopped or if we wish to manually activate logging only when
needed.
Finally we can define which data fields shall be included in the output file.
If Autostart/Stop is enabled a new Logfile will be started every time you “Start” a new measurement in
TTMViewer. Otherwise you need to Start/Stop the measurement manually using the “Start Log/Stop Log”
Button of Event Counter.
TTM8000
20/60
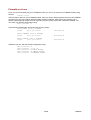
The resulting file is a simple, tab-separated-value file that can easily be opened with the spreadsheet
application of your choice (e.g. OpenOffice Calc, KSpread, Excel, Numbers etc.).
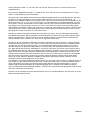
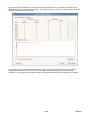
Now that we are sure that we receive timetag data, lets have a look at the timing distribution. Click on
“Create Delay Histogram” to open a histogram window.
We only have a single signal at Stop1, so we can only look at this signal with reference to itself. We shall
therefore select a Stop1 – Rising Edge as both Start Event and Stop Event. TTMViewer will immediately
21/60
TTM8000
display a histogram of the delays. In addition to that we have the mean, the standard deviation and the
number of samples received within the last second and since the start of the measurement or the last reset.
In general we observe a long flow of timetags. When we look at the difference between two different signals,
we must make a decision how we want to find pairs of events whose timing difference we can observe: Do
we have an obvious start event that is strictly followed (never preceded) by (possibly multiple or none) stop
events, that belong to this start event, or do we want to group a stop event to the nearest (preceding or
following, whatever is closer) start event without enforcing a strict order. In the later case, we should check
the Unordered checkbox. Since we are using only a single signal for our demonstration, only ordered
observations make sense and the setting of the “Unordered” checkbox is irrelevant.
The histogram can be drawn using either a linear or logarithmic scale. While a linear scale is more familiar to
most users and gives more 'feeling' about the distribution using a logarithmic scale allows us to distinguish
differences even in the less frequented parts of the histogram (that would otherwise be lost in the finite
resolution of the screen).
The histogram of the current (= last second) distribution (blue) and the histogram for the total distribution
(red) are plotted on top of each other. While this is convenient if we want to observe the difference between
the current situation and the long term average, it can make it difficult to evaluate a single plot. We can
therefore use the checkboxes next to the line color symbols to disable one or the other diagram.
Usually the histogram will count all events that come along. Sometimes however we are only interested in
events that occur within a certain time range. Thus it is possible to define a lower/upper bound for events that
shall be counted. All events outside this range will be discarded.
When looking at streams of events that contain lots of different timing intervals, it is sometimes not useful to
count the occurrences of each individual interval by itself. Instead it is better to group neighboring durations
and form bigger bins when computing the histogram. It is therefore possible to define the size of each
histogram bin as multiple of TTM8000 ticks. Obviously using bigger bins reduces the resolution of the
recorded data and thus degrades the precision.
Note that the CPU load created by creating a histogram depends on the number of bins that are used. If you
have a signal that has a very wide range of used bins and lots of samples per second, you can easily
overload the CPU of your PC. The update intervals will then become longer and TTMViewer will eventually
appear stuck. Use bigger (and thus fewer) bins and/or use a limited observation window to reduce the
number of active bins and reduce the stress on your CPU.
If we measure different signals or if the signal source suffers serious drift the diagram of the global
distribution will become very wide – possibly so wide that the current signal distribution is squeezed into a
few pixels width. To get a readable display in such a situation, we can press the Reset button to reset the
global distribution table.
We can also TTMViewer for long-term measurements and have it write log-files with statistical data that can
later be evaluated with custom applications. To do this, we click on the “Config.Log” button.
TTM8000
22/60
Here we can define the name/path of the log-file. Note that TTMViewer will never overwrite an existing file. If
it finds the filename already used, it will append a counter to the filename (MyStatistics.dat becomes
MyStatistics[2].dat, or if that is already used too MyStatistics[3].dat up to MyStatistics[100].dat). In addition to
this TTMViewer supports macros in filenames and will substitute %TIME%, %DATE%, %STARTCHN%,
%STOPCHN% and %COUNT% (or %CNT%) with appropriate contents. Note that macro names are case
sensitive.
Furthermore we can choose how often TTMViewer will write its data and if logging is automatically
started/stopped when data collection is started/stopped or if we wish to manually activate logging only when
needed.
Next we have to select what information we want to log: We can log the complete distribution table (one line
per used bin) as well as statistical data (Mean/Variance/SampleCnt) measured in ticks of the chosen
measurement mode and/or in picoseconds. TTMViewer generally eliminates measurement errors/broken
samples from the set of measurement results. The definition of measurement error is thus: Remove as many
bins as possible from the top of the distribution without removing more than 0.1% of the samples. Do the
same at the bottom. The remaining bins are defined to be valid and form the core valid range. To make sure
that the long tail of a distribution is not unduly truncated we shall add three times the width of the core range
to the top and bottom of the core valid range. The resulting range (seven times as wide as the core range) is
defined as valid range. Samples outside this valid range are considered measurement errors.
Optionally we can have TTMViewer reset the global distribution table every time it writes a log entry. This
transforms the global table to a local table, that is keeping track from log-event to log-event. Note: If needed
the 'real' global table can be reconstructed from these partial tables, by simply adding up all partial tables.
23/60
TTM8000
Sample Application: Correlation Measurement
In this sample application, we shall assume that we have two event sources and that each source produces
non-periodic, stochastic events. Question: Are the two streams of events from the two sources correlated?
Are there some samples occur in both signal streams, while possibly other samples occur only in one stream
or the other and can be considered as noise?
We shall apply the skills that we acquired in the previous sample application, and expand the solution used
there. First we connect the two event sources to two input channels of the TTM8000. In our demonstration
we shall use channels Stop2 and Stop5. Any other combination would work fine for the first part of this
demonstration, however for the second part, we need an even- and an odd-numbered channel.
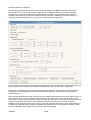
Now that the primary hardware setup is complete, we can start TTMCntrl to configure our measurement.
TTMCntrl will automatically search for available TTM8000 devices on all network interfaces of your computer
and will list all discovered devices in the drop-down menu.
As in the previous application, shall select our Timetagging Module and and “Connect” to it. We choose a
“Measurement Mode” of “I-Mode (8 Chn. cont. / 82.3ps / 64 bit / compressed)” and a “Byte Order” of “Little
Endian (e.g. Intel x86/Alpha)”. Note that Measurement Modes other than I-Mode Continuous are not
currently supported by the Correlation Counter Window.
We are using two signal sources (one for each channel). Hopefully we already know what signal levels our
sources provide. Otherwise we should now fetch the documentation of the signal sources and read them to
find out what they provide. If that fails we should fetch an oscilloscope and measure the high/low levels.
Usually we will have the 50Ohm termination resistor installed on the inputs of our TTM8000 to reduce signal
overshoot. To obtain comparable signal levels on the oscilloscope we need to make sure that the
oscilloscope also uses a 50Ohm termination on its probes. If our signal sources can not drive 50Ohm, we
need to remove the jumpers next to the corresponding TTM8000's Stop inputs and perform our signal level
measurements after switching our oscilloscope inputs to high-impendance mode.
TTM8000
24/60
Now that we know inputs levels (with the same termination as used by the TTM8000!) we can configure the
correct threshold levels. For simplicities sake we shall use threshold values that are half-way between the
measured minimal and maximal signal level. We might be able to be more accurate if we choose the point
where the signal gradient is steepest (and thus jitter is lowest), but just using the middle between minimum
and maximum is generally more than good enough.
If all signals use the same threshold, we can simply set it in the “Signal Input Level / Signal Delay
Compensation” section. If we are using a common signal family the threshold level will be predefined and
can easily be selected from the combo-box, otherwise we shall select “Custom” from the combo-box and use
the voltage-spinbox to define our threshold voltage.
However for this demonstration we shall assume that Stop2 uses a threshold voltage of 1.5V while Stop5
uses a threshold voltage of 0.8V. We shall therefore select “Advanced” in the combo-box. Now the button
“Advanced Config.” becomes active. We can select it, and obtain a dialog where we can select the threshold
voltage for each input signal with a separate combo-box. We could also add delay (measured in ticks of
82.3ps) to each channel, however since we don't know how much delay we want to add (and can
compensate for these unknown delays later on) we can shall leave all these settings at 0.
Note: 0.0V seem to be a nice 'neutral' value for a threshold voltage and it is also a valid level (e.g. for signals
symmetric around 0V), however it is also a very dangerous level. If you leave an input unconnected, it will
always collect noise from the environment. This noise voltage will be very small but if you compare it to 0V
you might create (unwanted) transitions between high and low level. Since the noise might be of quite high
frequency (depending on the sources of electromagnetic noise in your lab) there might even be quite a lot of
transitions and the load on the TTM8000 and the PC might be quite significant. Thus you are strongly
advised to assign a non-zero threshold to all inactive channels (e.g. 1V would be quite fine). As a additional
security you should disable both rising and falling edges of all channels that do not have valid inputs
attached.
Finally we shall select the active signal edges. For our demonstration we connected signals Stop2 and Stop5
and we are only interested in rising edges. Thus just two checks are required. If we were careful with the
threshold voltages of the unused channels, then it should not matter if we leave the other channels enabled
too, however we prefer being safe to being sorry, so we shall disable the other channels.
Since we are now done with the preparation of the data generation side of our measurement we can now
focus on the evaluation of the data we receive. Just as in the previous demonstration we shall once again
use TTMViewer for this purpose. Thus we start the application TTMViewer.
We will receive data directly from the network via UDP. So we need to select the “Host IP-Address” Option
and use the same IP-address and UDP port that we defined as Data Destination in TTMCntrl or use the
“Module IP-Address” Option and select the same TTM8000 Module as chosen in TTMCntrl.
25/60
TTM8000
Our preparations are complete. We can press Start in TTMViewer to begin receiving timetags. We can press
Start in TTMCntrl to Start sending timetags.
TTMViewer comes to life. We can see that TTMViewer automatically detected the type of measurement we
selected in TTMCntrl and starts receiving data. In the “Event Count” window we see that the data is receive
in the two selected Stop channels. The total number of timetags received as well as the number of timetags
received within the last second is displayed for each channel as text and graphically.
We know (assume/hope) that there is a correlation between the signal sources, and that some
measurements we receive on Stop2 correspond to other measurements that we receive on Stop5, however
we shall assume that there is lots of noise (measurements on Stop2 that do not correspond to any
measurement on Stop5 and the other way round). Furthermore we assume that each signal source (and the
cable between the signal source and the TTM8000) introduces its own, unknown delay (that is hopefully
more or less stable for some time, and will not fluctuate too wildly). Thus we need to discover the difference
of these delays. Note: We have no absolute timing reference, and thus can not discover the absolute length
of any of the delays, however the difference of delays is sufficient for our purposes.
We thus click on “Create Delay Histogram” to create a histogram. We select a “Start Event” of “Stop 2 –
Rising Edge” and a “Stop Event” of “Stop 5 – Rising Edge”. Since we do not know which channel will have
the shorter delay, we can not say which channel will come first, and thus enable “Unordered” processing of
the events (i.e. each event on one channel is measured with respect the the nearest event (that can be either
following or preceding – no strict order!) from the other channel. Note that TTMViewer searches only for the
nearest match. Thus we need to make sure that the timing difference between the two channels is
significantly less that the signal rate of each channel. If we assume that our signal sources produce less than
2MEvents/s (for an average 500ns between any two events) and assume that the timing difference is less
than 100ns (corresponding to 20m of cable or fiber) we can be fairly certain that we corresponding events
are grouped properly. Since we are going to perform a statistical measurement we can tolerate some errors.
TTM8000
26/60
Since we assume that there is lots of noise on the inputs, there will be lots of spurious event groups that just
happen to follow each other, but that are not correlated. We need to eliminate these groups. We can do so
by choosing a limited time range for our histogram. We shall disable “Full Time Range” and instead define a
Min/Max Time Range of -100ns/+100ns. If we allow the system to run for a while, we will hopefully obtain an
histogram that is quite similar to the screenshot below.
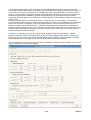
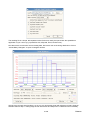
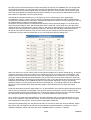
We have a wide noise floor that is more or less constant over the entire histogram and a single peak
indicating the actual correlations. Now we can guess the approximate location of the peak, however the
histogram will probably be too wide to obtain an accurate reading. We shall therefore redefine the Min/Max
Time Range to enclose our peak tighter (e.g. -10ns to 0ns, looking at the scale at the bottom of the
histogram) and obtain a new histogram:
27/60
TTM8000
While this is already much better, and the peak is already quite easy to estimate, we shall refine our Min/Max
Range once more and look at the range of -8ns to -6ns.
TTM8000
28/60
After letting the histogram rebuild itself for a while we can get a fairly accurate reading for both the center of
the peak (corresponding to the time delays between the signal sources) at about -7.6ns and the width of the
peak (corresponding to the joint jitter of the signal sources) of about 0.5ns around this center. Thus we know
that for pairs of correlated events on channels 2 and 5 the event on channel 5 arrive at the TTM8000 about
7.6ns earlier than the event on channel 2 and that there is a jitter of about 0.5ns around the center. We shall
remember both values.
TTMViewer can count coincidence between events on two or more channels, however these coincidence
counters expect that coinciding events have the same timestamps within some tolerance window. Our events
on channel 2 and 5 do however have an offset, that we need to compensate before we can count
coincidences. We shall therefore enable the “Channel Offset Adjustment” feature in TTMViewers Data
Source dialog. Since the events on channel 5 arrive 7.6ns earlier than those on channel 2, we shall add
7.6ns to all timestamps on channel 5 and keep the timestamp from channel 2 (and all other channels) as
they are. Alternately we could have added -7.6ns to all timestamps on channel 2 and keep the timestamps of
channel 5 as they are. It's just the relative difference that is important.
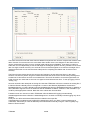
Now we can open the pair-coincidence display by clicking “Show Pair Coinc.” in the TTMViewer's Data
Source window.
29/60
TTM8000
The pair-coincidence display shows how many rising or falling (auto detected) events arrive on each channel
and how many coincidences there were between any events on even-numbered and odd-numbered
channels. Each field consists of two numbers. The top number shows the number of events/correlations
occurred in the last second, while the bottom number shows the total number since start of the
measurement.
In an ideal world without timing jitter correlated events would (after adjustment of the offset, that we
configured in the Data Source dialog) occur at exactly the same time. Since we live in the real world with
timing jitter, we need to allow a “Coincidence Window Width” that defines how far away two events may be to
be considered to have happened at the same time (measured from the first event in the coincidence group to
the last event of the coincidence group). A good choice for this distance would be the distance from the lower
end of the peak to the upper end of the peak in the delay histogram (or twice the distance from the top of the
peak to either end (assuming we have a more-or-less symmetric peak). If we assume that our sources are
not extremely stable, we might want to make our coincidence window a little wider to allow for drift of the
delays during the course of the measurements. Of course this means that we add false positives to our
coincidence detection, however you will reduce the number of missed coincidences. In our example we have
chosen a coincidence window of 1ns even so the peak in our histogram was much thinner.
Note: The fact that we are only showing events and odd-vs-even correlations and not all any-to-any
correlations for both rising and falling events is an implementation detail of TTMViewer, that was chosen to
keep the size of the window down. It is not a technical limitation of the TTM8000 or TTMLib. In fact
TTMViewer actually computes all any-to-any correlations and just limits the display to rising events odd-vseven. If odd-vs-even does not suit your needs please feel free to tailor the display of TTMViewer to match
your requirements (See: PairCoincidences.cpp / PairCoincidences::UpdateCounters()) – The sources of
TTMViewer are included in the software package you received with your TTM8000!)
As with histograms we can write the results from the pair coincidence window to a file for later processing.
First we shall select the way we log our data by clicking the “Config Log.” button. In the “Configure
Coincidence Logging” dialog that pops up, we can select the name of the logfile. This filename can contain
the macros %DATE%, %TIME% and %CNT% that will be replaced by appropriate data when the file is
created. (Note: Macro names are case sensitive!). Next we can select how often we want the pair
coincidence data to be written to the file. Finally we can select the contents of each line of logging
information: There is time-of-day and/or date (as definied by the PC's local clock) and information for the
single events and for the even-vs-odd coincidences. For both singles and pair coincidences we can log the
current frequency (number of events within the last seconds before the log entry), the number of events
since the last log entry and/or the number of events since the start of the coincidence measurement.
TTM8000
30/60
Once we have completed our selection of logable events, we can close the “Configure Coincidence Logging”
dialog again and click the “Write Log” button to write the current state of the coincidence counters to a file
(assuming we have chosen “Single Shot” as repeat frequency, or start repeated logging of the coincidence
counters using the “Start Log” button and use the “Stop Log” button when we are finished. The resulting file
is tab-seperated ASCII file that contains descriptive comments above each column and should be easy to
process with the spreadsheet application of your choice (or with your own, self-written tool).
If we actually need even-vs-odd pair-coincidences then using the pair-coincidence window is the easiest way
to reach our goal. However sometime we might want to detect coincidences of three (or more) events or
compute pair-coincidences of combinations of events other than odd-vs-even. To do this, we can use the
Multichannel Coincidence window of TTMViewer. To open this window, click on the “Show Multi Coinc.”
button in TTMViewers Data Source dialog.
31/60
TTM8000
In the Multichannel Coincidence Dialog, we can select up to 12 coincidences of multiple events. For each of
these multiple coincidence counters you can define which channels must be triggered in sync to count a
coincidence event. You can select a single event (and receive the same results as the regular 'single
counter', or two events and receive the same results as the core 'pair event counters' or more events and
obtain additional results. In our example we only have two signals, thus we shall configure their coincidence,
and as additional example we shall also configure the two single events and an additional 3-fold coincidence
(that shall of course never trigger, since the third event will never arrive in our setup).
Note: The limit 12 is again not a technical limitation – It was just chosen to keep the dialog size down, if you
need more, just add more dialog elements (See: MultiCoincidences.cpp /
MultiCoincidences::UpdateCounters())
Note: Even signals that are from totally independent random sources will have some coincidences, since
some random events will simply happen to occur at the same time even so they are not correlated.
The approximate number of such events for two events is given by the formula Freq[ChnA] * Freq[ChnB] *
WindowWidth * 2. If we have 3 events the formula is given by Freq[ChnA] * Freq[ChnB] * Freq[ChnC] *
WindowWidth2 * 3 and for 4 events by . Freq[ChnA] * Freq[ChnB] * Freq[ChnC] * Freq[ChnD] *
WindowWidth3 * 4
In our example the pairwise false positive rate between Stop2 and Stop5 computes to 201000Hz * 302000Hz
* 1ns * 2 = 121Hz. Thus our 1134 detected coincidences consist of about 121 false positives and 1013
actually correlated events. Of course this is a statistical property that will fluctuate with time.
(Note: The signal sources for this demonstration actually consisted of three signal generators: Two
generators running at 200kHz and ~301kHz respectively created the background noise, and one generator
running at 1kHz created the correlated signal, that was mixed in with both noise signals.
As with histograms we can write the results from the coincidence window to a file for later processing. First
we shall select the way we log our data by clicking the “Config Log.” button.
In the “Configure Coincidence Logging” dialog that pops up, we can select the name of the logfile. This
filename can contain the macros %DATE%, %TIME% and %CNT% that will be replaced by appropriate data
when the file is created. (Note: Macro names are case sensitive!). Next we can select how often we want the
coincidence data to be written to the file. Finally we can select the contents of each line of logging
information: There is time-of-day and/or date (as definied by the PC's local clock) and information for the
coincidences. For the coincidences we can log the current frequency (number of events within the last
seconds before the log entry), the number of events since the last log entry and/or the number of events
since the start of the coincidence measurement.
TTM8000
32/60
Sample Application: Event Clustering / Bursts
In this sample application, we shall assume that we have a event source that has a stochastic event pattern.
Sometimes it does not send an event for a long time, sometimes it sends a single event, sometimes it sends
bursts of several events within a short period of time before falling back to a long pause.
Note: We are looking at long streams of events here, where full information about the relative timing of all
events is essential. Thus we need a common timebase for all events and can therefore only use timetags
recorded in I-Mode continuous (compressed or uncompressed).
Just looking at the average event counts will not reveal this irregularity. Using a histogram of the event
against itself helps a little but is unable to distinguish between two burst of two events each and a single
event followed by a burst of three events. We shall use the “Create Cluster Histogram” button in TTMViewer
to create a Cluster Histogram Window.
Obviously when we want to analyze clusters of events we need to have some definition of when a cluster
starts and when a cluster ends. Here we have two option: We can either split the global time into time
windows of fixed length and consider all the events within one such window to belong to one cluster.
Alternately we can define one or several trigger events and define a cluster as starting at that trigger and
lasting for a fixed window time. In the later case we must decide how we want to handle re-triggers (i.e. what
shall happen if a new trigger event comes along while the previous cluster is still in progress). We can either
ignore the new trigger event (thus all clusters have the same length, however some triggers might be
ignored), or we can abort the current cluster and start a new cluster (thus the number of clusters matches the
number of triggers, however some clusters might be shorter than the specified window width), or we can
extend the current cluster (thus a new cluster is started whenever a trigger events arrives after a break of at
least WindowLength – Beware: If no such break occurs the current cluster will never end and no results will
ever be displayed!).
33/60
TTM8000
If we have chosen to use a external trigger event to start a cluster we must define which event or events we
want to use as triggers. If we simply split the time in slices, we don't need (and can not configure) an external
trigger (time passes by itself...).
Finally we need to decide which event(s) we want to count when measuring the activity in a cluster. Note that
it is OK to use the same events to start a cluster and as countable cluster events.
Once TTMViewer starts receiving events, they will automatically be grouped into clusters (as defined above)
and the Cluster Histogram will show the distribution of the number of events in a cluster.
As with all the other displays it is once again possible to write the results to a log-file for later processing by a
custom application.
TTM8000
34/60
Sample Application: Using Multiple TTM8000 boards
If you have a large measurement setup and the 8 stop channels of a single TTM8000 board are not sufficient
for your measurement, you can combine up to 16 TTM8000 boards to create measurements with up to 128
stop channels. Since the clocks of all TTM8000 boards can be synchronized to each other they will not drift
apart and all timestamps from all boards can be compared against each other.
There are however some limitations: Even so the clocks of all TTM8000 boards are synchronized to each
other, every TTM8000 board uses its own PLL (Phase Locked Loop) to generate its own local high speed
clock. While the PLLs keep these clocks in sync in the long run, there can be minor variations for short times
(that are evened out in the long run). This oscillation of the PLLs around the optimal clock speed leads to an
increased measurement jitter with the standard deviation of the timing measurements increasing by about
60ps. Furthermore it becomes necessary to compensate the delays introduced by the cables used to
distribute the Start signal. Note that this is not much of an additional task. Even with a single TTM8000 it
was necessary to compensate the channel dependent delay introduced by the differences in operating speed
of the sensors and the differences in the propagation delay due to the cables between the sensors and the
TTM8000. Now we simply have another delay that contributes to the total delay between the external event
and the creation of a timestamp in one of the TTM8000s. For the overall compensation of these delays it is
irrelevant how many partial delays contribute to the total delay for each channel, or how long each partial
delay actually is. Its just the total delay that needs to be determined and compensated for. So having an
additional contributor does not make thing more tricky.
We shall now demonstrate how two TTM8000 boards can be cooperatively measure some signals.
For our demonstration we will use two TTM8000 boards and two short SMB-cables that will provide
synchronization between the boards and use the built in signal generators of the TTM8000 Boards as
measurement target signals . We want to connect the output of a single signal generator to two Stop inputs.
We need to use an active signal splitter here, that accepts the signal with proper 50Ω termination and
produces two copies using two independent drivers so that the resulting signals will have nice steep edges
and little overshoot when terminated at the 50Ω Stop inputs of the TTM8000. Using a simple Y-cable to split
the signal into two copies will cause serious degradation of signal quality due to impedance mismatches and
resulting signal reflections. This may lead to duplicate / missing detection of events or (best case) serious
degradation of signal edges (causing more timing jitter). Using an active signal splitter is therefore highly
recommended. If you don't have an active signal splitter, you can generate a reference signal using a signal
generator that has two complementary outputs and modify the setup of the measurement to trigger on the
rising edge of one of the outputs and on the falling edge of the other, to simulate two synchronous signals.
Another simple cable can be used to connect the output of the other pulse generator to a single input.
Using the first of our SMB cables we connect the Ref.Clock Out connector at the back of the first TTM8000
to the Ref.Clock In connector on the backside of the second TTM8000.
Hopefully the Clock Status LED next to the Ref.Clock connectors will now change from red to green on the
second TTM8000, indicating that the second TTM8000 now receives its reference clock from an external
source. The Clock Status LED will remain red on the first TTM8000, since it is still running on its internal
crystal clock.
If the Clock Status LEDs do not show the expected colors, the clock inputs/outputs are probably not
configured correctly. You can fix that by issuing the following command for each TTMBoard:
ttmcmd -t 192.168.1.xxx -x “connect; config clocksynth useexternclkout=true
externclkoutfreq=10MHz useexternclkin=true externclkinfreq=10MHz
externclkinlevel=1.4V”
Note that this is one command to be written in a single line. Obviously you need to set the correct IP-Address
for each board in the -t parameter. You can obtain a list of all TTM8000 boards with their IP-Addresses using
the command ttmcmd –-list
35/60
TTM8000
If we had more than two TTM8000 boards, we could (using additional cables) connect the Ref.Clock Out
connector of the second TTM8000 to the Ref.Clock In of the third TTM8000 and thus form a daisy-chain of
synchronized clocks. Alternately we could use an active signal splitter that takes its input from the Ref. Clock
Out of the first TTM8000 and whose outputs are connected to the Ref.Clock In of all other TTM8000s. Do
NOT connect the output of the signal splitter to the Ref.Clock In of the first TTM8000, since this would create
a loop, and the first TTM8000 would be confused if it should use the external or internal clock.
Using a active signal splitter will for more than two boards will probably produce better results, since the jitter
of the reference clock increases with every additional link of the daisy chain, but this does of course incur
extra hardware costs.
We shall use the second cable to connect the Start Out connector from the back of the first TTM8000 to the
Start Input on the front of the Second TTM8000. This cable will be needed to start the two TTM8000 at
(almost) the same time. Of course there will be some delay as the Start signal travels from the first TTM8000
through various drivers to the connectors, through the cable to the second TTM8000 and through some more
drivers in the TTM8000 until it is actually processed, however for a given setup this time is practically
constant and can be compensated with a fixed offset that is added to the results.
For a setup with just two TTM8000 this is easiest and best solution for distributing the start signal. It we had
more than two TTM8000 boards we could again use a daisy-chain solution, by connection the Start Out at be
back of one TTM8000 to the Start Input on the front of the next board, or we could use an active signal
splitter to distribute the Start Out signal of the first TTM8000 to the Start Input of all other TTM8000s.
Finally we shall hook up the sample signals from the signal generators of the TTM8000s to some Stop
inputs. We shall choose to connect the input of the active signal splitter to the Cal(ibration) Out output of the
first TTM8000 and connect the split signal to Stop2 of the first TTM8000 and Stop 5 of the seconds
TTM8000. Furthermore we shall connect Cal.Out of the seconds TTM8000 to Stop7 of the second TTM8000.
This choice was totally arbitrarily, we could have used any other combination just as well (including
connecting all signals to Stop inputs of the same TTM8000 (which would negate the effect of demonstrating
a Multi-TTM8000 setup) or using Stop inputs with the same index on both TTM8000s), however the choice
that we make here will be reflected in the way we evaluate our results, so until further notice we shall
assume the above selection.
Included with the TTM8000 software package there is the script file mstart.cmd (located at …/programs/
Scripts/mstart.cmd) that will use the command line application TTMCmd to start all our TTM8000 boards in
perfect sync. You should now open this file with your favorite text editor. You are strongly invited to read this
liberally documented file, since it will explain many of the options of ttmcmd. For the moment however most
options have already been set to reasonable values. The only settings that really must be adjusted are the
IP-addresses of the boards. They are listed in the section “Step 1: Connect to the TTM8000-Boards” and
must be adjusted to match the local setup. Note that the order in which the boards are listed is essential.
When we connected the Start Out from the first board to the Start In of the other boards we defined an
hardware ordering of the boards and we must properly reflect this hardware ordering in our software
configuration. If you are using a signal generator with two complementary outputs (rather than an active
signal splitter with two equivalent outputs) you should also edit section ”Step 2c: Enable/Disable Signal
Edges” to disable the rising and enable the falling edge of channel 2.5 (or at your choice 1.2, but not both...),
so that both channels actually measure the same logical event.
While we are at it, we shall also open the command script mstop.cmd and perform the same adjustments to
the IP-addresses there. Remember to save your changes.
Now use TTMCmd to process the scipt file.
ttmcmd -f "<path>/mstart.cmd"
Hopefully both TTM8000s will come to live. The Run and Buffer LEDs of both TTM8000s will become green
(as well as User-LED A) and data will be available for inspection. We shall validate this by starting
TTMViewer and connecting to both TTM8000 (either sequentially or by starting TTMViewer twice and looking
at the results from both boards at the same time).
If we do not receive any results, or just results from one TTM8000, the most probably cause is that there is a
mismatch between the hardware order as defined by the sequence of cables propagating the Start signal
from Start Out → Start In and the software order as defined in mstart.cmd where board [1] will create the
Start Pulse and board [2] will wait for an external start pulse. The board that creates the pulse will always
start itself, but it will not propagate its pulse backwards along the daisy-chain...
TTM8000
36/60
We can even create a delay histogram for each of the active event channels measured against themselves.
Note that Stop2 of the first TTM8000 and Stop5 of the second TTM8000 use the same signal but are
measured using two different TTM8000s whose clocks are kept in sync. Thus the measured delays and
standard deviations are the same for both signals. If we were to remove the cable linking Ref.Clock Out of
the first TTM8000 and Ref.Clock In of the second TTM8000 we would notice the difference in the speed of
the two local crystals of the two TTM8000. Note that connecting/disconnecting the Ref.Clock cable while
measurement is in progress will break the measurement. You should stop the measurement first, then
connect/disconnect the cable and then start the measurement again (no hot-plugging).
Once we have seen enough of this we stop the measurement using
ttmcmd -f "<path>/mstop.cmd"
Of course we want to merge the measurement results from all TTM8000s into a single stream, so that we
can analyze them all together. This can be achieved with the application TTMMerge. TTMMerge will take
multiple streams of data (either from multiple TTM8000 boards that have been started together, or from
multiple timetag files that recorded the results of such a parallel measurement) and will join all the timetags
into one single stream of sorted timetags that can then be sent to another application for further processing
or saved to file. Furthermore TTMMerge can compensate timing offsets, debounce bouncy time sources and
even filter for coincidences.
Thus we shall open the file merge.cmd in our favorite text editor. Again we need to adjust the IP-addresses
of the TTM8000 boards that we will use as data sources. TTMMerge does not offer a user interface that we
can use to look at our data. Thus we shall use TTMViewer. TTMViewer however can not handle streams of
multi-board timetags. We shall therefore use TTMMerge to shift the measurement results from the three
currently interesting channels into a single-board measurement before sending it to the network (where it can
be received by TTMViewer). In 'Step 5 – Possibility D' we define where TTMMerge shall send the merged
data. We need to adjust the target IP-address and UDP Port to the IP-address of our local host, where we
will run TTMViewer to visualize the data stream. Remember to save your changes.
Now run the following command: ttmmerge -f "<path>/merge.cmd" to start TTMMerge and of course
we need to restart our data source: ttmcmd -f "<path>/mstart.cmd"
TTMMerge will now collect the data and send the to the selected network port. We can verify this by starting
TTMViewer and setting it to collect its data from the UDP port chosen above. The Event Counter Window of
TTMViewer makes it easy to see that the events of all three connected inputs were combined into a single
stream by TTMMerge and sent to TTMViewer.
If no data arrives at TTMViewer, you should first check if TTMMerge does indeed process data. TTMMerge
constantly displays the amount of data processed since the start of the application and within the last second
on its terminal window, so you can check liveness there. If TTMMerge does not process and data, connect
TTMViewer directly to the TTM8000 boards to see if data is produced (Note: attaching a TTMViewer to the
TTM8000 breaks the connection to TTMMerge, so you will need to restart TTMMerge after closing or
disconnecting TTMViewer). If data is produced and processed by TTMMerge, but not visible in TTMViewer
then there is probably a mismatch between the target IP address as stated in Step5 of TTMMerge.cmd and
the IP address that TTMViewer tries to read its data from.
Now that we have all timetags in a single stream TTMViewer we can of course use TTMViewers “Timing
Histogram” feature to display the relative offset between the two channels that were derived from a single
source using the active signal splitter. Looking at the histogram for a few seconds, we can easily see that the
timing of the two channels is stable, there is a constant mean offset between the two channels that does
change over time (i.e. there is no drift between the two locked reference clocks). Furthermore we can see
that the width of the timing histogram is unfortunately a little wider than the histogram that we would have
obtained had we measured all channels on a single TTM8000 board, since the local PLLs of each TTM8000
oscillate around the optimal frequency. Using an high quality signal generator (Stanford Research CG635) to
create synchronous pulses the timing jitter increased from ~60ps standard deviation when both copies of the
pulse were measured on the same TTM8000 to ~130ps when using two different TTM8000s.
We can use the mean value that we see in TTMViewer's Delay Histogram to correct the offset of one of the
channels, so that events that originate from the same source are also recorded with the same timestamp. To
do so we shall simply open ttmmerge.cmd in our favorite text editor again and modify the offset in “Step 2 –
Define the Channel Offsets”. After starting TTMMerge again, we can verify that the mean time offset between
channel 1.2 and 2.5 is now (close to) zero, even so they arrived on two different boards over cables of
different length. Note that offset correction is done in steps of TTM8000 ticks (82.3ps), so in general you will
not be able to shift the inputs to a perfect zero offset.
37/60
TTM8000
TTMMerge can however do more than just merge multiple streams of timetag data and shift the timing of
signals. It can also perform filtering for coincidences.
In our setup we have two signal streams that are derived from a common source, and that have a constant
offset (which we just adjusted to make it zero) but the third stream of events has an independent timing, so
sometimes there will be events quite close to the other stream(s) and sometime they will be far away. We are
only interested in groups of events where something happened on all three channels at the 'same' time. We
shall once again open ttmmerge.cmd in our favorite text editor. Just for cleanup, we do no longer wish to look
at the live data in TTMViewer, we can comment out the dataview send command in from “Step 5” /
“Possibility D”. Instead we shall look at “Step 5” / “Possibility E” and remove the comment from the
statement there. We want a report of all coincidences with 3 (up to 8) events within a coincidence window of
30ns and write those to a text file. All events that are not part of such a triple coincidence will be discarded.
Of course writing all these events to file will quickly create a huge file. To make sure that we do not forget
TTMMerge and our hard disk overflows, we shall demonstrate yet another feature of TTMMerge, we shall
force an automatic stop after 10 seconds of processing. We can do so by editing “Step 4: Automatic
limitation of Runtime” in the ttmmerge.cmd file. Just remove the comment from the limitation there. Note that
these limitations measure the time or amount of events that ttmmerge reads input data. If we set a time limit,
and no data arrives in this time (e.g. because the event source is not started) processing will stop without
having processed any data. Also if we have a filter in place a lot of input data might still result in no output
data, because non of the data matched. There is currently no way to specify the time actually spent for
processing data or the requested amount of output data. Remember to save your changes.
Now start TTMMerge again. TTMMerge will run for 10 seconds (as specified in “Step 4” of the merge.cmd
script file) and after these 10 seconds we have a text file that lists all events that were part of a triple
coincidence. We can look at this in a text editor and/or feed it into a custom application for further
processing.
TTM8000
38/60
Using the User I/O Pins of the TTM8000:
The TTM8000 module features 8 digital I/O (input/output) pins, 4 analog input pins and 4 analog output pins
that are available for application specific use (e.g. monitoring / controlling external devices).
The 8 digital I/O pins use LVTTL signals (0 / 3.3V) and can individually be configured as input or output.
WARNING: The digital I/O pins are directly connected to the internal FPGA without any protective
circuitry. They are designed to provide logic signal and are not suitable for driving external loads
without external power drivers. Be very careful not to overload these pins as this might result in
permanent damage to the TTM8000 hardware.
The 4 analog inputs can operate either in unipolar mode, where they can measure voltages from 0 to 4.095V
or they can operate in bipolar mode, where the measurement range is -2.047 to +2.047V. Analog to Digital
Conversion is done using a 12-bit ADC, providing a measurement resolution of 1mV.
The 4 analog outputs can generate voltages in the range of -4.095V to +4.095V. Digital to Analog
Conversion is done using an 8-bit DAC, providing a resolution of 32mV.
WARNING: The analog outputs must only be used as control / reference voltages. They are not
power supplies! Do not load them with loads less than 400Ω.
The application TTMUserIO provides simple access to these functions.
Just like with TTMCntrl we first need to select a TTM8000 module to work with and then connect to that
module.
In the digitial input/output section we can use the DirOut/DirIn radio buttons to define each pin as either input
or output. For a given measurement setup, each pin is usually defined to be either only an input or only an
output. Switching the direction of a pin in the middle of a measurement is a rare occurrence, and accidental
switches are potentially dangerous if two outputs are set to drive against each other. Thus TTMUserIO
provides the checkbox “Lock Dir” that locks the direction of all digital I/O pins.
39/60
TTM8000
For each digital I/O pin we also have a checkbox that defines the value of the pin when used as output and a
text giving the actual current value. If the pin is configured as input, changing the output value does not have
any direct effect of the hardware, however it might still be useful to configure the value that will become
effective as soon as the pin is configured as output.
Furthermore TTMUserIO shows the voltage that are currently active on the analog inputs. For each analog
input pin you can select the measurement mode: Unipolar (0..4.095V) or Bipolar (+/- 2.047V).
Finally TTMUserIO allows setting the voltages of the 4 analog outputs in the range of +/- 4.095V.
TTM8000
40/60
Provided Command-Line Applications:
ttmcmd – Configure/Control Timetagging Modules
TTMCmd is a command-line application that can be used to configure/control TTM8000 devices (functionally
similar to the graphical TTMCntrl application). It can either execute a command script (recommended for
complex operations) or a list of commands provided directly on the command line.
Supported command line options are:
-t, --ttm8
IP:Port - Target Time Tagging Module (Default: Auto:10501)
-n, --ttmnet IP:Port - Time Tagging Module Subnet (Default: Auto:10501) –
Used for searching for Boards
-c, --cntrl IP:Port - Local Cntrl Port (Default: Auto:Auto)
-d, --data
IP:Port - Target Data Port (Default: Auto:Auto)
-f, --script FILE - Execute Commands from a Script File
-i, --interactive - Execute Command read from Standard Input
-x, --cmd
CMD - Execute Verbatim Commands
-l, --list
- List all Boards
-D, --def NAME=VALUE - Assign a Value to a Name
-v, --verbose - Show Internal Information
-V, --version - Show Version Information
Note: The command script files start.cmd and stop.cmd are part of the TTM8000 distribution (in
TTM8000\demoapps\bin\Scripts) and show how to start and stop a measurement. They are well documented
and are recommended for use as template for your own scripts. A single instance of TTMCmd can control
multiple TTM8000 modules. This is demonstrated in mstart.cmd and mstop.cmd.
Some examples command lines for using ttmcmd:
List all TTM8000 devices that are available on the network:
ttmcmd -l
Execute the script start.cmd:
ttmcmd -f "start.cmd"
Make LED A shine red and LED B shine green, executing multiple statements from the command line:
ttmcmd -x "connect; set led[a] = red; set led[b] = green"
Run an interactive session with the TTM8000 (Note: There is no command prompt in the interactive session
and most commands do not produce any visible output. Just enter your commands and press <Enter> and
they will be processed.):
ttmcmd -i
connect 192.168.1.60
set led[a] = yellow
get analogin[1-3] 8 250
echo "Hello World"
exit
Supported commands are:
list [brief | ext | verbose | all | full | state | status] [<Subnet IP-Addr>[:<Port>]]
Print a list of TTM8000 devices discovered on all local network interfaces. Print just a brief list (TTMID,
Name, IP-Addr and current client), an extended/verbose list (adding Software/Firmware Versions), full
information about the devices and/or full device information including the current connection /
measurement state.
Note: It is possible to search only on a given network interface by using the '-n' or '--ttmnet' command
line option, or by explicitly stating the requested subnet in the 'list' command.
41/60
TTM8000
connect [<IP-Addr>[:<Port>]]
Connect to a given TTM8000 device. If no <IP-Addr> or <Port> is provided, connect will use the IP
address and port provided using the '-t' or '--ttm8' command line option. If no such option has been
provided, connect will search all local interfaces for a TTM8000 device and will use the first device it
finds.
Note: Most of the other commands perform specific actions on a TTM8000 device and thus need to
know which TTM8000 device to work on. Use “connect” to build this connection!
disconnect
Disconnect from the current TTM8000 device
exit | quit
Exit TTMCmd even if more commands are available. Useful for quitting an interactive session. When
running commands from a file of from the command line parameters, the exit is implied at the end-of-file.
set
Set parameters for the next measurement. Note that the settings do not become effective immediately,
but only when the next measurement is started. If you want to change the settings of the current
measurement, try using the 'adjust' command explained below.
set mode = (i64pack | i64flat | icont29 | icont32 | istartstop | gmode | rmode |
mmode <MModeDiv> <Timeout> [ns | us | ms | s | Hz | kHz)
The TTM8000 Module features several different measurement modes:
● I64Pack: 8-Channels, Rising and Falling Edges, 82.3045ps Resolution, 'infinite' Measurement Range (9
months to overflow), Up to 25MEvents/s per TTM8000 sustained, 10 MEvents/s per Channel sustained,
160MEvents/s peak
● I64Flat: 8-Channels, Rising and Falling Edges, 82.3045ps Resolution, 'infinite' Measurement Range (3
years to overflow), Up to 12MEvents/s sustained, 160MEvents/s burst (max. 32 events/burst)
● ICont29: 8-Channels, Rising and Falling Edges, 82.3045ps Resolution, 1.6ms Measurement Range, Up
to 16MEvents/s per TTM8000 sustained, 10 MEvents/s per Channel sustained, 180MEvents/s peak
Primarily intendend for internal use / Hardware debugging - Not recommended for end users!
● ICont32: 8-Channels, Rising and Falling Edges, 82.3045ps Resolution, 12.8ms Measurement Range,
Up to 16MEvents/s per TTM8000 sustained, 10 MEvents/s per Channel sustained, 180MEvents/s peak
Primarily intendend for internal use / Hardware debugging - Not recommended for end users!
● IStartStop: 8-Channels, Rising and Falling Edges, 82.3045ps Resolution, 6.4µs Measurement Range,
Up to 25MEvents/s per TTM8000 sustained, 10 MEvents/s per Channel sustained, 180MEvents/s peak
● GMode: 2-Channels, Rising and Falling Edges, 41.1523ps Resolution, 65µs Measurement Range
● RMode: 2-Channels, Rising or Falling Edges, 27.4349ps Resolution, 40µs Measurement Range
● MMode: 2-Channels, Rising or Falling Edges, 27.4349ps/MModeDiv Resolution, 40µs / MModeDiv
Measurement Range [MModeDiv = 1..31]. In I/G/R-Mode the Start input is permanently active. In MMode the Start input cannot be retriggered for a given duration (<Timeout>) after being triggered once.
Thus there is a tradeoff between max. observable event frequency and max. Start-Stop interval.
set byteorder (little-endian | little | intel | x86 | big-endian | big | powerpc | 680x0)
The TTM8000 hardware can deliver the timetag data in either little-endian (as used e.g. on x86 based
systems) or big-endian (as used e.g. on PowerPC or 680x0 based systems) byte order. Timetags can
only be processed by the receiving host, if they are available in the hosts native byte order. Timetags
that come with the 'wrong' byte order must have their bytes reordered first, which is automatically done
by TTMLib (so you won't see the difference in the data) however this conversion requires processing
time on the host CPU that could be spent for better purposes if the timetags already arrive with the
correct byte order.
Note: The byte order setting applies only to timetag data. It does not affect any other control structures.
set slope[start | stop1 | stop2 | ... | stop8][rise | rising | fall | falling] = (0 | off | disable | 1 | on | enable)
Enable/Disable Events Slopes
set startsrc = (extern | intern | pulsegen)
The TTM8000 Start input can either be triggered by an external signal or with the signal generated by
the built-in pulse generator (see command pulsegen below).
TTM8000
42/60
set signallevel[start | stop1 | stop2 | ... | stop8 | stop | all] = <Level> [mV | V]
The TTM8000 supports a wide range of input logic levels. 'High' and 'Low' signal levels are distinguished
by comparing the input level to a threshold level. Voltages greater than the threshold level are
considered as 'High', while smaller voltages are considered 'Low'. For most logic families a value in the
middle of the nominal 'High' and 'Low' level will work best (e.g. 1.5V for 3V TTL). Do not use the nominal
'High' level of your logic family as reference level!
SignalLevel controls the reference voltage used for the Start and Stop1..Stop8 inputs. Since every input
uses a reference voltage of its own, it is possible to measure signals from different logic families at the
same time. Valid Range: +/- 4.096V
set signaldelay[stop1 | stop2 | ... | stop8 | stop | all] = <Delay> [ticks | ps | ns | us | ms | s]
The cables used to connect the signal sources to the TTM8000 inputs introduce a delay of about
50ps/cm cable length. To compensate for the differences in delays introduced by these cables the
TTM8000 can add an offset to every measurement so that events are sorted by the order in which they
occurred, not the order in which they arrived at the TTM8000. Valid Range: +/- 125Ticks; Resolution:
1Tick. The length of a tick depends on the chosen measurement mode (see: “set mode” above)
set datatarget = <IP-Addr>:<Port>
The TTM8000 sends the obtained timetags via Ethernet to a PC for further processing/storage etc. The
IP address and UDP port to which the data shall be sent is defined by DataTarget. Note that TTM8000
does NOT support routing. The target machine must be in the same subnet as the TTM8000!
If you do not specify a datatarget when configuring the measurement, the receiving application will need
to register itself as data target as soon as it is ready to receive data.
set mtu = (auto | <ByteCnt>)
Each network packet can contain a limited amount of data. Every Ethernet adapter can transfer packets
with 1500Byte payload but most Gigabit adapters can also handle larger Jumbo Frames that can
transfer large amounts of data with less overhead. For optimal performance it is therefore recommended
that you configure the MTU (Max. Transfer Unit) of the PCs network adapter to at least 8000Byte.
If you process the data on the same machine that you use for TTMCmd, the TTMLib can automatically
detect the optimal packet size. If you use two different machines for TTMCmd and your timetag
processing, you must inform the TTM8000 of the optimal packet size.
set timeout = <Timeout> (us | ms | s | Hz | kHz) – Delay until Data Idle
The TTM8000 sends measurement data to the PC every time a complete network packet of data is
available. If the data rate is very low (or completely stopped) waiting for a completely filled packet might
take too long. Thus the TTM8000 will send a (partially filled) packet if data is available and no packet
has been sent for <Timeout>.
set userdata = <UserData>
Every Timetag Packet contains a 16-bit word of User Data that can be used for arbitrary application
specific purposes (e.g. to identify a specific measurement configuration). Its value is not used/interpreted
in any way by the TTM8000.
set clocksynth [useexternclockout = (true | false)] [externclockoutfreq = <Freq> (Hz | kHz | MHz)]
[useexternclockin = (true | false)] [externclockinfreq = <Freq> (Hz | kHz | MHz)]
[externclockinlevel = <Level> (mV | V)]
The TTM8000 contains a clock synthesizer, that will generate the reference clock for the TTM8000 it can
either be driven from an internal crystal, or from an external reference clock running at 10, 20, 40 or
80MHz. Besides generating the clock needed for the operation of the TTM8000, the clock synthesizer
can also generate an external output clock at 1, 2, 5, 10, 20, 40 or 80MHz.
Note that any settings made with set only remain active until the next power cycle. (See: config
clocksynth.)
set led[(info1 | info2 | info3 | A | B | C)] = (off | red | yellow | orange | green)
set led[(info1 | info2 | info3 | A | B | C) : (red | green)] = (on | off)
Turn the Info-LEDs on the TTM8000 on/off or select their color to provide visual feedback to the user.
set digitalioout[:<Mask>] = <Value>
The TTM8000 contains 8 digital I/O Ports that can be used to control/measure external signals. Use
DigitalIOOut to set the level of (selected) output pins.
43/60
TTM8000
set digitaliodir[:<Mask>] = <Value>
The TTM8000 contains 8 digital I/O Ports that can be used to control/measure external signals. Use
DigitalIODir to configure selected pins as Input (1) or Output(0).
get digitalioin <RepeatCnt> <MilliDelay>
The TTM8000 contains 8 digital I/O Ports that can be used to control/measure external signals. Use
DigitalIOIn to display the state (level + direction) of all (input and output) pins. Get DigitalIOIn can
repeatedly display the state of the DigitalIO pins with a given delay between measurements.
Example : Get DigitalIOIn 20 1000
set analogout[0..3] = <Level> [mV | V]
The TTM8000 contains 4 analog output ports that can be used to control external signals. Use
AnalogOut to set the level of these analog output pins. Valid Range: +/- 4.096V
get analogin[0..3 : uni | bi] <RepeatCnt> <MilliDelay>
The TTM8000 contains 4 analog input ports, that can be used to monitor external signals. Each signal
can either be unipolar in the range 0..+4.096V or bipolar in the range +/- 2.048V. Get AnalogIn can
repeatedly read one or more of the signals with a given delay between measurements and print the
results.
Example : Get AnalogIn[AIn0:bi, AIn1-2:uni] 20 1000
set analoginmonitor source=off | (0..3 : uni | bi) rate=<Rate> [ms | s | Hz]
get avganalogin[0..3] <AvgMilliTime> <RepeatCnt> <MilliDelay>
If the analog signals connected to the TTM8000's 4 analog input ports, are very noisy obtaining single
measurements might produce spiky results and an average measurement might convey better how the
'core' signal moves. The idea here is to set up a task on the TTM that will periodically query the TTMs
and keep a history. If we need a measurement, we shall then look at that history and compute the
average of the those samples that are no older than AvgMilliTime. If the noise is not correlated to our
measurement interval (and our measurement interval is much longer than any correlation time of the
noise), the noise on the different samples will hopefully cancel out (partially at least) and we can obtain a
measurement that contains much less noise. Obviously this benefit comes at the price that we have to
wait longer for each measurement and that the CPU of the TTM is loaded with additional work. Thus we
should only use this feature if we really need it, and remember to turn if off once no longer needed!
adjust
Adjust parameters for the current measurement. The “adjust” command works like “set”, however the
adjustment takes place at immediately (rather than with the start of the next measurement). Note that
not all parameters can be adjusted while a measurement is already in progress.
adjust slope[start | stop1 | stop2 | ... | stop8][rise | rising | fall | falling] = (0 | off | disable | 1 | on |
enable)
Enable/Disable Events Slopes
adjust signallevel[start | stop1 | stop2 | ... | stop8 | stop | all] = <Level> [mV | V]
The TTM8000 supports a wide range of input logic levels. 'High' and 'Low' signal levels are distinguished
by comparing the input level to a threshold level. Voltages greater than the threshold level are
considered as 'High', while smaller voltages are considered 'Low'. For most logic families a value in the
middle of the nominal 'High' and 'Low' level will work best (e.g. 1.5V for 3V TTL). Do not use the nominal
'High' level of your logic family as reference level!
SignalLevel controls the reference voltage used for the Start and Stop1..Stop8 inputs. Since every input
uses a reference voltage of its own, it is possible to measure signals from different logic families at the
same time. Valid Range: +/- 4.096V
adjust clocklevel = <Level> [mV | V]
The TTM8000 supports a wide range of input logic levels. 'High' and 'Low' signal levels are distinguished
by comparing the input level to a threshold level. Voltages greater than the threshold level are
considered as 'High', while smaller voltages are considered 'Low'. For most logic families a value in the
middle of the nominal 'High' and 'Low' level will work best (e.g. 1.5V for 3V TTL). Do not use the nominal
'High' level of your logic family as reference level!
ClockLevel controls the reference voltage used for the external clock. Valid Range: +/- 4.096V
TTM8000
44/60
measurement start [auto | manual]
Start the Measurement – If you are using continuous I-Mode with the Start-pulse generated by the builtin pulse generator, you can choose if you want the pulse generator to automatically generate the Startevent or if you prefer to start the pulse generator manually. Unless you want to perform calibration
measurements with the built-in pulse generator, you should always let the pulse generator automatically
generate the Start-event for you (default).
measurement stop
Stop the Measurement
pulsegen (start <FrameCnt> <FrameLen> <StopPos> <BurstCnt> <BurstDelay> <SendFirstStart>
<SendNextStart>) | stop
The TTM8000 contains a pulse generator that can be used for calibration. The pulse generator can
create a sequence of frames. Each frame has a given length (in multiples of 8ns), begins with an
(optional) pulse to the Start output and, after a suitable delay, an (optional) burst of pulses to the
Calibration Output.
The Start pulse is sent at frame-time 0 and can be individually enabled/disabled for the first frame and all
other frames. The burst of Calibration pulses starts at frame-time StopPos * 8ns. Select StopPos >
FrameLen if you don't want pulses on the Calibration output. The Burst will consist of BurstCnt pulses,
that are BurstDelay * 8ns apart. Each pulse is 8ns wide. Thus if BurstDelay is equal to one, there is no
time between two pulses and the burst of pulses merges into one long pulse. The pulse generator will
stop automatically after FrameCnt frames have been sent and can be stopped earlier by explicitly
sending a stop command.
wait until pulsegen (= | ==) done
Delay script execution until the pulse generator is done.
wait (until | while) (key | keystate) [<KeyIndex>] (= | ==) (0 | up | released | 1 | down | pressed)
Delay script execution until the state of the button on TTM8000 matches the given condition. The
KeyIndex can be either 0 ('#') or 1 ('*'). If no KeyIndex is provided, KeyIndex will be assumed to be 1.
wait until keyevent [<KeyIndex>] (= | ==) (release | press)
Delay script execution until the button on the TTM8000 changes in a given way. The KeyIndex can be
either 0 ('#') or 1 ('*').If no <KeyIndex> is provided, <KeyIndex> will be assumed to be 1.
wait (until | while) DigitalIOIn[:<Mask>] (= | == | !=) <Value>
Delay script execution until the state of the DigitialIOs match a given condition.
config fpga <File>
Update the TTM8000 FPGA Image – The update becomes active after the next power-cycle.
config firmware <File>
Update the TTM8000 PowerPC Firmware – The update becomes active after the next power-cycle.
config network [name = <BoardName>] [ipaddr = <IP-Addr>[:<Port>]] [netmask = <NetMask>]
Define the network configuration of the TTM8000.
config clocksynth [useexternclockout = (true | false)] [externclockoutfreq = <Freq> (Hz | kHz | MHz)]
[useexternclockin = (true | false)] [externclockinfreq = <Freq> (Hz | kHz | MHz)]
[externclocklevel = <Level> [mV | V]]
The TTM8000 contains a clock synthesizer, that will generate the reference clock for the TTM8000 it can
either be driven from an internal crystal, or from an external reference clock running at 10, 20, 40 or
80MHz. Besides generating the clock needed for the operation of the TTM8000, the clock synthesizer
can also generate an external output clock at 10, 20, 50, 100, 200 or 500kHz or 1, 2, 5, 10, 20, 40 or
80MHz.
Settings made with config clocksynth remain valid even if the board is power cycled. Thus a TTM8000
board, whose clock synthesizer has been properly configured, can be used as reference clock by other
devices, even if the TTM8000 itself is not actively initialized/used by a user application.
45/60
TTM8000
echo <Text>
Print a line of text
date
Print the current date/time
(sleep | msleep | usleep) <Time> [s | sec | ms | msec | us| usec | m | min | h | hour]
Delay script execution. <Time> is a floating point quantity that is optionally followed by a unit. If no unit is
provided sleep assumes seconds, msleep assumes milliseconds and usleep assumes microseconds.
def <VarName> (= | := | ::=) <Value>
Assign a value to a variable. Once a variable is defined it can be used as parameter in any command,
using the Syntax $VarName. Note however that this is a simple single-token-for-single-token
substitution. You can not use a single variable to provide a string of parameters or a complete
command.
Variables can be defined with different strictness, as either plain or protected. Plain variables are defined
using the '=' operator. They can be redefined using another (protected or unprotected) def statement.
Protected variables are defined using either the ':=' or the '::=' operator. Attempts to redefine a protected
variable using the '=' or ':=' will not change the value of a protected variable. It is however possible to
redefine a protected variable using the '::=' operator (which will again produce a protected definition) or
to use the undef command to drop the current definition and then use the def command to define a new
(plain or protected) definition.
Variables can also be assigned on the command line using the '-D' or '--def' command line option.
undef <VarName>
Undefine a previously defined variable.
TTM8000
46/60
ttmcnvt – Receive Measurement Data
TTMCnvt is a tool to receive timetag data from an UDP port or read it from a file or stdin and write it to stdout
in a variety of formats.
Note: While TTMCnvt provides a variety of output formats, it is of course likely that you need yet another
one. Since the sources of TTMCnvt are freely available, please feel free to use the code there as a reference
and starting point for adding the output format that suits your needs.
Command Line Options are:
-f, --file FName
- Read Input from File (instead of stdin)
-n, --net
- Read Input from Network (instead of stdin)
-t, --ttm8 IP:Port Time Tagging Module Data Source Port (Default: None:10502) (implies -n)
-d, --data IP:Port - Local Data Port (Default: Auto) (implies -n)
..-s, --size CNT
- Automatically Quit after Processing CNT Byte
..-e, --evtcnt CNT
- Automatically Quit after Processing CNT Events
..-u, --runtume SEC - Automatically Quit after Processing Events for SEC seconds
..-r, --recover TICKS- Enforce Recovery Time between two Events
-o, --out FMT
- Output Format
FMT: Output Format:
b binary - Useful for writing to file for later processing or filling of a pipe for processing by another
application
B expanded binary – Like 'b' however packed measurements are unpacked to flat measurements
r raw hex - Simply dump each timetag as a single hex number, without splitting for fields
h pretty hex - Dump each field (channel/slope/time) of each timetag as a hex number
t text - Write each field (channel/slope/time) in a suitable format – Additional Text depending on Data
Format
T <FormatString> - Write each event into a single line as ASCII text, that contains a copy of the
FormatString where each occurrence of the macros %CHN%, %SLOPE% and %TIME% is substituted with
suitable contents.
s statistics - Do not print a line for each individual – Make a frequency table/statistic and print that at the
end of the measurement.
Note: If you wish to receive data from the net, you will usually use either the -d or the -t option. If you
specified a specific local port when starting the TTM8000, you should use -d to receive data from this specific
port. If you have not specified the local port when starting the TTM8000 you should use the -t option and
specify the IP-address of the TTM8000 board you wish to use “any” or “INADDR_ANY” to have ttmcnvt to
search for a TTM8000 board on the net.
Some samples uses are:
Read timetags from the net and write them to stdout in human-readable format.
ttmcnvt -n -ot
Read timetags from the net and write them to stdout in a verbose user defined format.
ttmcnvt -n -oT “Channel: %CHN% - Slope: %SLOPE% - Time: %TIME%“
Read timetags from the net and write just the times (no channel number or slope) as human-readable text.
ttmcnvt -n -oT “%CHN%“
Read timetags from the net and create a frequency table of the results. Press Cntrl-C once you have
gathered sufficient data to force TTMCnvt to print its findings to stdout.
ttmcnvt -n -os
Read timetags from a particular UDP port (on the local host) and write them to a file.
ttmcnvt -d 192.168.1.66:10502 -ob >MyTimetags.dat
47/60
TTM8000
ttmmerge – Merge TTM Data from several TTM8000 boards
If you have a large measurement setup and the 8 stop channels of a single TTM8000 board are not sufficient
for your measurement, you can combine up to 16 TTM8000 boards to create measurements with up to 128
stop channels. Since the clocks of all TTM8000 boards can be synchronized to each other they will not drift
apart and all timestamps from all boards can be compared against each other.
TTMMerge will take all the measurements from multiple TTM8000s, compensate the offsets that arise from
using event sources with different speeds and/or differences in cable length and combine the resultis into a
single stream of sorted timetags. Furthermore TTMMerge can act as filter and eliminate duplicate events
(within a specified deadtime) and search for coincidences (multiple events occurring at the 'same' time (=
within a specified coincidence window). These filtered and sorted timetags can then be sent via network to
some other application for further processing, can directly be saved to file in binary format for later
processing by some application or be printed as ASCII text for human reading.
Since ttmmerge needs a lot of configuration to work as intended, it requires a configuration file, whose name
must be passed as a command line parameter.
The only useful Command Line option is:
-f, --script FName – Select the Configuration File
When writing a configuration file, it is strongly recommended that you take a look at the liberally documented
sample script that is provided in the TTM8000 software release (…/programs/Scripts/merge.cmd) and use it
as a starting point for your experiments.
In the beginning we need to define how TTMMerge shall obtain the raw timetags that it will work with.
TTMMerge can either connect directly to physical TTM8000s, or it can listen at specified UDP/IP-Ports or it
can read the timetags from files. While a connection to a TTM8000 port can carry only the data from this
single TTM8000, the other two options also permit the use of preprocessed data (i.e. the output of another
TTMMerge application) that already contains the data from multiple TTM8000s. Note that TTMMerge will
read its data either only from network or only from file. Mixing files and network connections is not permitted.
datain [<BoardID>] connect <BoardIPAddr>
Connect to the TTM8000 board specified by <BoardIPAddr>. Treat this TTM8000 board as board with
index <BoardID>. BoardID must be in the range 1..16.
Example: datain [3] connect 192.168.1.89
datain [<BoardID>] read net <LocalIPAddr>:<LocalPort>
Read Timetag Data from UDP/IP port <LocalIPAddr>:<LocalPort>. <LocalIPAddr> must be the/an IPAddress of your local computer, and LocalPort must be UDP port that someone else sends timetags to.
This could e.g. be a TTM8000 board, or another copy of ttmmerge or some other application. Note that
only one application can listen to a given UDP/IP port at any time. If you have lots of connections, you
will need to think of a numbering system that will assign a unique UDP-port to each connection.
If the data stream contains only data from a single TTM8000, this TTM8000 board will be treated as
board with index <BoardID> (within the range 1..16). If the data stream already contains data from
multiple TTM8000s (combined by a different copy of TTMMerge) you should set <BoardID> to '*'.
Example: datain [3] read net 192.168.1.56:10506
datain [<BoardID>] read file <FName>
Read Timetag Data from a binary file of Timetags (such as written by TTMCntrl, TTMViewer or
TTMMerge). Reading Text/ASCII files is not supported.
If the data file contains only data from a single TTM8000, this TTM8000 board will be treated as board
with index <BoardID> (within the range 1..16). If the data file already contains data from multiple
TTM8000s (combined by a different copy of TTMMerge) you should set <BoardID> to '*'.
Example: datain [3] read file “TtagFile89.dat”
datain [*] read file “CombinedTtags.dat”
We have now aquired timetags for events that originated from different sources, were converted to electrical
pulses by different detectors with different internal speed and traveled to the TTM8000s over cables of
different length. Furthermore the different TTM8000 also were not started at the exactly the same instant, but
using a daisy chained start signal where each link introduces a (fixed, but unknown) delay. Thus two external
events that actually occurred at the same time now have timetags with an offset. For a given measurement
setup this offset is fixed and can be compensated with a simple addition. Note that determining the correct
TTM8000
48/60
value of this offset, is part of the planning of the experiment and might be quite tricky. In many cases using a
correlation will help (see the walk-through in chapter “Sample Application: Using Multiple TTM8000 boards”).
Once we know the correct offsets we can tell TTMMerge
offset [<BoardID>.<StopID>>] = <Time>
The <BoardID>.<StopID> usually referes to a single Stop input of a single TTM8000 board (e.g. 2.6), but
you can also refer to all Stops of a board by using a '*' (e.g. 2.*).
<Time> is specified as decimal numbers with a suitable unit (ms, us, ns, ps). Internally these offsets are
converted to ticks of 82.3045ps, so the resolution of offset compensation is limited to one tick.
Note that it is also possible to use '+=' or '-=' instead of the simple '=' in the assignment, to
increase/decrease the offset. This can come handy when e.g. the cable length is changed and the
additional delay introduced here is to be computed rather than measured.
Example: offset [2.5] = 3ns
offset [4.*] += 2.7ns
Detectors that convert external event to electrical pulses are sometimes not perfect. Some tend to create
afterpulses or bounces – i.e. a single external event causes an entire stream of electrical pulses (rather than
just a single electrical pulse). TTMMerge can eliminate these unwanted additional pulses. It will declare
pulses that come within a specified deadtime interval after the previous event on the same channel as
afterpulses and delete them. There is an optional re-triggering of the deadtime. Without re-triggering
TTMMerge will delete pulses that arrive within the deadtime interval measured from the first pulse of the
pulse group. With re-triggering it will restart the deadtime every time a pulse is detected, thus the deadtime
interval will be measured from the most recent (not the first) pulse of a pulse group.
deadtime [<BoardID>.<StopID>>] = <Time>
The <BoardID>.<StopID> usually referes to a single Stop input of a single TTM8000 board (e.g. 2.6), but
you can also refer to all Stops of a board by using a '*' (e.g. 2.*).
<Time> is specified as decimal numbers with a suitable unit (ms, us, ns, ps).
Example: deadtime [2.5] = 3ns
deadtime [4.*] = 2.7ns
Sometimes we want to process a potentially infinite stream of data. Sometimes however we want to
automatically stop processing after 'enough' data has been processed. How much processing is 'enough' can
be defined in terms of time or in terms of processed input data.
Stop after <Cnt> (sec | min | hours | Byte | KByte | MByte | Events)
Automatically stop after <Cnt> seconds/minutes/hours have passed , <Cnt> Byte/KByte/MByte of input
data has been processed or <Cnt>Events have been processed.
Example: stop after 10s
stop after 100000 Events
Now that we have collected all the data and produced a single sorted stream of non-duplicated timetags, we
need to create output streams where these timetags will be sent to. There can be multiple output streams,
where each stream has its own filter for coincidences, its own output format and its own destination. Thus we
can feed multiple receivers with timetags matching their own needs (e.g. send a selection of channels to
TTMViewer via network for direct visual control and write the complete timetags to file for later processing).
When sending data via network we can choose among 4 binary format: flat multiboard format (8 Byte/event,
up to 16 boards), packed multiboard format (4 Byte/event, up to 16 boards), flat singleboard format (8
Byte/event, 1 board) or packed singleboard format (4 Byte/event, 1 board). Flat formats are easier to
process, since they don't require unpacking by the receiving application, however they incur twice the
network load of packed formats. Multiboard formats can handle 16 TTM8000 Boards (128 stop inputs), but
are not compatible with some applications such as TTMCnvt or TTMViewer.
When writing an output stream to file, we can also use the four binary formats stated above but can also use
ASCII-text format. Text format is not supported for network transmission.
When reading the input data, we assigned a <BoardID> to each input stream, and the <StopID> was already
part of the each event. Sometimes the resulting set of <BoardID>.<StopID> is inconveniant, and it might be
nice to rearrange the numbering. This is in particular true when writing data in singleboard format, where we
need to select the (max.) 8 channels that will be written while all the others will be dropped. Note that by
mapping several source channels onto a single destination channel, we can also merge the events from two
input channels.
49/60
TTM8000
Sometimes we are only interested in groups of events that occur at (almost) the same time, while the
remaining (single) events are to be considered noise (or vice-verso the singles are interesting while groups
are noise) . We wish to get rid of the noise as soon as possible to reduce the amount of data that has to be
processed later on. This too can be handled in TTMMerge.
Note: DataOut commands can become quite long. It is possible to split a single DataOut command into
several lines by ending a line with a '\' character directly followed by the line break (no spaces or other text
inbetween) to indicate that the command will be continued on the next line.
dataout send <Format> net <IPAddr>:<UDPPort> [<ChannelMapping>] [<CoincFilter>]
dataout write <Format> file <FName> [<ChannelMapping>] [<CoincFilter>]
Where <Format> is one of
flat
flat multiboard format (8 Byte/event, up to 16 boards)
packed
packed multiboard format (4 Byte/event, up to 16 boards),
singleflat
flat singleboard format (8 Byte/event, 1 board)
singlepack
packed singleboard format (4 Byte/event, 1 board).
text
ASCII text (for files only!)
<IPAddr>:<UDPPort> specifies the target IP-Address/UDP Port that TTMMerge will send its data to
<FName> is the name of the output file.
<ChannelMapping> is optional and indicates how input channels will be mapped to output channels.
Note that it is acceptable to map multiple input channels to a single output channel, which will result in
an output channel that contains all events from the contributing input channels, but a single input
channel can only be mapped to a single output channel (no multicopy). It is also possible to drop an
input channel that is not required at the moment (e.g. to reduce network load/storage requirements).
<ChannelMapping> has the following syntax:
channelmap = [(<SrcChn> -> <DestChn>) ( : <SrcChn> -> <DestChn>)+]
<SrcChn> and <DestChn> usually follow the Syntax of <BoardID>.<StopID>, where <BoardID> is a
number in the Range 1..16 and <StopID> is a number in the range 1..8. However there is a special
<StopID> of '*' which means all Stops from 1..8 together. The special <SrcChn> of '*' means all stops
from all boards, while the special <DestChn> of 'X' means 'drop'.
<CoincFilter> is optional indicates how many events must occur within a coincidence window to be
considered of interest. The Syntax for <CoincFilter> is
mincoinccount=<MinCnt> maxcoinccount=<MaxCnt> coincwindow=<Time>
Examples:
Send the merged data stream to a network port in flat multi-board format:
dataout send flat net 192.168.1.56:10007;
Send Data in single-board packed format to a given UDP-Port (where e.g. TTMViewer can pick up the
data. Since we are using single-board format, we need to map all interesting channels to the virtual
board 1. Thus we shall first mark all channels as 'drop' an then map the interesting ones to selected
Stops of board1. Note that we map two input channels to a single output channel, Thus the events from
these two channels will be merged. This merging causes information to be lost, because the event in the
output stream does no longer carry information that would allow use to identify which of the two input
stream it originally came from.
dataout send singlepacked net 192.168.1.56:10505 \
channelmap=[*->X : 1.2->1.2 : 2.2 -> 1.2 : 2.5->1.4 : 2.7->1.6];
Look for coincidences of at least 3 event (and at most 8 events) that all occurred within 30ns and write
the events that participated in this coincidence to file. Note that we do not specify which events shall
participate in the coincidence. We are just looking for coincidences of any events. This will hopefully
eliminate most of the noise. More delicate filtering for specific coincidence patterns and other processing
can than be done with custom programs that can use their delicate algorithms on the reduced dataset.
dataout write text file "CoincMergedTTMData.txt" \
mincoinccount=3 maxcoinccount=8 coincwindow=30ns;
TTM8000
50/60
ttmclkcalib – Reference Clock calibration
The TTM8000 is equipped with a oven-controlled crystal oscillator (OCXO) that is used as time reference for
the timing measurements. While this crystal is already very accurate in itself, it can be tuned for even better
precision (within a range of +/- 40ppm).
This feature can be used to align the frequency of the OCXO to a high-quality time reference (e.g. a rubidium
clock) or to match the reference clock frequencies of two TTM8000 boards.
Note that even after calibration, the clocks of two TTM8000s will still have some drift against each other.
Thus clock calibration is no substitute for a hardware clock synchronization using a cable from the reference
clock output of one TTM8000 (or some other clock reference) to the clock input of the other TTM8000.
Furthermore every clock crystal changes its frequency as it ages. Thus you might want to perform
recalibration from time to time (depending on your needs with regard to absolute time precision).
Note that all crystal oscillators are sensitive to changes in temperature. Thus you should make sure that the
TTM8000 (and your reference clock!) have been turned on for some time (~15 minutes) so that their internal
temperature had time to settle before performing the calibration.
TTMClkCalib will take a reference signal of known frequency (10kHz..10MHz) that is connected to one of the
Stop inputs of the time-tagging logic, and then measure how long it takes to receive as many events as
should occur within a second. If it took more than one second, when measured on the TTM8000 internal
clock, then the TTM8000 clock is too fast and needs to be slowed down. If it took less than one second, the
TTM8000 internal clock is too slow and needs to be speed up.
The TTM8000 hardware actually uses two voltages to tune the OCXO, one for coarse tuning and the other
for fine tuning. TTMClkCalib will first use a binary search to find the optimal setting for the coarse tuning
voltage, while leaving the fine tuning voltage in a middle setting and will then keep the coarse tuning voltage
fixed and perform binary search to find the optimal setting for the fine tuning voltage.
All this searching for the optimal settings is fully automatic. All you need to do is connect the reference signal
to any of the Stop inputs (and not connect anything to the other Stop inputs), and start TTMClkCalib. Then
wait about 30 seconds while TTMClkCalib is working and thats it. The calibration results will automatically be
stored in the TTM8000 and will remain effective even after power-cycling the device.
Example usage (assuming a 100kHz reference clock):
ttmclkcalib -f 100000
If you know that the clock is already quite well calibrated, you can skip the coarse calibration and just try to
perform fine tuning, by adding the option -a and save half the calibration time.
Other available options are:
-t, --ttm8
IP:Port - Target Time Tagging Module (Default: Auto:10501)
-n, --ttmnet IP:Port - Time Tagging Module Subnet (Default: Auto:10501)
-c, --cntrl IP:Port - Local Cntrl Port (Default: Auto:Auto)
-f, --freq
- Input Frequency [Hz]
-a, --fine
- Fine Adjustment Only
-s, --seekonly - Only look for optimal adjustment - Dont Flash
-w, --wait
- Wait for <Any> Key before quitting
-v, --verbose - Show Internal Information
-V, --version - Show Version Information
-h, --help
- Show this Text
51/60
TTM8000
Custom Applications
TTMCmd/TTMCnvt/TTMMerge and TTMCntrl/TTMViewer/TTMUserIO are intended as a demonstrations of
possible use cases not as all-in-one solutions suitable for every purpose. You will probably need to write your
own application to match your specific measurement requirements. However since the sources of all demo
applications are provided with TTM8000 you can get a convenient head start by using their code as basis of
your own development.
For a description of the API (Application Programming Interface) please check out the HTML documentation.
TTM Application development on Windows:
If you are using Microsoft Windows as your operating system, you will probably use Microsoft Visual Studio
as your development tools. Microsoft offers a “Express Edition” of Visual Studio as a free download (at
https://www.visualstudio.com) and “Professional”, “Ultimate” and “Enterprise” Editions as (increasingly
powerful and expensive) commercial solutions.
If you just want to modify the provided command line tool TTMCmd/TTMCnvt/TTMMerge or create your own
command line tools, using the Express Edition is fine.
If you want to use Qt based GUIs you will need to use at least the Professional Edition of Visual Studio to get
a complete integration of Qt development into the Visual Studio IDE. For Qt development you also need the
Qt development tools, that can be downloaded (free of charge) from http://www.qt.io/download-open-source/.
TTMCntrl/TTMViewer/TTMUserIO have been developed with Qt 4.8, however any newer version of Qt will
probably require at most minor changes. Note that you can download older versions of Qt from
http://download.qt.io/archive/qt/.
If you look into the ...\sources\ folder of the TTM8000 CD, you will see various folders that contain actual
source code for the provided applications and that are always used for all platforms and development tools
and some folders that contain ready-to-use projects for specific development environments.
If you want to modify and/or recompile the command line tools you should use the projects provided
TTMTools.VS2010 (for Visual Studio 2010), TTMTools.VS2005 (for Visual Studio 2005) or TTMTools.VS6
(for legacy systems still using Visual Studio 6).
If you want to work on the Qt-based GUI tools and have installed the Qt tools as described above, you can
use the projects provided in TTMGUI.VS2010 (for Visual Studio 2010) or TTMGUI.VS2005 (for Visual Studio
2005).
TTM Application development on Linux:
Under Linux there are many popular systems for building applications. The TTM8000 Software supports a
simple CMake and KDevelop 3 & 4.
CMake is a simple and highly portable system for building applications that is run from the command
line.You will fiind a ready-to-use project file in …/sources/TTMApps.CMake. Just issue the command cmake
CMakeLists.txt to use cmake to create a makefile for all the applications, and then use the command
make (without any parameters) to actually build the applications.
Most Linux distributions support KDevelop (either in the default installation, or easily installable from the
standard repository). KDevelop 3 was released in 2001 and was widely adopted as standard GUI for
application developent under Linux. KDevelop 4 was released in 2005, however since it was not compatible
with its predecessor, many people continued using KDevelop 3 for a long time after KDevelop 4 became
available. The TTM8000 Software Package provides preconfigured projects for both KDevelop 3 & 4.
If you choose to use KDevelop 3, there is a project file for the command line tools (TTMCmd, TTMCnvt,
TTMMerge) at …/sources/TTMTools.KDevProj/TTMTools.kdevelop. To build the GUI-based tools (TTMCntrl,
TTMViewer) use the project file at …/sources/TTMGUI.KDevProj/TTMGUI.kdevelop.
If you prefer KDevelop 4, there is a project file for all TTM8000 tools (both command line oriented and
graphical) at …/sources/TTMApps.KDev4Proj/TTMApps.KDev4Proj.kdev4
TTM8000
52/60
TTM Application development on Mac OS X:
Apple provides the free XCode development environment for OS X. XCode used to be installed automatically
with earlier releases of OS X, then Apple switched to putting XCode on the DVD with OS X but not installing
it with the default installation and currently Apple does not ship any DVDs any more and requires XCode to
be downloaded and installed by the user. It is available at https://developer.apple.com/xcode/downloads/
XCode is all you need if you just want to compile the command-line tools TTMCmd/TTMCnvt/TTMMerge. If
you want to build the GUI tools TTMCntrl/TTMViewer/TTMUserIO too, you will additionally need to download
and install Qt. It is available from http://www.qt.io/download-open-source/.
If you look into the ...\sources\ folder of the TTM8000 CD, you will see various folders that contain actual
source code for the provided applications and that are always used for all platforms and development tools
and some folders that contain ready-to-use projects for specific development environments.
If you want to modify and/or recompile the command line tools you should use the project provided in
TTMTools-XCodeProj. Just open the provided XCode project within and you should be able to compile and
run all the provided command line applications.
If you want to work on the Qt-based GUI tools and have installed the Qt tools as described above, things are
a little bit more tricky, since the XCode projects needed to create Qt applications can create a single
application at a time only and furthermore contain lots of absolute paths in the project, which make it
impossible to transfer a project from one Mac to another. Thus it is necessary to build the XCode project files
locally on the development machine. To do so open a console window and change to the folder
“sources/TTMCntrl-XCodeProj”. Despite its name this folder does not contain a XCode project yet. However
if you call qmake (without any parameters) inside this folder, qmake will read the TTMCntrl.pro file (a qmake
project file) and use that to create a XCode project. Once you have this XCode project file, you can simply
open it using Xcode, modify any files that you like and build and run the application. However if you wish to
add/remove source files to the application, you should NOT do so in XCode. Instead you should edit the
TTMCntrl.pro file and rerun qmake.
Warning: qmake is picky with file/path names. It will not work if there are any 'dangerous' characters (such as
spaces, parenthesis, brackets etc.) anywhere in the path to the project or in the file name. Since qmake
always fetches an absolute path to all referenced files, trying to evade this restriction with relative paths
(made of secure characters only) will not work.
The same approach must also be taken to compile TTMViewer and TTMUserIO. Since each run of qmake
creates a separate XCode-project, you will have three individual projects for three individual applications,
which is not as convenient as might be desirable, but can not really be helped.
TTM Application development for Raspberry
While the Raspberry is tiny, it is still powerful and it would theoretically be possible to use the Raspberry itself
to create software. However this approach is not supported by the TTM8000 Software Package. Instead the
suggested solution is to use cross compilation on Windows (or Linux). If you are a Raspberry programmer
you will probably have a cross compilation environment based on Eclipse on your desktop machine.
The TTM8000 Software Package contains a suitable Eclipse workspace at …/sources/TTMTools.Raspberry.
Note that since there is no Qt library for the Raspberry all TTM8000 applications that rely on Qt can not be
used on the Raspberry. You can only use the command-line tools.
53/60
TTM8000
Electrical and environmental specifications:
Supply Voltage:
Environment - Operation:
Temperature:
Moisture:
Environment - Storage:
Temperature:
Moisture:
Time Tagging and Clocks:
all inputs:
all outputs:
Analog Signals:
input:
output:
Digital I/O:
inputs:
outputs:
12 Vdc (8 to 14 Vdc)
1.5 A @12 Vdc (max. 3.0 A peak)
min. 5 °C, max. 35 °C
max. 85% RH, not condensing
min. -10 °C, max 80 °C
max. 85% RH, not condensing
-5 … +5V
LVTTL (drive 50Ω)
-4.5 … +4.5V
-4 … +4 V, max. load 400Ω
LVTTL (max. 3.3V)
LVTTL (max. 10mA)
Power connector / cable:
Use only LEMO connectors FGG.1B.302.CLADxx, where xx depends on your cable diameter.
View from solder side of cable connector:
Pin 1 … 12 Vdc
Pin 2 ... GND
External display connector / cable (optional):
Use only LEMO connectors FGG.1B.308.CLADxx, where xx depends on your cable diameter, on both sides
of the cable. The length of the cable to the external display is limited to 0.75 m. Use only shielded cables with
8 or 7 conductors. The shield must be connected on both sides. The layout of the cable is symmetric.
View from solder side of cable connector:
Pin 1 ... +3V3
Pin 2 … SPI_2_DOUT
Pin 3 … SPI_2_DIN
Pin 4 … SPI_2_CLK
Pin 5 … SPI_2_CS1
Pin 6 … SPI_2_CS2 (not used, can stay unconnected)
Pin 7 … DONE
Pin 8 … GND
TTM8000
54/60
Parallel IO – connector:
Use only 10 pin IDC – female connector with 2.54 mm contact spacing (e.g. Harting 09185106813)
Pin 1 … Digital IO 0
Pin 2 … Digital IO 4
Pin 3 … Digital IO 1
Pin 4 … Digital IO 5
Pin 5 … Digital IO 2
Pin 6 … Digital IO 6
Pin 7 … Digital IO 3
Pin 8 … Digital IO 7
Pin 9, 10 … GND
Analog IO - connector:
Use only 16 pin IDC – female connector with 2.54 mm contact spacing (e.g. Harting 09185166813)
Pin 2, 4, 6, 8, 10, 12, 14, 16 … GND
Pin 1 … Analog Out 0
Pin 3 … Analog Out 1
Pin 5 … Analog Out 2
Pin 7 … Analog Out 3
Pin 9 … Analog In 0
Pin 11 … Analog In 1
Pin 13 … Analog In 2
Pin 15 … Analog In 3
Signal connectors:
Use only SMB type plugs (female contact) with 50 Ω Impedance for connecting cables to the coaxial inputs /
outputs.
Warnings:
During operation the case of TTM-8000 will get hot. Be careful when touching the device. Do not
prevent free air circulation around the TTM-8000. Do not block the ventilation holes. Do not expose
the device to thermal radiation (e.g. direct sunlight or other thermal source nearby) while in
operation.
The analog and digital input ports on the back side of TTM-8000 are high impedance ports and
sensitive to electrostatic discharge. Before connecting or touching the pins make sure to touch
discharge yourself by touching the mounting screws of the back panel.
The length of the DC supply cable must not exceed 1 m. The length of the network cable should be
less than 3 m to fully comply with EN 61326-1:2006.
55/60
TTM8000
Trouble Shooting
●
All LEDs are dark!
Are you sure you have connected an appropriate power supply? The TTM8000 Board requires 12V
DC with 2Amps. Note that many small power supply packs can not deliver 2 Amps. Use the power
supply shipped with the TTM8000 Board.
●
During Booting the LEDs change for orange to green in a center-to-edge order (rather than left-toright).
The TTM8000 Board is running is Secure Mode. This means that the primary server software has
been detected as damaged (e.g. after a firmware update gone awry) and the backup software has
been booted. The board is fully functional, however you should update the primary software.
●
During Booting LED C flashes red. Then LEDs A, B and C change to orange and stay orange.
The connection between the two PCBs of the TTM8000 module is broken or the PCB is missing.
Please contact your service representative.
●
LEDs A, B and C are flashing orange
The internal voltages of the TTM8000 board are out of spec and/or the TTM8000 is overheated.
Disconnect the TTM8000 from power immediately and contact your service representative.
●
The Demo-Applications for Windows won't start, because MSVCR80.dll, MSVCP80.dll or
MSVCR100.dll is missing.
The demo applications are linked against the Microsoft Visual Studio C-Runtime environment. This
runtime environment is used by many applications and is therefore already installed on most
machines. If it is missing on your machine and Windows issues the message “The program can't
start because MSVCR80.dll (or MSVCP80.dll or MSVCR100.dll) is missing from your computer. Try
reinstalling the program to fix this problem.” you need to install the runtime environment packages.
They are available in the “Visual Studio Library” folder on your installation CD, or can be downloaded
from Microsoft at:
Microsoft Visual C++ 2010 Redistributable Package (x64) for MSVCR100.dll
http://www.microsoft.com/en-us/download/details.aspx?id=14632
Microsoft Visual C++ 2005 SP1 Redistributable Package (x86) for MSVCR80.dll / MSVCP80.dll
http://www.microsoft.com/en-us/download/details.aspx?id=5638
●
TTM8000 Module can't be found on the network.
Make sure your PC's network interface is configured correctly. Initially the TTM8000 board must be
operated in the 192.168.1.0/24 network. If you have misconfigured the TTM8000 network settings,
you can revert to factory defaults: Press the #-Button before powering on the TTM8000 and keep it
pressed until the TTM8000 has finished booting. This will cause the TTM to use the default IPaddress of 192.168.1.60 (with a netmask of 255.255.255.0). This network configuration only remains
valid until the next reset. You should therefore connect to the TTM (using the default configuration)
and assign a new permanent IP-address.
●
I can 'ping' the TTM8000 Module, but TTMCmd and TTMCntrl still won't find them
The TTM8000 Software on the PC uses broadcast network packets to detect the TTM8000 Boards.
While this is perfectly harmless some firewalls and network security tools consider the response
packets sent by the TTM8000 boards as unsolicited network traffic and silently discard the packets,
so that they never reach the TTM8000 Software and the boards remain undetected.
You can try explicitly stating the TTM8000 Modules IP-address in the TTMCmd 'connect' command
(e.g. ttmcmd -x “connect 192.168.1.60”). (This option is not supported in TTMCntrl or TTMViewer). If
that works you can be fairly certain that the network filter is the source of the problem.
Note: When TTMCntrl and TTMViewer start their network communication, the Windows Firewall will
ask if this communication shall be permitted. Beware: Windows will suggest that this communication
shall only be permitted within the Windows Domain, but not at “Home or Work” or “Public Place”.
However if you have your TTM8000 Modules in a dedicated network (rather than within your
company network), this dedicated network will probably not be a “Windows Domain” network, but a
“Work or Home” or “Public Place” network. So be sure that you enable network communication
for .”Work or Home” and “Public Place” too, otherwise the Windows Firewall will continue to block
TTM8000
56/60
your traffic.
On Windows XP the Firewall settings can be reached by opeining the Control Panel (use the Start
Menu and select “Control Panel”) and selecting “Security Center” and “Manage security settings for
Windows Firewall”
On Windows 7 you can disable the Windows Firewall by opeining the Control Panel (use the Start
Menu and select “Control Panel”) and selecting “System and Security” and “Windows Firewall”.
If you want to exercise precise control over the hole punched into the Windows 7 Firewall you can
use the “Advanced Settings” option in this dialog. All that is really needed is an “Inbound Rule” that
allow TTMViewer to communicate with any remote device via UDP at remote ports 10501 and 10502
(and any local port). TCP is not used by the TTM8000 Software. If you misconfigured your firewall
rules, this is also the correct place to fix things (e.g. delete the settings for TTMViewer) while
TTMViewer is not running, and have a new go at the optimal configuration the next time TTMViewer
is started.
●
The Windows Firewall is disabled, but the TTM8000 Modules are still not found.
If the TTM8000 Modules are still not found after the Windows Firewall has been disabled, check if
you (or your local system administrator) have installed additional security tools (e.g. Virus Scanners /
Network Filters / a Firewall other then the one shipped with Windows). Since there is a multitude of
such tools, we can not provide a guide on how to configure/disable them to get the TTM8000
Software to work. Maybe they have a dedicated item in the Control Panel, maybe there is a item in
the Windows Security Center, maybe there is a administration application in the Start Menu or there
might be an entry in the property sheet of each network interface (e.g. Check Point SecuRemote).
We strongly recommend that you seek advice from your local system administrator.
●
No measurement data is received
Is the Buffer LED lit and does the Activity LED of the network interface flash? If it is, then data is
produced (and lost on the way to your application (e.g. TTMViewer)). It the LEDs are permanently
off, then no data is produced to begin with (and the data acquisition logic is probably misconfigured).
Assuming that data is produced, but does not reach your application (or TTMViewer):
Is your Network Firewall active? Turn it off or use “Receiver Req. as Data Destination in
TTMCntrl and choose the appropriate TTM8000-module Data Source in TTMViewer.
Can you detect the network packets with a Ethernet network sniffer (e.g. WireShark)?
Are you sure the target IP address and UDP port configured in TTMCntrl matches the IP address
and UDP port used by TTMViewer?
Assuming that no data is produced in the first place:
Are you sure your input signal is connected correctly? The leftmost of the input jacks is the Start
signal, Stop1 is the second jack from the left!
If you use any 2-channel mode (G/R/M Mode) the Stop signals must be connected to Stop1 and
Stop2 (Stop3..Stop8 are disabled!).
Are you sure you enabled the Active Signal Edges of your Start/Stop inputs in TTMCntrl? Only
Active Edges produce events.
If you are using any of the Start/Stop modes (i.e. any mode that is not I-Mode cont.) are you
sure there was a Start pulse shortly before your Stop pulse?
●
TTMViewer freezes whenever a histogram window is open
Are you measuring a signal that is highly aperiodic (e.g. is randomly distributed) and has a wide
range of minimal-maximal repetition rate and/or is very fast? Calculating a histogram that has lots
(many 1000) of used bins in TTMViewer is very expensive in terms of CPU power and will give the
appearance of a frozen machine. Most of this effort is wasted, since the finite resolution of the
screen allows only one bin/pixel to be displayed. You should therefore try to reduce the number of
bins that are used by TTMViewer. You can do so by using bigger bins (incrementing BinSize),
without loss of visual precision (due to the pixel limit). As an alternative you can use a limited Time
Range (or a smaller Time Range if you are already using limits). This approach reduces the number
of events that become part of the histogram at all. Both approaches drastically reduce the CPU load
of TTMViewer Histograms.
●
Some measurement data is received at lower rates, but data gets dropped at higher rates.
Have you enabled Jumbo Frames on your PCs Ethernet controller?
57/60
TTM8000
Setting up a Network interface under Linux
As mentioned in “Preparing the HostPC and Booting the TTM8000” you will need a Ethernet interface on
your host to connect the TTM8000.
On a Linux system the Ethernet interfaces are usually called eth0, eth1, eth2 and so on. In the following we
shall assume that your host PC contains two Ethernet interfaces where eth0 is used for access to your local
network and eth1 shall be used for TTM8000.
First we will disconnect the current connection of eth1, so that we don't get queer side effects from previous
configurations
sudo ifconfig eth1 down
Now we can set the new IP-address and netmask. Since the TTM8000 board has a factory default address
of 192.168.1.60 and a netmask of 255.255.255.0 (for a 192.168.1.0/24 subnet) we must use the same
subnet for our ethernet interface. Thus we must choose an unused IP-address in the style of 192.168.1.x,
where x is an integer in the range 1..254.Note that 192.168.1.1 and 192.168.1.2 are often used by network
equipment such as routers, and that 192.168.1.60 is already used by the TTM8000 and thus can not be used
for eth1. We recommend that eth1 is reserved for the TTM8000 module. If this is not possible for you and
other devices are attached to that network too, then please check with your local system administrator to see
what IP-addresses are already in use for these devices and are thus not available for eth1. In particular, if
you want to use the TTM8000 from several host PCs, be sure to pick a different IP-address for each host
PC. For this demonstration we shall assume that there are no additional devices and we shall pick
192.168.1.143.
sudo ifconfig eth1 192.168.1.143 netmask 255.255.255.0
To obtain optimal performance you should try to increase the maximal packet size permitted on the network.
The recommended MTU (Max. Transfer Unit) size is 9000 byte, however such large frames (jumbo frames)
are not supported by all network interfaces. If the following command fails on your system, try again with
8000, 6000 or 4000 byte. If that fails too, your network interface probably does not support jumbo frames.
The TTM8000 will still work, however the CPU load (on the TTM8000 and the host PC) will be higher.
sudo ifconfig eth1 mtu 9000
Now we can enable our newly configured network interface:
sudo ifconfig eth1 up
To check that everything worked out fine, we use
ifconfig eth1
and get something along the lines of:
eth1
Link encap:Ethernet HWaddr 00:30:48:7c:9c:82
inet addr: 192.168.1.143 Bcast: 192.168.1.255 Mask: 255.255.255.0
UP BROADCAST RUNNING MULTICAST MTU:9000 Metric:1
RX packets:0 errors:0 dropped:0 overruns:0 frame:0
TX packets:16 errors:0 dropped:0 overruns:0 carrier:0
collisions:0 txqueuelen:1000
RX bytes:0 (0.0 B) TX bytes:3091 (3.0 KiB)
Interrupt:250 Base address:0xc000
You should now be able to 'ping' the TTM8000 module:
ping 192.168.1.60
and get something along the lines of:
PING 192.168.1.60 (192.168.1.60) 56(84) bytes of data.
64 bytes from 192.168.1.60: icmp_seq=1 ttl=64 time=1.90ms
64 bytes from 192.168.1.60: icmp_seq=2 ttl=64 time=0.24ms
64 bytes from 192.168.1.60: icmp_seq=3 ttl=64 time=0.27ms
TTM8000
58/60
Firewalls on Linux
Once you can successfully ping your TTM8000 module, you can try to discover the TTM8000 module using
ttmcmd.
ttmcmd --list
If ttmcmd fails to discover your TTM8000 module, there is a chance that the packets sent from the TTM8000
are blocked by the Linux network firewall (usually based on iptables). While most Linux systems come
without a preconfigured firewall, there is a (growing over the years) chance that a firewall is installed. You
can check your firewall configuration using:
sudo iptables -L
If the firewall is disabled this will produce the following output:
Chain INPUT (policy ACCEPT)
target
prot opt source
destination
Chain FORWARD (policy ACCEPT)
target
prot opt source
destination
Chain OUTPUT (policy ACCEPT)
target
prot opt source
destination
Otherwise you can clear the firewall configuration using:
sudo iptables -F
sudo iptables -t nat -F
sudo iptables -P INPUT ACCEPT
sudo iptables -P OUTPUT ACCEPT
sudo iptables -P FORWARD ACCEPT
59/60
TTM8000
Contact
Roithner Lasertechnik GmbH
Wiedner Hauptstraße 76
1040 Vienna, Austria
www.roithner-laser.com
Phone +43 (1) 586 52 43-0
Fax +43 (1) 586 52 43-44
TTM8000
60/60