1
i
819C/D Series
Integrating Sphere Detectors
User’s Manual
ii
Preface
1
Warranty
Newport Corporation warrants that this product will be free from defects in
material and workmanship and will comply with Newport’s published
specifications at the time of sale for a period of one year from date of
shipment. If found to be defective during the warranty period, the product
will either be repaired or replaced at Newport's option.
To exercise this warranty, write or call your local Newport office or
representative, or contact Newport headquarters in Irvine, California. You
will be given prompt assistance and return instructions. Send the product,
freight prepaid, to the indicated service facility. Repairs will be made and the
instrument returned freight prepaid. Repaired products are warranted for the
remainder of the original warranty period or 90 days, whichever first occurs.
Limitation of Warranty
The above warranties do not apply to products which have been repaired or
modified without Newport’s written approval, or products subjected to
unusual physical, thermal or electrical stress, improper installation, misuse,
abuse, accident or negligence in use, storage, transportation or handling. This
warranty also does not apply to fuses, batteries, or damage from battery
leakage.
THIS WARRANTY IS IN LIEU OF ALL OTHER WARRANTIES,
EXPRESSED OR IMPLIED, INCLUDING ANY IMPLIED WARRANTY
OF MERCHANTABILITY OR FITNESS FOR A PARTICULAR USE.
NEWPORT CORPORATION SHALL NOT BE LIABLE FOR ANY
INDIRECT, SPECIAL, OR CONSEQUENTIAL DAMAGES RESULTING
FROM THE PURCHASE OR USE OF ITS PRODUCTS.
First printing 2012
© 2012 by Newport Corporation, Irvine, CA. All rights reserved. No part of
this manual may be reproduced or copied without the prior written approval
of Newport Corporation.
This manual has been provided for information only and product
specifications are subject to change without notice. Any change will be
reflected in future printings.
Newport Corporation
1791 Deere Avenue
Irvine, CA, 92606
USA
Part No. 90053518 rev A
2
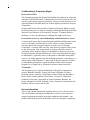
Confidentiality & Proprietary Rights
Reservation of Title:
The Newport programs and all materials furnished or produced in connection
with them ("Related Materials") contain trade secrets of Newport and are for
use only in the manner expressly permitted. Newport claims and reserves all
rights and benefits afforded under law in the Programs provided by Newport
Corporation.
Newport shall retain full ownership of Intellectual Property Rights in and to
all development, process, align or assembly technologies developed and other
derivative work that may be developed by Newport. Customer shall not
challenge, or cause any third party to challenge the rights of Newport.
Preservation of Secrecy and Confidentiality and Restrictions to Access:
Customer shall protect the Newport Programs and Related Materials as trade
secrets of Newport, and shall devote its best efforts to ensure that all its
personnel protect the Newport Programs as trade secrets of Newport
Corporation. Customer shall not at any time disclose Newport's trade secrets
to any other person, firm, organization, or employee that does not need
(consistent with Customer's right of use hereunder) to obtain access to the
Newport Programs and Related Materials. These restrictions shall not apply
to information (1) generally known to the public or obtainable from public
sources; (2) readily apparent from the keyboard operations, visual display, or
output reports of the Programs; 3) previously in the possession of Customer
or subsequently developed or acquired without reliance on the Newport
Programs; or (4) approved by Newport for release without restriction.
Trademarks
The Newport logo is a registered trademark of Newport Corporation in
Austria, Barbados, Benelux, Canada, the People’s Republic of China,
Denmark, France, Germany, Great Britain, Ireland, Japan, the Republic of
Korea, Spain, Sweden, and the United States. Newport is a registered
trademark of Newport Corporation in Austria, Barbados, Benelux, the
People’s Republic of China, Denmark, France, Germany, Ireland, Japan, the
Republic of Korea, Spain, and Sweden.
Service Information
This section contains information regarding factory service for the source.
The user should not attempt any maintenance or service of the system or
optional equipment beyond the procedures outlined in this manual. Any
problem that cannot be resolved should be referred to Newport Corporation.
3
Technical Support Contacts
North America
Newport Corporation Service Dept.
1791 Deere Ave. Irvine, CA 92606
Telephone: (949) 253-1694
Telephone: (800) 222-6440 x31694
Europe
Newport/MICRO-CONTROLE S.A.
Zone Industrielle
45340 Beaune la Rolande, FRANCE
Telephone: (33) 02 38 40 51 56
Asia
Newport Opto-Electronics
Technologies (Wuxi) Co., Ltd
理波光电科技(无锡)有限公司
江苏省无锡市新区出口加工区
J3-8 厂房 204028
Lot J3-8, Wuxi Export Processing Zone,
New District, Jiangsu China 204028
Telephone: +86-510-8113 2999
Fax: +86-510-8526 9050
Newport Corporation Calling Procedure
If there are any defects in material or workmanship or a failure to meet
specifications, promptly notify Newport's Returns Department by calling 1-800-2226440 or by visiting our website at www.newport.com/returns within the warranty
period to obtain a Return Material Authorization Number (RMA#). Return the
product to Newport Corporation, freight prepaid, clearly marked with the RMA# and
we will either repair or replace it at our discretion. Newport is not responsible for
damage occurring in transit and is not obligated to accept products returned without
an RMA#.
E-mail: [email protected]
When calling Newport Corporation, please provide the customer care representative
with the following information:
Your Contact Information
Serial number or original order number
Description of problem (i.e., hardware or software)
To help our Technical Support Representatives diagnose your problem, please note
the following conditions:
Is the system used for manufacturing or research and development?
What was the state of the system right before the problem?
Have you seen this problem before? If so, how often?
Can the system continue to operate with this problem? Or is the system nonoperational?
Can you identify anything that was different before this problem occurred?
4
Table of Contents
Warranty..................................................................................................1
Technical Support Contacts ....................................................................3
Table of Contents ....................................................................................4
List of Figures .........................................................................................5
List of Tables ..........................................................................................5
1
General Information
1.1
1.2
1.3
1.4
1.5
1.6
2
Unpacking and Inspection .............................................................6
Product Models..............................................................................6
Benefits of Using Sphere Detectors ..............................................7
Specifications ................................................................................8
Making Measurements ..................................................................8
Temperature and Humidity............................................................9
Calibration Uncertainties and Limitations 10
2.1
2.2
2.3
2.4
2.5
2.6
2.7
2.8
2.9
3
6
Spectral Response........................................................................10
Divergent vs. Collimating Beam Input Considerations...............10
Calibration Uncertainties and Services .......................................11
Detector Saturation......................................................................13
Saturation with Pulsed Power Measurements .............................14
Photodiode Operation..................................................................14
Low Power Measurement Considerations...................................14
2.7.1 Noise Characteristics .......................................................14
2.7.2 Ambient Light and Electrical Offsets..............................15
High Power Measurement Considerations ..................................16
Using the Detector for Non-CW Measurements .........................16
Factory Service
3.1
3.2
3.3
18
Introduction .................................................................................18
Obtaining Service ........................................................................18
Service Form ...............................................................................19
5
List of Figures
Figure 1
Figure 2
Figure 3
Figure 4
Figure 5
Attenuator ‘ON/OFF’ Switch is on the photodiode head ............... 7
819D integrating sphere configuration. ........................................ 11
819C integrating sphere configuration.......................................... 11
Newport detector circuitry used in photovoltaic mode................ 14
Typical responsivity curve of 819D-SL-5.3-CAL2 ...................... 16
List of Tables
Table 1
Table 2
819C and 819D Series Models. Check with Newport for the full
product offering. ............................................................................. 6
Specifications Table........................................................................ 8
6
1
General Information
This user manual contains information necessary for using model 819C and
819D Series Integrating Sphere Detectors. Please read through the guide
before attempting to make optical power measurements.
1.1
Unpacking and Inspection
The 819C and 819D Series sphere detectors are shipped in a foam padded
cardboard box, along with this user’s manual and the calibration report. The
calibration report is unique to each detector and should be archived for future
reference. The calibration interval recommended for these detectors is 12
months. Please make sure that these items are received in good condition.
NOTE
Fragile parts are contained. Use caution when handling. There is no user
serviceable part for this product.
1.2
Product Models
Model
819C-UV-2-CAL
819C-UV-5.3-CAL
819C-SL-2-CAL2
819C-SL-5.3-CAL2
819C-IG-2-CAL
819C-IG-5.3-CAL
819D-UV-2-CAL
819D-UV-5.3-CAL
819D-SL-2-CAL2
819D-SL-5.3-CAL2
819D-IG-2-CAL
819D-IG-5.3-CAL
Table 1
Sphere Size
2 in.
5.3 in.
2 in.
5.3 in.
2 in.
5.3 in.
2 in.
5.3 in.
2 in.
5.3 in.
2 in.
5.3 in.
Input Port Size
0.5 in.
1.0 in.
0.5 in.
1.0 in.
0.5 in.
1.0 in.
0.5 in.
1.0 in.
Detector Type
UV-enhanced Silicon
Silicon
InGaAs
UV-enhanced Silicon
Silicon
0.5 in.
InGaAs
819C and 819D Series Models. Check with Newport for the full product
offering.
7
1.3
Benefits of Using Sphere Detectors
Newport’s calibrated integrating sphere detectors consist of the 819C and
819D series integrating spheres, configured to measure diverging or
collimated light sources, respectively, and either a Si, UV-enhanced or an
InGaAs sensor. The integrating sphere is an ideal tool for measuring high
power or diverging light sources using a photodiode. The available sphere
sizes are between 2” and 5.3”.
The spheres with a silicon detector are suitable for the measurements ranging
from 400 – 1100 nm, while the models with an InGaAs detector are suitable
for approximately 800 – 1650 nm range. The UV detector is optimized for
wavelengths between 200 - 400 nm, but it is calibrated up to 1100 nm. All the
spheres come with an SMA fiber optic connector on the North pole as a
standard feature, allowing a small amount of light pickoff for wavelength
measurement or any further analysis without affecting the overall system
calibration.
Key Features
Competitive calibration uncertainty
Calibrated and traceable to NIST standards
Measurements are less sensitive to exact detector positioning, compared to
a photodiode or a thermopile detector
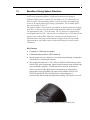
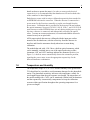
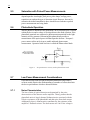
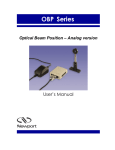
The models that end with –CAL2 utilize a 918D-SL-OD1 detector with a
built-in OD1 optical attenuator, improving the dynamic range and the high
power handling capability. The thermal sensor near the sensor head
allows correction of the optical power measurement as a function of
temperature when used with by the optical meter Models 1918-R, 1936R/2936-R, and 1830-R. The On/Off position of the attenuator is
automatically detected and the temperature reading of the detector as well.
Figure 1
Attenuator ‘ON/OFF’ Switch is on the photodiode head
8
1.4
The detectors have a built-in EEPROM which stores the responsivity data,
measured for every 10 nm step within the specified spectral range, for the
detector. The responsivity data is stored for both with and without the
attenuator filter in the beam path. The detectors are “hot-pluggable”,
enabling this data to be uploaded onto the power meter when the detector
is first connected to the instrument, allowing for corrections of the
responsivity as a function of the wavelength selected by the user.
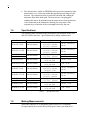
Specifications
The following table summarizes the performance specifications of the 819C
and 819D Series detectors. Specifications may change without notice.
Model
Spectral Range
819C-UV-2-CAL
200 to 1100 nm
819C-UV-5.3-CAL
220 to 1100 nm
819C-SL-2-CAL2
819C-SL-5.3-CAL2
400 to 1100 nm
819C-IG-2-CAL
800 to 1650 nm
819C-IG-5.3-CAL
860 to 1650 nm
819D-UV-2-CAL
200 to 1100 nm
819D-UV-5.3-CAL
220 to 1100 nm
819D-SL-2-CAL2
819D-SL-5.3-CAL2
400 to 1100 nm
400 to 1100 nm
819D-IG-2-CAL
910 to 1650 nm
819D-IG-5.3-CAL
930 to 1650 nm
Calibration Uncertainty
4% @ 200 - 250 nm
2.5% @ 251 - 950 nm
5% @ 951 – 1100 nm
3% @ 220 - 830 nm
3.5% @ 831 – 960 nm
3% @ 961 - 1100 nm
2.5% @ 400 - 1000 nm
3% @ 1001 – 1100 nm
5% @ 800 - 910 nm
2% @ 911-1650
5% @ 860 - 920 nm
2% @ 921-1650
4% @ 200 - 250 nm
2.5% @ 251 - 950 nm
5% @ 951 - 1100
3% @ 220 - 830 nm
3.5% @ 831 – 960 nm
3% @ 961 - 1100 nm
2.5% @ 400 - 1000 nm
3% @ 1001 – 1100 nm
5% @ 910-960 nm
2% @ 961-1650
5% @ 930-950 nm
2% @ 951-1650
Table 2
1.5
Power Range
100 nW - 100 mW @
350 nm
100 nW - 500 mW @
350 nm
100 nW – 2.0 W
100 nW – 4.0 W
100 nW - 1.5 W
1 µW - 4.5 W
100 nW - 100 mW @
350 nm
100 nW - 500 mW @
350 nm
100 nW - 2 W
100 nW - 10 W
100 nW – 2.5 W
1 µW – 9.0 W
Specifications Table
Making Measurements
Attach the connector of an integrating sphere detector to a compatible
Newport optical power meter (Refer to the power meter user manual for
9
details on how to operate the meter). In order to assure good electrical
connectivity, it is recommended that the thumbscrews located on both sides
of the connector be hand-tightened.
Each detector comes with its unique calibrated responsivity data encoded in
an EEPROM built into the connector. When the detector is connected to a
power meter for the first time, manually set up the wavelength from the
power meter. Calibration data is provided for the detector with and without
the optical attenuator. Newport’s 1830-R, 1918-R, 1928-C, and 1936/2936-R
optical meters read the EEPROM data, not only during initial power-up, but
any time a detector is connected, and subsequently sensed by the optical
meter. To ensure an accurate measurement, it is recommended that the detector be
mounted securely on an optical table.
All Newport optical detectors are calibrated with the input port surface
normal to the incident beam, with the reflectivity from the detector-air
interface and from the attenuator already taken into account during
calibration.
The models that end with –CAL2 have a built-in optical attenuator, which
can be manually switched into or out of the optical path using a slider.
Attenuator ‘ON’ and ‘OFF’ markings indicate the attenuator position (see
Figure 1). A built-in sensor automatically detects the attenuator position,
signaling the power meter to use the appropriate responsivity for the
detector/attenuator combination.
1.6
Temperature and Humidity
The temperature range of +5 to +50°C and the humidity levels greater than
70% should not be exceeded to avoid permanent damages for the photodiode
sensor. The photodiode sensitivity increases with temperature, mainly for
wavelengths longer than the peak response wavelength. The temperature of
the models ending with –CAL2 can be monitored with the built-in thermistor
and the responsivity is numerically compensated to keep the calibration
accurate within specification throughout the operating temperature for a
given wavelength.
10
2
Calibration Uncertainties and
Limitations
2.1
Spectral Response
The response of the detector depends on the wavelength of the incident light.
The photodiode is transparent for photon energies less than the band gap,
which determines the long wavelength infrared sensitivity limit. The short
wavelength limit is determined by the photodiode manufacturing process and
possibly, in the case of silicon photodiodes, by strong window absorption.
The photodiode response is commonly measured in amps of photocurrent
per watt of incident optical power. The response curves for the photodetector
are shown on the calibration report, shipped with each detector.
2.2
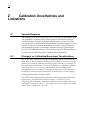
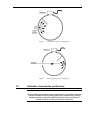
Divergent vs. Collimating Beam Input Considerations
One of the major advantages of using an integrating sphere is to diffuse the
input beam so that the detector readings are less sensitive to errors caused by
detector positioning or problems associated with overfilling, or saturation of
the active area of the detector. The detector should see a completely diffused
input field. Then, a key technical consideration, when deciding which
configuration one has to choose, is whether the input beam will directly hit
the detector, influencing the optical power at the detector. For this purpose,
each integrating sphere includes a baffle.
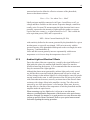
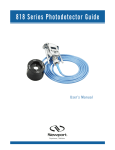
The 819D series integrating sphere detectors, ideal for measuring divergent
light sources, are configured as shown in Figure 2. The 819C series
integrating sphere detectors, ideal for measuring collimated light sources, are
configured as shown in Figure 3. If the light source is diverging with a small
angle, either configuration will work.
11
2.3
Figure 2
819D integrating sphere configuration.
Figure 3
819C integrating sphere configuration.
Calibration Uncertainties and Services
STATEMENT OF CALIBRATION
The uncertainty and calibration of this photodetectors are traceable to National
Institute of Standards and Technology (NIST) or an equivalent body, through
equipment which is calibrated at planned intervals, and by comparison to
certified standards maintained at Newport Corporation.
12
Newport Corporation calibrates its detectors using secondary standards
directly traceable to NIST and/or NRC. The absolute uncertainty of the
photodetector calibration is indicated on the calibration report. Detector
response can change with time at different wavelengths, especially in the
ultraviolet, and should be returned for recalibration at 12 month intervals to
ensure confidence in the accuracy of the measurement.
Note that the system calibration is no longer valid if any component is
changed from the original calibrated configuration. For a very high power
level, elevated temperature of the integrating sphere system can affect the
measurement accuracy, so the sphere must be temperature controlled. We
recommend that the system be calibrated every year, along with the optical
power meter.
For recalibration services, contact Newport Corporation at 800-222-6440.
13
2.4
Detector Saturation
For low optical power, the photocurrent is linearly proportional to the optical
signal incident on the photodiode. For high optical powers, saturation of the
detector begins to occur and the response signal is no longer linearly
proportional to the incident power. Optical power measurements must be
made in the linear region to be valid. Newport’s optical meters measure the
current coming from the detector and will let you know before the detector is
near its saturation point. However, even with low total power, it is possible to
locally saturate the detector by subjecting it to high power densities (power
per unit area), i.e., a very small beam size. This is why it is important to fill
the central portion of the detector’s active area as much as possible.
NOTE
The saturation is “soft”, i.e. the detector output does not suddenly stop
increasing, but the rate of increase slows. For Gaussian and other signals with
spatially varying intensities, local saturation may occur. The onset of saturation
is not always obvious and is a common source of inaccurate measurements.
To determine if the detector is saturating, follow the steps below:
1. Measure the photodetector current (or power), and record this value (A).
2. Place a filter or attenuator of known transmission (T) in the beam path.
Record the current again (B). A filter transmission of 0.001 is a
convenient choice.
3. The power with the filter in place should be the product of the power
measured without the filter and the transmission of the filter, i.e. B = A x
T.
If the transmission (T) of the filter is not known, it can be determined by
following the steps below:
1. Reduce the optical power to a level low enough to avoid saturation, but
high enough that, when it is reduced by the filter it can still be accurately
measured.
2. Follow steps 1 and 2 in the procedure above.
3. Calculate the ratio T = B/A to determine the transmission of the filter at
the wavelength of light used for the measurement.
The calibrated filter (or attenuator) can be used with the detector to measure
the power of higher power beams.
14
2.5
Saturation with Pulsed Power Measurements
Saturation effects, when using pulsed lasers, are a complex phenomenon and
depend upon the wavelength, peak power, pulse shape, average power,
repetition rate, and on the type of detection circuit. However, the test for
saturation described immediately above should be used whenever pulsed
power measurements are being made.
2.6
Photodiode Operation
When a photon is absorbed in the photodiode, an electron-hole pair is formed
within the device and a voltage is developed across the diode junction. If the
photodiode terminals are connected a photocurrent proportional to the light
intensity will be generated. Measuring this photocurrent provides a
measurement of the optical power incident upon the detector. Newport’s
power meters utilize an Op Amp to enable unbiased photocurrent
measurement. Operation with zero bias is called the Photovoltaic Mode.
Figure 4
2.7
Newport detector circuitry used in photovoltaic mode
Low Power Measurement Considerations
Proper detector usage in the low light measurement situations and achievement of
accurate results requires the understanding of a number of effects that limit
the device performance which are discussed below.
2.7.1
Noise Characteristics
The lower limits of optical detection are determined by the noise
characteristics of the detector and/or amplifier. Theory predicts that the
photodiode noise is largely thermal (Johnson) noise associated with the
effective resistance of the photodiode and shot noise from dark current.
Additionally, there is Johnson noise contributed by the resistance of the
amplifier’s feedback resistor. The dark current at a 10mV bias voltage is
15
measured and used to define the effective resistance of the photodiode,
known as the shunt resistance:
Rshunt = Vbias / Idark where Vbias = 10mV
Ideally an input amplifier connected as in Figure 4 would have no off- set
voltage and there would be no dark current. In practice though, a small bias
usually exists. For non-CW measurements the light detection limit is more
generally expressed as the intensity of light required to produce a current
equal to the noise current, i.e. a signal-to-noise level of 1. This is called the
noise equivalent power (NEP) and is expressed as:
NEP = Noise Current/Sensitivity (W/√Hz)
with sensitivity defined as the current generated by the photodiode for a given
incident power, at a specific wavelength. NEP varies inversely with the
spectral response of the photodiode and depends on the wavelength, the noise
frequency, f, and bandwidth, f.
Noise and dark current generally increase exponentially with detector
temperature so it is best to keep the temperature close to 25°C.
2.7.2
Ambient Light and Electrical Offsets
Due to the reduced detector responsivity, caused by the signal diffusion of
light inside the sphere, the ambient light should be reduced as much as
possible when using the detector. It is recommended that the measurement
setup be constructed in a light tight box.
Although the photocurrent generated by ambient light can be easily zeroed
out, the shot noise associated with the photocurrent will not be zeroed, nor
will any changes in the ambient light levels, which might be caused by people
moving around in the room. A small electronic offset will always be present
with semiconductor detectors, caused by an interaction of the detector shunt
resistance with voltage offsets in the amplifier circuitry. The offset can be
removed by use of the optical meter’s zero function. Please note, however,
that the offset is a function of the temperature of both the photodiode and the
amplifier inside the optical meter.
When measuring very low light levels, it is best to re-zero the meter
whenever you think that the temperature of the detector or the optical meter
may have changed. For instance, it is good practice to re-zero the meter after
a warm-up period of about 30 minutes. Refer to your optical meter manual
for details regarding the zeroing procedure.
16
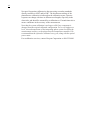
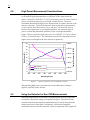
2.8
High Power Measurement Considerations
Integrating sphere detectors are often used in high power measurements, due
to the natural signal attenuation due to diffusion of the signal inside the
sphere. Newport’s 819D-SL-5.3-CAL2 can measure up to 10 watts of optical
power at its peak responsivity wavelength, around 980 nm. The main
mechanism that limits the high power measurement of a sphere detector is the
detector saturation. The InGaAs detectors start to saturate at approximately
10 mA current, the Si detectors at 2 mA, and the UV detectors at 100 uA.
Because the responsivity is wavelength dependent, the maximum optical
power at which the photodiode saturates is also wavelength dependent.
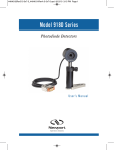
Figure 5 shows a typical responsivity curve of a 819D-SL-5.3-CAL2 (shown
in blue, if viewed in color). The maximum power before saturation becomes
higher at the wavelengths with lower detector responsivity.
20
3.0E-04
2.5E-04
Max Power (W)
16
14
2.0E-04
12
10
1.5E-04
8
1.0E-04
6
4
Max Power
2
819D-SL-5.3-CAL2
0
400
500
600
700
5.0E-05
800
900
1000
Typical Responsivity (A/W)
18
0.0E+00
1100
Wavelength (nm)
Figure 5
Typical responsivity curve of 819D-SL-5.3-CAL2
When making high power measurements, ensure that proper cooling is
applied, especially at the detector.
2.9
Using the Detector for Non-CW Measurements
When the photodetector is used with a Newport optical meter, it is operated
essentially without bias voltage, as depicted in Figure 4. The effective time
constant of the detector/amplifier combination may be much slower than the
characteristic time of the signal. Nonetheless, if the detector/amplifier
combination does not become saturated, effective integration of the signal will
17
occur, and accurate power measurements of very short pulses can be made.
Additionally, if the repetition rate or duty cycle is sufficiently high, good
average power measurements can be made. Usually it is helpful to turn on the
analog filter (5Hz low- pass) to smooth the DC component so that the optical
meter will make consistent measurements of the average power.
18
3
Factory Service
3.1
Introduction
This section contains information regarding obtaining factory service for the
products. The user should not attempt any maintenance or service of this
product. Contact Newport Corporation or your Newport representative for
assistance. The detector calibration uncertainty is warranted for a period of
1 year with a normal use.
3.2
Obtaining Service
To obtain information concerning factory service, contact Newport
Corporation or your Newport representative. Please have the following
information available:
1.
Product model number
2.
Product serial number
3.
Description of the problem.
If the instrument is to be returned to Newport Corporation, you will be given
a Return Authorization Number, which you should reference in your shipping
documents. Please fill out a copy of the service form, located on the
following page, and have the information ready when contacting Newport
Corporation. Return the completed service form with the instrument.
19
3.3
Service Form
Newport Corporation U.S.A.
Office: 800-222-6440
FAX: 949/253-1479
Name _______________________________
Return Authorization #__________________
(Please obtain RA# prior to return of item)
Company ________________________________________________________________________
(Please obtain RA # prior to return of item)
Address ________________________________ ____________________Date _________________
Country _______________________ Phone Number ______________________________________
P.O. Number ___________________ FAX Number _______________________________________
Item(s) Being Returned:
Model # _______________________ Serial # __________________________
Description _______________________________________________________________________
Reason for return of goods (please list any specific problems):
20