1
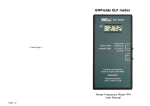
Acoustimeter
User Manual
Safety Instructions
Please read through these instructions
carefully before operating the instrument.
This contains important information
regarding usage, safety and maintenance.
The instrument is not waterproof and
should not come into direct contact with
water, nor should it be used outdoors in the
rain. If it is raining and you want to take
measurements outside, please cover the
instrument in a plastic bag that does not
have holes in it. Clean the case using a
damp cloth if necessary and do not use
detergents.
This instrument is not intended to be
serviced by the user neither does it need
any special maintenance. Unscrewing the
case will void the guarantee.
This instrument is sensitive to heat and
impact. Exposing the instrument to high
temperatures or dropping the meter on to a
hard surface may cause it to stop
functioning properly. It may not display
properly while it is in temperatures below
freezing (0°C).
2
Contents
Safety Instructions ..........
2
Technical Specifications ..
4
Introduction ....................
5
Layout of the meter ........
6
Operation and use ..........
7
LED displays .....................
13
Troubleshooting ..............
14
Exposure Guidance .........
16
Guarantee ......................
18
Approvals and Contact ...
19
3
Technical Specifications
Typical overall frequency response using the
internal antenna:
200 MHz – 8000 MHz ± 3dB ± 0.01 V/m
150-200 MHz and 8-10 GHz ± 6dB
Measurement Range:
Peak: 0.02 - 6.00 volts per metre, V/m
Average 1-100 000 microwatts/sq.metre
µW/m2
The detector can respond to levels below
0.02 V/m - audio from demodulation may
be heard at levels below 0.02 V/m.
The LCD displays peak-hold (since turned
on), peak and average values.
Peak LED Scale Points updated c. 100 ms:
0.02, 0.03, 0.05, 0.07, 0.1, 0.2, 0.3, 0.5,
0.7, 1, 1.5, 2, 3, 4.5, 6 V/m
Average 6400 samples updated c. 250 ms:
1, 5, 10, 25, 50, 100, 250, 500, 1 000,
2 500, 5 000, 10 000, 25 000, 50 000,
100 000 µW/m2
Power:
c.90-125 mA at 3 volts (2xAA Alkaline or
NIMH rechargeable cells @ 1.2 - 1.5V)
Battery Life: typically 15 to 20 hours.
‘Low battery’ detection is indicated.
Size: 190mm x 102mm x 33mm (LxWxD)
Weight: 275g, excl. batteries, 320g with.
4
Introduction
The Acoustimeter has been designed to
enable you to make a quick and informed
judgement regarding the level and nature of
microwave signals in your environment. The
Acoustimeter is a broadband meter that
measures the totality of the radiation in the
range 200 MHz to over 8000 MHz (8 GHz),
which covers the frequencies used by most
modern communication systems in our
everyday environment. It was designed
using the experience gained from many
years of practical RF and microwave
measurements using a wide variety of
professional instruments.
Readings are shown on both an LCD display
and two series of graduated LED lights. The
LEDs update rapidly, and allow you to
quickly gauge the levels in an area and find
any hot-spots. The Acoustimeter also has a
loudspeaker (and audio output socket for
headphones or an audio recorder), allowing
you to determine, with a small amount of
practice, what type of device is creating the
signals.
Sound samples and a RF unit converter to
help you identify different signals are
available on:
http://www.emfields-solutions.com/rf
5
Layout of the meter
Key: 1. Display
2. Peak signal LEDs
3. Average power LEDs
4. Audio jack, mono, 3.5mm
5. Volume control
6. On - Off switch
7. Internal Antenna
8. Loudspeaker
9. Battery compartment
6
Operation and use
Ensure that you have correctly inserted
correct batteries (2 x AA cells). Move the
power switch into the “On” position. The
LEDs should at once display a moving
pattern across all LEDs and the LCD should
briefly display
“Acoustimeter v04 © EMFields 2015”
changing to readings after a short time.
Hold the bottom of the instrument in one
hand at least 30cm from your body as close
proximity to your body will affect the
readings. Keep your hands away from the
top of the instrument as the antenna is
located inside the case at the rear towards
the top. The Acoustimeter can be located
upright on a surface, but people nearby can
still affect the RF/microwave levels.
Adjust the volume to suit level (usually
somewhere about mid-volume is best; only
use maximum with weak signals).
The instrument will display the peak signal
strength and the average power on both
the LEDs and the LCD. Slowly turn the
instrument around in all directions for the
best reading. Hold it still to take a reading.
Bear in mind that even moving the meter
small distances can result in detecting very
different levels of microwave energy.
7
Microwaves are reflected off the ground
and other surfaces so it is important to
check all angles. The highest readings will
often be found when holding the
instrument facing you at an angle between
horizontal and vertical.
We recommend taking the highest reading
found in any one spot, as this is when the
antenna is most closely aligned with the
directionality of the signal. The “Peak-hold”
function will display the highest peak
reading measured until the instrument is
turned off and on again.
If there is hardly any noise with the volume
turned up then the instrument is not
detecting any amplitude modulated
(i.e. “pulsing”) signals. Various sounds
represent the amplitude modulation and
digital pulsing of RF signals detected by the
instrument.
It is sometimes possible to hear voices and
music when very close to powerful medium
and short-wave AM transmitters, which are
outside of the normal RF frequency
detection range of the meter.
When no LEDs are illuminated any regular
very quiet ticking sounds should be ignored
- they are due to the internal functioning of
the meter.
8
Why are there two different readings?
The Acoustimeter is unique in the way it
displays information about its readings.
There are two different displayed results,
showing values for Peak and Average
measurements. At first, this may seem
confusing. We believe that it is important to
know both when assessing your exposure to
modern telecommunication signals. We
believe that it is the peaks in pulsing signals
that are the most bio-active at typical
modern relatively low exposure levels.
Digital and Analogue?
Most modern wireless devices use a digital
system of communicating. These include
mobile phones, WiFi, Cordless phones
(DECT), Digital TV & DAB Radio. Many
modern digital systems turn the signal on
and off at high speeds to represent data,
often with extra gaps between data bursts.
This produces a non-continuous signal,
which we describe as “pulsing”. The
Acoustimeter allows you to hear this as one
way of identifying the signals.
An analogue signal is a system of
communication that is not digital. They use
a continuous carrier, and instead of turning
“on and off” to represent data, will vary the
frequency (FM) or strength (AM).
9
Differences between peak & average
With an analogue system, the peak and
average levels should be similar, as the
signal is continuously on while it is being
used. However, because most digital
systems spend a large proportion of their
time not transmitting, the average level
does not represent the actual waveform
even though it is technically accurate as
shown in the diagrams below.
10
Why does this matter?
Since wireless communications were first
developed on a large scale, the scientific
community held the opinion that “if it does
not heat you it will not hurt you”, as 50
years ago, these were the only effects that
were acknowledged. The average heating
effect was what mattered. The units
typically used now for measuring the timeaveraged power of microwave frequency
EMFs is microwatts of power arriving per
square metre (µW/m2), and we have used
this for the “average power”.
There have now been hundreds of studies
finding non-thermal effects from modern
wireless communication signals. This
requires a change in what is measured to
suit much lower signal levels with different
characteristics. We believe that peak signal
strength is the most appropriate way to
measure complex digitally modulated, often
non-continuous, signals in a meaningful
manner. Signal strength is measured in volts
per metre (V/m). Many electrosensitive
individuals report most adverse health
effects in areas that have quite high peak
levels but have average field strengths
below even precautionary guidelines
regarding average power levels.
11
The Acoustimeter calculates the average
power in the measured RF by an analysis of
the waveform. The average power is shown
on the LEDs and on the LCD display.
The LED points on each of the scales are
approximately equivalent across the two
columns of LEDs for continuous wave (CW)
signals. The more pulsatile the signal is, the
higher the peak scale will read in
comparison to the average power scale.
The EMFields website has an RF unit
converter for CW signals on this page:
http://www.emfields-solutions.com/rf
What do the LED colours mean?
Our peak signal strength scale is coloured
based on the levels that electrosensitive
people report as adversely affecting their
health.
Below 0.05 volts per metre (V/m), few
people report ill-effects, so these are green.
Between 0.05 and 0.5 V/m, some
individuals report ill-effects, so these are
yellow. Above 0.5 V/m, nearly all sensitive
individuals report experiencing adverse
health effects, so these are red.
The average power density scale LEDs are
all orange in colour.
12
1 W/m2 = 1,000,000 µW/m2 =
= 100 µW/cm2 = 0.1 mW/cm2
13
Troubleshooting
The meter is not working.
Check switch is in the “on” position.
Check that the batteries are correctly fitted.
The batteries may be flat. Try changing them.
Note: If the LCD is displaying a reading, then the
meter is turned on and working.
LCD is blank or shows black squares.
Make sure that you leave 1 second between
turning it off and turning it on again.
The meter makes three loud beeps.
Check for a “Low battery” screen message next
time it beeps. Replace the batteries.
The instrument readings are varying.
Make sure your fingers are clear of the antenna.
Modern signals pulse and peak signals are not
consistent. The instrument is sensitive and picks
up these variations. Regular high “blips” every
few seconds may be due to a rotating radar
transmitter or a WiFi signal.
The peak signal is high, but the average
signal is low.
This is to be expected from many modern
pulsing digital microwave signals.
The levels are very low (no LEDs lit), but I
can just hear a slow, regular, ticking (a bit
like a very faint heartbeat)
This is the instrument picking up its own internal
meter circuitry and not external signals. This
only happens if the field levels are below
0.02 V/m and no LEDs are lit.
14
The instrument is giving readings that
surprise me. Are they correct?
Our extensive tests have shown that the
Acoustimeter readings usually give a good
indication of the microwave levels present.
Measuring pulsing RF signals over a wide
frequency range is extremely difficult to do.
Even professional instruments costing many
thousands of pounds have quite large error
margins. How you should add all the various
frequencies and waveforms is a large debate on
its own. Different meters may well give different
readings depending on what is being measured.
Many budget meters incorrectly display a high
peak power derived from peak signal strength as
if it were a CW signal.
It still makes a noise when inside a
headnet or behind my screening
The audio section of the Acoustimeter is
sensitive so even low signals can seem quite
loud. Check the figures that the Acoustimeter is
displaying.
A 99.9% reduction of 100000 µW/m2 to 10
µW/m2 (a 2 V/m signal reduced to 0.05 V/m)
will still be showing and sounding on the meter.
Close to transmitting sources it is likely that you
will still hear something.
The screening material may have degraded over
time, or you may have a gap in your screening.
Even small gaps (including above and below
you) will let in microwave signals.
15
General Public Levels
ICNIRP, 1998
(recognised by WHO, EU & UK )
Russia 2003 (general public), PRChina
Italy, Decree 381 (1999)
Frequency
MHz
400
900
1800
2100
300 - 300000
30 - 30000
Swiss Ordinance ORNI, rms values ,
(for base stations) 1st. Feb. 2000
EU & UK EMC suscept. regulations
900
1800
30 - 2000
Belgium - Wallonia
900, 1800, 2100
Typical max in public areas near
base station masts (can be higher)
900, 1800, 2100
USA City Dweller max (FCC 1999)
30 - 300000
Wien (Vienna)
Sum of GSM
Italy (2003) each base station (aim);
Lichtenstein law from 2013
Salzburg - 1998 & 2000
900, 1800, 2100
Sum of GSM
BioInitiative, 2007
30 - 300000
EU-Parliament bill, GD Wissenschaft,
STOA GSM (2001)
900, 1800,
2100
Typical US (EPA 1980, mainly FM & TV)
30 - 300000
Salzburg - 2002, outside houses aim
900, 1800, 2100
BioInitiative, 2012 (guidance)
30 - 300000
Salzburg - 2002, inside houses
900, 1800, 2100
Mobile phones will work at levels
900 - 2100
Broadband ‘natural’ background
300 - 3000
16
Frequency
MHz
E field
V/m
Power
W/m2
Power
µW/m2
400
900
1800
2100
28
41
58
61
2
4.5
9
10
2 000 000
4 500 000
9 000 000
10 000 000
300 - 300000
6
0.1
100 000
30 - 30000
6
0.1
100 000
900
1800
4
6
not
spec
not
specified
30 - 2000
3
not spec
not spec
900, 1800, 2100
3
0.024
24 000
900, 1800, 2100
2
0.01
10 000
30 - 300000
<2
< 0.01
< 10 000
Sum of GSM
1.9
0.01
10 000
900, 1800, 2100
0.6
0.001
1000
Sum of GSM
0.6
0.001
1000
30 - 300000
0.6
0.001
1000
900, 1800,
2100
0.2
0.0001
100
30 - 300000
< 0.13
<0.00005
< 50
900, 1800, 2100
0.06
0.000 01
10
30 - 300000
0.03
0.000 005
5
900, 1800, 2100
0.02
0.000 001
1
900 - 2100
0.00001
< 3 e-11
< 0.000 03
300 - 3000
<0.00003
< 1 e-13
<0.0000001
17
Disclaimer
While EMFields considers that the
information and opinions given here are
sound, you must rely upon your own skill
and judgement when interpreting or
making use of the information contained
in this manual.
Guarantee
The Acoustimeter comes with a 2 year
return-to-base Guarantee.
Please contact us (see page 19) for details
and to arrange a return if required. The
meter is guaranteed to be free of
manufacturing defects, but not against
wear from normal use, nor damage caused
by water or by physical impacts such as
from dropping it.
Please note:
The Acoustimeter is a very sensitive
meter. It has a degree of overload
protection built-in, but it should not be
used
next
to high-powered
RF
transmitters that are likely to grossly
overload it. Approach these with caution
and watch the displays to avoid gross
overload.
18
EMFields Solutions Ltd
12 Mepal Road
Sutton, Ely
Cambridgeshire
CB6 2PZ, UK
Tel: (+44) (0)1353 778814
Email:
[email protected]
www.emfields-solutions.com
European Approvals
CE, ROHS and WEEE
The Acoustimeter meets
EN61000-6-3:2001+A11:2004
EN61000-6-1:2001 EMC standards
and also meets
ROHS 2 2011 (2002/95/EC) and
WEEE (2012/19/EU) (2002/96/EC)
The Waste Electrical & Electronic Equipment
(WEEE) Directive requires that unwanted
electronic equipment must be disposed of
using specialist recycling. Your Acoustimeter
can be returned to us for recycling. UK local
waste recycling centres also provide free
collection points for WEEE.
v5.2 2015-03-11
19