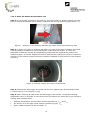
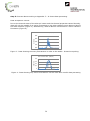
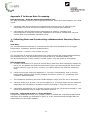
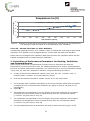
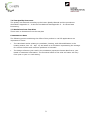
1
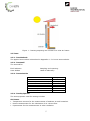
ETV Test Report Ans Solvarme Vacpipe Open End 15/180/30 Danish Technological Institute Refrigeration and Heat Pump Technology J.no. 1202 Test no. 1 – Type-test Version 1.2 1. Table of contents 1. 2. Table of contents ................................................................................................. 2 Introduction ........................................................................................................ 3 2.1. Verification Protocol Reference ..................................................................... 3 2.2. Name and Contact of Vendor ....................................................................... 3 2.3. Name of Centre/Test Responsible ................................................................. 3 2.4. Expert Group ............................................................................................. 3 3. Test Design ........................................................................................................ 3 3.1. Test Site ................................................................................................... 4 3.2. Type of Site ............................................................................................... 4 3.3. Addresses ................................................................................................. 4 3.4. Descriptions .............................................................................................. 4 3.5. Tests ........................................................................................................ 5 3.5.1. Test Methods ....................................................................................... 5 3.5.2. Test Staff ............................................................................................ 5 3.5.3. Test Schedule ...................................................................................... 5 3.5.4. Test Equipment .................................................................................... 5 3.5.5. Operation Conditions ............................................................................ 6 3.5.6. Operation Measurements ...................................................................... 6 3.5.7. Test Matrix .......................................................................................... 6 3.5.8. Product Maintenance ............................................................................ 6 3.5.9. Health, Safety and Waste ...................................................................... 6 4. Reference Analysis .............................................................................................. 6 4.1. Analytical Laboratory .................................................................................. 6 4.2. Analytical Parameters ................................................................................. 6 4.3. Analytical Methods ..................................................................................... 6 4.4. Analytical Performance Requirements ........................................................... 7 5. Data Management ............................................................................................... 7 5.1. Data Storage, Transfer and Control .............................................................. 7 6. Quality Assurance ................................................................................................ 7 6.1. Test Plan Review ........................................................................................ 7 6.2. Performance Control ................................................................................... 7 6.3. Test System Control ................................................................................... 7 6.4. Data Integrity Check Procedures .................................................................. 8 6.5. Test System Audits..................................................................................... 8 6.6. Test Report Review .................................................................................... 8 7. Test Results ........................................................................................................ 8 7.1. Performance Test Summary ......................................................................... 8 7.2. Test Measurement Summary ....................................................................... 9 7.3. Test Quality Assurance.............................................................................. 11 7.4. Deviations from Test Plan .......................................................................... 11 Appendix 1 Terms and Definitions used in the Verification Protocol ................................ 13 Appendix 2 References ............................................................................................. 16 Appendix 3 Application and Performance Parameter Definitions ..................................... 17 Appendix 4 In-House Test Methods ............................................................................ 18 Appendix 5 In-House Data Processing ........................................................................ 21 Appendix 7 Test Data Report .................................................................................... 27 Version 1.2 2. Introduction Environmental technology verification (ETV) is an independent (third party) assessment of the performance of a technology or a product for a specified application under defined conditions and quality assurance. DANETV is a Danish center for verification of environmental technology. This test report is the result of a test design developed for performance verification of an environmental technology according to the ETV method. 2.1.Verification Protocol Reference J.no 1202 – Ans Solvarme Vacpipe Open End 15/180/30 - Verification Protocol 2.2.Name and Contact of Vendor Ans Solvarme ApS Palle Kerdil Kertemindevej 160, DK-5800 Nyborg Phone: +45 65 36 12 19 Email: [email protected] 2.3. Name of Centre/Test Responsible Verification Center: Danish Technological Institute, Refrigeration and Heat Pump Technology, Building 2, Gregersensvej, DK-2630, Taastrup Verification responsible: Emil Jacobsen (EMJA), e-mail: [email protected] Phone: +45 7220 2323 Internal reviewer: Bjarke Paaske (BJPA), e-mail: [email protected] Phone: +45 7220 2037 2.4.Expert Group The expert group assigned to this verification and responsible for the review of the verification plan and report documents includes: Simon Furbo (SF), DTU Civil Engineering, phone +45 45251857, e-mail: [email protected] 3. Test Design The DANETV solar air heater test is developed with the specific aim of making the test results as applicable, transparent and comprehensible as possible for the intended end user/homeowner/buyer. Even though the EN 12975 standard for testing liquid heating collectors exits, this standard mainly deals with the robustness and thermal effectiveness of liquid heating collectors. Therefore, it is not applicable for open loop solar air heaters. Other previous tests of open loop air heaters, mainly centered on the effectiveness of the air heater, are very technical and not directly applicable for the intended end user/homeowner. Therefore, the DANETV test focuses on the verification of the vendor claims. The vendor claims are often related to energy savings, improved ventilation, improved indoor climate, or the like. 3 Furthermore, in order to give a better idea of how the solar air heater performs in an actual setting, a test rig has been built to simulate real running conditions comparable to those present when the air heater is mounted vertically on the side of a house or a garage. Establishing the actual performance characteristics of the air heater has a great advantage over laboratory tests with forced ventilation through the solar air heater as the fans are known to be very sensitive to pressure losses, both related to the heater itself and the downstream hot air channel. Tests performed on different models and makes are comparable by means of calculations based on data from the test rig and on regional climate data (design reference year data). Further information about the test, test rig and calculations can be found in Appendix 4 and 5. This above mentioned test is conducted in order to verify the following target and effect(s): The target of the product is: Supplementary heating and ventilation of summer houses, garages, etc. The effect of this application is primarily: Improved indoor climate in unheated humid buildings. 3.1.Test Site The performance tests were carried out at an outdoor solar energy test site at Danish Technological Institute in Taastrup, Denmark. 3.2.Type of Site The solar energy test site at Danish Technological Institute in Taastrup is a site used for various solar energy related field tests as well as for research and development. The site has a south facing facility building which is shade free year round. 3.3.Addresses The address of the site is: Danish Technological Institute, Refrigeration and Heat Pump Technology, Gregersensvej, DK-2630 Taastrup 3.4.Descriptions Open loop solar air heaters are characterized by simple devices which require very little or no maintenance. They usually consist of three major parts: 1) Either a cabinet with a translucent cover or a fixture with a heat pipe array 2) A solar cell 3) A ventilator with or without a temperature regulated controller When the solar cell powers the ventilator, cold outdoor air is driven through air channels which are irradiated, whereby the air is heated. Subsequently, the heated air is channeled into the summer house or garage whereby it is ventilated, heated, dried, or a combination these (see Figure 1). 4 Figure 1 - Drawing depicting the function of a solar air heater 3.5.Tests 3.5.1. Test Methods The applied test method is described in Appendix 4 – In-house test methods. 3.5.2. Test Staff The test staff is: Emil Jakobsen Hans Walløe Sampling and reporting Head of laboratory 3.5.3. Test Schedule Task Application definition document Verification protocol with test plan Test Test reporting Verification Verification report Verification statement Timing Oct. 2011 Feb. - Apr. 2012 March 2012 April 2012 April 2012 April 2012 April 2012 3.5.4. Test Equipment The test equipment used for testing includes: Air Heater Temperature sensors for the measurement of ambient air and heated air Hotwire anemometer for the calculation of air volume flow Pyranometer for the measurement of solar irradiation 5 All data was collected with a data acquisition unit with a sampling interval of two seconds. 3.5.5. Operation Conditions During operation, the air heater controller was adjusted to the highest/warmest setting (if present/applicable). 3.5.6. Operation Measurements The system was operated under various conditions before the performance test in order to ensure that everything worked correctly. Data collection from all measuring equipment was evaluated in order to check that the system was running as planned. 3.5.7. Test Matrix The methods described in Appendix 4 - In-house test methods and Appendix 5 -In house data processing were applied during the test. 3.5.8. Product Maintenance No maintenance was required for the testing of the product. 3.5.9. Health, Safety and Waste The use of this product does not imply special health, safety and waste issues. Work during testing complied with the general rules regarding safety at Danish Technological Institute. 4. Reference Analysis 4.1.Analytical Laboratory No external analytical laboratories were used for this verification process. All measuring and data processing were executed by the test staff at Danish Technological Institute. The test subbody was responsible for the following: That the performance test was carried out according to the test plan That the data processing was carried out according to the methods described in the test plan That adequate internal reviews were performed on both test setup and data processing That all procedures were carried out according to the Centre Quality Manual 4.2.Analytical Parameters The parameters processed to verify the effect of the product were: Air Heater: Ambient temperature and air heater outlet temperatures, Tamb and Tout Air velocity of air through outlet channel, vout Solar irradiance planar to the air heater, G 4.3.Analytical Methods Data related to the performance of the air heater were processed according to the description in Appendix 5 – In-house data processing. 6 4.4.Analytical Performance Requirements A specially designed Excel spreadsheet file was used to calculate the performance of the measured parameters related to the air heater. Due to the large number of different measurement series, thorough reviews were performed as described in Appendix 5. 5. Data Management 5.1.Data Storage, Transfer and Control The data to be compiled and stored are summarized in table below. Analytical raw data were filed and archived according to the specifications of the quality management system. Data type Data media Data recorder Data recording time Data storage Test plan and report Protected PDFFiles Test responsible When approved Files and archives at DTI Log files In-house file format Technician, DTI During collection Files and archives at DTI Calculations In-house application / excel file Test responsible During calculation Files and archives at DTI Final result and verification report Protected PDFfiles Test responsible After testing Files and archives at DTI 6. Quality Assurance 6.1.Test Plan Review Internal review of the test plan is made by Bjarke Paaske (BJPA). External review of the test plan was made by the expert stated in chapter 1.4. Verification of this test report was performed by the verification center at Danish Technological Institute. 6.2.Performance Control The appliance was thoroughly tested for functioning before the verification tests were initiated. 6.3.Test System Control Test and measuring equipment was checked against references or calibrated to ensure accurate values as described in appendix 4 – In-house test methods. This was done prior to the testing and no intermediate check or calibration was necessary throughout the test period. 7 6.4.Data Integrity Check Procedures All data transfer of both handwritten and electronic data was subjected to 100 % control by a second person. Approved spread sheets and calculation programs for calculation of results were subjected to 100 % control to ensure correct calculations and results. Data input in spread sheets and calculation programs was subjected to 100 % control in order to secure correct calculations and results. 6.5.Test System Audits No audit was performed. 6.6.Test Report Review Internal review of the test report was made by Bjarke Paaske (BJPA). External review of the test report was made by the expert stated in chapter 1.4. 7. Test Results The test data report will be included in the verification report as Appendix 7, according to the DANETV Center Quality Manual. 7.1.Performance Test Summary The effect verified in this process was improved indoor climate, e.g. in a residential summer house. This was verified using a simulation algorithm consisting of a design reference year (DRY data) from Copenhagen, Denmark, and building related parameters. The residential summer house was simulated using the following building parameters: Gross square area (one story building) Internal volume of building Infiltration and ventilation, without solar air collector in operation Orientation of solar air collector Slope of solar air collector 60 m2 138 m3 0.1 h-1 South Vertical The Solar air heater was modeled as if it was only used in the off season; i.e. October 15th to April 15th. Operational Data Operation of the solar air heater and data logging system was checked daily during the test. No malfunctioning of the solar air heater was detected in any part of the test. Test 1: Assessment of the User Manual Results from Test 1: Assessment of the user manual shows that all major requirements are met. Test 2: Solar Air Heater Performance Test Results from Test 2: The solar air heater performance test was used as input for the calculation of simulated ventilation, heating, and dehumidification during the heating season (Oct. 15 – Apr. 15) in a Danish design reference year (Copenhagen). 8 7.2.Test Measurement Summary Test 1: Assessment of the User Manual Intended use Product installation OK Product operation OK Function test OK Prevention of accidents OK Service and maintenance OK Test 2: Solar Air Heater Performance Test Ventilation The Ans Solvarme Vacpipe Open End 15/180/30 was determined to start ventilating at an irradiance of 33 W/m2 and to have a correlation according to Figure 2. Figure 2 - Volume flow rate For simulation purposes, the air volume flow rate through the solar air heater was assumed to have a constant increase 175 m3/hr for values outside the maximum measured irradiance range as this was found to be the flow rate stagnation point. 9 Heating The temperature rise was found as indicated in Figure 3. Figure 3 - Temperature rise With a known correlation of the volume flow rate and temperature rise, the heating supplement in the heating season (Oct. 15 – Apr. 15) was calculated using the Excel workbook (described in Appendix 5 - In-house data processing): Heating Energy output (Oct.15 – Apr. 15) 230 kWh Dehumidification and Ventilation Avg. ventilation with solar heater (Oct.15 – Apr. 15) Avg. ventilation without solar air heater Oct.15 – Apr. 15) 25.6 m³/hr 7.0 m³/hr The moisture load of the summer house has been simulated by using the building simulation software BSim. The graphs in Figure 4 show the relative humidity and the amount of absorbed moisture in the house material, respectively. The data has been presented as a function of the month. 10 Figure 4 - Simulation results 7.3.Test Quality Assurance The quality was assured according to the Centre Quality Manual and the procedures described in Appendix 4 – In-house test methods and Appendix 5 – In-house data processing. 7.4.Deviations from Test Plan There were no deviations from the test plan 11 Discussion and Conclusion The following points are important to notice considering the effect of this product in real life applications: The calculated results relating to ventilation, heating, and dehumidification in the heating season, Oct. 15 – Apr. 15, are based on a simulation of a smaller building which represents the average for summer houses in Denmark The design reference year used in the simulation represents climate data from a year based on statistical information. The functional effect of the solar air heater will vary depending on the construction of different types of summer houses and from year to year in a real setting With the above in mind, it is concluded that the vendor’s claims has been quantified and verified. 12 Appendix 1 Terms and Definitions used in the Verification Protocol Terms and definitions used in the protocol are explained in table 1: Table 1 - Terms and definitions used by the DANETV test centers Word DANETV Comments on the DANETV approach Analytical laboratory Independent analytical laboratory used to analyze test samples The test center may use an analytical laboratory as subcontractor Application The use of a product specified with respect to matrix, target, effect and limitations The application must be defined with a precision that allows the user of a product verification to judge whether his needs are comparable to the verification conditions DANETV Danish center for verification of environmental technologies None (DANETV) test center Preliminary name for the verification bodies in DANETV with a verification and a test subbody Name will be changed, when the final nomenclature in the EU ETV has been set. Effect The way the target is affected The effect could be reduced energy consumption, better cooling performance etc. (Environmental) product Ready to market or prototype stage product, process, system or service based on an environmental technology The product is the item produced and sold, i.e. the item that a vendor submit for verification Environmental technology The practical application of knowledge in the environmental area The term technology covers a variety of products, processes, systems and services. Evaluation Evaluation of test data for a technology product for performance and data quality None Experts Independent persons qualified for the technology in the verification These experts may be technical experts, QA experts for other ETV systems or regulatory experts Matrix The type of material that the Matrices could be cooling systems, cabinets, heat 13 Word DANETV Comments on the DANETV approach product is intended for exchangers, etc. Method Generic document that provides rules, guidelines or characteristics for tests or analysis An in-house method may be used in the absence of a standard, if prepared in compliance with the format and contents required for standards. Performance claim The effects foreseen by the vendor on the target(s) in the matrix of intended use None Performance parameters Parameters that can be documented quantitatively in tests and that provide the relevant information on the performance of an environmental technology product The performance parameters must be established considering the application(s) of the product, the requirements of society (regulations), customers (needs) and vendor claims Procedure Detailed description of the use of a standard or a method within one body The procedure specifies the implementation of a standard or a method in terms of e.g.: equipment used Producer The party producing the product None Standard Generic document established by consensus and approved by a recognized standardization body that provides rules, guidelines or characteristics for tests or analysis None Target The property that is affected by the product Targets could be temperature [° C], energy [kWh], etc. Test center, test subbody Subbody of the test center that plans and performs tests None Test center, verification subbody Subbody of the test center that plans and performs the verification None Test/testing Determination of the performance of a product for None 14 Word DANETV Comments on the DANETV approach parameters defined for the application Vendor The party delivering the product to the customer Can be the producer Verification Evaluation of product performance parameters for a specified application under defined conditions and adequate quality assurance None 15 Appendix 2 References (verification protocols, requirement documents, standards, methods) 1. DANETV. Center Quality Manual, 2008 2. EN 12975-2:2006 Thermal solar systems and components - Solar collectors - Part 2: Test methods 3. DTU (2007): Effektivitet af luft/væskesolfanger, ISSN 1601-8605 4. By og Byg Anvisning 204 – Undersøgelse og vurdering af fugt og skimmelsvampe i bygninger (Investigation and Assessment of Humidity and Mold in Buildings) 5. SBi anvisning 224 – Fugt i bygning (Humidity in Buildings) 16 Appendix 3 Application and Performance Parameter Definitions This appendix defines the application and the relevant performance parameters application as input for the verification and test of an environmental technology according to the DANETV method. A3.1 A3.1.1 - Applications The matrix is the type of material which the product is intended for. Residential houses up to 70 m2 A3.1.2 Target(s) A target is defined as the property affected by the product The target of the product is: Supplementary heating and ventilation A3.1.3 Effects The effect of this application is primarily: Improved indoor climate in unheated humid buildings 17 Appendix 4 In-House Test Methods The DANETV solar air heater test is developed with the specific aim of making the test results as applicable, transparent and comprehendible as possible for the intended end user/homeowner/buyer. Even though the EN 12975 standard for testing liquid heating collectors exits, this standard mainly deals with the robustness and thermal effectiveness of liquid heating collectors. Therefore, it is not applicable for open loop solar air heaters. Other previous tests of open loop air heaters, mainly centered on the effectiveness of the air heater, are very technical and not directly applicable for the intended end user/homeowner. Therefore, the DANETV test focuses on the verification of the vendor claims. The vendor claims are often related to energy savings, improved ventilation, improved indoor climate, or the like. Furthermore, in order to give a better idea of how the solar air heater performs in an actual setting, a test rig has been built to simulate real running conditions comparable to those present when the air heater is mounted vertically on the side of a house or garage. Establishing the actual performance characteristics of the air heater has a great advantage over laboratory tests with forced ventilation through the solar air heater as the fans are known to be very sensitive to pressure losses, both related to the heater itself and the downstream hot air channel. Tests performed on different models and makes are comparable by means of calculations based on data from the test rig and on regional climate data (design reference year data). Type-Testing Procedure The following tests are to be carried out by an independent ISO 17025 testing laboratory. One sample of the appliance to be tested is required for testing. Test 1: Assessment of the User Manual The assessment of the user manual is made as follows: Step 1: Unpack the product. Using the manufacturer’s installation instructions only, set up the system components in the test rig. Record any deviation problems encountered. Step 2: Check if the instructions cover the following topics: Intended use Product installation Product operation Function test Prevention of accidents Service and maintenance Acceptance criteria: Setup must be straightforward and trouble-free. Moreover, the instructions should as a minimum cover the topics listed in step 2. 18 Test 2: Solar Air Heater Performance Test Step 1: If not already mounted in the test rig; mount the solar air heater making sure that there is a snug fit between the air heater outlet and the test rig measuring pipe (Figure 1). Figure 1 - Snug fit in the transition between air heater outlet and measuring pipe Step 2: 1) Make sure that no shadows will affect any part of the solar air heater and check if the pyrometer is coplanar to the surface plane of the solar air heater. 2) Check the placement of both the outside air temperature probes and the temperature probe in the measuring pipe. 3) Visually inspect the hotwire anemometer making sure that it is centered correctly in the measuring pipe and that no debris is trapped in the proximity of the hotwire (Figure 2). Figure 2 - Visually inspect the hotwire anemometer Step 3: Prepare the data logger and name the file to be logged with the following format: [<vendor name><run number X>.txt] Step 4: After checking all instrument and data logger connections, record the following parameters every 10 seconds or less continuously throughout an entire day (from sunrise to sunset) with cloudless skies: Ambient temperature and air heater outlet temperatures, Tamb and Tout Air velocity of air through outlet channel (measuring pipe), vout Solar irradiance planar to the air heater, G 19 Step 5: Process data according to Appendix 5 – In-house data processing. Data acceptance criteria: Due to the thermal mass of the solar air heater and the thermal properties caused thereby, data will only be useable if no major fluctuations in the solar radiance were observed during the data collection (Figure 3). Alternatively, discard data 20 minutes after a minor radiance fluctuation (Figure 4). Solar irradiance data - [kW/m2] 0,80 G [w/m2] 0,60 0,40 0,20 0,00 Figure 3 - Data showing too many fluctuations in order to be usable - Discard everything. Solar irradiance data - [kW/m2] G [W/m2] 0,8 0,6 0,4 0,2 0 Figure 4 - Data showing only minor fluctuations. Can be used after careful data processing 20 Appendix 5 In-House Data Processing Data Processing - Solar Air Heater Performance Test The data processing consists of two separate workflows, which are linked together for a final result: 1. Collecting data and constructing a mathematical function/curve fit describing the temperature rise and volume flow relative to the measured solar radiation 2. Calculate the relevant performance parameters for heating, ventilation and dehumidification using the previously established curve fits for temperature rise and volume flow and a prepared calculation sheet 1. Collecting Data and Constructing a Mathematical Function/Curve Fit Raw Data The raw data material consists of a named text file with time-stamped series of logged temperature, irradiation, and flow measurements: [<yyyy-dd-mm><vendor><run number X>.txt] The raw data file is imported to Microsoft Excel using the Excel file import dialog discarding the preamble (line 1-99) and defining the original file as a “Windows (ANSI)” file . The imported data file is then named [<vendor name>.xls] and saved as a workbook Data Preparation A. If data is collected over a period of several days, data from each subsequent measuring day is cut and pasted into different worksheets within the same workbook. Each sheet is then named [<yyyy-dd-mm><vendor>] to clearly identify the different measuring days. B. Using the principle outlined in Appendix 4 - In-House Test Methods, step 5, find the best suitable dataset using Excel’s graphing function on column “E” (containing solar irradiance measurements) C. The worksheet containing the best suitable dataset is kept, and the rest is discarded. D. Columns (B:B) to (E:E) and (H:H) are averaged on a 10 minute basis and the analytical parameters are calculated in separate columns according to Test plan section 3.5.1. E. Calculate a temperature rise in another column using to the 10 minute averaged in- and outlet temperatures using a simple subtraction formula. Curve Fit - Temperature Rise vs. Solar Radiation Using Excels graphing function, a XY (scatter) chart is created and a nth degree polynomial regression fit is applied, as illustrated in Figure 5, to the calculated and averaged data for temperature rise and solar radiation. 21 Temperature rise [K] Temperature rise [K] 20 y = 4,820E-10x4 - 1,406E-06x3 + 1,446E-03x2 - 6,075E-01x + 9,733E+01 15 10 5 0 300 350 400 450 500 550 600 650 700 750 800 Solar irradiation [W/m2] Figure 5 - Example of a 4th degree polynomial regression fit describing the air temperature rise through a solar air heater at a corresponding solar irradiation. Curve Fit - Volume Flow Rate vs. Solar Radiation Using Excels graphing function, a XY (scatter) chart is created and a nth degree polynomial regression fit is applied to the averaged data for volume flow rate and solar radiation. Please note the averaged solar irradiation data point at which the ventilator starts and the highest averaged point for measured solar irradiation. 2. Calculation of Performance Parameters for Heating, Ventilation and Dehumidification After having constructed a mathematical function/curve fit describing the solar air temperature rise and volume flow rate, the obtained polynomial is used to model/simulate the solar air heater performance parameter in a reference year in an Excel workbook named “Vent_heat_dry calc.xlsx” prepared in advance using the following procedure: A. A copy of the the Excel workbook named “Vent_heat_dry calc <vendor>.xlsx” is created (where <vendor> is the manufacturer name) B. Find the DRY-data for Denmark, update column A-D in the excel sheet C. The averaged solar irradiation data point at which the ventilator starts and the highest averaged point for measured solar irradiation are typed in cells (D:16) and (D:17), respectively ( Figure 6) D. E. The exponents corresponding to the nth degree polynomial coefficient and constant describing the volume flow rate are copied directly from the raw data file named [<vendor>.xls] into cells (C:21;I:21) F. The exponents corresponding to the nth degree polynomial coefficient and constant describing the temperature rise are copied directly from the raw data file named [<vendor>.xls] into cells (C:25;I:25) G. The calculated performance parameters are read in result cell matrix [Q:13 S:25] 22 Figure 6 - Screenshot of the prepared calculation workbook for modeling/simulation of a solar air heater’s performance parameters in a design reference year. Green arrows indicate input cells Humidity Data Processing The effect to be verified of this DANETV solar air heater test is improved indoor climate in moist summer houses. In order to validate this effect, a model house has been created in the modeling software BSim. A further description of the model house can be found later in this appendix. The data processing is based on the data obtained during the test and calculated in the “Vent_heat_dry calc <vendor>.xlsx” sheet. A further description of the tests can be found in Appendix 4. 1) BSim needs input that describe the power supplied by the solar panel. This is calculated using the following equation P=m*cp*(ΔT); ΔT= (Toutlet solar panel – Tout). The values can be found in column I 2) Calculate a monthly average, hour per hour of the mass flow rate and the furnish power from the solar panel 3) Open the Bsim file XXX and implement the mass flow rate and the power furnish by the solar panel in the Bsim program 4) Launch a simulation and recover the relative humidity of the house and the moisture content of the wall layers 23 5) Compare the results with the file XXX for the relative humidity and the file XXX for the moisture content and evaluate the solar panel effects. These parameters can be recovered by pressing the button file->export ->files->table Apply this formula for the whole column and then make a monthly average hour per hour. Open the BSIM file XXX and implement the two monthly averages of the mass flow rate and the power furnish in the Bsim program. In order to do this, you should implement the mass flow rate as an infiltration rate, and add this mass flow rate to the natural air infiltration. Please note that the infiltration rate is set up as a volume of the house/hour and not as a volume flow. Enter the values into the schedule, month per month. The power furnish is implemented as a heating load in the same way as the mass flow rate. Details concerning each step are described below. Raw Data The raw data material consists of a named file with time-stamped series of logged measurements with a preamble: [<vendor name><run number X>.txt] The raw data file is imported to Microsoft Excel using the Excel file import dialog discarding the preamble (line 1-102). The imported data file is named [<vendor name><run number X>.xls] and saved as a workbook Average Hourly Solar Radiance Using a photovoltaic simulation program 1, the average hourly radiance hitting the solar air heater throughout a reference year can be calculated with the input parameters matching the actual mounting of the air heater in the test rig: Location/Latitude and longitude: Azimuth: Tilt angle: Copenhagen/55°40′34″N 12°34′06″E 0° South 90° The output consists of a text file (.txt) with a chronological list containing 8760 hours showing the solar radiance hitting the specified location and orientation of the solar air heater throughout an average year. As for the mass flow rate, the variable from the equation (Appendix 4, temperature rise vs. solar radiation) is replaced by the outside temperature from the DRY weather data. Bsim Model In order to make calculations and determine the relative humidity rate of a moist house, Bsim simulation software is used. Two simulations are set, one without solar panel and one with the solar panel, in order to compare them and see the effect of the solar panel on the moisture in the summer house. A house of 60 m², the length of the house is 10 m and the width is 6 m². The house is oriented south. 1 For this verification, PVSYST v. 5.53 is used to simulate the hourly average solar radiation 24 The different components are defined in the table below and are based on materials usually found in a wooden summer house. All the data described below is contained in the Bsim model. However, to get a further understanding of the model, key elements are listed in the following text. 25 The top materials correspond to the inner construction: roof walls ground door windows Composition Pine wood PVC Stone wool PVC Pine wood PVC Stone wool PVC Pine wood λ [m².k/W] 2,04 l [m] 0,10 2,16 0,11 PVC Stone wool PVC Concrete climastop N diamant aluminium climastop N diamant aluminium 2,05 0,237 1,2 0,06 1,55 0,06 The house consists of four rooms, including one living room, a bathroom and two bed rooms. The two bed rooms and the bathroom open towards the living room in order to allow a flow of air in the house. The living room features a sliding window of 3m² oriented south and an entrance door of 2.4 m² oriented north. The bed room oriented south features a window of 1.4 m² oriented south, and the bed room oriented north features a window of 1.4 m² oriented east. The bathroom features a window of 1.4 m² oriented west. Three walls are created to represent the trees around the house; on the east, west and south side of the house. Each wall is eight meters tall and eight meters away from the house. In order to simulate the use of the house, the following people load is implemented. The people load represents the heat and moisture gain which they bring during their occupation of the house in the summer. Their occupation was considered as a person of normal activity, one weekend a month from September to June and every weekend from July to September, including one full week for each of these months. The living room is occupied by four persons of 50 % of the time from 8 am to 22 pm. The bed rooms are occupied by two persons of 100 % of the time from 22 pm to 8 am. The bathroom is not occupied in this sense. 26 An infiltration rate was set up to a 5 % infiltration rate of the house volume every hour. In order to simulate a moist house, a moisture load of 0.006 kg/h per m² is added for each room. A schedule was made for winter, spring and summer, where the moisture load was modulated. After the simulation, the inside temperature of the summer house for each room was recovered together with the relative humidity and the moisture content of one of the wall layers of each room. This simulation is named “simulation without solar panel” and it will be used as a reference. Hereafter, a simulation is prepared as described at the top of this appendix. Before setting up a new simulation, the power supplied by the solar panel to the house is calculated using the following equation: P(solar panel)= m*cp*ΔT With M: mass flow rate of the solar panel, calculated previously Cp: heating transfer mass of the air 1.004 J/kg at 20⁰C ΔT= (Toutlet-Tinside) with Toutlet: outlet temperature of the solar panel calculated previously Tinside: temperature inside the house, extracted from the previous simulation Once the power supplied of the solar is found for each hour of the year, a monthly average of the power supply hour per hour is calculated. From June to August, the solar panel is out of function in that extra heating will cause excessive temperatures. Ventilation (infiltration) and heating from the solar heater is implemented in the BSim model to simulate the effect of the product. The fact of implementing the mass flow rate and the heat production of the solar panel does not represent a moving flow in the house, since the program does not include this when set up as an infiltration rate. Because of this, a mixing effect between the four rooms is added. This mixing effect is calculated as the average mass flow of air of the solar panel through the year, without considering the period from June to August as the solar panel is not used during this period. The air mixing is calculated as a function of the area of each room, where 10% of the mass flow rate will be exfiltrated; the 90 % left is used for the mixing into the rooms. Finally, the relative humidity in the house and the moisture content of the wall layers are extracted as in the simulation without the solar panel. This data is saved as “simulation with solar panel”. 27 Appendix 7 Test Data Report The effect verified in this process was reduced heating expenses and improved indoor climate in a summer house. This was verified using a simulation algorithm consisting of a design reference year (DRY data) from Copenhagen, Denmark, and building related parameters, see Appendix 5 for a detailed description of the model and input. Operational Data Operation of the solar air heater and data logging system was checked daily during the test. No malfunctioning of the solar air heater was detected in any part of the test. Test 1: Assessment of the User Manual Results from Test 1: Assessment of the user manual show that all major requirements are met. Test 2: Solar Air Heater Performance Test Results from Test 2: Solar air heater performance test was used as input for the calculation of simulated ventilation, heating, and dehumidification during the heating season (Oct. 15 – Apr. 15) in a Danish design reference year (Copenhagen). 7.5.Test Measurement Summary Test 1: Assessment of the User Manual Intended use Product installation OK Product operation OK Function test OK Prevention of accidents OK Service and maintenance OK Test 2: Solar Air Heater Performance Test Ventilation The test proved that the Ans Solvarme Vacpipe Open End 15/180/30 solar air heater starts ventilating at an irradiance of 33 W/m2 and it has a correlation as shown in Figure 2. 28 Figure 1- Volume flow rate For simulation purposes, the air volume flow rate through the solar air heater was assumed to have a constant increase 175 m3/hr for values outside the maximum measured irradiance range as this was found to be the flow rate stagnation point. . Heating The temperature rise was found as indicated in Figure 3. Figure 2 - Temperature rise 29 With a known correlation of the volume flow rate and temperature rise, the heating supplement in the heating season (Oct. 15 – Apr. 15) was calculated using the Excel workbook (described in Appendix 5 - In-House Data Processing): Energy output (Oct.15 – Apr. 15) 230 kWh Dehumidification and Ventilation Using the Excel workbook (described in Appendix 5 - In-House Data Processing), the following averages were found (Oct. 15 – Apr. 15): Avg. ventilation with solar panel (Oct.15 – Apr. 15) Avg. ventilation without solar air heater Oct.15 – Apr. 15) 25.6 m³/hr 7.0 m³/hr The humidity of the air as a function of the months (figure 3, upper) is shown for a humid summer house with and without solar heater. The lower part of the figure (3) shows the total moisture content of the house building material as mass of water pr. mass material, again the water content is shown as a function of months. Figure 3 - Simulation results 30 7.6.Test Quality Assurance The quality was assured according to the Centre Quality Manual and the procedures described in Appendix 4 – In-House Test Methods and Appendix 5 – In-House Data Processing. 7.7.Deviations from Test Plan There were no deviations from the test plan Comments on Data The following points considering the effect of this product in real life applications are important to notice: The calculated results relating to ventilation, heating, and dehumidification in the heating season, Oct. 15 – Apr. 15, are based on a simulation representing the average for summer houses with moisture problems in Denmark The design reference year used in the simulation represent climate data from a year based on statistical information. The functional effect of the solar air heater will vary from year to year in a real setting. 31