1
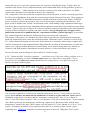
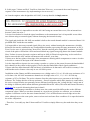
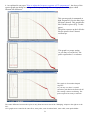
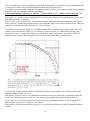
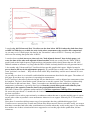
The truth behind
"Comment on "Dissipation and decay of fractal-generated turbulence""
by P.C. Valente and J.C. Vassilicos – Imperial college London –
published online on Physics of Fluids 23 119101 (2011) from 7 November 2011.
We manufacture Hot-Wire anemometers for over 29 years - 2 years as a small business making those units
locally and 27 years as a company exporting them worldwide. I am the person who developed 5 models of
CTA systems – 4 of them are still sold until today. We still service units owned by customers who bought
their systems 27 years ago and still use them today.
During those years we sold thousands of channel modules all over the planet.
As most of our customers know, all of our channel modules are not similar. Before we sell, we ask the
customer for his specifications and requests and then configure the anemometer according to the customer's
request.
An anemometer used for very low velocity, almost laminar flow would have a lower frequency response and
a very low noise, with custom made ultra-low noise and drift amplifier, while using high amplification and
ultra- stable DC offset.
On the other hand, an anemometer which is used for high speeds, high turbulence level and high frequency
response would be configured to be with more "Aggressive" response, better cable compensation (for higher
frequency) and with a low gain (1-20 only).
We also configure the channel modules of the anemometers to be different internally – They might all look
the same to a non-experienced eye, with similar options, but if the customer had special requests, we install
different capacitor values, different resistance values and set different time constants for the control loop as
well as reducing the bandwidth of the signal conditioner (on low frequency, low turbulence units – to
decrease noise and allow resolving of very small wakes) and different output filter settings.
We are aware of the fact that customers change their research subject during the years. Some customers send
us old channel modules in order to configure them for non-standard probes, non-standard cable
compensation (they use homemade cables) and non-standard resistance (up to 2000 Ohms). Some others
request information about changing the frequency bandwidth, adding CCA function, customization of filter
setting, special compensation for non-standard cables etc.
All of those customers understand that those are new demands which were not made when the instrument
was purchased and they bear the extra shipping/labor charges. They may send us special, new types of
probes/ cables/ custom made probe holders when necessary.
On the other hand, there are customers which do not contact us. We see their comments and mistakes later,
after we read their papers…
1
During the last year we got some questions from our customers regarding this paper. Usually, those are
customers who already use our equipment and they do not understand what is wrong with their system (or
with the researchers…). Other inquiries came from new customers who wish to purchase a new HWA
system where that paper was forwarded to them by the competition.
The "competition" is not necessarily the companies that you already know. It is also a research group from
the University of Melbourne along with the research group from the Princeton University. Those groups try
to market their "MUCTA" homemade anemometer together with Princeton university fragile "NASTAP"
probes. In order to promote their product, they wrote a special paper comparing the anemometers. This
paper is full of mistakes and "twisted" measurement results, while making wrong comparisons and using a
new theory they invented from their imagination about signal processing and Fourier transform in non-linear
systems... They use the paper in subject as a reference and they already presented their paper and E-mailed it
to many of their colleagues in Germany and other countries, although the paper was not approved for
publication and was never published by the "experiments in Fluids" journal (Springer). It seems that
they cannot market their anemometer without throwing some mud on the competition.
The purpose of this paper is to contradict all of those rumors spread by the Australian/Princeton groups
about our anemometers and to show the real measurements "behind the scenes" which were sent to me by
P.C. Valente himself during his research work. It also shows how researchers which tend to compare and
criticize anemometers do not understand basic things about the operation of the anemometer, it's pulse and
square wave response (and the differences between them), not to mention things that every amateur in
electronics and fluid dynamics should know about the behavior of a non-linear third order system...
Here are the main incorrect things in Valente and Prof. Vassilicos paper:
1. P.C. Valente and Prof. Vassilicos claim that " …found that our AN-1005 unit exhibits problems in its inbuilt signal conditioning unit and its in-built square-wave test." After that, he says again: " This is
unexpected since all square-wave tests indicated that the cutoff frequency was sufficiently high" etc...
Here are the quotes from his paper:
Can you believe that? Prof. Vassilicos was using this anemometer for over 7 years (when he wrote this
paper) and he still does not know that the anemometer is tested by a pulse and not a square wave!!!
In addition to that, he does not know that the "estimation" (which means F-3db=1/1.3τ or maybe F3db=1/1.5τ as TSI claims or maybe F-3db=1/1.6τ as Beljaars (1976) and Li (2004) claims...) is just a thumb
rule which is good only for anemometers tested using a square wave. Researchers who used the same
anemometers, tested by the same 2 KHz. square wave still argue for 37 years whether it is 1.3τ or 1.5τ or
maybe 1.6τ and they would never stop arguing because there is no answer for that (I wrote a paper
explaining why - Click here)) and those researchers talk about "Expected" -3dB point? This is a joke!
2
On anemometers tested by a pulse, the time "T" should be measured, as explained in the manual (The time
"τ" which is the time of the first positive pulse depends on the DC offset, amplitude and rise time of the test
signal, even if it is always a square wave...). However, those 2 researchers probably don't read manuals... or
papers written by other researchers...They think that they already know everything...
This is the actual picture from the manual.
As all of you may already know, our anemometers are using a short pulse for testing the response of the
anemometer (and not a square wave). Adjustment by a pulse is not like adjustment by a square wave. It does
not behave like the thumb rules in P. Freymuth paper from 1977. If the adjustment is done using a short
pulse, the response curve must have 2-3 overshoots and not only 1 overshoot as recommended by P.
Freymuth for a square wave test. A detailed discussion of this subject can be found in another paper named
"How to adjust the frequency response of a CT anemometer" which explains this issue in details with
graphic examples. P.C. Valente adjusted his anemometer according to rules recommended for a square wave
test. It appears that he did not even read the manual to see that the test signal is a short pulse (…and not a
"square wave" as he wrote in his paper) or saw the graphic example of the recommended shape of the
pulse response in our operation manual.
As you may probably know, the damping factor of the pulse response (as well as the shape of the high
frequency decay of the spectra curve) are influenced by the type of wire and prongs thickness of course, but
they are most influenced by the setting of the damping trimpot , Overheat Ratio and the cable
compensation circuit/cable length.
2. P. C. Valente claims that they found "problems in the in-built signal conditioning". Later, on this paper,
he explains what problems did he find: " …but depends on the amplifier gain " – i.e. the bandwidth depends
on the gain of the amplifier. On his anemometer it was modified per customer's request to have a low
bandwidth.
P.C. Valente did not buy the AN-1005 system from us. He inherited it from a student named Daryl Hurst, a
previous PHD student which bought the system 7 years before Valente started his work (on 2004).
Dr. Hurst told us that they would like to work at very low frequencies and they wanted to get very good
Signal to Noise ratio). As we all understand, there is a physical trade-off between a wide bandwidth to a
good signal to noise ratio (in any analog system – not only in anemometers).
3
For that reason, the bandwidth of their signal conditioners was intentionally limited exactly like it has been
done in the anemometers sold to the Australian Group and to Princeton University.
Here is the table showing the bandwidth on their AN-1005 anemometer:
Capacitor Values:
C1=1nF (102) C2=10nF (103)
C3=1nF
Gain:
1
2
5
10
20
50
100
Frequency
Bandwidth
[KHz.] (@15KHz 16 KHz 17 KHz 17 KHz 11.6KHz 3.8 KHz 1.62KHz
3dB)
Noise (mVptp) 800µV 890 µV
1mV
1.02mV 1.34mV 1.42mV 1.5mV
This is the standard setup for all customers who asked for low noise and low frequency bandwidth. Noise was
measured when the signal conditioner input was shorted to GND (with no CTA signal). As you may see, the
frequency bandwidth does change with the gain as in every operational amplifier which has capacitors on its
feedback…
The low-pass filters in their anemometers are also set up to 18 KHz. Other customers order Low-Pass filters with
frequencies up to 150 KHz.
If P.C. Valente would ask me why the bandwidth is changing with the gain, then I would send him our paper
instructing how to extend the bandwidth by simply cutting 3 capacitors on the channel's board (or
replacing them with different values)… The name of the document is "Anemometer filters" and it explains
how to set a different bandwidth limit on our AN-1003, AN-1005 and AN-1002 systems which got almost
identical channel modules.
As specified in the datasheet of the AN-1003 channel module, the standard frequency bandwidth is at least
DC-100 KHz at all gain values and at low gain values using Option 12 it even goes up to 146 KHz. This is
the Gain/Bandwidth of AN-1003 signal conditioner equipped with Option 12:
C1= uninstalled
Capacitor Values:
Gain:
Frequency
Bandwidth
[KHz.] (@-3dB
point)
1
100
KHz
2
103
KHz
C2= uninstalled
5
104
KHz
10
138 KHz
C3= uninstalled
20
141
KHz
50
135
KHz
100
126
KHz
All of those tables are listed in a document named "AN-1003/AN-1005/AN-1002 channels OPT12 signal
conditioner".
Their channel modules were modified per their request. Such a setup increases the noise level about 6-10
times more compared to the configuration used by Valente.
I wonder why Valente discovered this "problem" and never asked us about that. Valente did not act in good
faith when he "discovered" such a problem and just published it instead of asking us whether it can be
"solved"… He wrote so many E-mails to us and never mentioned it.
4
3. In his paper, Valente and Prof. Vassilicos claim that "However, we measured the actual frequency
response of the anemometers (by implementing a sine-wave test)"...
As I am the engineer who designed the AN-1005, I can say that this is simply untrue.
I'm sorry to say but it is impossible to test the AN-1005 using an external sine wave (Nor an internal one
because it does not exist...)
It is not clear whether he tested the signal conditioner or the anemometer but it is impossible to test either
one of them using an external signal, without destroying the internal circuitry.
The signal path inside the AN-1005 test module is built so the tested channel module is connected thru a 100
pin SMD ASIC inside the test module.
It is impossible to insert any external signal (like a sine wave) without burning the anemometer (which he
did not do because he continued to use it and published another paper using the same anemometer at 2013).
Even if a sine wave is injected using "brute force" thru the external pulse output BNC connector, the buffer
circuit of the pulse will load the circuit and would block any signal from going thru to the channel module.
Since Valente is not an electronics engineer and has no skills in Electrical engineering, we do not believe
that he removed this ASIC and the anemometer still worked 2 years later.
Valente never had any plans or drawings of the anemometer showing which components to remove in order
to be able to connect to the input of the channel module.
It is also impossible to input a sine wave using a speaker or a piezo (to the sensor) because the bandwidth of
their channel (as they show in their graphs) is lower than the bandwidth of their signal conditioner...
Valente asked me about that and I told him that it is forbidden to do that and it will void his warranty. I also
told him that such a feature exists only in our AN-2000 system.
In addition to that, Dantec and DIsa anemometers use a bridge ratio of 1:1 or 1:20 with a top resistance of 10
or 20 ohms. Our AN-1005 anemometer channels use 4 bridge ratios of 1:1, 1:2, 1:10. 1:20 with top
resistance of 25 or 50 Ohms. The series resistance from the pulse/square wave generator to the bridge is
different. The Voltage divider of the top resistance + Sensor resistance which their junction is connected to
the series resistor from the test generator form a different load (Because the "voltage divider" in this arm of
the bridge is different) which means different gain and different DC offset (Thévenin and Norton Theorem).
Click here for an article discussing that issue in detail.
Even if they could manage somehow to do those tests, the results would be different due to the different
component values. When we test those channels in a sepcial test jig before we sell them, we see that the
response is different even for the same channel module, if it is switched between one bridge ratio to the
other, although we use the same probe, same overheat ratio and same flow conditions. It is unprofessional to
do such a comparison.
...Therefore, I can sadly say that Valente and Prof. Vassilicos simply did not say the truth when they wrote
that.
5
4. Figure #1 in this paper is actually a plot using the bad channel module which was not adjusted properly.
Here is a graph of the pulse response of channel #03 – the channel used for plotting the graph in Fig. 1 in
Valente/Prof. Vassilicos paper:
This picture was sent from P.C. Valente to
me by E-mail. You may verify with Prof.
Vassilicos that this is the oscilloscope
used in his lab.
Valente did not adjust the pulse response of that channel properly although I told him several times (by
phone) that he must have more overshoots on his pulse response.
This is a real proof from Valente's lab. We don't have such a "Beckman" oscilloscope!
As you may see, the pulse response is strongly over damped and this is exactly what Valente got in his
measurement. Would you set the pulse response of your anemometer to have such a small, single overshoot?
According to any thumb rule, any test signal or any published paper, this setting is not correct.
A square wave response may have only 1 or 2 overshoots. A pulse response should have 2-3 overshoots
(3'rd overshoot is very small).
The pulse response of a well-tuned CT anemometer should look like this:
If the user would not adjust the response to have 23 overshoots, then the high frequencies would be
attenuated!. Please note that we discuss a pulse
response and not a square wave response as
discussed in other papers.
6
5. This is the spectra graph (+ measurement of free stream noise) sent to me by Valente himself:
The black and white graph is the
original plot that Valente send to me
from his MatLab program. The
green/Purple comments and arrows
were placed by me in order to explain
the graph.
He also sent to me the binary database
used for plotting this graph and the
mat-lab algorithm file. This data file
can be downloaded by clicking the link
below the graph.
Download the original ZIP data file and graph sent to me by P.C. Valente
As you may see in the legend, there are 2 AN-1005 channels – 01 and 03 compared to "DISA 55M10"
Anemometer.
As one may see, the red line is "Disa 55M10 anemometer". The dark blue line is channel #03 of his AN1005 anemometer. This channel was adjusted properly and it fits the Disa 55M10 line up to about 6 KHz.
From that frequency and above, the DISA unit is not responding any more (there is a "twist" in their curve
and then it saturates due to the internal noise level) and our channel #3 keeps on measuring up to about 2030KHz. when it also has the same "twist" and at 50 KHz it saturates due to the noise level of the AN-1005
system.
On the other hand, Channel #1, which was also made by A. A. Lab Systems (using the same components,
same PCB, same batch), was not properly adjusted and its spectra graph spreads from the DISA graph
starting from 1.5 KHz!!!
This graph, which was made by P.C. Valente and not by us, clearly illustrates the difference between a welladjusted channel module to a poorly adjusted channel module.
The only difference between the channel modules is the "damping" adjustment and maybe Option 04 (HF
cable compensation) as explained above in this paper.
As you may see, Valente had 2 channels – 01 and 03. Channel #03 performed well. However, channel #01
was not properly adjusted (or maybe it was not working properly after 8 years of usage?).
However, Valente chose to do his measurements using the channel which is not adjusted properly.
Since I sent him an E-mail about his unprofessional work, I could expect that he would either correct his
graphs or ship the bad channel for repair (if it was not working properly) or at least use the good channel
(03) in future measurements. However, as we see in his web page, Valente prefer to close his eyes and
continue to publish the same measurements in his PHD work published on 2013. However, now we read that
he got a new 4 channels "Dantec Streamline" system… Good point to think about…
7
6. As explained in our paper "How to adjust the frequency response of CT anemometers", the decay of the
spectra graph can change according to the damping setting. Here are 3 graphs from this paper which
illustrate the difference:
This spectra graph is attenuated at
high frequencies (See the blue slope
line that I plotted). This graph looks
like Valente's spectra (Fig. 1 in his
paper).
The pulse response on the left looks
like the picture from Valente's
oscilloscope.
This graph is a proper setting.
As you may see on the left - the
pulse response has 3 overshoots.
This graph is of an under-damped
response.
As you may see, there is a small
resonance peak before the final roll-off.
This setting is almost oscillating. The
pulse response has many overshoots.
The entire difference between the 3 plots is only about one more turn of the "Damping" trimpot to the right or to the
left...
All 3 graphs were created in the same flow, same probe, same Overheat Ratio, same cable, same probe holder...
8
It is very sad that 2 researchers which do not know basic things after 7 years they own our anemometer tend
to write papers which criticize this instrument and hide the good features of it.
The graphs were taken using exactly the same anemometer (An-1005), same channel module, same settings;
same flow only the "Damping" setting was changed.
This channel module is identical to what P.C. Valente and Prof. J.C. Vassilicos had in their lab. The
pulse response is on the left of each spectra graph.
The screen is a real-time spectra calculation from AN-1005 new software (same algorithm as Valente used just different number of average).
Those results are the same for any CT anemometer using a "damping" control for tuning the pulse/square
wave response. I tested many models made by our competitors and it is the same with all of them. There are
many papers which support this behavior of a CT anemometer.
7. In addition to all of those things, Prof. Vassilicos and Valente cut their spectra graph and did not let the
readers see the data down to 10EE-14. As you may see, there are also 1 or 2 data points missing in the
"Streamline" curve. I wonder why did they try to hide these points and cut their graph below 10EE-10?
Maybe because it shows that our Signal to Noise ratio is much better than the competition?
I wonder why Valente used the channel with bad adjustments for his measurement, when he had another
channel which measured very well.
Did anyone "convince" him to use a bad adjusted channel for his paper and remove information about the
noise level? (Information that he had as we see in the spectra graphs and database that he sent to us).
As you may see in the spectra graph that Valente sent to us, the graph of channel #3 fits the graph of the
DISA 55M10 system up to a frequency of 5-6 KHz.!
Why it does not fit the same graph in his paper? It is obvious that he did not use the well-adjusted channel
module.
9
I wonder why did Valente and Prof. Vassilicos cut the data below 10EE-10 when they had data down
to 10EE-14? Did they try to hide the noise in the other anemometers they used for this comparison?
As you may see in Valente paper, the data for the "Streamline" ends at 10EE-8!!! You may ask yourself
where are the missing data points after 10 KHz?
I wonder what was their interest to show only the "bad adjusted channel" data in their paper (and
erase the data of the other well-adjusted channel module which was exactly like the "DISA 55M10
graph?) and cut the high frequency/ high sensitivity information which clearly shows that our AN-1005
channel continue to measure very long after the DISA 55M10 is already buried in its self-generated noise?
I also wonder why Valente and Prof. Vassilicos did not put this graph in their paper. Maybe because it
proves that he did not do the adjustments properly? It is much better to make some "buzz" and show that
some "problem" was found … Why tell the whole truth? Why should they read the user's manual? It is not
interesting…
As you may see, there is no scientific truth behind the measurements described in this paper. The authors of
this paper do not have any experience in operating our anemometer.
Prof. Vassilicos is known as a theoretician and I'm sure that he never used or adjusted our anemometer since
he bought it. The fact is that I had to teach Valente how to use this system. Prof. Vassilicos could not help
him because he did not know how... Those 2 researchers are absolutely not the authority to judge our
anemometer performance, especially after I proved that they erased other good results that they had
(which prove the opposite) from the data of the graph published in their paper.
Mr. Pedro Valente was a graduate student and this was his first experience with Hot-Wire anemometry.
He wrote this paper about 2-3 months after he learned how to use the anemometer. He never had any
previous experience.
The question is how such a paper written by an unknown student became so popular and his paper is sent to
anyone who wishes to purchase a new anemometer almost as it was a paper written by Dr. P. Fremouth by
himself?
Since those 2 researchers did not answer any of our questions after they published this paper (Prof.
Vassilicos never answered my E-mails and Valente also did not answer after my second E-mail), we suspect
that those researchers had some other considerations or benefits when they wrote such a paper. I also wonder
how neither one of those scientist which were supposed to review this paper before publication, did not
contact us.
10
Now, after a real proof from the lab of the authors of this paper is presented, you should ask yourself:
* Would you use this paper as a reference? We do understand that this young student, to say it
politely, is not an anemometer expert…
* What was the real purpose of Valente / Vassilicos paper? Did it spread any light or new facts on the
subject he discussed or all it did was to "repeat the measurements" in order to "throw mud" at our
anemometer?
* Would you trust any other papers made by those researchers or by any other people who got
interest in spreading this paper (or using it as their reference)? This lab is using our AN-1005
anemometers for 10 years and they wrote many papers based on data they have taken with an
anemometer that they do not know how to adjust! Is there any scientific value for all of those papers
which came from this lab during the last 10 years?
* Can you trust any CTA measurements done by research students in this lab when you know that
their supervisor is a theoretician with no experience in operating the CTA anemometer they use?
* Would you buy an anemometer from a person who shows you this paper as a "proof" to some
"problems" that someone "found" in our systems? The same anemometer channels are used for over
29 years all around the world, thousands of labs without any "problems" like those described by the
author.
Those 2 researchers act in an unethical way by publishing results of a channel module which was not
adjusted properly (or maybe had some technical problem? It was a 7 years old module! Maybe the
"Damping" trimpot was broken on this module!) Although they had another channel module which
performed exactly like the DISA 55M10 tested (Which performs exactly like the "Streamline" system
they got, as they claim in their paper).
It seems like they had some hidden interest to publish the results of the bad adjusted channel module.
The fact is that they cut the spectra graphs which clearly show that our AN-1005 anemometer
performs up to higher frequencies while the other ones are saturated by noise. The question is why?
Their "paper" does not add any significant information about the subject tested. It is just a mean
comparison with fault results. They continue to do that in 2 more papers that they published later. We
also found that they now got a new 4 channel "Dantec Streamline" system and again they compared
the same bad adjusted channel to their new system. Those researchers are too anxious to do those
false comparisons, always with "Dantec/DISA" equipment and you may ask yourself why…
I hope that the answers are clear.
Avi Aharoni - Owner and founder
A. A. Lab Systems
11