1
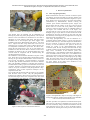
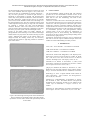
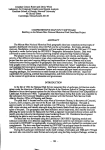
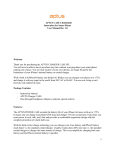
International Archives of the Photogrammetry, Remote Sensing and Spatial Information Sciences, Volume XXXIX-B5, 2012
XXII ISPRS Congress, 25 August – 01 September 2012, Melbourne, Australia
IN SITU MEASUREMENT OF BEDROCK EROSION
D. H. Rieke-Zapp a, *, A. Beer b, J. M. Turowski b, L. Campana c
a
b
University of Bern, Institute of Geological Sciences, 3012 Bern, Switzerland - [email protected]
Swiss Federal Institute for Forest, Snow and Landscape Research WSL, 8903 Birmensdorf, Switzerland –
(alexander.beer, jens.turowski)@wsl.ch
c
University of Bern, Institute for Forensic Medicine, Bühlstrasse 20, 3012 Bern, Switzerland –
[email protected]
Commission V, WG V/6
KEY WORDS: close range photogrammetry, structured light, geomorphology, erosion
ABSTRACT:
While long term erosion rates of bedrock material may be estimated by dating methods, current day erosion rates are – if at all
available – based on rough estimates or on point measurements. Precise quantification of short term erosion rates are required to
improve our understanding of short term processes, for input in landscape evolution models, as well as for studying the mechanics
and efficiency of different erosion processes in varying geomorphological settings. Typical current day erosion rates in the European
Alps range from sub-millimetre to several millimetres per year depending on the dominant erosion processes. The level of surveying
accuracy required for recurring sub-millimetre to millimetre measurements in the field is demanding. A novel surveying setup for insitu measurement of bedrock erosion was tested recently in three different locations in Switzerland. Natural bedrock was investigated
in the Gornera gorge close to Zermatt. Further on, bedrock samples were installed in exposed locations in the Erlenbach research
watershed close to Einsiedeln, and in the Illgraben debris flow channel, located in the Canton Schwyz and Valais, respectively. A
twofold measurement approach was chosen for all locations. For the first setup control points providing an absolute reference frame
for recurrent measurements were embedded close to the area of interest. Close range photogrammetry was applied to measure surface
changes on the bedrock samples. The precision for surface measurements in the field was 0.1 mm (1 σ) and thus suitable for the
application. The equipment needed for the surveys can easily be carried to the field. At one field site a structured light scanner was
used along with the photogrammetric setup. Although the current generation of structured light scanners appeared less suitable for
field application, data acquisition was much faster and checking the data for completeness in the field was straight forward. The
latest generation of compact structured light scanners will probably be most suitable for similar applications.
1. INTRODUCTION
1.2 Study sites
The developed methodology was applied in three different field
settings. Rock samples were installed in the Illgraben debris
flow channel near Leuk (Canton Valais, at 800 m a.s.l.) and the
Erlenbach catchment close to Einsiedeln (Canton Schwyz, at
1100 m a.s.l.). Discharge is monitored in both catchments and
the rock samples are easily accessed. The third test site is the
Gornera torrent (2000 m a.s.l.) located above the city of Zermatt
(Canton Valais). In the latter location abrasion was measured on
a large block located in the torrent. Discharge and sediment flux
were monitored by a hydropower company at this location.
The Illgraben catchment contains one of the most active debris
channels in Europe. Over the last years three to five debris
flows per year occurred (McArdell et al., 2007). Debris flows
reach a volume of up to 30’000 m3 per event (summer 2010).
Rock samples were placed in a concrete block and fixed to a
check dam in the centre of the debris flow channel (Figure 1).
The placement was below the crest of the check dam as a
similar installation was carried away during the previous field
season. Dimensions of the samples was 0.2 x 0.2 x 0.2 m3. The
rock samples represented three different lithologies – marble,
granite, and sandstone – with different grain size, different
hardness, and different texture. While grain size and hardness
will have an impact on the recorded abrasion rate, texture of the
1.1 Objectives
“An objective and quantitative in-situ measure of rock
erodibility over appropriate length scales is badly needed”
(Whipple, 2004). While long term erosion rates may be
estimated by dating methods (Quigley et al., 2007), current day
erosion rates are – if at all available – based on rough estimates
or on point measurements. Precise quantification of short term
erosion rates are required to improve our understanding of short
term processes, for input in landscape evolution models, as well
as for studying the mechanics and efficiency of different erosion
processes in varying geomorphological settings (Hancock et al.,
1998). Typical current day erosion rates in the European Alps
range from sub-millimetre to some millimetres per year
(Wittmann et al., 2007) depending on the dominant erosion
processes.
Recurrent measurement of bedrock surfaces in Alpine
environments is quite demanding. A stable reference frame has
to be installed and surveyed with very high accuracy. The
measurement equipment should not only be very precise, but
also lightweight and compact as it has to be carried to the field
sites.
* Corresponding author.
429
International Archives of the Photogrammetry, Remote Sensing and Spatial Information Sciences, Volume XXXIX-B5, 2012
XXII ISPRS Congress, 25 August – 01 September 2012, Melbourne, Australia
2. DATA ACQUISITION
2.1 Close range photogrammetry
Before measurements could start, a network of reference points
was defined. Several target holders for reference markers were
either embedded in the concrete (Erlenbach, Illgraben) or put in
holes drilled in the block (Gornera). FTI brass target holders
(manufactured by Hubbsmachine) allowed covering the
reference points between measurement epochs. Targets were
placed deeper than the surface so the top of the FTI target
holder could be covered with cloth, pebbles and injection
mortar for protection between epochs. A redundant number of
FTI targets were installed and most of the targets were
recovered after an event. In some cases, targets were seriously
damaged trying to reopen them or because construction mortar
penetrated into the target so that the cap was stuck. The long
term durability of the targets may be judged when revisiting the
field sites for the 2012 field season.
Close range photogrammetry was used for definition of a
coordinate reference frame (Figure 3). Targets were placed in
the FTI holders and up to 120 coded targets were distributed in
the area of interest. At least two scale bars with a stack up
accuracy of 0.02 mm (Brunson) were placed in the area of
interest for scaling of the photogrammetrically derived
coordinate system. At least 25 images were taken with an Alpa
12 Metric camera and Leaf Aputs digital camera back (RiekeZapp, 2010). Coordinates of the reference points were
calculated using a self-calibrating bundle block adjustment in
Aicon 3D Studio software (Aicon, 2011). Two different focus
setting were used for image acquisition (Figure 4). The images
taken further away covered many coded target points per image
while the image taken from closer range had much higher
resolution and were later used for stereo image matching. The
two focus settings of the camera were introduced as two
individual cameras in the adjustment.
Figure 1. Installation of rock samples at the Illgraben site.
rock samples plays an important role for identification of
homologous points using stereo photogrammetry. The expected
abrasion in this environment was assumed to be more than a
millimetre per event and thus much larger than the average
denudation rate in the European Alps. Rock samples were
installed in June 2010. Measurements took place 8th July 2010
and 3rd August 2010 after a large debris flow event. The rock
fragments were covered by half a metre of debris allowing for
an independent measurement epoch after the debris flow.
During the next field season a new set of rock samples was
installed level with the check dam to measure erosion. Since
installation in summer of 2011, no significant debris flow event
occurred. Data for comparison will be collected during the
upcoming field season in 2012.
The installation in the Erlenbach catchment took place in May
2011. Water flow can be diverted during measurement epochs
allowing for more frequent measurements. At this location two
0.36 x 0.50 m2 rock samples – concrete and marble – were fixed
in the flow path. Surface measurements were taken on different
dates. The Erlenbach catchment is equipped with monitoring
instrumentation including a power line with outlet near the area
of interest. Therefore, a structured light scanner has also been
used for one epoch in addition to the photogrammetric setup.
Consequently, data of both acquisition techniques can be
compared to each other.
Two epochs from the Gornera field site (Figure 2) are available
from the field season of 2011. Only the photogrammetric
technique was applied in this location. The shape of the block
and the much larger surface area compared to the other field
sites required many more images for a detailed stereo analysis.
Figure 3. Photogrammetric setup for surveying of the targets at
the Illgraben field site. Eight FTI target holders were embedded
in the concrete (locations marked in red).
The same procedure was repeated for each measurement epoch.
The precision of the target coordinates from one epoch to the
next was estimated by using a Helmert transformation with the
scale parameter fixed to unity in Aicon 3D Studio software.
This allowed for checking the overall precision of the reference
Flow direction
Figure 2. Data acquisition at the Gornera field site.
430
International Archives of the Photogrammetry, Remote Sensing and Spatial Information Sciences, Volume XXXIX-B5, 2012
XXII ISPRS Congress, 25 August – 01 September 2012, Melbourne, Australia
coordinates as well detection of points that may have shifted
between epochs. Transformation results at the Illgraben site
revealed an overall RMS error of 0.025 mm; the largest RMS
error of a single point coordinate was 0.059 mm. Similar results
were accomplished for the other field sites.
Figure 4. A combined bundle block adjustment was calculated
to retrieve coordinates for the reference points as well as image
orientation and camera geometry for two camera settings.
Close up imagery was imported in ERDAS/LPS 2010 software
and pair wise image matching was performed. Images pairs
were selected manually based on overlap and base distance
between the images. A point cloud file was calculated from each
stereo pair. The individual files were visually checked and
merged using ArcGIS 10 software. Since the area of interest
was typically covered in several stereo models, very dense point
clouds were generated. The point clouds were combined and
down-sampled to a raster with 0.5 mm2 cell size applying a
local median filter. The amount of abrasion for each raster cell
was calculated by subtracting the elevation rasters of two
epochs (Figure 5).
2.2 Structured light scanner
A GOM ATOS III structured light scanner was used at the
Erlenbach field site parallel to the photogrammetric workflow.
While the generation of mass points was much more straight
forward as compared to stereo matching of homologous points,
the GOM scanner was heavier and bulkier than the camera
equipment and required either a power generator or a power
plug during data acquisition. The Erlenbach catchment was
easily accessible and power for the GOM scanner was readily
available.
The same reference points were used for the photogrammetric
setup were also used for the structured light scanning.
Coordinates for the GOM system were calculated on an image
bundle adjusted with GOM TRITOP software (GOM, 2008).
The GOM scanner triangulates a dense mesh of 3d points and
allows checking for completeness as well as acquisition errors
on the job. Individual mesh tiles were oriented and merged with
GOM INSPECT v7 software (GOM, 2011).
Figure 5. Difference DEMs comparing two epochs of
measurements at the Illgraben site showing marginal erosion.
431
International Archives of the Photogrammetry, Remote Sensing and Spatial Information Sciences, Volume XXXIX-B5, 2012
XXII ISPRS Congress, 25 August – 01 September 2012, Melbourne, Australia
A new set of rocks was installed level with the crest of the
check dam. An initial surface measurement was recorded in
summer of 2011. No debris flow went over that area in 2011,
we expect new events in summer 2012.
The Erlenbach field site was surveyed twice on the same day by
different operators starting the whole workflow from scratch
each time. The difference DEM of the generated surfaces had a
mean of 0.006 mm and a standard deviation of 0.070 mm
indicating a similar level of reproducibility as for the Illgraben
experiment. Measurements taken at the Erlenbach field site on
5th and 18th October 2011 captured a major flow event with 44
m3 of rock particles transported over the area of interest on 10th
October 2011. More than 99.9% of the surface indicated
erosion, average erosion on the concrete surface was 0.8 mm
(Figure 7). Maximum erosion at exposed areas was up to 4.1
mm while flat areas revealed erosion values between 0 and 1.0
mm.
Figure 6. Structured light scanning at the Erlenbach site.
3. RESULTS AND DICSCUSSION
Results in Figure 5 and Table 1 reveal very little change on the
surfaces at the Illgraben site. It is most likely that the rock
samples were positioned too far below the active surface and
were actually protected from erosion by the check dam.
Assuming on the other hand that the rocks were not eroded, the
results can be used to check the reproducibility of surface
measurements between two epochs – including excavation after
the debris flow. Assuming zero erosion, the standard deviation
of the difference DEMs represented the precision of the analysis
(Table 1). The largest standard deviation was well below 0.1
mm. All models show spots with larger elevation values
compared to the previous epoch marking aggradation instead of
erosion. The largest spot value for aggradation was 0.379 mm.
This is best explained by sub-optimum preparation of the
surface before measurement as well as the possible import of
windblown dust particles – although visible, the effect is
marginal considering that the data was generated under field
conditions. The average change in elevation was positive
(erosion) for all three plates.
Difference
DEM
Min. (mm)
Max. (mm)
Average (mm)
σZ (mm)
Granite
Marble
Sandstone
-0.379
0.219
0.020
0.051
-0.187
0.203
+0.000
0.037
-0.369
0.647
0.057
0.076
20000
number
15000
10000
5000
0
-5.0
-4.0
-3.0
-2.0
-1.0
0.0
1.0
deviation [mm]
Table 1. Difference DEM of two epochs with no significant
erosion, i.e. average difference less than standard deviation (σz)
of difference DEM.
Figure 7. Difference DEM in oblique view and histogram
of difference values before-after a large flow event at the
Erlenbach field site.
432
International Archives of the Photogrammetry, Remote Sensing and Spatial Information Sciences, Volume XXXIX-B5, 2012
XXII ISPRS Congress, 25 August – 01 September 2012, Melbourne, Australia
The structured light scanner was at the time of writing only used
once at the Erlenbach field site (Figure 6 & 8). Data were
collected at dawn as recommended for outdoor applications –
only the latest generation of structured light scanners is
advertised as unsusceptible to sunlight. The structured light
scanner may not be practical for field use in remote areas due to
the bulky dimensions, weight and the need for an external
power source, but the method revealed several advantages over
the photogrammetric setup. The major advantage was the speed
of data acquisition and processing. A single scan was sufficient
for capturing a complete rock plate with sub-millimetre
resolution. Elevation values were collected for each camera
pixel and results could be checked for completeness in the field.
The active projection system of the structured light scanner
Texture on the marble surface was hardly sufficient for
photogrammetric stereo matching. In case of the structured light
method texture was projected on the surface allowing easy data
capture. Although data capture on the marble surface was
straight forward, the resulting surface may not necessarily
represent the true surface as light may penetrate to subsurface
layers of the marble.
4.
CONCLUSIONS
The photogrammetric method produced data with sufficient
precision for in situ measurement of bedrock erosion in the
field. Precision (1 σ) of the resulting DEM was found to be
better than 0.1 mm. The methodology was tested at three
different field sites.
Collection of surface data with a structured light scanner was
also successful, but the device was not practical for field use in
remote areas. The latest generation of structural light scanners
should allow scanning in daylight conditions and offer more
compact dimensions in order to overcome current shortcomings.
Rock lithology had an impact on the point density and probably
on measurement precision. The photogrammetric method
required texture on the rock surface for identification of
homologous points for stereo matching. The structured light
approach was an active remote sensing technique adding texture
to the surface by light projection.
Experiments and field data acquisition will be continued and
data will be used for input in sediment transport and erosion
models for a better understanding of surface processes.
5. REFERENCES
Aicon, 2011. Aicon 3D Studio – User Manual on CD-ROM.
GOM, 2008. TRITOP – User Manual on CD-ROM.
GOM, 2011. INSPECT – User Manual on CD-ROM.
Hancock GS, Anderson RS, WhippleKX., 1998. Beyond power:
bedrock river incision process and form. In: Tinkler, K, Wohl;
E.E., 1998, Rivers Over Rock: Fluvial Processes in Bedrock
Channels. Washington, DC: Am. Geophys. Union 35–60.
McArdell, B. W., Bartelt, P. & Kowalski, J., (2007): Field
observations of basal forces and fluid pore pressure in a debris
flow. Geophysical Research Letters, 34(7).
Quigley, M., Sandiford, M., Fifield, K., Alimanovic, A., 2007.
Bedrock erosion and relief production in the northern Flinders
Ranges, Australia. Earth Surf. Process. Landforms; 32:929-944.
Rieke-Zapp, D., 2010. A digital medium format camera for
metric applications – Alpa 12 Metric. The Photogrammetric
Record, 25(131): 283-298.
Wittmann, H., von Blanckenburg, F., Kruesmann, T., Norton,
K.P. & Kubik, P., 2007. The relation between rock uplift and
denudation from cosmogenic nuclides in river sediment in the
Central Alps of Switzerland. J. Geophys. Research, 112:
F04010.
Whipple, K.X., 2004. Bedrock rivers and the geomorphology of
active orogens. Annu. Rev. Earth Planet. Sci.; 32: S. 151-185.
Figure 8. Structured light scanning results at the Erlenbach site.
The top model shows the marble surface, the bottom model
represents a concrete surface which at this point already showed
erosion marks.
433