1
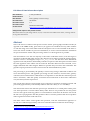
ESO Phase 3 Data Release Description
Data Collection
Release Number
Data Provider
Document Date
Document version
Document Author
On-line version
UVES_ECHELLE
1
ESO, Quality Control Group
06.05.2015
1.2
Reinhard Hanuschik
http://www.eso.org/qc/PHOENIX/UVES_ECH/processing.html
Changes with respect to the previous version:
Data taken with one of the Image Slicers (#1, #2, or #3) have been added to the release, starting with observing date 2003-04-14.
Abstract
This is the release of reduced 1D spectra from the UVES 1 spectrograph, ECHELLE mode (as
opposed to the FIBRE mode), point sources (as opposed to extended sources), taken without
or with the image slicer. Data taken with the absorption cell are also included in the data release. This release includes re-processed UVES data, as well as current and future UVES data
not processed before at ESO. The processing scheme is as homogeneous as possible.
The selected data cover the vast majority of the entire UVES data archive, from the begin of
operations in March 2000 until present. The data have been reduced with the UVES pipeline,
versions uves-5.1.3 and higher, recipe uves_obs_scired. All data have their instrument
signature removed (de-bias, flat-fielded), with the exception of the absorption-cell data which
have the signature of the iodine cell not removed. Then the data have been extracted, wavelength-calibrated and order-merged. Whenever possible they have been flux-calibrated. The
pipeline output products have been converted to the 1D standard binary table 2.
The processing is performed by the Quality Control Group using a dedicated workflow tool
in an automated process. The pipeline processing uses the archived, closest-in-time, qualitycontrolled, and certified master calibrations. It is important to note that the reduction process
itself is automatic, while the quality assessment and certification of the master calibrations
was (and still is) human-supervised.
The overall data content is not fixed but grows with time as new data are being acquired and
processed (approximately with monthly cadence and with a delay of 1 or 2 months).
The data format follows the ESO 1D spectroscopic standard2 for so-called phase-3 data products. Each spectrum is a multi-column binary table. There is one product file for each parent
raw file. The typical observing pattern of a simultaneous observation in the blue arm and in
the red arm is propagated to the data products: there is one blue product and one red product
if the original observation used both arms.
This data release offers science-grade data products, with the instrumental signature removed, flux-calibrated (if possible), with error estimates and a list of known shortcomings.
1
2
http://www.eso.org/sci/facilities/paranal/instruments/uves/
http://www.eso.org/sci/observing/phase3/p3sdpstd.pdf
1
These data products are considered to be ready for scientific analysis. They are expected to be
useful for any kind of high-resolution spectroscopic research, including line profile studies
and radial velocity studies. For studies of energy distributions the investigator should keep in
mind that the UVES instrument is a high-resolution spectrograph, designed for stability and
throughput but not for high-precision flux calibration. There are slit losses, and many observations did not care about photometric conditions.
Disclaimer. Data have been pipeline-processed with the best available calibration data. However, please note that the adopted reduction strategy may not be optimal for the original scientific purpose of the observations, nor for the scientific goal of the archive user.
You may also want to consult the on-line version of this documentation3 which is a living
document and has further useful links and more details.
Release Content
The UVES_ECHELLE release is a stream release. The overall data content is not fixed but
grows with time as new data are being acquired and processed (approximately with monthly
cadence and with a delay of 1 or 2 months). The data is tagged with "UVES_ECHELLE" in the
ESO archive user interface 4.
The first data were published under UVES_ECHELLE in September 2013, with UVES data
from the begin of operations (March 2000 ) until May 2013. The archive is being filled chronologically. New data taken after May 2013 are being added at roughly monthly intervals and
with a delay of 1 or 2 months, when all master calibrations for the corresponding time interval are available.
This release of the UVES Echelle processed data supersedes the earlier version called "UVES
reprocessed" processed in 2007. The main differences to the earlier version are:
completeness (the earlier release covered data until March 2007 only and had no
SLICER data; this release includes post-2007 data and SLICER data and will be sustained into the future);
the quality issue with the 860 nm data is solved;
flux calibration is also available for the 760 nm setting;
product data come in the binary table format (1D spectroscopic standard), with one
product file for the BLUE arm data and one product file for the RED arm data.
How to organize
The downloaded data come with their technical archive names. The README file coming
with every download contains the information necessary to properly rename the files and
establish their association. The fundamental unit of the renaming process is to capture column #2 in the README file (technical name starting with ADP) and column #3 (original
name starting with UV_) and use something like 'mv $2 $3'.
Data Selection
Data selection is entirely rule-based. It is organized along the following criteria:
3
4
http://www.eso.org/qc/PHOENIX/UVES_ECH/processing.html
http://archive.eso.org/wdb/wdb/adp/phase3_spectral/form
2
instrument=UVES
observing technique (DPR.TECH) = ECHELLE or ECHELLE,ABSORPTION-CELL or
ECHELLE,SLIC#<n> (n=1,2,3) or ECHELLE,ABSORPTION-CELL,SLIC#3 where SLIC
stands for slicer (not: FIBRE)
category (DPR.CATG) = SCIENCE
type (DPR.TYPE) = OBJECT or OBJECT,POINT (not: OBJECT,EXTENDED)
Note that the largest fraction of UVES point-source data comes as 'normal' ECHELLE (about
80-90%). Second largest fraction is ECHELLE,SLICER (about 10%). The remaining few percent divide into ABSORPTION-CELL data, with or without the SLICERs. Physical slicers
come in three different varieties which however has no impact on the data products.
A priori, no selection is made on the basis of observing mode (visitor or service), nor on settings. UVES ECHELLE settings are defined by the combination of binning, central wavelength and dichroic filter5.
De facto we can process only those science data for which certified master calibrations can be
found in the archive. These master calibrations were also processed by the Quality Control
Group but much earlier in time, close to the date of acquisition in order to provide quick
quality feedback to the Observatory. The operational selection pattern for master calibrations
evolved over the years. It reflects pipeline evolution and calibration plan changes, and also
manpower constraints. In the early years of UVES, the processing focus was on calibrations
taken in standard settings (based on central wavelength) and for Service Mode (SM) science
data. The fast read mode (4port, 625kHz) was not supported either. Later, the calibration
scheme was extended to non-standard settings (at best-effort basis), ignoring the Service/Visitor Mode (VM) distinction.
Therefore the completeness ratio for the UVES Echelle science data in this stream is inhomogeneous. For the early years (until 2002) almost no VM data are included, and no SLICER data. Later, the fraction is close to complete. Processed SLICER data are available as of 2003-0413.
Note that the fact that a certain UVES raw file does not have a product in this release does not
imply a quality issue with the raw data. It is more likely that this raw file falls into the category of VM science taken in the early years of UVES in non-standard settings or in the fast read
mode. Such data would most likely process fine manually.
In general, the master calibrations were processed with different (earlier) pipeline versions
than the science data in this stream. This is not considered an issue since the calibration recipes of the UVES pipeline did not strongly evolve with time.
Science data with the PROG.ID starting with 60. or 060. have been de-selected, considering
them as test data. Data taken at daytime (with obviously wrong ‘SCIENCE’ tag) have been
ignored. Otherwise the metadata tag ‘SCIENCE’ has been blindly accepted from the raw data
(originally defined by the PI), thus including sometimes standard stars. This is often evident
from the OBJECT metadata key. Also, there are rare cases when test observations were executed under the SCIENCE label. Most very short exposures with no signal fall into that category but have not been suppressed.
5
more under http://www.eso.org/qc/UVES/pipeline/settings.html
3
All data (both with and without the SLICERs) have been processed up to the wavelength calibration step. The last step, the flux calibration, was undertaken with master response curves
(see below). These do not exist for all settings, not even for all standard settings. The products
which could be flux-calibrated have the highest reduction level (FLUXCAL=ABSOLUTE,
ORIGFILE names start with UV_SFLX), while the others have FLUXCAL=UNCALIBRATED,
names start with UV_SRED (if taken without slicer and without absorption cell), UV_SREA
(without slicer, with absorption cell), UV_SRES (with slicer, without absorption-cell), or
UV_SREB (with slicer and absorption-cell). There are SLICER data which could be fluxcalibrated (taken e.g. in the 580 setting), their ORIGFILE name also starts with UV_SFLX.
There is no raw data selection based on quality. Likewise, we have not considered OB grades:
the observations might have any grade between A and D, or X. The availability, or nonavailability, of a particular file in this release does not infer any claim about the data quality.
E.g. saturated pixels are not flagged by the pipeline. The user is asked to carefully check the
data for those cases.
Each product file has exactly one parent raw file. Multiple observations from the same OB
have not been combined.
Release Notes
The data reduction used the standard UVES pipeline recipe uves_obs_scired. Find a description of the science recipe in the User Manual 6.
All recipe parameters used were default, except for:
reduce.extract.kappa=20 (threshold for cosmic ray rejection, default is 10 and
was applied in many cases; choice changed over time);
reduce.ffmethod=pixel (with ‘pixel’, flat-fielding is done in pixel-pixel space,
before extraction; the alternative option is ‘extract’, in pixel-order space, after extraction, which is the default; the ‘pixel’ method has been chosen for all data with central
wavelength > 760nm to suppress residual fringes from the flat field, which would
remain with ‘extract’; the ‘pixel’ method has the disadvantage to introduce some artifacts at the order begin and end, therefore it needs a reduction of the inter-order overlap and thereby creates larger spectral gaps in the red wavelength ranges beyond 880
nm; the ‘extract’ method has been chosen for all data with central wavelength below
760nm);
reduce.merge_delt1=14 and reduce.merge_delt2=4 (related to the previous point: this is the amount in pixels of the order begin and end to be truncated; only applied to data with central wavelength ≥ 760nm).
The extraction method (reduce.extract.method) was ‘optimal’ for the normal (nonsliced) ECHELLE data. Because of the multiple stellar signal in case of SLICER data (3-5 depending on the slicer used), these were extracted with the ‘linear’ method. In ‘optimal’ mode,
the pipeline uses an initial SNR estimate, based on which it selects the appropriate crossorder extraction profile (Gauss, Moffat, Virtual). Find more details in the User Manual 6, section 11.1.13.
6
under the UVES link in http://www.eso.org/sci/software/pipelines/
4
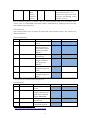
Master Calibrations used for data reduction
type (pro.catg)
MASTER_BIAS_{ccd}
name (first
part)
UV_MBIA
mandatory*
/ optional**
mandatory
ORDER_TABLE_{ccd}
UV_PORD
mandatory
LINE_TABLE_{ccd}
UV_PLI1..3
or UV_PLIN
mandatory
MASTER_FLAT_{ccd}
UV_MFLT
mandatory
MASTER_RESPONSE
_{ccd}
UV_MRSP
optional
EXTCOEFF_TABLE
optional
content
master bias: created from 5 raw bias
frames; removes bias level and bias
structure
order table: contains a description of
the echelle order position, used for
extraction
line tables (either three, one for each
third of the extraction slit, or one for
the whole slit), giving the dispersion
solution for the extracted spectra
master flat: created from three raw
flats; used for: removing gain noise,
removing the echelle function,
removing slit noise; introducing lamp
response
response curve used for flux
calibration; derived from selected sets
of standard star measurements,
collected for most (but not all)
standard settings; removes lamp
response and remaining instrument
signature
used to correct for extinction
(optional)
ccd = BLUE | REDL | REDU
* if missing, pipeline fails
** if missing, final product is not flux-calibrated
This list is the same for data taken with and without the image slicers.
Pipeline Description
Information about the UVES pipeline (including downloads and manual) can be found under
the URL http://www.eso.org/sci/software/pipelines/. The QC pages7 about UVES data contain
valuable information about the UVES Echelle data, their reduction and the pipeline recipes.
Data Reduction and Calibration
The QC pages8 about science reduction describe the details of the main reduction steps. In
essence, the bias level and structure is removed. Then, depending on the flat-fielding method,
either the science data are divided by the flat and then extracted using the order table (‘pixel’
method), or the other way round (‘extract’). Upon extraction, the optimal extraction algorithm
determines the sky background and removes the cosmics. SLICER data (being extracted with
method 'linear' meaning a simple summing up of the total signal in the extraction slit) have
no sky background determined: the observing method is suitable for bright sources and short
7
8
http://www.eso.org/qc/UVES/pipeline/pipe_gen.html
http://www.eso.org/qc/UVES/pipeline/recipe_science.html
5
exposure times, hence sky background can be neglected. Then the extracted orders are wavelength-calibrated (using the line tables), rebinned, and merged. This is the final step, if no
master response curve is available, otherwise that calibration solution is used to flux-calibrate
the extracted spectrum. If so, the spectrum is delivered in physical units. Otherwise it comes
in arbitrary units (counts) and contains those instrument or atmospheric signatures which
cannot be removed by the flat field (chromatic coating efficiencies, atmospheric extinction) or
have been added by the flat field (spectral response of the calibration lamp). Check out the
on-line version9 for illustrations of the steps and products.
Note that in the case of the absorption-cell data, the signature of the iodine cell has not been
removed. (There are flat-field data available from the ESO archive with the iodine cell turned
on. It was felt that the reduction with these calibration data is too delicate to be executed in an
automatic way.)
The reduction of the SLICER data follows exactly the same steps, and uses the same types of
calibrations, as the reduction for the non-sliced ECHELLE data. The only exception is the extraction method (linear).
The flux calibration has been applied for the following central wavelengths: 346, 390, 437, 564,
580, 760, and 860 nm.
The UVES Echelle products are wavelength calibrated. No corrections for barycentric or heliocentric motion have been applied. The corresponding values have been calculated by the
pipeline
from
the observation
and
are
stored in
the
header
(HIERARCH.ESO.QC.VRAD.BARYCOR or HELICOR, in km/s).
No correction for telluric absorption lines has been applied.
In some cases the PIs have specified attached arclamp or flat calibration during the night,
immediately after the science data. We do not guarantee that these special calibration data
have been used for the reduction. More likely is that the standard daytime calibrations have
been applied.
The UVES pipeline creates the following product files:
extracted spectrum (de-bias, flat-fielded, extracted, wavelength-calibrated and rebinned)
corresponding error file
non-SLICER data only: background underlying the signal in the slit (sky), by-product
from the extraction step
fluxed spectrum (if flux calibration available)
corresponding fluxed error (if flux calibration available)
While these pipeline product files are separate (image) fits files, they are finally converted
into a single binary table fits file which is the delivered data product, with the wavelength
scale as first column and all other products as further columns (see ‘File Structure’ below).
Contrary to the product files of the UVES pipeline (which generates one product for each detector), the converted product from the RED arm (as downloaded from the archive) is a single
9
http://www.eso.org/qc/PHOENIX/UVES_ECH/processing.html
6
file. The two non-overlapping red segments have been merged in a single spectrum with nonequal sampling (and no degradation). There is always an unavoidable gap between the two
spectral segments due to the geometrical gap between the two red detectors.
Data Quality
There is some internal quality control on the pipeline process, monitoring:
quality of the association (checking that the master calibrations are not older than a
few days);
score flag for number of saturated pixels in the raw data;
QC reports and quick views.
This information has largely been used to improve and fine-tune the processing process. An
individual one-by-one inspection of the products has been unaffordable.
SNR: the signal-to-noise ratio of the spectra is measured by the ratio of FLUX/ERR (or
FLUX_REDUCED/ERR_REDUCED giving the equivalent result). Its chromatic slope is as
complex as the spectrum itself. As representative numbers, the pipeline calculates an average
per echelle order (stored in the header per order as 'HIERARCH ESO QC ORDnn OBJ SN' for
BLU spectra, and as 'HIERARCH ESO QC CHIPi ORDnn OBJ SN' for RED spectra). From
these numbers, a median has been calculated (omitting the respective first and last order)
which is the number quoted as SNR on the query interface and in the header. Note that, as a
peculiarity in the red wavelength ranges, those files reduced with the reduce.ffmethod=pixel method have a higher SNR in the spectral regions with overlapping
echelle orders.
Known features and issues
The pipeline applies some assumptions on the source (these assumptions apply to the nonsliced case):
If there is more than one target in the slit, it always extracts the brightest source.
If the cross-dispersion profile of the source is not Gaussian, the UVES pipeline may
create artifacts (wrong extraction). This may either happen due to an extended
source, or for very high counts, close to or at saturation. A typical symptom of nonGaussian profiles are ripple artifacts.
Flux calibration. The flux calibration is good enough for obtaining a coarse energy distribution but is not of spectrophotometric quality. The slit losses are unknown, and many observations did not care about photometric conditions. The master response curves have been derived from carefully selected individual standard star observations, but they are applied to
science data sometimes taken a long time before or after, in many cases years apart. There has
been no attempt to correct for these long-term effects.
The flux-calibrated spectra are provided in units of 10 -16 erg/cm2/s/Ångström.
Wavelength range of flux-calibrated spectra: some of the master response curves used for
flux calibration have the initial and the final 25 Ångström cut off, hence the flux-calibrated
spectra have a slightly smaller wavelength range than the extracted ones.
Spectral gaps. For spectra of the RED arm, increasingly larger gaps occur beyond about 880
nm, related to the ‘pixel’ flat fielding algorithm. These gaps would be much smaller with the
‘extract’ algorithm which however has strong artifacts from the fringes in the flat field. It was
7
felt that the spectral gaps are of minor impact in general. An investigator interested in the
spectral information in those gaps might want to manually reduce the data with the ‘extract’
method.
Flat-field signatures: in particular the 346 nm spectra have relatively strong signature of the
flat field extraction (repeating ondulations on the scale of one echelle order)10.
Quite rarely, the 860 REDU spectra have flat-field related artifacts at the begin of echelle orders, right after the order gaps9.
Find more documentation about features and issues on-line10.
Data Format
Files Types
There exist five different file types, depending on the reduction level (flux calibrated or not)
and on the product category:
ORIGFILE
names starting with
UV_SFLX
product category
PRO.CATG
Description
FLUXCAL_SCI_POINT_<arm>
flux-calibrated product (arm=RED or BLU)
UV_SRED
UV_SREA
RED_SCI_POINT_<arm>
same, for
RED_SCI_ABSCELL_RED
(absorption-cell data)
same, for
RED_SCI_SLICER_<arm>
(SLICER data )
same, for
RED_SCI_SLICABSCELL_RED
(SLICER data with absorptioncell)
extracted and wavelength-calibrated (but
unfluxed) product (arm=RED or BLU)
UV_SRES
UV_SREB
The following naming convention applies to the ORIGFILE product name:
e.g. UV_SFLX_58146_2001-09-13T09:12:30.326_RED564d1_2x2_21.fits has the
components:
ORIGFILE
component
…
refers to …
UV
SFLX
58146
2001-0913T09:12:30
.326
RED564d1_2x2_21.fits
UVE
S
product
type
(SFLX or
OB ID
timestamp of
raw file
acquisition/
setup string: RED or BLU for
the arm; 564: central
wavelength in nm; d1/d2/re/bl:
Find examples under
http://www.eso.org/observing/dfo/quality/PHOENIX/UVES_ECH/processing.html#features
10
8
SRED or
SREA,
where S
stands for
science)
archival
d1/d2 for the use of both arms,
with dichroic filters 1 or 2;
re/bl for use of the red or blue
arm only; 2x2: binning; 21: slit
width (=2.1 arcs)
Due to the data format of UVES raw data, the UVES products with d1 or d2 in their name
always come as a BLU/RED twin taken (almost) simultaneously (although not necessarily
with identical exposure times).
File structure
The UVES products come as binary fits table with multi-column format11. The columns are
labeled as follows:
a) non-SLICER data:
column label
#1
WAVE
#2
FLUX_REDUCED
#3
ERR_REDUCED
#4
BGFLUX_REDUCED
#5
FLUX
#6
ERR
content
wavelength in Angstrom
extracted, wavelength-calibrated,
sky-subtracted SCIENCE signal, not
fluxed
corresponding error
(not fluxed)
extracted and wavelength-calibrated
sky signal, not
fluxed
like #2 but fluxcalibrated, physical
units
like #3 but fluxcalibrated, physical
units
UV_SFLX
yes
UV_SRED/UV_SREA
yes
yes
yes
yes
yes
yes
yes
yes
no
yes
no
* The UV_SREA products have the absorption-line spectrum of the absorption cell not removed, they are reduced in
exactly the same way as the data without absorption cell.
b) SLICER data
column label
#1
WAVE
#2
FLUX_REDUCED
#3
ERR_REDUCED
#4
FLUX
11
content
wavelength in Angstrom
extracted, wavelength-calibrated, skysubtracted SCIENCE
signal, not fluxed
corresponding error
(not fluxed)
like #2 but fluxcalibrated, physical
http://www.eso.org/sci/observing/phase3.html
9
UV_SFLX
yes
UV_SRED/UV_SREA
yes
yes
yes
yes
yes
yes
no
#5
ERR
units
like #3 but fluxcalibrated, physical
units
yes
no
In the case of the red spectra, the header contains keywords from both pipeline products (remember the pipeline delivers one spectrum per detector, and these are merged into the single
1D binary fits table), distinguished by a field 'CHIP1' or 'CHIP2', resp., in the keyword name.
File Size
The UVES products have about 3 MB size for the unbinned (1x1) RED arm, and 2 MB for the
unbinned BLU arm. Binned products (2x2) come at half this size. Files are always uncompressed.
Acknowledgment text
According to the ESO data access policy, all users of ESO data are required to acknowledge
the source of the data with an appropriate citation in their publications. Find the appropriate
text here12.
All users are kindly reminded to notify Mrs. Grothkopf (esodata at eso.org) upon acceptance
or publication of a paper based on ESO data, including bibliographic references (title,
authors, journal, volume, year, page-numbers) and the programme ID(s) of the data used in
the paper.
12
http://archive.eso.org/cms/eso-data-access-policy.html
10