1
BIOINFORMATICS SOLUTIONS INC
PEAKS 4.2 User’s Manual
PEAKS Studio (S)
PEAKS Client (C)
PEAKS Viewer (V)
Bioinformatics Solutions Inc.
470 Weber St. N. Suite 204
Waterloo, Ontario, Canada N2L 6J2
Phone 519-885-8288 • Fax 519-885-9075
Written by: Iain Rogers
Please contact the author for questions
or suggestions for improvement.
S marks a section applicable to PEAKS Studio, C for PEAKS client and V for PEAKS Viewer
INTRODUCTION................................................................................................... 4
INTRODUCTION TO PEAKS 4.2 ........................................................................................................................ 4
HOW TO USE THIS MANUAL .............................................................................................................................. 4
Scope................................................................................................................................................................ 5
Terminology and Abbreviations Glossary....................................................................................................... 5
Files and Format Glossary............................................................................................................................... 7
GETTING STARTED WITH PEAKS 4.2.......................................................................... 8
SCV
WHAT WE WILL NEED ......................................................................................................................... 8
Package contents.............................................................................................................................................. 8
System requirements ....................................................................................................................................... 8
Instrumentation .............................................................................................................................................. 8
SCV
INSTALLATION .................................................................................................................................... 9
SC
CONNECTING TO A PEAKS ONLINE SERVER .................................................................................... 10
SC
REGISTERING PEAKS .......................................................................................................................... 10
SC
DATABASE CONFIGURATION .............................................................................................................. 11
FEATURES WALKTHROUGH ...................................................................................17
SC
BEGIN THE WALKTHROUGH ................................................................................................................ 17
SVC
VIEWING RESULTS ............................................................................................................................ 19
SVC
MANIPULATING RESULTS................................................................................................................. 21
S
INCHORUS SEARCHING .......................................................................................................................... 22
GRAPHICAL USER INTERFACE.................................................................................25
SVC
SVC
SC
SC
SCV
SCV
SC
SCV
SCV
SCV
WINDOWS, DIALOGUES, FRAMES AND REPORTS ............................................................................ 26
PEAKS 4.2 main window............................................................................................................... 26
Auto de Novo Parameters Dialogue .................................................................................................. 27
Protein Identification Parameters Dialogue ...................................................................................... 29
PEAKS Properties Dialogue........................................................................................................... 31
Enzyme Editor Dialogue................................................................................................................. 32
PTM Selector Dialogue ..................................................................................................................... 33
PTM Editing Dialogue ................................................................................................................... 34
Environment Preferences Window ................................................................................................. 34
Protein Identification Result Window............................................................................................ 35
De Novo view........................................................................................................................................................... 35
Peptide View............................................................................................................................................................. 35
Protein View ............................................................................................................................................................. 36
Search parameters.................................................................................................................................................... 37
Filter pane ................................................................................................................................................................. 37
SCV
Main Processing Window............................................................................................................... 40
SCV
Ion Editor ........................................................................................................................................ 42
SCV
Export Image Dialogue ................................................................................................................... 43
SCV
Print Image Dialogue ..................................................................................................................... 44
SVC
TOOLBARS ......................................................................................................................................... 44
SCV
Main window toolbar...................................................................................................................... 44
S marks a section applicable to PEAKS Studio, C for PEAKS client and V for PEAKS Viewer
SCV
Main Processing Window Toolbar ................................................................................................. 46
PEAKS STUDIO CONFIGURATION .............................................................................47
SCV
SV
PEAKS PROPERTIES CONFIGURATION............................................................................................ 48
Creating and defining PTM .............................................................................................................. 48
Creating a New PTM ............................................................................................................................................... 49
Editing a PTM........................................................................................................................................................... 50
Removing a PTM...................................................................................................................................................... 50
S
Database Manager ................................................................................................................................ 50
Load/Configure a new database ........................................................................................................................... 51
Remove a Database.................................................................................................................................................. 51
Edit a Database......................................................................................................................................................... 51
Moving/Updating a Database ............................................................................................................................... 51
SV
IMPORTING AND EXPORTING PEAKS PROPERTIES ........................................................................... 52
SVC
PEAKS ENVIRONMENT PREFERENCE CONFIGURATION................................................................ 53
S
Removing Saved Parameters ................................................................................................................ 54
SCV
Configuring the ion table ................................................................................................................ 55
SCV
Environment – Changing default file handling settings ................................................................ 56
SC
Environment – client to PEAKS Online ........................................................................................... 56
SCV
Changing Colours........................................................................................................................... 56
SCV
Display – Changing typefaces and peak width ............................................................................... 57
SCV
Changing Manual de novo defaults................................................................................................ 58
LOADING AND PREPARING DATA .............................................................................61
SCV
LOADING DATA INTO PEAKS 4.2.................................................................................................... 62
SCV
Opening data files ........................................................................................................................... 62
SCV
Loading a directory full of DTA files.............................................................................................. 63
SCV
Loading Thermo RAW data............................................................................................................ 64
SCV
Importing Applied Biosystems WIFF data ..................................................................................... 64
SCV
Importing Masslynx RAW data ..................................................................................................... 64
SCV
Importing Data from the ABI 4700 or ABI 4800 ........................................................................... 65
System Requirements .............................................................................................................................................. 65
Configuration: .......................................................................................................................................................... 65
Data extraction procedure: ..................................................................................................................................... 66
SC
REFINING DATA BEFORE ANALYSIS ..................................................................................................... 66
SCV
MANUALLY MANIPULATING DATA FILES ...................................................................................... 69
SCV
Editing Precursor information ....................................................................................................... 69
SCV
Manually merging MS/MS scans of the same peptide ................................................................... 69
SCV
Cutting and Copying Spectrum Data ............................................................................................ 70
SCV
Pasting Spectrum Data................................................................................................................... 70
ANALYSING DATA WITH PEAKS 4.2 ..........................................................................71
SCV
USING PEAKS STUDIO WITH MODIFICATIONS (PTM)..................................................................... 72
SC
AUTO DE NOVO SEQUENCING ............................................................................................................ 73
SCV
VIEWING AUTO DE NOVO RESULTS ................................................................................................. 77
SCV
EDITING SEQUENCING RESULTS (PREPARATION) ............................................................................ 78
S marks a section applicable to PEAKS Studio, C for PEAKS client and V for PEAKS Viewer
SCV
MANUAL DE NOVO SEQUENCING................................................................................................... 80
SCV
Creating a fresh spectrum for sequencing....................................................................................... 80
SCV
Manual De novo Operations .......................................................................................................... 80
Selecting a peak ........................................................................................................................................................ 80
Measuring distance along the m/z scale .............................................................................................................. 80
Measure the m/z difference between two PEAKS.............................................................................................. 81
Deselect a peak ......................................................................................................................................................... 81
Zoom in on part of the spectrum ........................................................................................................................... 81
Add (remove) ions to (from) a peak...................................................................................................................... 81
Using sequence tags................................................................................................................................................. 82
Undoing an edit ....................................................................................................................................................... 82
Redoing an edit ........................................................................................................................................................ 82
SCV
SUGGESTING A SEQUENCE TO SEE HOW IT FITS THE DATA ............................................................. 83
SC
PROTEIN IDENTIFICATION ................................................................................................................... 85
SCV
PEAKS protein identification ......................................................................................................... 85
S
inChorus protein identification ............................................................................................................ 88
SC
CREATING A HIGH-THROUGHPUT WORKFLOW ................................................................................. 89
SCV
SELECTING UNMATCHED DE NOVO RESULTS .................................................................................. 90
SC
RUNNING PROTEIN IDENTIFICATION ON SELECT SPECTRA ............................................................... 91
SCV
USING THE MASS CALCULATOR ...................................................................................................... 92
WORKING WITH RESULTS......................................................................................94
SCV
VIEWING PROTEIN IDENTIFICATION RESULTS ................................................................................. 95
SCV
COMPARING PROTEINS – MULTIPLE SEQUENCE ALIGNMENT......................................................... 99
SCV
FILTERING RESULTS ......................................................................................................................... 100
SCV
How filters act on de novo sequences............................................................................................ 102
SCV
Filter examples .............................................................................................................................. 103
Publication .............................................................................................................................................................. 103
Digging for a protein by name ............................................................................................................................. 103
Setting a protein mass range ................................................................................................................................ 103
SCV
Saving/Loading Filter sets ............................................................................................................ 103
SCV
Toggling columns ......................................................................................................................... 104
SCV
EXPORTING RESULTS ...................................................................................................................... 104
SCV
WYSIWYG reports....................................................................................................................... 104
SCV
Exporting peak lists ...................................................................................................................... 105
SCV
Exporting Sequences by spectrum ................................................................................................ 105
SCV
Exporting Exclusion Lists ............................................................................................................ 105
SCV
Exporting high-resolution spectral images ................................................................................... 105
SCV
SAVING RESULTS ............................................................................................................................. 107
ABOUT BIOINFORMATICS SOLUTIONS INC. ............................................................... 108
PEAKS SOFTWARE LICENSE ................................................................................. 109
REFERENCE: PEAKS PAPER .................................................................................. 111
S marks a section applicable to PEAKS Studio, C for PEAKS client and V for PEAKS Viewer
Chapter
1
Introduction
Introduction to PEAKS 4.2
PEAKS makes the interpretation of MS/MS data easier and faster.
P
EAKS is an innovative software system designed to derive amino acid
sequences and identify proteins from tandem mass spectrometry data. After
running MS/MS on a protein sample, PEAKS performs de novo sequencing
and database search identification of the protein(s) and peptides using raw
experimental data.
PEAKS 4.2 provides peptide sequence and protein identification results via an intuitive
interface, allowing for rapid visual interpretation. PEAKS provides both auto and
manual de novo sequencing tools for detailed examination of MS/MS spectra, providing
the flexibility to manually modify auto de novo results when searching for additional
sequence possibilities.
How to use this manual
This user’s manual is intended to help us get started using PEAKS 4.2, acquaint us
with its functionality, show us how to customize PEAKS to our application, allow us
to work efficiently with the interface, provide a task based reference, and help us with
troubleshooting. As such, this manual is organized into chapters based on these
categories. Use the table of contents at the front of this manual to access the relevant
section. If searching for the definition of a particular term (or abbreviation), please
consult the glossary – found in this section. The glossary will tell us what a particular
term means, but it will not tell us how it applies to PEAKS usage.
Since PEAKS Studio, PEAKS Viewer and PEAKS Client share the same user’s
interface, this manual covers all three software programs. Where a section is
S marks a section applicable to PEAKS Studio, C for PEAKS client and V for PEAKS
Viewer
applicable to PEAKS Studio, an ‘S’ is noted, ‘C’ denotes PEAKS Client, and ‘V’
denotes PEAKS Viewer. Some sections apply to all three, so ‘SCV’ is noted.
Scope
PEAKS users are assumed to be familiar with computer usage, and the operating
system environment. As such, it is beyond the scope of this manual to instruct the user
on the use of windows, dialogue boxes, menus, file storage etc. Please refer to the
operating system’s manual, or computer help books for such information. Similarly,
PEAKS users are expected to be familiar with mass spectrometry, standard operating
practices and data.
Terminology and Abbreviations Glossary
a-ions: an N-terminal fragment holding at least one charge; similar to b-ions and c-
ions. This is a prefix fragment of the peptide. The a-ion’s mass will be the sum of
the masses of the N terminal group, plus the intervening neutral amino acid
residues, subtract the mass of Carbon Monoxide.
an N-terminal fragment holding at least one charge; similar to a-ions and cions. This is a prefix fragment of the peptide. The b-ion’s mass will be the sum of
the masses of the N terminal group, plus the intervening neutral amino acid
residues.
b-ions:
BSI (Bioinformatics Solutions Inc.):
The makers of PEAKS and other fine
bioinformatics software.
c-ions: an N-terminal fragment holding at least one charge; similar to a-ions and b-
ions. This is a prefix fragment of the peptide. The c-ion’s mass will be the sum of
the masses of the N terminal group, plus the intervening neutral amino acid
residues, plus the mass of ammonia.
rearrangement of the spectrum to show each monoisotopic peak
as if it were singly charged. Thus, to reposition them on the scale, PEAKS
multiplies the m/z of ion’s that were doubly charged by two. Note that the
deconvolved scale PEAKS shows is ‘at +1.’
Deconvolution:
selecting a post-translational modification as a fixed
modification tells PEAKS that this modification is applied to all occurrences of the
residue(s) that the PTM can act on.
Fixed modification:
Enzyme: The residues PEAKS can find in different positions in the sequence. This
is based on information about the enzyme used to digest our protein sample.
ESI (Electrospray Ionization):
A method for ionizing a sample into the mass
spectrometer.
m/z: mass to charge ratio.
5
A method for ionizing a
sample into the mass spectrometer. This has a characteristic effect of only
producing singly charged ions.
MALDI (Matrix-Assisted Laser Desorption/Ionization):
this refers to the accuracy of the spectrometer and its resulting
data. On a spectrum, this is reflected by how close the peaks are to the actual
masses of the ions they represent.
Mass accuracy:
A protein, just translated and hence
newly formed, may differ from its final form as a result of interaction with the
cellular environment (or the experimental environment). As they interact
chemically with the environment, residues may gain or lose molecules. This change
is referred to as a post-translational modification. Since PTM changes the mass of
residues, it must be accounted for when sequencing peptides by mass
spectrometry.
PTM (Post Translational Modification):
PEAKS comes equipped with a library of possible posttranslational modifications. These can be incorporated into a de novo
analysis at the click of a button.
•
Built-in PTM:
•
Customized PTM: If the post-translational modification we are looking for
is not in the PEAKS PTM set, we may create our own entry, or modify an
existing one. This will appear as a customized PTM in the set.
•
PTM library: A listing of all possible (built-in and custom entered) posttranslational modifications that PEAKS can use as a part of its analysis.
as used in this manual, a residue refers to what remains of an amino acid
once it has become part of a peptide, or peptide fragment. In this manual, residues
are referred to by their original amino acid names.
Residue:
refers to the precision of an instrument. On a spectrum, this is
reflected by how close together can two peaks be and still be told apart.
Resolution:
selecting a post-translational modification as a variable
modification tells PEAKS that this modification may or may not be applied to any
given occurrence of the residue(s) that the PTM can act on.
Variable modification:
a C terminal fragment holding at least one charge; similar to y-ions and zions. This is a suffix fragment of the peptide. The x-ion’s mass will be the sum of
the masses of the C terminal group, plus the intervening neutral amino acid
residues, plus the mass of Carbon Monoxide.
x-ions:
a C terminal fragment holding at least one charge; similar to x-ions and zions. This is a suffix fragment of the peptide The x-ion’s mass will be the sum of
y-ions:
6
the masses of the C terminal group, plus the intervening neutral amino acid
residues, plus the mass of H2.
a C terminal fragment holding at least one charge; similar to x-ions and yions. This is a suffix fragment of the peptide. The z-ion’s mass will be the sum of
the masses of the N terminal group, plus the intervening neutral amino acid
residues, subtract the mass of ammonia.
z-ions:
Files and Format Glossary
ANN data file: within the ANZ file, a folder contains ANN data files that store the
MS/MS information and peptide information of one spectrum.
ANN index file: within the ANZ file, is one compressed file used to organize the
data; the ANN index file links to a directory containing multiple ANN data files.
ANZ file: a PEAKS ‘zip-compressed’ XML-based Annotated spectrum file format.
ANZ files preserve all the information from the PEAKS session.
DTA: The file format associated with SEQUEST software.
A standard sequence database file format used for protein
identification. PEAKS can identify proteins from any FASTA-format database of
proteins.
FASTA (Fast-All):
MGF: The file format associated with Mascot software.
PKL: The file format associated with Micromass instruments.
7
Chapter
2
Getting started with PEAKS 4.2
Everything we need to know from the beginning and step by step.
T
SCV
his section of the manual will guide us through the process of installation and
configuration of PEAKS 4.2. If problems persist, contact technical support.
What we will need
Package contents
The PEAKS 4.2 package should contain:
This manual
PEAKS 4.2
System requirements
PEAKS 4.2 will run on most platforms with the following requirements:
Equivalent or superior processing power to a Pentium at 500 MHz.
At least 1 GB of memory (RAM). 1.5GB is recommended. For PEAKS
Studio / PEAKS Client. PEAKS Viewer requires only 500MB.
JAVA Virtual Machine 1.5 or better (provided on installation).
Instrumentation
PEAKS 4.2 will work with data from any type of tandem mass spectrometer designed
for proteomics work.
PEAKS will accept data in the following formats:
8
data in .wiff format provided that PEAKS, the
Infochromics converter plug-in and Analyst are installed on the same computer.
PEAKS has the ability to read directly from the 4700/4800 Oracle database.
Applied Biosystems instrument’s
mzXML is a
standard data
format from the
Sashimi Project. It
is an XML based
format.
mzData is a
standard data
format from the
Human Proteome
Organization
SCV
Bruker instrument’s data in .yep, .baf and .fid formats.
data in RAW format provided that PEAKS and
XCalibur are installed on the same computer, or dta format (and concatenated dta
formats), with the ability to load an entire folder full of dta’s.
Thermo Electron instrument’s
data in .RAW format, provided that PEAKS and
MassLynx are installed on the same computer, or pkl files.
Waters/Micromass instrument’s
All instrument’s data as can be converted into mzXML, mzData, .pkl, dta, or .mgf.
Installation
To make sure we only use the latest information available to PEAKS, if we
already have PEAKS installed on our system, we must uninstall it before
proceeding.
1.
Close all programs that are currently running and end all non-system tasks.
2.
Insert the PEAKS 4.2 disc into the CD-ROM drive.
3.
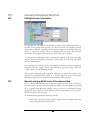
Auto-run should automatically load the installation software. If it does not,
find the CD-ROM drive and open it to access the disc. Click on the exe
file.
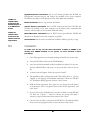
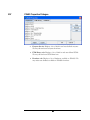
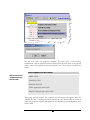
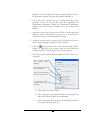
4.
A menu screen will appear . Select the top item “Install”.
5.
The installation utility will begin the install. Wait while it does so. Choose
‘English’ as the language for installation instructions. When the “PEAKS
4.2” installation dialogue appears, click the “Next” button.
6.
Read the license agreement. If we agree to it, we change the radio button
at the bottom to select “I accept the terms of the License Agreement” and
click “Next”.
7.
Next we choose the folder/directory in which we’d like to install PEAKS
4.2. Press the “Choose…” button to browse our system and make a
selection, or type a folder name in the textbox. Click “Next”.
8.
Choose where we’d like to place icons for PEAKS 4.2. The default will put
these icons in the programs section of our start menu. Click “Next”.
9
SC
9.
Review the choices we have made. We can click “Previous” if we’d like to
make any changes or click “Next” if those choices are correct.
10.
PEAKS 4.2 will now install on our system. We may cancel at any time by
pressing the “Cancel” button in the lower left corner.
11.
When installation is complete, click “Done”. The “PEAKS 4.2” menu
screen should still be open. One may view movies and materials from
here. To access this menu again, we simply insert the disc in our CD-ROM
drive.
Connecting to a PEAKS Online Server
PEAKS Client sends all its intensive computation jobs, like PEAKS auto de novo, and
PEAKS Protein ID, to a PEAKS Online server, installed somewhere in the lab or
computing facility. PEAKS Studio can optionally do this too.
In the Environment tab of the Environment preferences dialogue, change the “Default
PEAKS Invocation” to “PEAKS Online. Then specify the IP address or URL of the
PEAKS Online server, the port number to use, and a username and email address.
Press ok. The email is used to notify us that a job has been completed, in the event that
we close PEAKS 4.2 before finishing.
It’s important to monitor the task queue when running jobs on the PEAKS Online
server. Hold the mouse over a job that’s in the queue to see it’s status.
SC
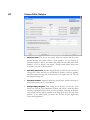
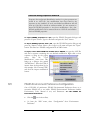
Registering PEAKS
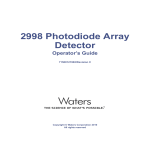
The first time we run PEAKS,
we will be told that the product is not registered. Press
the “Ok” button and a dialogue will appear. Enter the registration key that came with
the product – whether it be a key for the full version or time limited trial version. We
must also enter our name, the name of our organization, and the MAC (Media Access
Control) address of the machine we are going to use PEAKS on. If we are connected
10
to the internet, registration
will
be
completed
automatically. If all is well,
a dialogue will show
“Registration Successful”
and PEAKS will load.
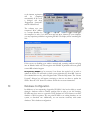
The software uses your
computer’s MAC address
as a unique identifier for
the computer. As such, if you have more than one MAC address for your computer,
you may experience problems in registering PEAKS. The display will be something like
this:
If this occurs, try disabling your wireless network card, restarting windows and plug
into an Ethernet cable only. Then register with PEAKS. If problems still occur, please
contact BSI technical support.
may be necessary if our license has expired or if we wish to
update the license. We will need to obtain a new registration key from BSI. Once we
have obtained this new key, select “Register Peaks” from the Help menu. The “License
Upgrade” dialogue box will appear, cautioning us that we are about to update the
license. Press the “Ok” button to continue. Follow the on-screen instructions.
Re-registering PEAKS
SC
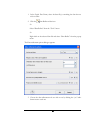
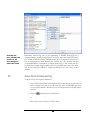
Database Configuration
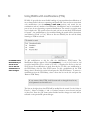
In addition to de novo sequencing of peptides, PEAKS 4.2 also has the ability to search
through a database search to identify proteins. But in order to use this function,
PEAKS must have access to a protein or EST database in FASTA format or an EST
database of DNA sequences. We can point PEAKS to an existing database on our
system, or download one. Additionally, we can associate taxonomy with certain
databases. This is database configuration.
11
We can use PEAKS without the database search; PEAKS can perform de
novo sequencing.
WARNING: Downloading a database can take a long time (8+ hours), depending
on connection speed. Most only take 20 - 30 minutes.
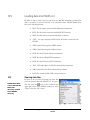
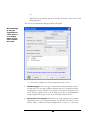
To configure a database:
Microsoft Internet
Explorer, for
example, is an FTP
client. We may use
Internet explorer
and the provided
URL to download a
database.
The next section
provides a
walkthrough of
PEAKS 4.2’s main
functionality using
the NCBI nr
database.
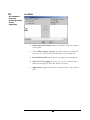
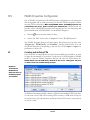
1.
Load PEAKS 4.2. If we have
not yet configured a database,
the
wizard
will
appear
automatically. Otherwise...
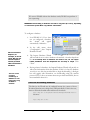
2.
In the ‘edit’ menu, select
“Configuration”, then “Import
Database Wizard”
3.
The Import Database Wizard
will load and ask us to select a database to download – from the dropdown
list. If we already have a database we wish to use, we can select
“Other database” from the dropdown list and skip to step6. Click
“Next”
4.
Having selected a database, the Import Database Wizard will provide us
with some information about that database. If this is, in fact, the database
we wish to use, click the provided link to begin downloading. A dialogue
box will appear with instructions on downloading using file transfer
protocol (FTP). It does not matter where we put the download file, but we
must remember where it is.
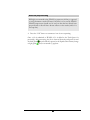
A note on downloading databases
The links in the Wizard may be outdated because the owners of those
download locations may change their URL periodically. If this is the case,
remove all but the domain name and browse from there.
ftp://ftp.ebi.ac.uk/pub/databases/MassSpecDB/msdb.fasta.z
becomes:
ftp://ftp.ebi.ac.uk/
12
Best practices: configuring databases for use with X!Tandem
At the time of this writing, X!Tandem had trouble searching through
large databases, and would crash. It is therefore suggested that X!Tandem
only be used with small databases; or if used with a large database, a
taxon should be specified. The NCBI nr and Swiss Prot databases are
ideal for this purpose.
Best practices: configuring databases for use with OMSSA
At the time of this writing, we could not use OMSSA with databases that
were not in NCBI format, or Swiss-Prot format, and have those results
available to inChorus.
Also, a bug in OMSSA prevents us from easily using databases with
OMSSA when they are stored in a folder that contains a space in its path.
This creates problems when PEAKS creates temporary databases on our
behalf. To avoid this, best practices suggest we put all our databases in a
folder “c:\peaksdatabases”. The folder “c:\my documents\databases”
wouldn’t work because it contains a space between ‘my’ and ‘documents’.
Using spaces in the database file name causes the same problem. So after
we download and extract our database we should call the database file
“ncbinr.fas”, or “ncbi_nr.fas” rather than “ncbi nr.fas”.
5.
The database we downloaded may be in a compressed file, perhaps a .zip or a
.gz file. We must find the file and use a decompression utility, such as WinZip,
or WinRar to extract its contents. The file inside the compressed file will be a
FASTA format text file (a .fas or a .fasta file).
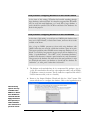
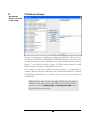
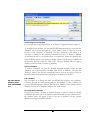
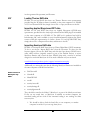
6.
Return to the Import Database Wizard and click the “Next” button. This
screen will allow us to configure the database. Click on the hyperlink next to
The taxonomy
options are only
available if the
NCBI nr or SwissProt database is
selected and the
Apply button has
been pressed, or
either database
was selected on a
previous screen.
13
each field for more information.
Database header
format is important
for protein ID result
reports. If parsed
correctly, accession
numbers and protein
names will be shown
in full.
•
PEAKS will ask us to enter the database nickname. This is a nickname that
we chose to represent the database we are configuring. It doesn’t matter
what name we enter, but we must enter at least one character.
•
The Path textbox shows where the database is located. It will be blank, so
we must tell PEAKS where the database is. Type the location of the file
into the textbox, or we can browse to find the file on our system We must
be sure to select the FASTA database, not the compressed file of the
same name (see step 5).
•
If we chose one of the public standard databases (in step: 3) its format
style will be displayed in the advanced options box. The selected database
format is shown in the dropdown list. Accession number information and
the way PEAKS parses the database headers – i.e. the parsing rules –are
shown in the textboxes below.
•
If our database is an EST database containing DNA sequences, check the
‘EST database’ checkbox.
14
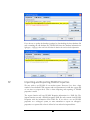
•
If we chose an “other database” (in step: 3) we must enter parsing
parameters ourselves by typing in the textboxes. Alternatively, if our
database format is the same as one of the public databases, we can choose
to apply that database’s format when PEAKS reads our database. Select
the database that is similar to ours from the dropdown list and press the
apply button to fill the textboxes with the appropriate parsing rules.
The delimiter is the character used to separate multiple headers.
•
If we are configuring the NCBI nr database or the Swiss-Prot database, we
may choose to point PEAKS 4.2 to the location of the taxonomy files
associated with that database. Under “Taxonomy Options” we must type
the location of the taxonomy files, or click browse to find the file on our
system. If we do not specify these taxonomy files, we will not be able to
limit our database search to a specific taxon. We can use the compressed
(.zip or .gz) files; no decompression is required for the taxon files.
A note on choosing the taxonomy files for NCBI nr
At the time of printing, the gi_taxid file was called: gi_taxid_prot.dmp.gz
and the taxdmp file was called: taxdmp.zip. Select these files.
A note on choosing the taxonomy files for Swiss Prot
At the time of printing, the gi_taxid file was called: speclist.txt and the
taxdmp file was called: taxdmp.zip – the same one as used by NCBI.
7.
Press the “Finish” button to complete the database configuration.
We can repeat this process to configure a number of other databases. Once
configured, a database need not be configured again unless we update the database
itself.
15
Trouble shooting
Some problems with a database may not appear until we run a search.
While PEAKS is quite tolerant of format errors in databases, other
search engines called from the inChorus tool may not be. If there is an
error in the search, it will be reported in a summary screen after the work
has finished. If there is a problem, check the best practices outlined in
this section. If the problem persists, it is possible that the database
download was corrupted; try downloading again. Please contact technical
support for help.
16
Chapter
3
Features Walkthrough
Let’s familiarize ourselves with PEAKS
T
SC
his section of the manual will walk us through most of the basic functionality
of PEAKS 4.2. After completing this section we will have seen how easy it is
to load and view a data file, perform de novo sequencing, and database search
protein identification.
Begin the walkthrough
Run PEAKS 4.2, then download and configure the NCBI nr database. The procedures
for doing so are outlined in the previous section.
The demo sample data should load automatically on startup under the heading
icon on the
OrbiOrbi.pkl. If it is not loaded, open the data file by clicking the
toolbar in the upper left corner of the PEAKS window, or selecting “Open” from the
“File” menu. Sample data is located in the “C:\Program Files\PEAKS Studio\data\”
folder. Load the file “OrbiOrbi.pkl” by clicking on it, then clicking “Open.”.
The data file will appear in the left-hand frame. Make sure “OrbiOrbi.pkl” (i.e. the data
file) is selected.
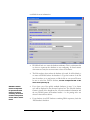
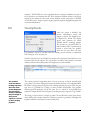
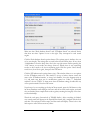
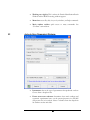
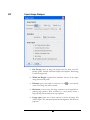
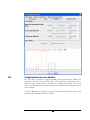
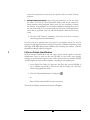
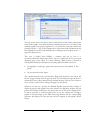
In the “Tools” menu, select “PEAKS Protein ID”. The protein identification options
dialogue will appear.
17
Enter the settings
as shown. Settings
can be changed by
clicking on the
drop down list and
selecting one of
the options.
After entering the settings, as shown, click the “Save As” button to save these
parameters for future use (PEAKS Studio only). When prompted, type OrbiStandard
and press enter. Click “OK” to commence analysis. Analysis will be initialized (most of
this time is spent creating a partial database, which only has to be done once) this takes
one or two minutes.
After this, de novo sequencing will commence. For this sample it takes just over a
minute, after which PEAKS database search will proceed. In total, the process takes
less than two minutes for this sample (depending on the system’s processing speed and
18
memory). The PEAKS auto de novo algorithm derives sequence candidates for each of
the 22 spectra in our example data file. These sequence candidate results for all eleven
spectra in the example are then used for the database search component of PEAKS
4.2. PEAKS uses a unique sequence tag plus peptide fragment fingerprinting approach
to protein identification.
SVC
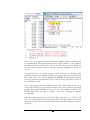
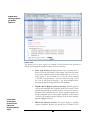
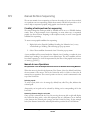
Viewing Results
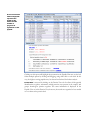
After the search is finished, the
protein identification results will
appear on screen. The ‘Peptide View’
is displayed by default. The display
shows each spectrum for which
PEAKS found a matching peptide.
The spectra are grouped/sorted by
index number. Since a spectrum may
match to more than one peptide,
there may be more than one entry
per spectrum. The list is sort-able; click the heading on each column to experiment
with sorting by score, by mass, etc.
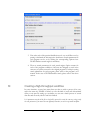
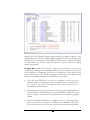
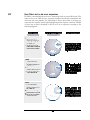
Click the ‘Protein View’ tab. PEAKS 4.2 presents a list of proteins that it believes to be
the best match for the sample. The top section is an index, listing them by accession
number, ranked in descending order from highest score on downward.
The numbers
under the “Mass”
heading represent
the mass of the
protein displayed.
The “Coverage”
numbers represent
the percentage of
the proteins
sequence covered
by the matching
peptides.
The correct protein, Lactoglobulin beta, is shown at the top of the list and with high
score. Since one cannot distinguish between the different forms of Lactoglobulin Beta,
PEAKS 4.2 groups them all together, thus avoiding cluttering the report. Click the plus
sign next to gi|229460 for a listing of other possible lactoglobulin. The peptides
matching these homologues will be the same set or a subset of Lactoglobulin beta
matches. Collapse this list of homologues by clicking the minus sign next to gi|229460.
The listing, as shown above, is simply an index. We will find this useful, in the future,
when dealing with complex mixtures. Clicking any protein’s gi number will display the
peptides matched to that protein in the bottom pane.
19
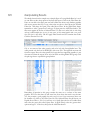
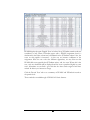
Above, 18 of the original 22 spectra indicated a peptide sequence matching with
Lactoglobulin Beta. Most peptide matches shows a high confidence – strong evidence
for having found the correct protein. We can also see exactly where the peptide fits
into the protein sequence; with the matching sequences highlighted in red at the
bottom.
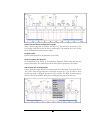
As mentioned above, the peptide sequence results are based on a database search
guided by an initial de novo sequencing analysis. Let’s see how the de novo sequencing was
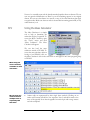
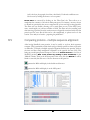
able to help. Click on the entry for spectrum #3, 467.2729. This will bring up the main
processing window for spectrum 467.2729 2. Look in the top left frame to see the de
novo and database results.
Color coding shows positional confidence scores. By the letters coded in red we can
see that the PEAKS auto de novo analysis returned, with >90% confidence, the partial
peptide sequence LLVXXTMK, but was not as sure of the middle two residues. The
PEAKS DB Search was able to confirm this result, returning the peptide:
LLVTQTMK.
Selecting another spectrum from the Peptide Data frame (left), e.g. 545.928 3, will
allow us to view the results from that spectrum without having to return to the protein
identification result. Click on the time and date stamp beneath the filename to return to
the report.
20
SVC
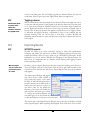
Manipulating Results
We already know that the sample was a simple digest of Lactoglobulin Beta; let’s see if
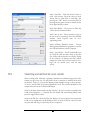
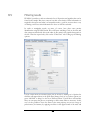
we can filter out the other spurious hits from the report. Click on the Filter Pane tab.
Here we can add to the filter pane and add a filter that shows only database peptides
with scores greater than 50% or any other value we choose. Scroll down the Possible
Filters list and select the Peptide Filter called Score Filter. In the [Edit Filter] frame,
remember to select "greater than" and type 50, then press the Add Filter button. The
filter now appears in the list of Selected Filters. The filter can be edited while in either listing
and can be added multiple times (in case, for some reason, you only wanted peptides with a score greater
than 50% but less than 90%). Hit the Apply Filters button and let's examine the results.
Click the ‘Protein View’ tab.
Ok, so we removed the other protein, and we’re left with Lactoglobulin beta. The
other protein only had one hit IGDLQK, with score 50%. That peptide was removed
from the report. Since the other protein no longer had any supporting peptides, it was
also removed from the report. Now we’re left with our lactoglobulin beta group. Click
the plus sign here to expand this group further.
Remember, all proteins in this group contain the same set or a subset of the same
peptides. We’ll see that there are still some hits down there that aren’t very relevant.
Yes, they contain a good peptide, but only one. Let’s see if we can remove these one
hit wonders. Go back to the Filter Pane tab. The Selected Filters list still shows our
Peptide Score Filter > 50%. Let’s add one to it. Scroll down the list of Possible filters
and select the protein filter called Query filter. In [Edit Filter], select the ‘greater than’
option and type ‘1’ in the box, then press the Add Filter button.
21
Now both filters appear in the list. Press the Apply Filters button to use them. Going
back to the Protein View tab, and expanding the plus sign reveals that we are only left
with variants of lactoglobulin.
S
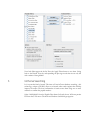
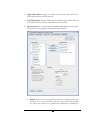
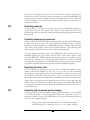
inChorus Searching
Let’s try another kind of search. This time we’ll use inChorus database searching – this
technology, unique to PEAKS, allows us to launch other search engines that will help
improve the results. The best confirmation of results comes from using two or more
methods to confirm the peptide matches.
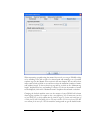
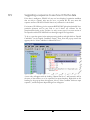
Select ‘OrbiOrbi.pkl’ from the Peptide Data frame (left) and choose ‘inChorus protein
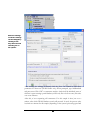
ID’ from the Tools menu. The inChorus Database search dialogue appears:
22
Make sure that “Peaks database Search” and “X!Tandem Search” are selected. Notice
that there are three ‘Options’ icons on the right. They correspond to each search
engine.
Click the Peaks database Search options button. The options pane is similar to the one
we’ve seen already. The settings that we used before should still be there. If not, select
“OrbiStandard” from the drop down list in the top right corner. Before pressing the
“OK” button, we can make one change. Since we already have de novo sequencing
results, we don’t need to do de novo sequencing again. Click the option ‘I have already
run de novo, don’t do it again’, then press the OK button.
Click the X!Tandem search options button (top). This window allows us to set options
for the X!Tandem search tool. This window is set up to behave almost exactly the
same as the X!Tandem interface, so it may look familiar. Leave the fragment error at
0.1, and make sure there are no modifications turned on. Under “7. Predefined
methods” choose FTICR. To learn more about X!Tandem settings, double-click any
of the question marks. Press the OK button.
Now that we’ve set everything up for the inChorus search, press the OK button on the
inChorus Database search dialogue. inChorus will call on each search engine, wait until
they are finished, then compile their results together, ensuring the integrity of the dataresults relationship.
Watch the task queue (bottom-left of PEAKS Studio). After everything is finished,
new search results will appear in the Peptide Data frame (left), stamped with the date
and time. The task queue will be empty, and the results will display. There’s also a nice
little report to tell us if there were any errors.
23
PEAKS displays the same ‘Peptide View’ as before. Now, X!Tandem search results are
considered as well. Where X!Tandem agrees with a PEAKS assignment, there’s a
checkmark in the Peaks column and a checkmark in the X!Tandem column. Also, the
score on this peptide is increased – in this way we increase confidence in the
assignment. Since the two tools take different approaches, we may discover that
PEAKS finds some peptides that X!Tandem misses, and vise-verse. Where this is the
case, only one checkmark will be displayed and the score is penalized slightly in some
cases. Sometimes we can find a good hit that the other search engine would have
missed. In this way we increase coverage.
Click the ‘Protein View’ tab to see a summary of PEAKS’ and X!Tandem’s results at
the protein level.
Thus concludes our walkthrough of PEAKS 4.2’s basic features.
24
Chapter
4
Graphical User Interface
A reference section to help us find our way around.
T
his chapter deals with interface elements. It is meant to be used as a reference
so we can look up certain interface elements when we get stuck. For
instructions on how to use PEAKS Studio to perform certain tasks, the
section entitled “Using PEAKS Studio” will be more instructive.
The first part of this chapter describes windows, dialogues, frames and reports. This
tells us what certain dialogue boxes, windows and frames do and how to read them.
The second part of this chapter deals with toolbars. Toolbars are a very useful way to
quickly get at the functions we use most.
25
SVC
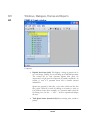
Windows, Dialogues, Frames and Reports
SVC
PEAKS 4.2 main window
Comprises:
Peptide data frame (left): This displays a listing of parent ions by
m/z and charge. Clicking on one will bring up its MS/MS spectrum.
The colored dot by each spectrum appears dark green for
unprocessed, or light green for sequenced (or partially sequenced). An
asterisk (*) next to a spectrum shows that it contains unsaved
information.
Spectra are grouped by data files, or by nodes (which act like data
files). Select a data file or node by clicking on its name (i.e. click on
CytC-ESI.anz in the above example), or a spectrum within a data file
by clicking on it. Use the ‘ + ’ and ‘ – ’ boxes to expand and collapse
the view.
Task Queue frame (bottom left): Shows running tasks, sorted by
priority.
S marks a section applicable to PEAKS Studio, C for PEAKS client and V for PEAKS
Viewer
SC
Working area (right): This is where the Protein Identification Result
Window and the Main Processing windows appear.
Menu bar: access file, edit, view, tools, windows, and help commands.
Main window toolbar: quick access to many commands. See
“Toolbars” section below
Auto de Novo Parameters Dialogue
Instrument: choose the type of spectrometer that produced our data.
Choose from a dropdown list.
Parent mass error tolerance: determines how much random and
systematic experimental error on the parent/precursor ion PEAKS
will account for in its analysis. Select a tolerance from the dropdown
list. Daltons are the units here.
27
Fragment mass error tolerance: determines how much random and
systematic experimental error on the fragment/daughter ion PEAKS
will account for in its analysis. Select a tolerance from the dropdown
list. Daltons are the units here.
Enzyme: choose from a dropdown list of enzymes that we used to
digest our protein sample. Click the “Edit Enzymes” button to edit the
enzymes defined in this list, or to add to it.
Report up to: set how many de novo sequence candidates PEAKS
will report. Choose from a dropdown list.
PTM selected for search: this box displays the modifications
currently selected for analysis, these will be considered during auto de
novo sequencing. To change this, click the Add/Remove PTM
button.
Max variable PTM per peptide: this allows us to restrict the number
of variable PTM that will appear on any given peptide.
28
SC
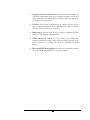
Protein Identification Parameters Dialogue
Instrument: choose the type of spectrometer that produced our data.
Choose from a dropdown list.
Parent mass error tolerance: determines how much random and
systematic experimental error on the parent/precursor ion PEAKS
will account for in its analysis. Select a tolerance from the dropdown
list. Daltons are the units here.
Fragment mass error tolerance: determines how much random and
systematic experimental error on the fragment/daughter ion PEAKS
will account for in its analysis. Select a tolerance from the dropdown
list. Daltons are the units here.
29
Enzyme: choose from a dropdown list of enzymes that we used to
digest our protein sample. Click the “Edit Enzymes” button to edit the
enzymes defined in this list, or to add to it.
PTM selected for search: this box displays the modifications
currently selected for analysis, these will be considered during database
searching. To change this, click the Add/Remove PTM button.
Database to search: This dropdown allows us to choose which
FASTA format database to search
Taxonomy selection: if the ‘Database to search’ has been configured
for taxon based searching, this list will allow us to select limit which
taxa are searched.
Paste fasta sequences: Paste a few sequences in this box and
PEAKS 4.2 will search through those sequences as opposed to the
database selected.
Preprocess this data ‘on the fly’: PEAKS Studio has its own built-in
preprocessor for removing noise, centroiding, and peak charge
recognition from MS/MS data. Check this box to turn preprocessing
on.
Advanced options (de novo sequencing): The PEAKS approach
to protein identification uses de novo sequences to help out in the
search. This section allows you to decide how to obtain the de novo
sequences required for the search.
30
SCV
PEAKS Properties Dialogue
Enzyme list tab: Displays a list of built-in and user-defined enzymes.
We may edit and create enzymes from here.
PTM library tab: Displays a list of built-in and user-defined PTMs.
We may edit and create PTM from here.
Database tab: Displays a list of databases available to PEAKS. We
may make new databases available to PEAKS from here.
31
SCV
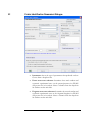
Enzyme Editor Dialogue
Digestion Rules:
Specificity Parameters:
Shorthand notation:
Saving/Loading Enzymes:
This is how we specify where our enzyme will cleave the
protein between two amino acids to create peptides. Use set brackets {}
around a residue to denote “any amino acid except the ones enclosed in these
brackets”. Use X to denote “any residue”. Listing several amino acids in one
box means “any one of these residues”.
Peptides can break down such that only one end is a
cleavage site. Check the boxes to tell PEAKS to search for only for peptides
that have proper cleavage sites on both ends, or to require that only one end
be a proper cleavage site.
Advanced users may specify their enzyme cleaveage in
shorthand notation, but it is not required.
After setting up an enzyme, we can save it for
future use. Click the "Save Parameters" button, and choose a name for future
reference if prompted. Don't worry, we can't accidently overwrite the defaults.
Any enzyme we save will be available in the drop-down list at the top of the
window. To see what's inside, just select one, and the enzymes digest rules
boxes will be populated.
32
SC
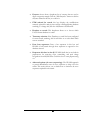
PTM Selector Dialogue
This dialogue
allows us to create
or edit a PTM
Here we can form a list of available post-translational modifications. We can choose
any PTM as Fixed PTM or Varied PTM (to tell PEAKS that it may or may not occur).
To make this selection, click on a PTM in the list at left, and then click the “Select As
Fixed=>” or the “Select as Varied=>” button. If a PTM is already selected as a fixed
PTM, it cannot be selected as varied PTM, and vise versa.
If we change our mind about a PTM after having selected it, it is still possible to
unselect it. Click the erroneous PTM from the list of ‘Selected Fixed PTM’ or ‘Selected
Varied PTM’, and then click the “<=Unselect” button to remove it from either list of
Selected PTM.
PEAKS software ships with some pre-defined PTMs. These are listed as
<Built-In>. If we want to create a new PTM, we can click ‘New PTM’ to
create a new one. The Editing a PTM and Creating a New PTM sections
below describes how this is done.
33
SCV
PTM Editing Dialogue
This dialogue
allows us to create
or edit a PTM
SCV
Name: This will appear in the PTM list
Abbreviation: This will appear in the auto de novo results, if it is found.
Mass (monoisotopic): The mass that the residue gains or loses as a
result of the PTM. Enter this numerically here, or enter the chemical
formula below.
Neutral Loss Mass: The mass that the modified residue loses as a
result of fragmentation. E.g. 28 would signify a loss of 28 Daltons.
Formula: The chemical formula of the PTM. This will automatically
enter the mass.
Residues that can be modified: Enter residues that can be modified
anywhere, residues that can only be modified if they are at the Nterminus and residues that can only be modified at the C-terminus,
and residues that can only be modified if they are not on either
terminus.
Rule: user entered, a comment for our reference.
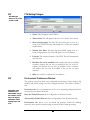
Environment Preferences Window
This window controls the basic, user configurable environment. Colours, displays, file
handling and default settings can all be changed from here. The window contains 7
tabs:
The ‘Basic’ and
‘Advanced’ Ion
tables differ only in
the number of ions
they can display.
The ‘Basic’ table
displays up to six
ions.
Parameters tab: Our saved parameters for de novo sequencing and protein ID are
shown and can be deleted from here.
Basic Ion Table Editor tab: allows configuration of the basic ion table
Advanced Ion Table Editor tab: allows configuration of the advanced ion table
Environment tab: Allows us to set default file locations, default file handling
functions, and to specify local processing or remote PEAKS Online processing
34
Colour tab: from here we can set the colours to use for various spectrum annotations.
Display tab: from here we can set the type-face to use across the PEAKS 4.2 user
interface. The width of spectrum peaks can also be set from here.
Manual De Novo tab: default options for manual de novo sequencing can be set
from here.
SCV
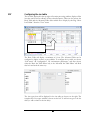
Protein Identification Result Window
The protein identification result window contains the results from one protein
identification run on one data set. It is organized into three tabs: peptide view, protein
view and search parameters.
De Novo view
The De Novo view summarizes the de novo sequencing results for each spectrum in the
data file. The exact contents of the list are determined by filters set on the Filter Pane.
By default the peptides are grouped by spectrum, but the list is sort-able by any of the
columns in the table. Selecting one or more (click and drag, or use shift+click) items in
this list brings those spectra in the peptide data tree (found on the left hand side).
Peptide View
The peptide view summarizes the results for each MS/MS spectrum. All peptides that
match to each spectrum are displayed. The exact contents of the list are determined by
filters set on the Filter Pane. By default the peptides are grouped by spectrum, but the
list is sort-able by any of the columns in the table. Selecting one or more (click and
drag, or use shift+click) items in this list selects those spectra in the peptide data tree
(found on the left hand side). The bottom panel of this view shows more details about
the peptide identifiecation that is highlighted in the top section. In this view, we can see
the protein that the peptide came from, and a simple alignment between the original de
novo sequence for this spectrum (if available) and the peptide found in the database.
35
Peptide View
showing peptides
grouped by
spectrum
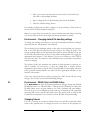
Protein View
The protein view is most useful as a summary of what proteins were present in a
sample, and the peptides matched to them. It has two sections:
Protein View
showing two
proteins in the
index, and
beginning the full
report
Index (top section): PEAKS presents a list of proteins that it
believes to be the best match for the sample. This index lists them
by accession number, ranked in descending order by score. Very
similar proteins (i.e. ones that contain most of or all of the sequences identified
by PEAKS) are grouped together – only the first entry in this group is shown
here. Show the whole group by clicking the + sign. In the example below,
lactoglobulin beta is the top ranked protein candidate.
Peptide Match Reports (bottom section): PEAKS presents
each protein candidate with a peptide match list beneath it. Each
peptide that matched the protein sequence is shown, in order, by
spectrum. The confidence that the correct peptide sequence was
found is displayed next to each peptide sequence. At the bottom
of this list, the complete protein sequence is shown with matching
peptides highlighted in red.
MSA Pane (bottom section): This panel displays a multiple
sequence alignment between any protein that is ‘marked’ in the
36
Index (top section). The MSA is only displayed when the button is
pressed.
Search parameters
This tab displays the protein identification parameters that were used to guide the
search that generated these results.
Filter pane
The Filter Pane allows us to control what to display on the other tabs of the multi-part
protein ID report by setting up customizeable filters. The various parts of this screen
are described as follows:
Possible Filters list: a list of the filters, currently available, that can be used to
build a particular filter set.
Active Filters list: a list of the filters, currently selected, that will be used to
filter your results.
Add Filter Button: clone the currently selected filter in the Possible Filters
listing to the Active Filters.
37
Apply Filter Button: Apply your filters; any/all selected filters will not be
used until this button is actually pressed.
Edit Filter Frame: Edit the settings for the currently selected filter. Filters in
the Possible Filters list and the Active Filters list can be edited
Options frame: The options listed here fundamentally change what is listed in
the De Novo View, regardless of the specific filters selected.
Option 1: De Novo View shows peptides that could not be explained by peptides from
the Peptide View – In this mode, the De Novo View only shows peptides
for spectra that could not be satisfactorally explained by searching the
38
database. As such, removing a peptide/spectrum from the database search
results – the Peptide View list – will cause the de novo sequence for that
spectrum to appear on the De Novo View. The de novo peptides still
have to pass the filters defined for the De Novo View.
See the section
“Post analysis of
results – preparing
for publication” for
help on using
filters
Option 2: De Novo View shows all peptides that are not filtered – In this mode,
the De Novo View shows de novo sequences for all spectra that have not
been removed by filtering out database peptides or proteins. As such,
removing a peptide/spectrum from the database search results – the
Peptide View list – will cause the de novo sequence for that spectrum to
be removed from the De Novo View. The de novo peptides still have to
pass the filters defined for the De Novo View.
Checkbox: remove de novo peptides with no database hits – This option
removes all peptides that have no corresponding database peptide hits.
Selecting Option 2 (above) and this checkbox shows essentially the
"reverse" of Option 1.
Save As Button– Save and re-use your filters between different sessions of
PEAKS. All active filters and selections from the Options Frame are saved.
39
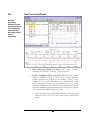
SCV
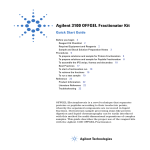
Main Processing Window
The main
processing
window is used to
perform manual de
novo sequencing,
and to examine
the results of auto
de novo
sequencing
Main Processing Window Toolbar: quick access to many
processing functions. See “Toolbars” in the next section.
Peptide Candidates Frame (top left): PEAKS shows peptide
sequence candidates, ranked by score for the selected spectrum.
Peptide sequences are grouped by the headings: “Auto de novo”,
“Manual de novo”, “user defined result type” and “database search
results” depending on how they were derived. For de novo results,
positional confidence is color coded on each residue. More specific
positional confidence appears when the mouse is held over a sequence
– this shows the confidence in each of its parts.
Under the “Manual de novo” heading, the masses of the residues are
displayed. That is to say, the mass of the whole peptide minus
water.
40
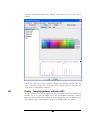
The ions displayed
in both modes can
be edited. See the
section in
configuring PEAKS
4.2
Ion Table Frame (top right): The Ion Table shows the proposed
ions with their corresponding masses -- i.e. the mass of the b1 ion is
shown in the top right corner. The default Ion Table will display b, a,
immonium, yH2O, yNH3 and y ions in basic mode; it will display b,
b-H2O, a, c, immonium, y, y-H2O, z, z’ and y(2+) ions in advanced
mode. To switch from basic mode to advanced mode, choose ‘Show
ion table’ from the ‘View’ menu.
The Ion Table Frame also contains an error plot (it may be necessary
to scroll down to see the error plot). The error plot shows the confidence
each ion is assigned. The most confident results lie on the
centerline. Clicking a cell or column in the Ion Table highlights the
corresponding points on the error plot and corresponding peaks
on the spectrum.
To switch views,
choose ‘Alignment
by’ from the ‘View
menu’
Spectrum View Frame (middle): Shows a graphical representation
of the spectrum. Peak masses are labeled, as are the peaks associated
with identified ions. We can zoom in on the spectrum by clicking and
dragging over an area.
Spectrum Alignment Frame (bottom): Shows a graphical
representation of the spectrum. This view always shows the whole
spectrum and is used as a tool to help us navigate the spectrum view
frame. A blue bar along the horizontal axis of the alignment view
indicates the range of the spectrum view in the Spectrum View Frame.
The Spectrum Alignment Frame can also show the positions of
major ions that delimit the proposed sequence. By default, the
Spectrum Alignment Frame displays b-ion and y-ion peaks and
the derived peptide sequence between them. The Spectrum
Alignment Frame can also show the position of c-ion and z-ion
peaks.
41
SCV
Ion Editor
The Ion Editor is
used when
performing manual
de novo
sequencing.
Selected peak information: displays information about the currently
selected peak.
Under “Please choose ion type”, the radio buttons set whether the
ions in the “ion choice list” are C terminal ions or N terminal ions.
Ion choice list: (left): lists the ions we can apply to the selected peak
Selected ion list (right): lists the ions we have selected add or
remove them using the “Add” and “Remove” buttons.
Apply button: applies the ions in the “selected ion list” to the selected
peak.
42
SCV
Export Image Dialogue
File Format: select an image file format from the drop down list.
Bitmap, JPEG, Portable Network Graphic and Graphics Interchange
Format are supported.
Width and Height: together these determine the size of the output
image (measured in pixels).
Filename: type in the textbox, or browse to a file
name of the image that will be created.
Resolution: in most cases the image resolution can be upscaled for
printing large pictures. More resolution (i.e. more pixels) means a
higher quality picture when blown up or printed.
Image types: Select one of these options to choose the image that
will be output. The ‘annotated spectrum with alignment’ will suit most
purposes.
43
, to enter the file
SCV
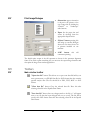
Print Image Dialogue
Orientation: paper orientation
is shown in the picture at the
top. Change this by clicking the
“Portrait” or “Landscape”
radio buttons.
Paper: Set the paper size and
source by selecting from the
appropriate dropdown list.
“Printer” button: pressing this
will bring up another dialogue
where we can select from a list
of printers installed on our
machine.
“OK” button: this
commence printing.
will
The default print output is the full spectrum as shown in the spectrum alignment
frame. If we wish to print something else, we must use the export image functions and
then print the image from another application.
SVC
Toolbars
SCV
Main window toolbar
"Open data file" button: This allows us to open a raw data file built by our
mass spectrometer, or a PEAKS data file (in ANZ format) that also contains
peptide analysis data. The file should be in PKL, DTA, MGF or ANZ
format.
"Close data file" button: Close the selected data file. Press this after
selecting a data file in the Peptide Data Frame.
"Save data file" button: Save any changes made to the file (a ‘*’ will appear
next to any file that has been changed and not yet saved). The file will be
saved in the ANZ format. Press this after selecting a data file in the Peptide
Data Frame.
44
"Save all files" button: Save all files. Any changes to files will be saved in
the ANZ format.
“Copy” button: Copy selected spectrum data.
“Cut” button: Cut selected spectrum data.
“Paste” button: Paste spectrum data into the selected data file.
"Manual merge spectra" button: After selecting more than one spectrum
in the peptide data tree, this button becomes enabled. Right click it to merge
these spectra into a single MS/MS spectrum, and remove the old ones.
"Data Refinement" button: Merge scans of the same peptide, remove
noise spectra, preprocess within each MS/MS spectrum and recover peptide
charge state. The data refinement options dialogue will allow us to choose
and to set parameters for each of these refinement tools.
SC
"Auto De Novo" button: perform auto de novo for a selected data file,
spectrum or list of data files. Press this after selecting one or more data files
(or spectra) in the Peptide Data Frame. An auto de novo options dialogue will
allow us to set parameters before we begin.
SC
"PEAKS Protein ID" button: perform protein identification a selected data
file. Press this after selecting one or more data files (or spectra) in the Peptide
Data Frame. A protein identification options dialogue will allow us to set
parameters before we begin..
SC
"inChorus Protein Identification" button: perform protein identification
on a selected data file using multiple search engines. Press this after selecting
a data file in the Peptide Data Frame. A protein identification options
dialogue will allow us to set parameters before we begin.
"Environment Preference Configuration" button: configure the
environment, spectrum color-coding, and manual de novo parameters.
“PEAKS Properties Configuration” button: define PTM, Enzymes, and
add FASTA protein or EST databases.
“Import Database Wizard” button: help user download and configure
database.
45
SCV
Main Processing Window Toolbar
“y ion Alignment” button: toggle (show/hide) the location of PEAKS
corresponding to y-ions and the corresponding proposed peptides between
them.
“b ion Alignment” button: button: toggle (show/hide) the location of
PEAKS corresponding to b-ions and the corresponding proposed peptides
between them.
“Deconvolute” button: toggle (on/off) deconvolution of the mass spectrum
scale.
“1:1 zoom” button: return spectrum to original 1:1 zoom.
“Undo Zoom” button: return to previous zoom ratio.
“Edit Ion” button: set or edit the type of ion associated with a peak in manual
de novo. Press this button after having selected a peak in the spectrum view
frame.
“Next Peptide” button: redo changes to the peptide in manual de novo.
“Previous Peptide” button: undo changes to the peptide in manual de novo.
“Export Results” button: export the spectrum view, ion table, or to a picture
(bmp, gif, or jpg format) with ions, masses, peaks and peptides marked.
“Print Results” button: print the spectrum view with ions, masses, peaks and
peptides marked.
“View Results” button: show, in HTML format: the spectrum view with
ions, masses, peaks and peptides marked; peptides and confidence scores;
the ion table; and the error plot.
46
Chapter
5
PEAKS Studio Configuration
How to set up PEAKS Studio just the way we like it.
T
his chapter deals with configuration. PEAKS 4.2 is a versatile and flexible
tool. But in order to use the software to its full extent, we must learn how to
configure it to make it do what we want it to. Additionally, PEAKS 4.2 allows
us to set up many defaults and presets to help us be quick and precise.
We can use PEAKS 4.2 without the need to configure; default settings will be used.
However, to increase efficiency we should set environmental preferences, and PEAKS
properties. This will enable us to customize the tool to our requirements. It is
recommended that we configure PEAKS 4.2 before processing data files.
S marks a section applicable to PEAKS Studio, C for PEAKS client and V for PEAKS
Viewer
SCV
PEAKS Properties Configuration
One of PEAKS 4.2 preferences, PEAKS Properties configuration sets the parameters
that the algorithm will use while processing our data files. PEAKS properties include:
enzynme, PTM and database. When using PEAKS Client, all PEAKS properties are
controlled by the server, please contact your administrator. PEAKS Studio 4.2
provides tools to edit PEAKS properties for convenient use in de novo sequencing and
protein identification in PEAKS Studio. To edit PEAKS Properties:
Click the
Or from the “Edit” menu, select “Configuration” then “PEAKS Properties”
icon in the main window toolbar;
The PEAKS Properties dialogue will then appear. This dialogue box has three tabs:
“Enzyme list”, “PTM Library” and “Database”. Clicking a tab will allow us to edit
the PEAKS Properties corresponding to that tab. We can also import or export our
preferences to/from a file.
SV
Creating and defining PTM
If we know that our sample protein may have been modified since translation, we need
to apply this information to our analysis. To edit the list of PTM available to PEAKS
Studio we open the PEAKS Properties dialogue and select the PTM Library tab.
PEAKS Client uses the PTM library defined on the server, editing here will have
no effect on the list available during analysis.
PTM Post
Translational
Modifications
affect the mass of
modified proteins
and residues
All PTM are listed here including <built-in> PTM and user defined PTM. From here,
we can create a new PTM, edit an existing PTM or remove a PTM from the list. See
the sections below for help with these operations. Built-in PTM cannot be removed from the
list, but can be edited.
S marks a section applicable to PEAKS Studio, C for PEAKS client and V for PEAKS
Viewer
Editing a Built in PTM
It is possible to modify a built in PTM. PEAKS will save the
modification and treat this PTM as a customized PTM. It will
temporarily overwrite the built-in PTM - we will not be able to see the
original, built-in, PTM until we remove the customized one. We can
remove this customized PTM at any time and the built-in PTM will
reappear.
Creating a New PTM
To create a new PTM, we open the PEAKS Properties dialogue, ensure that the ‘PTM’
tab is selected and click the ‘new’ button. To create a new PTM ‘on the fly’ while setting up
PEAKS auto de novo or PEAKS Protein ID, click the “new PTM” button while selecting PTM.
The PTM Editing dialogue will appear:
Figure 1 Create new PTM
Now we type information pertaining to our PTM in the appropriate boxes (see above
section on Interface for a more in depth explanation of these fields). At a minimum,
we must enter a name, a mass and one residue that may be modified.
Enter the mass of the modification either by typing in its monoisotopic mass
difference directly, or by entering its empirical formula. It is unnecessary to do both;
each will override the other.
Click the “OK” button to save changes and create our new PTM, or click the “Cancel”
button to exit, discarding changes.
After clicking the “OK” button we return to the PEAKS Properties dialogue to find
that our new PTM is listed at the top of the PTM list.
49
Editing a PTM
To edit a PTM, we open the PEAKS Properties dialogue, ensure that the ‘PTM’ tab is
selected, and select a PTM from the list by clicking on it and click the ‘Edit’ button. To
edit a PTM ‘on-the-fly’ while setting up PEAKS auto de novo or PEAKS Protein ID, click the
“add/remove PTM” button, to bring up the Modification window for that search, then click the “new
PTM” button. The PTM Editing dialogue will appear. Now we follow the same
procedure (see above) as we would if creating a new PTM.
Removing a PTM
To remove a PTM, we open the PEAKS Properties dialogue, ensure that the ‘PTM’
tab is selected, select a PTM from the list by clicking on it, and click the ‘Remove’
button. Any built-in PTM cannot be removed.
S
Database Manager
PEAKS 4.2 needs a protein or EST database (in FASTA format) to identify protein
candidates. Since databases are being constantly updated, PEAKS does not ship with a
protein or EST database. Thus, we need to download it from the Internet and tell
PEAKS where the database is located. PEAKS provides the Database Manager as a
tool to help us do this. To see a list of databases available to PEAKS 4.2, load the
PEAKS Properties dialogue and click the ‘Database’ tab. From here we can edit a
database’s properties, load a new database, or remove an existing database.
PEAKS Client uses the databases configured on the PEAKS Online server.
50
Load/Configure a new database
For an in depth look at configuring a database, see the Database Configuration section in Chapter 2.
To configure a new database, we open the PEAKS Properties dialogue, ensure that the
‘Database’ tab is selected and press the “New” button. Now we open up our web
browser to find a database to download. Find one, download it, and unpack it. If
taxonomy is available for this database, download those files too. Return to PEAKS
4.2 and find the file on our system where we unpacked it. Name the database and
select the header format to use (or we can define our own). If taxonomy is available for
the database, find those files too. Click “OK”. The new database will now appear,
listed by our chosen name, in the list of databases.
Remove a Database
To remove a database, we open the PEAKS Properties dialogue, ensure that the
‘Database’ tab is selected, select a database from the list of databases, and press the
“Remove” button. This will not permanently remove it from our system, it may be
reloaded (follow the procedure for configuring a new database) at any time.
Edit a Database
We can’t edit the
database itself
from within PEAKS
4.2.
This tool allows us to change the name that PEAKS 4.2 associates with a database,
taxonomy files and the header parsing rules for that database. To edit a database, we
open the PEAKS Properties dialogue, ensure that the ‘Database’ tab is selected, select a
database from the list of databases, and press the “Edit” button.
Moving/Updating a Database
If we choose to move a database to another directory, or delete it entirely, we should
tell PEAKS. We must remove the database from the list and re-load it. Until we do so,
the database name will appear in red in the list of databases and any protein
identification using that database will fail.
51
If we choose to update the database (perhaps by downloading the latest database file
and overwriting the old database file), PEAKS will show the database information in
light gray. A light grey colour could also mean that the database does not have header information.
SV
Importing and Exporting PEAKS Properties
We may wish to use PEAKS 4.2 on another system. However, if we have a large
number of user defined PTM, enzymes and saved parameters it could take a great deal
of our time to re-input those. This is where importing and exporting of PEAKS
properties is useful.
The export function will save PEAKS Properties information in a XML file. The
import function can read a PEAKS properties XML file and overwrite local PEAKS
Properties with the information from XML file. If we wish to use our PEAKS
properties on a colleague’s system, we must remember to export our colleague’s
properties to a separate file so that it will not be lost and can be imported later.
52
A note on sharing sequences with PTM
Sequence data and protein identification results for a given spectrum are
stored in an .ANZ file. Any modifications that were found in the
sequence are also included. As such, user-defined modifications will still
show up if the file is viewed on another machine. It is not necessary to
import all PEAKS properties to view these modifications. Also, userdefined modifications can be extracted from an .ANZ file and added to
the local PEAKS properties.
To export PEAKS properties to a file,
open the PEAKS Properties dialogue and
press the “Export” button. Type in a file name and press the “Save” button.
To import PEAKS properties from a file,
open the PEAKS Properties dialogue and
press the “Import” button. Select a file or type in a file name and press the “Open”
button. This must be a PEAKS configuration file in XML format.
To import a user defined PTM from another user’s .ANZ file, we open the .ANZ file
and find a sequence containing the user defined modification. Right click on that
sequence to bring up the popup
menu.
Click
the
“View
Modifications” menu item. This
brings up a dialogue box named
“Modifications”. Select the PTM of
interest from the dropdown list (in
this example: ‘Lab 2 custom PTM’)
and click the import modification
button.
SVC
PEAKS Environment Preference Configuration
One of PEAKS 4.2 preferences, PEAKS Environmental Preference allows us to
customize PEAKS 4.2 to our needs. PEAKS Environmental Preferences include:
Environment, Color, Manual de novo, and Parameters. To edit PEAKS 4.2
Environment Preferences:
Click the
Or, from the “Edit” menu, select “Configuration” then “Environment
Preference”
icon in the toolbar;
53
The Environment Preferences dialogue will then appear. This dialogue box has seven
tabs: ‘Parameters’, ‘Basic Ion Table Editor’, ‘Advanced Ion Table Editor’
‘Environment’, ‘Color’, ‘Display’, ‘Manual de novo’ and ‘Parameters’. Clicking a tab
will allow us to edit the Environmental Preferences corresponding to that tab.
S
Removing Saved Parameters
After months of use, our list of parameters saved for use with PEAKS Protein ID or
PEAKS auto de novo may become cluttered with infrequently used parameter sets. It
makes sense to clear them out from time to time. To do so, open the Environment
Preferences dialogue and ensure that the ‘Parameters’ tab is selected. A list is shown
for each tool that has savable parameter sets. Select one or more (using shift+click and
ctrl+click) and click the adjacent “Remove” button to remove it from the list.
54
SCV
Configuring the ion table
The ion table, displayed in the top right of the main processing window, displays all the
ions that were found as evidence for the selected sequence. There are two presets: the
Basic Table and the Advanced Table. Select which one to display by choosing “Show
Ion Table ►” from the “View” menu.
The Basic Table will display a maximum of 6 ions. The Advanced Table can be
configured to display as many as are available. To configure the ion table, we choose
“Edit menu” “configuration” “environment preferences” and then choose
either the ‘Basic Ion Table Editor’ tab, or the ‘Advanced Ion Table Editor’ tab. Both
tabs look and work the same way:
The ions types that will be displayed in the ion table are shown on the right. The
complete list of ion types available is shown on the left. To add an ion type to the ion
table (i.e. add a column to the ion table):
55
1. Select one or more ions from the list on the left. Use shift+click and
ctrl+click to select multiple list items.
2. Select a charge (from 1-4) from the drop down list in the middle.
3. Click the ‘Add with charge’ button
For example, configure the ion table to display y2+ ions by selecting ‘y’ from the list on
the left, and ‘2’ from the dropdown charge list.
Remove ion types from the ion table (i.e. remove columns from the table) by selecting
one or more items in the list on the right, and clicking the ‘Remove’ button.
SCV
Environment – Changing default file handling settings
To change the working environment, we open the Environment Preferences dialogue
and ensure that the “Environment” tab is selected.
We can change the environment settings so that when we are browsing our system to
find or save data files, PEAKS always starts looking in the folder we specify. The
current working folders for data input and data output are shown. PEAKS 4.2 can use
the last folder we loaded from (saved to) as the current working folder or by togglig the
appropriate radio button to “User directory” we can set it ourselves so that it will be
the same each time. The directory where PEAKS stores its preference information
cannot be changed.
The option to load a new spectrum view window for each spectrum or open one at a
time is available. We can choose to show the sample data at startup. Further,
adjustments can be made so that the GNU (General Public) license displays whenever
GNU governed software/libraries are called. Click the appropriate checkbox at the
bottom of the window.
Once we’ve chosen from these options, pressing the “OK” button will exit, saving
changes. The “Cancel” button will exit discarding changes.
SC
Environment – PEAKS Client to PEAKS Online
In the Environment tab of the Environment preferences dialogue, change the “Default
PEAKS Invocation” to “PEAKS Online”. Then specify the IP address or URL of the
PEAKS Online server, the port number to use, and a username and email address.
Press ok. Now we can use PEAKS 4.2 in the same way we normally would, except that
processing will occur on the PEAKS Online server. The email is used to notify us that
a job has been completed, in the event that we close PEAKS 4.2 before finishing.
SCV
Changing Colours
For ease of viewing, we can choose which colours we would like to represent which
items on the spectrum view. To change the colour of an object on the spectrum, we
56
open the Environment Preferences dialogue and ensure that the ‘Colour’ tab is
selected.
Choose the object whose color we’d like to change from the list at the left. Then we
select a swatch to choose the colour. After we’ve chosen colors we may click the
“OK” button to exit and save changes.
SCV
Display – Changing typefaces and peak width
We can customize the various typefaces to use on certain parts of the PEAKS 4.2
interface. To do so, open the Disply tab on the Environment Preferences window.
Select the typeface from the dropdown list and/or change the font size, then press ok.
The width of peaks on the spectrum display can be adjusted from here as well.
57
SCV
Changing Manual de novo defaults
We may wish to sequence a peptide manually, using spectrum data. PEAKS 4.2
provides us with a set of tools to help us do so. We may need to tweak these tools to
adjust for error tolerance and to customize the working environment. This can be
done on an individual basis, by right clicking on the sequence we’re working on, but we
can set defaults.
To adjust Manual de novo options, open the Environment Preferences dialogue and
ensure that the ‘Manual de novo’ tab is selected.
58
When sequencing a peptide using the manual de novo tools, we can get PEAKS to help
us by searching to the left or right of a selected peak and returning a set of possible
sequence tags (see the Manual de novo section in the next chapter). We can choose how
many search results we’d like to see and choose how the maximum (number of amino
acid residues) length. To choose how long tags will be, we click on the “Maximum tag
length” dropdown list box, and making a selection. To choose the number of search
results displayed, click on the “Maximum return” dropdown list and make a selection.
Changing the default machine error sets the amount of error PEAKS will tolerate
when tagging a residue. For example: we have a mass difference of 113.19 between two y-ions that
we have labeled. We are fairly confident that this should be tagged L (Leucine, with actual mass of
113.08), but PEAKS is not labeling it for us. This may be because 113.19 is too far out of PEAKS
error tolerance for the mass of L. We can tweak the settings until we get the desired result.
59
To do so, type a value for error (larger numbers indicate greater tolerance) into the
“Default machine error” textbox.
After having made all desired changes, click the “OK” button to save changes and exit
the dialogue box. Click the “Cancel” button to exit, discarding changes.
60
Chapter
6
Loading and preparing data
A task based guide to getting our data into PEAKS 4.2.
T
he following chapters deal with usage. They are broken up into tasks that a
typical user might perform. It assumes we can identify parts of the Graphical
User Interface and that we are familiar with how PEAKS 4.2 can be
configured. The preceding two chapters provide in depth help on these
subjects and should be used as a reference. Such detail has occasionally been omitted
from this chapter in the interest of succinctness.
61
SCV
Loading data into PEAKS 4.2
PEAKS 4.2 can be used to process data from any MS/MS instrument, provided the
data is accessible, or can be converted to an accessible format. PEAKS handles data
files in the following formats:
SCV
PEAKS demo data
can be found in the
DATA subdirectory, located
in the PEAKS
directory.
PKL: The file format associated with Micromass instruments.
DTA: The file format associated with SEQUEST software
MGF: The file format associated with Mascot software.
ANZ – the zip compressed XML based file format associated with
PEAKS
XML format files using the mzXML schema
XML format files using the mzData schema
RAW files from Thermo Electron instruments
WIFF files from ABI QSTAR instruments
RAW files from Waters QTOF instruments
.BAF, .YEP and folders of .FID files from Bruker instruments
XML format files from Waters ProteinLynx software
DAT files created by BSI’s ABI converter software
Opening data files
In order to do any data processing we must first
load our spectrum data into PEAKS 4.2. To open a
data file, click the
icon on the toolbar in the
upper left corner of the PEAKS window or select
“Open” from the “File” menu.
S marks a section applicable to PEAKS Studio, C for PEAKS client and V for PEAKS
Viewer
Select a file. Click the Open button.
The data file we just opened appears in the Peptide Data Frame on the left. It is
represented by its file name. Each spectrum contained in the data file is represented by
its precursor ion information (m/z value followed by the charge of the precursor ion
that generated the spectrum).
SCV
Loading a directory full of DTA files
DTA spectrum data files can be opened by the same procedure as listed above.
However, as we know, some DTA files contain the data for only one spectrum. As
such, we may find it useful to import a whole directory (containing DTA MS/MS
spectrum data files for a whole MS run) at once and consider it as one MS run.
PEAKS 4.2 provides a tool for doing so.
Under the “File” menu, click “Load Directorry”. Now browse to the directory we wish
to load.
Do not select a file within the directory; rather select
the directory itself. Press the Open button.
After loading the spectra, we can choose to sort the
spectrum by the source filename or by the precursor
m/z value of spectrum. To do so, right click the
parent node on the Peptide Data and choose to sort.
The data file we just opened appears in the Peptide
Data Frame on the left. It is represented by the
folder name. Each spectrum contained in the data
file is represented by its precursor ion information
(m/z value followed by the charge of the precursor
63
ion that generated the spectrum) and file name.
SCV
Loading Thermo RAW data
PEAKS 4.2 can load RAW data from our Thermo Electron mass spectrometer;
provided that the XCalibur software is installed on the same computer as is PEAKS
4.2. To load Thermo RAW data, simply choose File → Open, and browse to the file.
SCV
Importing Applied Biosystems WIFF data
PEAKS 4.2 can load WIFF data from our Applied Biosystems QSTAR mass
spectrometer; provided that the Analyst QS software and the MSX plug-in are installed
on the same computer as is PEAKS 4.2. The MSX tool is produced and sold by
Infochromics Ltd., and is available (at cost) from Bioinformatics Solutions Inc. Please
contact a BSI sales representative to obtain a license. To load QSTAR WIFF data,
simply choose File → Import wiff raw data, and browse to the file.
SCV
Importing MassLynx RAW data
PEAKS 4.2 can import RAW data from our Waters/MicroMass QTOF instrument.
To do so, we choose “Import RAW data” from the File menu. As above, the file
browser appears. Choose the .RAW data, and click the Open button. PEAKS uses a
utility called wolf.exe (originally created as part of the Sashimi Project) to access
MassLynx libraries and convert the data. PEAKS ships with a version of wolf.exe
designed to work with MassLynx 4.0. If we need a different wolf, we can check:
www.bioinfor.com/products/peaks/support/watersmicromass.php
Additionally, we must make sure that the following MassLynx libraries are installed on
the same computer as PEAKS and wolf.exe:
Some versions of
MassLynx may
differ.
DACServer.dll
Genutil.dll
MetaGD32.dll
raw.dll
securityAccess.dll
securitySettings.dll
securitySignature.dll
They should be stored in the folder C:\MassLynx\ as part of the MassLynx software.
If they are not stored here, or MassLynx is installed on another computer, the
automatic loading will not work. If the automatic loading is not working for either
reason try this:
1. We should be able to find the listed files on our computer, or another
computer in our lab. If you can copy them, do so.
64
2. We can then create a folder called “C:\MassLynx\” on our computer, and
place the files we copied here. But we’re not finished, we must also register
these files with Windows.
3. We can find a file on our system called regsvr32.exe using the ‘Find’ or
‘Search’ tool in our windows start menu. It is probably in
“C:\WINDOWS\System32\”. If it’s not there, substitute the correct
location in step 4.
4. Open a command prompt or the Run tool from the start menu and type
the following:
C:\WINDOWS\System32\regsvr32 C:\MassLynx\DACServer.dll
All on one line, with one space in the middle as shown. Press the enter key.
If successful, windows will pop up a success message.
Please check the license
The libraries mentioned in this section are part of the MassLynx
software, distributed by Waters Corp. Please check the MassLynx license
agreement, or contact a Waters representative to make sure it is okay to
copy and use the libraries in this way.
SCV
Importing Data from the ABI 4700 or ABI 4800
BSI has created a converter to extract the data from an ABI-Oracle database. If we
require this separate, free tool, we must ask a BSI representative. Once installed, we can
start up the ABI 4700 Data Extractor from the Start menu.
System Requirements
This extractor can be installed on the same machine as ABI 4700 Explorer and the
Oracle database (we will call this machine the 4700 SERVER in the following
instructions) or another machine that has direct network access (no firewall, no proxy
required) to the 4700 SERVER. Windows 2000 or Windows XP is recommended for
use with this tool.
Configuration:
Before using the ABI 4700 Data Extractor, we should configure it. To do so, we can
choose “Settings” from the “File” menu. Configuration needs the following:
4700 SERVER Name or IP Address: input “localhost” if the Extractor is
running on the 4700 SERVER (this is the default value), otherwise enter the
IP address of the 4700 SERVER.
The socket used by the 4700 SERVER:
database listens to (the default is 1521).
65
this is the port that the Oracle
Username to access the Oracle database:
most likely we do not need to
change this (the default is “tsquared”).
Password to access the Oracle database:
mostly likely we do not need to
change this one either.
Data extraction procedure:
1. Load Spot Set List from the database: (Do it via menu File | Load
Spot Set List) The extractor will export the peak list of a spot set into a
PKL file.
2. Open a Spot Set: (menu File | Open Spot Set) Spot Set Chooser will
help the user to choose a spot set. After selecting a spot set, click 'OK'
to open it. The job run information of a spot set will be shown.
3. Select a job run: There is a radio button before each job run, only the
MS/MS job run can be selected for export, because we need the
precursor information. Select a job run and click 'Convert' to do the
extraction.
4. Choose a filename to save: After clicking the 'Convert' button, the user
needs to input a file name and the peak lists of the selected job run will
be exported.
SC
Refining data before analysis
Since mass spectrometry data often contains noise and redundant data, it makes sense
to purify the data before analysis. This will increase the quality of the results, while
saving time spent on database searching and/or de novo sequencing. MS/MS spectra
that are purely noise can be removed from the data:
peptide charge information can be verified and recovered
multiple low quality scans of the same peptide can be merged into one scan
with intense signal peaks
the MS/MS scans themselves can be centroided, filtered for noise, and
deconvoluted.
When PEAKS is connected to a PEAKS Online server, we’ll also save time by
uploading smaller, preprocessed data. Data refinement is done locally, before
uploading to the server.
To begin the refinement of data from a whole MS/MS run:
66
1. In the Peptide Data Frame, select the data file(s) containing the data that we
wish to refine.
2. Click the
Data Refine toolbar icon
Or
Select “Data Refine” from the “Tools” menu.
Or
Right click on the selected data file and select “Data Refine” from the popup
menu
The Data refinement options dialogue appears:
3. Choose the data refinement tools we wish to use by clicking the “yes” radio
button next to each one.
67
Instrument Type:
choose the type of spectrometer that produced the data to
be analyzed.
Merge Scans of the same peptide:
Correct precursor charges:
Remove low quality MS/MS scans: Scans of contaminants and electrical noise
in DDA mode, a mass spectrometer will
often produce several tandem ms (i.e. ms/ms) scans of the same peptide. To
increase the intensity of real signal peaks within these scans and to reduce the
size of the whole data set, it makes sense to merge ms/ms scans of the same
peptide together. To avoid improper merging (of ms/ms scans of different
peptides) we make sure that the measured parent ion masses of these peptides
are very close and that they have similar retention times in the LC column. The
units here are m/z values in Daltons. For retention time, we use whatever
units are recorded in the data file (usually minutes or seconds).
Since a mass spectrometer measures mass-tocharge ratios, we must know the charge on a peptide before we can determine
its mass. The standard method of finding the charge is to look at the spacing
of the isotope ladder in the survey scan. However many Ion-Trap instruments
don't have enough resolution for this. So PEAKS will look at the MS/MS data
to determine if it's charge 1+, 2+ or 3+. This tool needs to only be used on
ion trap data.
should not be included in analysis. Removing them from the data set will save
time, and reduce the risk of random matches to the database. PEAKS presents
an effective tool for removing these low quality ms/ms scans. This tool has
been designed for use specifically on ion trap data.
Deconvolution (de-isotoping), centroiding and
noise filtering within the MS/MS data. Data is always saved in the ANZ file along
with the PEAKS results. Preprocessing can save hard disk space or upload time. But make
sure to have the original data available in case we need to refer to it later.
Preprocess MS/MS scans:
A note on preserving data-results integrity
Protein ID and de novo sequencing results obtained for a given dataset
prior to use of this tool may become invalid, since some spectra are
removed/merged/corrected and the data-results relationship may be
broken. PEAKS 4.2 will warn us when this may occur and prompt us to
save a separate copy.
68
SCV
Manually Manipulating Data Files
SCV
Editing Precursor information
It is possible that the precursor information, as listed in the Peptide Data Frame, is
incorrect. If the charge listed is wrong or if the m/z listed is even slightly incorrect
(more than 0.1 Daltons, depending on the accuracy selected) it could really affect the
quality of the results. In this case it is imperative that we change the precursor
information. The change will only affect the .ANZ file we are working on.
To edit precursor information, select a spectrum by clicking on its name, then right
click the mouse while holding it in position over the name. A small menu will appear;
click on “Edit Precursor”.
In the dialogue that follows, type the new precursor information into the appropriate
textboxes. Click the “Apply” button when finished to apply the changes. Click the
“Cancel” button to exit, discarding changes.
The precursor information will be updated, reflected by a change in the name of the
spectrum in the Peptide Data Frame. A * will also appear in front of that name,
indicating that there is unsaved information pertaining to that spectrum.
SCV
Manually merging MS/MS scans of the same peptide
If we’ve done several MS/MS scans of the same peptide, we may want to reduce the
amount of data to process and at the same time, improve the data quality by merging
all of a peptide’s MS/MS scans together. Often, we choose to automatically merge
appropriate spectra from the whole data file using the Data Refine tool (see above).
But this can also be done manually.
To manually merge spectra after opening a data file:
1. Select those spectra we wish to merge together from the Peptide Data Tree
(left) using shift+click and ctrl+click.
69
2. Next, right click in the Peptide Data panel, and choose Merge Spectra from
the popup window that appears, OR click the
toolbar button.
‘Manual Merge Spectra’
3. A dialogue will appear, asking what should be the correct value for the
precursor mass and charge. After reviewing and/or correcting the value, press
“OK”. The spectra will be merged.
SCV
Cutting and Copying Spectrum Data
If we wish to move spectrum data from one data file to another we may do so by
copying and pasting it (see below for pasting instructions). Also, we may wish to make
a copy of the spectrum in the same data file in order to re-sequence an individual
spectrum using different preferences. Cutting spectrum data will remove it completely
until pasted. Copying spectrum data will duplicate the spectra when pasted. To
cut/copy spectrum data:
Changes made to
the original
spectrum after
duplication will not
affect the
duplicated
spectrum.
Select a spectrum by clicking on its name (select multiple spectra by holding
down the ‘control’ key and clicking on any number of spectrum) in the Peptide
Data Frame.
Right click on one of the selected spectra. A small pop-menu will appear.
Select “Cut” or “Copy”
or “Cut” button
Or click the “Copy” button
in the main toolbar.
Copied/Cut items will remain on the clipboard until replaced by another copied/cut
item. Warning: Unless pasted, a cut item will be lost, as subsequent cut/copied
items will displace it from the clipboard.
SCV
Pasting Spectrum Data
After having copied or cut spectrum data, we would like to paste it into another data
file, or the same data file. To paste spectrum data:
1.
Select the data file into which we wish to paste the spectrum (or spectra)
by clicking on its name in the Peptide Data Frame. We may only choose to
paste into one data file at a time.
2.
Right click on one of the selected spectra. A small popup menu will
appear. Select “Paste” from the popup menu.
Or click the “Paste” button
in the main toolbar.
The pasted spectra will appear in the Peptide Data, under the data file into which we
pasted.
70
Chapter
7
Analysing Data with PEAKS 4.2
A task based guide to processing our data with PEAKS 4.2.
T
his chapter will step us through the analytical techniques available to PEAKS
4.2 users. It is broken up into tasks that a typical user might perform. It
assumes we can identify parts of the Graphical User Interface and that we are
familiar with how PEAKS 4.2 can be configured. Such detail has occasionally
been omitted from this chapter in the interest of succinctness.
71
SC
Using PEAKS with modifications (PTM)
PEAKS 4.2 provides the most flexible handing of post-translational modifications of
any software built for de novo sequencing and protein ID. Users are free to create their
own modifications (see the Creating a New PTM section), and search for any
combination and any number of modifications. Modifications can be considered as
part of auto de novo sequencing or protein identification. The search is set up the same
way for both tools. The options screen for each tool has an area titled “PTM selected
for search”. Any modifications to be considered during the search will be shown here
(and labeled as ‘Fixed’ or ‘Var’). When we first run PEAKS, the box will be blank,
meaning no PTM are selected.
For PEAKS Client,
the PTM library is
stored on the
server. Ask the
administrator to
make changes.
To add modifications to this list, click the Add/Remove PTM button. The
Modification dialogue appears. The entire PTM library – i.e. the list of all <built in> and
user defined modifications that are available to PEAKS – is displayed in the list on the left.
We’ll choose the modifications we need from this list. To add a new modification to
the PTM library, click the ‘New PTM’ button. To edit a modification in the PTM
library, select it from the list on the left and press the ‘Edit PTM’ button. To remove a
modification from the PTM library, select it from the list on the left and press the
‘Remove PTM’ library.
If you remove/edit a PTM, it will be removed or changed from/in any
saved parameter set that refers to it.
The lists on the right show what PTM will be enabled for the search. Use the ‘Select as
Fixed=>’, ‘Select as Variable=>’ and ‘<=Unselect’ buttons to move them in and out
of these lists. Press the ‘OK’ button when finished and the changes we made will be
reflected on the protein ID options dialogue.
72
Generally, the
more variable PTM
we turn on, the
more ambiguous
will be the results.
SC
Remember, when doing auto de novo sequencing or PEAKS Protein ID on a
complex mixture, we will get best results if we choose the correct fixed PTM and a
few variable PTM. When using PEAKS Protein ID to characterize a protein, it is
best to search against a small database that contains only a few proteins and turn
on all modifications. Furthermore, to limit spurious hits, we can assume that it is
less likely that a tryptic length peptide will not be modified more than a few times
and as such, limit the number of variable modifications that can occur on each
peptide.
Auto de novo Sequencing
To begin auto de novo sequence derivation:
1. In the Peptide Data Frame, select the data file(s) containing the spectra that we
wish to sequence by Auto de novo. We can also select an individual spectrum,
or a few spectra within a data file; auto de novo will proceed on only the spectra
selected.
2. Click the
Automatic de novo toolbar icon
Or
Select “Auto de novo” from the “Tools” menu.
73
Or
Right click on the selected spectra or data files and select “Auto de novo” from
the popup menu.
The Auto de novo Parameters dialogue window will appear:
We should begin
by using the
suggested error
values, then try
some slightly
higher or lower
ones to find the
best result.
3. If we wish to change any of these parameters, we do so now.
Instrument Type:
Parent mass error tolerance:
Choose the type of spectrometer that produced the data to
be analyzed. If we are using a hybrid instrument, choose a setting that matches
our fragment ion mass analyser. For example, if we measure the parent ion in
an FT, and the fragment ions in an ion trap, choose the ion trap instrument
setting. Fragmentation type can also be chosen from this drop down.
Determine how much random and systematic
experimental error on the parent/precursor ion PEAKS will allow for in its
analysis. Select a tolerance from the dropdown list or type in a value. New
74
PEAKS users should try setting this a little higher than past experience may
suggest.
Fragment mass error tolerance:
Tell PEAKS what kind of enzyme was used to digest the sample.
Choose from a dropdown list of enzymes, or if our enzyme (or combination
of enzymes) is not in the list, click the "Edit Enzymes" button.
Report top:
Max missed cleavages:
PTM selected for search:
To reduce uncertainty, we can limit PEAKS'
de novo sequencing 'vocabulary', by restricting the number of variable PTM
we can find on a peptide. Specify a number by typing it into the box. To lift
such restrictions, type a very large number (longer than the length of the
peptide).
Saving/Loading Parameters:
Preprocess before auto de novo:
Determine how much random and
systematic experimental error on the fragment/daughter ion PEAKS will allow
for in its analysis. Select a tolerance from the dropdown or type in a value.
Again, new PEAKS users should try setting this a little higher than past
experience may suggest.
Enzyme:
Set how many peptide sequences PEAKS will report from its de
novo sequencing analysis.
Determine the most missed cleavages to allow,
internal to the peptide, in a de novo sequence. For instance, if we set this to 2,
and Trypsin is the enzyme, then PEAKS will return de novo sequences with
up to 2 R's or K's internally.
This list tells PEAKS what kind of posttranslational modifications to include in its analysis. Each is marked Fixed or
Variable. To edit this list, click the "Add/Remove PTM" button.
Max variable PTM per peptide:
After setting up parameters, we can save them
for future use. Click the "Save Parameters" button, and choose a name for
future reference when prompted. Don't worry, we can't accidently overwrite
the defaults. Any parameters we save will be available in the drop-down list at
the top of the window. To see what's inside, select one and the parameters
boxes will be populated.
PEAKS Studio has its own built-in
preprocessor for removing noise, centroiding and peak charge recognition
from MS/MS data. Check this box to turn preprocessing on.
75
Notes on pre-processing
BSI highly recommends using PEAKS to preprocess all data, as opposed
to using instrument vendor software, if the data is to be used by PEAKS.
PEAKS preprocessor should not be used on data that has already been
pre-processed as this will have adverse effects on the results (unless it is
ion-trap data).
4. Press the “OK” button to commence Auto de novo sequencing.
Once a job is submitted to PEAKS 4.2, it is added to the Task Queue for
processing. After processing, the job is removed from the task queue list and
the dark green icons beside the spectra (in the Peptide Data Frame) change
to light green and/or an asterisk (*) appears.
76
SCV
Viewing Auto de novo Results
After performing auto de novo on a spectrum, we may wish to see what the algorithm
determined the peptide sequence to be and review the results for ourselves. To do so,
we click on the spectrum of interest in the Peptide Data Frame. This brings up the
Main Processing Window for that spectrum.
The most likely peptide sequence candidate, as determined by auto de novo, will be
automatically selected. This is found in the Peptide Candidates Frame as the top listed
candidate under ‘PEAKS Auto de novo’. In this example, the highlighted sequence is
VDVEK. Any modifications that have been found will be shown abbreviated and in
sequence before the amino acid residue they are associated with. If the PTM was
defined/created by another PEAKS user on another system, the PTM would still be shown and it can
be imported into the local PEAKS configuration as desired.
Confidence scores
are probability
based, on a scale
of 0 to 100%
Right next to the proposed sequence, the auto de novo confidence score is shown.
Positional confidences (that is, confidence that the correct residue in each position has
been identified) are readily available by color coding. Red represents a very high
confidence (greater than 90%), purple represents a high confidence (80 to 90%) blue
represents a medium confidence (60 to 80%) and black represents a low confidence
(less than 60%). For more detailed positional confidence, we can place our mouse over
the sequence of interest. A Position Confidence Table will appear, showing the
confidence that each tag/subsequence is correct.
In the Ion Table frame, select a cell from the Ion Table – each cell represents an ion.
This will highlight its position on an error plot (scroll the Ion Table frame down if the
error plot is not visible). A point close to the centerline indicates a more confident
77
result. We can also notice that the peak corresponding to the Ion we selected is
highlighted on the Spectrum View. Select a whole column to highlight all the points for
that type of ion. The types of ions displayed in the ion table can be configured, choose
Configuration Edit Ion Table from the Edit menu. FTMS users might find this
particularly useful when sequencing data acquired using ECD.
Zoom in far
enough and we
may resolve the
isotopic ladder
(depending on our
instrument/data).
By looking at the Spectrum View Frame, we can see the strength of the MS/MS peaks
that PEAKS 4.2 has set as ions. The view also displays the mass of the ions at that
peak and the type of ion. Click on a peak to mark it and display its information at the
top left corner of the Spectrum View Frame.
Zoom in by clicking and dragging horizontally on an area of the Spectrum View. The
area over which we dragged will now take up the whole spectrum view. To un-zoom,
press the
undo zoom icon or press the 1:1 icon to return to the full spectrum
view.
We may also zoom in on the spectrum using the Spectrum Alignment Frame. Again,
click and drag horizontally on an area of the Spectrum View. The area over which we
dragged will now take up the whole spectrum view. The blue bar beneath the
Spectrum Alignment view shows where we are zoomed in. The white portion of the
bar represents the area that we are zoomed in on.
We can toggle whether or not we’d like to see the positions of the y-ions and b-ions
(and the proposed residues in sequence between them) on the alignment view by
(yellow and red) and b-ion alignment
(yellow and
pressing the y-ion alignment
purple) icons in the main processing window toolbar.
To view another peptide candidate, as determined by auto de novo, click on another
peptide in the Peptide Candidates Frame and under ‘PEAKS Auto de novo’. The
information in the Ion Table will change, as will the tags on the spectrum, to reflect the
selected peptide candidate’s sequence.
SCV
Editing sequencing results (preparation)
We cannot change the results provided by PEAKS auto do novo or PEAKS database
search. However, we can make a copy of any sequence and edit it using manual de novo
techniques. To copy a sequence for editing:
1. Select a peptide sequence candidate from within the Peptide Candidates
Frame. We can only select one peptide sequence candidate at a time.
2. Right click the mouse button while holding the mouse over that sequence.
A pop-up menu will appear.
78
3. We can select the pop-up menu item “Copy for manual de novo”. In this
case, the sequence will be automatically placed under the ‘Manual de novo’
heading. A ‘Manual de novo’ heading will be created if there wasn’t one
there already.
4. Now we select our newly copied sequence, under the ‘Manual de novo’
heading, to display this sequence in the Ion Table Frame, Spectrum View
Frame, and Spectrum Alignment Frame.
Now we are ready to edit the sequence, using manual de novo techniques.
79
SCV
Manual De Novo Sequencing
We can use manual de novo sequencing to fine tune the results of an auto de novo analysis
or to perform our own sequencing analysis from scratch. PEAKS 4.2 provides a set of
tools to help us sequence a peptide, using graphic cues from the spectrum.
SCV
Creating a fresh spectrum for sequencing
We cannot change the results provided by PEAKS auto do novo or PEAKS database
search. Thus, to begin manual de novo sequencing, we must either copy a sequenced
peptide (see above section: Preparing to edit sequence results) or create a new peptide
candidate for sequencing.
To create a new peptide candidate for sequencing:
1. Right click on the ‘Peptide Candidates’ heading, the ‘Manual de novo’, or any
‘user defined type’ heading. This will bring up a pop-up menu.
2. Select “New candidate for manual de novo” from the pop-up menu
A new candidate will be created under the ‘Manual de novo’ heading, or under the ‘user
defined type’ heading if we selected a user defined type. The new candidate will not
have been sequenced, so it will be represented by the mass of the peptide less the mass
of water (e.g. [945.15] ).
SCV
Manual de novo Operations
All operations occur in the Spectrum View Frame of the Main Processing Window.
When the mouse is placed in the Spectrum View Frame, a blue (by default) bar follows
the movement of the mouse. This is the Position Bar and it is used as a cursor for all
manual de novo operations. The cursor’s position on the m/z scale is enumerated on the
top of the Position Bar.
Selecting a peak
To select a peak, click on it. An orange (by default) bar, called Freeze Bar, indicates the
selected peak.
Alternatively an ion peak can be selected by clicking on its corresponding cell in the
Ion Table.
Measuring distance along the m/z scale
Once a peak is selected with the Freeze Bar, moving the mouse left or right will display
the Position Bar along with a value that represents the m/z difference (as an absolute
value) between the selected peak (orange) and the Position Bar (blue). In the example
below, the distance between the selected peak and the position bar is 51.02 Daltons.
S marks a section applicable to PEAKS Studio, C for PEAKS client and V for PEAKS
Viewer
Measure the m/z difference between two peaks
Select a peak (orange line by default) with the Freeze Bar and move the mouse to the
left or right. Hold the Position Bar above another peak. The number above the Position
Bar is the difference between the two peaks.
Deselect a peak
Double click anywhere in the Spectrum View Frame
Zoom in on part of the spectrum
In the Spectrum View Frame or the Spectrum Alignment Frame, click and drag the
mouse horizontally. The selected area will be shown in the Spectrum View Frame.
Add (remove) ions to (from) a peak
Select a peak, then right click the mouse anywhere in the Spectrum View Frame. Select
“Set Y Ion” from the pop-up menu to designate the peak as a y ion, “Set B Ion” from
the pop-up menu to designate the peak as a b ion, Select “Ion Edit” from the pop-up
menu to view the Ion Editor dialog box and designate the peak as another ion.
81
The Ion Editor dialogue allows us to add or remove ion designations to/from a peak.
Select an ion from the ion choice list and press the “Add” button to add it to the
selected ion list. Remove an ion from the selected ion list by selecting it and pressing
the “Remove” button. We can type any comments we wish to make about the
ion/peak, then press the “Apply” button to apply the changes to the selected peak.
See PEAKS
Environment
Preference
Configuration to
find out how to
change the
sensitivity of the
residue estimate.
Two short-cut keys may also be used to label a peak. Select a peak, then hit the 'y' key
to add a y-ion and or the 'b' to add a b-ion to the peak on your keyboard.
After setting an ion, both the alignment view and the peptide sequence candidate name
(as displayed in the peptide candidate frame) will change to reflect the mass remaining
to be sequenced on either side of the ion. After setting two ions, PEAKS 4.2 will
estimate the residue found between them (if a residue corresponds closely to the mass
difference). The peptide sequence candidate name (as displayed in the peptide
candidate frame) will change to show the residue and the mass remaining to be
sequenced on either side of the residue.
Using sequence tags
Searching the C/N terminal by Y/B: right click anywhere in the Spectrum View
Frame to trigger the popup menu. From the menu, select the terminal search of
interest. PEAKS will select the appropriate terminal tags and show them in the Ion
Table Frame. We may test the suitability of a tag by clicking on its radio button; the tag
will be shown, in position, on the Spectrum View. We may insert one or more tags by
clicking on their checkboxes, then clicking the “Apply” button. Press the “Cancel”
button at any time to exit the search discarding changes.
Two short cut keys
can be used: 'F6'
for searching the
left side and 'F7'
for searching the
right side.
Search a sequence tag: select a peak with a defined ion (i.e. an ion that has been
labeled with a peptide). Right click to trigger the popup menu, then select “Search
Right” or “Search Left” to search peptide tags either to the right or left of the selected
peak. PEAKS will select the appropriate terminal tags and show them in the Ion Table
Frame. We may test the suitability of a tag by clicking on its radio button; the tag will
be shown in position on the Spectrum View. We may insert one or more tags by
clicking on their checkboxes, then clicking the “Apply” button. Press the “Cancel”
button at any time to exit the search discarding changes.
Undoing an edit
If we have made an error in our sequencing it is possible to undo the change. With the
Peptide candidate still selected in the Peptide Candidates Frame, click the previous
peptide button to return to the previous peptide sequence. We can click this button
multiple times to return to successively earlier stages in our edit.
Redoing an edit
If we have undone one too many changes, we can redo that change by clicking the
next peptide button. We can click this button multiple times to proceed to successively
later stages in our edit.
82
SCV
Suggesting a sequence to see how it fits the data
If the data is ambiguous, PEAKS 4.2 may not have displayed a particular candidate
that we wish to evaluate, after auto de novo, or protein ID. We may enter this
sequence and have PEAKS 4.2 find if there is any evidence for it in the data.
For instance, PEAKS may give the sequence RMYNVHGC(phosphorylationS)K for a
particular spectrum, and we may wish to see if there’s any evidence for the
phosphorylation being on the Tyrosine. As such, we may type in our own version of
the sequence and have PEAKS find ions that might support our hypothesis.
To do so, open the spectra in the main processing window, and right click on “Peptide
Candidates” (in the Peptide Candidates Frame). Then, from the pop-up menu that
appears, choose “New Candidate for Manual De Novo”.
A new node will appear with the heading “Manual De Novo” and beneath it will be
the mass of the residues yet to be sequenced (in square brackets). Right-click on this
heading. In the pop-up menu that appears, choose “New Candidate with user input
sequence”, and the Sequence Input dialogue box will appear.
83
We can now enter our proposed sequence. The total mass of the residues,
modifications, and un-sequenced masses should equal the total mass of the peptide
(minus water). We might find the mass calculator tool (Tools menu), useful in this
regard.
Enter sequences in the format:
Short forms for the
modifications may
also be used.
MPELAYLK
[228.09]ELAYLK
DE[226.168]AYLK
EDLLA(phosphorylationY)LK
DE[226.168]A(phosphorylationY)LK
Then press the OK button. The sequence we just entered will appear under the
“Manual De Novo” heading and when selected, the ions that PEAKS has found to
match the proposed sequence will appear on the spectrum, spectrum alignment view,
and ion table.
84
SC
Protein Identification
The PEAKS protein identification method is unique – an improvement on and the
ideal compliment to existing tools. The unique approach is a combination of sequence
tag searching and fragment ion mass matching.
PEAKS also introduces an amalgamative approach to protein identification called
inChorus. With inChorus protein identification technology, we can use PEAKS
together with several other protein identification software programs. This will deliver
more protein coverage and more confidence in results than any one method on its
own.
The following two sections deal with usage of PEAKS protein identification on its
own and usage of inChorus protein identification.
SCV
PEAKS Protein Identification
The PEAKS Protein ID search engine takes a hybrid approach that uses sequence tag
information to filter the protein or EST database before fragment ion fingerprinting.
Thus to get useful protein identification results, we must first perform de novo
sequencing on the spectrum data.
If we already have sequence information for this data, we may use this existing
sequence information (manual or auto de novo sequences) to filter the database. If we do
not have existing sequence information, or if we wish to refine our database search by
providing brand new sequence information, we can ask PEAKS to perform auto de
novo before searching the database. Brand new results will not overwrite any existing
sequence data that we have.
1. In the Peptide Data Frame, we select the data file(s) that we wish PEAKS to
use to identify our protein(s). This can be done by clicking on a data file’s
name in, the peptide data frame.
2. Click the "Protein identification" toolbar icon
.
Or
Select “PEAKS Protein ID” from the tools menu.
The Protein Identification Parameters dialogue window will appear
3. If we wish to change any of the protein identification search parameters, we
do so now.
S marks a section applicable to PEAKS Studio, C for PEAKS client and V for PEAKS
Viewer
Instrument Type: choose the type of spectrometer that produced the data to
be analyzed. If we are using a hybrid instrument, choose a setting that matches
our fragment ion mass analyser. For example, if we measure the parent ion in
an FT, and the fragment ions in an ion trap, choose the ion trap instrument
setting. Fragmentation type can also be chosen from this drop down.
Parent mass error tolerance:
Fragment mass error tolerance:
Enzyme: Tell PEAKS what kind of enzyme was used to digest the sample.
Choose from a dropdown list of enzymes, or if our enzyme (or combination
of enzymes) is not in the list, click the "Edit Enzymes" button.
Report up to:
determine the most missed cleavages to allow,
internal to the peptide, in a de novo sequence. For instance, if we set this to 2,
and Trypsin is the enzyme, then PEAKS will return de novo sequences with
up to 2 R's or K's internally.
PTM selected for search: this list tells PEAKS what kind of post-translational
determine how much random and systematic
experimental error on the parent/precursor ion PEAKS will allow for in its
analysis. Select a tolerance from the dropdown list, or type in a value. New
PEAKS users should try setting this a little higher than past experience would
suggest.
determine how much random and
systematic experimental error on the fragment/daughter ion PEAKS will allow
for in its analysis. Select a tolerance from the dropdown or type in a value.
Again, new PEAKS users should try setting this a little higher than past
experience would suggest.
set how many peptide sequences PEAKS will report from its de
novo sequencing analysis.
Max missed cleavages:
modifications to include in it's analysis. Each is marked Fixed or Variable. To
edit this list, click the "Add/Remove PTM" button.
To reduce uncertainty, we can limit PEAKS'
de novo sequencing 'vocabulary', by restricting the number of variable PTM
we can find on a peptide. Specify a number by typing it into the box. To lift
such restrictions, type a very large number (longer than the length of the
peptide).
Max variable PTM per peptide:
Best practices for setting modifications (PTM)
The developers have discovered that database searching often returns
better results if the auto de novo analysis is run with no variable PTM
86
(perhaps one or two if necessary), but with the correct enzyme and fixed
PTM. Modifications should be then turned on for the database search
function. m/z tolerance can also be adjusted separately for each phase to
allow us to tweak the results.
Database to search:
Taxonomy selection: This list displays the taxa we've chosen for our search. If
Select from this dropdown list, one of the FASTA
databases that we’ve set up in PEAKS. If the database we'd like to search is
not in this list, click the "Load new database" button.
the database selected has taxon information available, we can click the aptly
labeled "Add/Remove Taxa" button. Otherwise, the whole database will be
searched. The selections correspond to established hierarchy -- i.e. selecting
'Mamalia' will search all of 'horse, cow, rat, mouse, human, etc.'
Paste FASTA sequences:
PEAKS Studio has its own built-in
preprocessor for removing noise, centroiding and peak charge recognition
from MS/MS data. Check this box to turn preprocessing on.
If we already know the sequence of the protein(s)
we are studying, we can paste it here (must be FASTA format) and run a
search against it. Alternatively, if we search the same sequence regularly, it is
recommended to simply create a small text file and configure it as a database
for PEAKS.
Preprocess before auto de novo:
Notes on pre-processing
BSI highly recommends using PEAKS to preprocess all data, as opposed
to using instrument vendor software, if the data is to be used by PEAKS.
The PEAKS preprocessor should not be used on data that has already
been de-convolved by instrument software as this will have adverse
effects on the results (unless it is ion-trap data).
If we choose to do pre-processing ‘on the fly’ during protein ID (as
opposed to using the Data Refine tool beforehand) PEAKS preserves
the original data, and does not save the results of its preprocessing.
de novo: We must have some de novo sequences before
database searching since PEAKS sequence tags to help in database searching.
As such the option of doing de novo prior to protein ID is presented here. In
most cases, the same values for instrument, error, enzyme and PTM can be
used in de novo and in protein ID, but we have the option of using one of our
Advanced Options -
87
saved de novo parameter sets for the de novo portion. Select one from the drop
down list.
After setting up parameters, we can save them
for future use. Click the "Save Parameters" button, and choose a name for
future reference when prompted. Don't worry, we can't accidently overwrite
the defaults. Any parameters we save will be available in the drop-down list at
the top of the window. To see what's inside, just select one, and the parameters
boxes will be populated. Note: the Advanced Options selections will not be
saved.
Saving/Loading Parameters:
4. Press the “OK” button to commence Auto de novo (if we have so chosen)
and subsequent protein identification.
If we have chosen to perform auto de novo prior to our database search, the Auto De
novo process will appear first in the task queue. Once this is finished the database search
will begin. If PEAKS finds protein candidates after searching the database, a Protein
Identification Results window will appear:
S
inChorus Protein Identification
inChorus Protein Identification will call upon several search engines for protein
identification. Once we load our data into PEAKS, we can invoke (start searches
running on) several search engines at once. When all the results are returned, PEAKS
4.2 will compare the answers and summarize everything in one simple report.
1. In the Peptide Data Frame, we select the data file(s) that we wish PEAKS to
use to identify our protein(s). This can be done by clicking on a data file’s
name in the peptide data frame.
2. Click the "Protein Identification" toolbar icon
.
Or
Select “inChorus Protein ID” from the tools menu
The inChorus database search launch window will appear:
88
3. First select each of the protein identification tools we would like to use by
putting a checkmark in their respective checkboxes. Search parameters for
each program can be set by clicking the corresponding Options icon.
PEAKS database search engine is mandatory.
4. Then set search parameters for each search engine. Option screens for
each of the programs available to inChorus are designed to work in the
same way as options screens for the original programs. For help in setting
search parameters for each program, please refer to that program’s user
manual. In the case of PEAKS database search, please refer to the above
section.
SC
Creating a high-throughput workflow
In some situations, we may have many data sets that we wish to process all at once,
and in the same way. PEAKS 4.2 allows us to do this kind of work, and with minimal
effort on our part. By setting up a workflow, we can start a batch process of several
data files and not worry about it until it is finished.
It is important to note that all the files we load will be processed in exactly the same way, using exactly
the same parameters. If we want to do some differently than others, we must set up another workflow.
89
Step1: Load Files – Click the browse button to
open a file chooser. From the chooser, select
several files by shift+click or ctrl+click, and
pressing the “OK” button. Load more files by
pressing browse again or remove them from the
list by right clicking on them.
Step2: Data Refine – Choose how to filter and
correct data for maximum utility.
Step3: Auto de novo – Choose whether or not to
do auto de novo sequencing. Note that PEAKS
database search requires some de novo
sequencing results.
Step4: inChorus Database Search – Choose
which protein identification programs to run the
data. PEAKS database search is required.
Step5: Save Results – Saved automatically into
an .ANZ file with the same name as the data
file. All files will be placed in one folder. Typing
in the textboxes or clicking each file’s button
changes the name and/or save location. If it’s a
large run, we should “close each file after
saving”.
SCV
Selecting unmatched de novo results
When working with unknown organisms, abundant but uninteresting proteins (like
keratin) can get in the way. We may find it more convenient to eliminate them from
the analysis. To do so, we must first identify which peptides belong to those proteins.
To do so, run PEAKS 4.2’s protein identification tool. The proteins identified in the
sample will be shown in the Protein ID Report.
Click on the Filter tab and make sure that Option 1 (de novo view shows peptides that
could not be explained …) is selected. Then, if desired, add some filtering criteria, then
press the Apply Filters button.
Click on the De Novo View tab. This now displays de novo sequences for spectra that
could not be explained by the identified proteins (as listed in Protein View). Sort this
list, then click and drag to select some de novo sequences…
90
Click
and
drag
… they appear highlighted in the peptide data tree on the left. We may then chose run
auto de novo, or protein id on these spectra, or on everything but these spectra.
SC
Running protein identification on select spectra
When searching our dataset against a particular database, PEAKS may not have found
a hit for certain spectra. If these are good data, we may wish to try searching them
against a more general database. Before we do so, we must create a new data set with
these “good spectra that did not match”. This is essential so that we can organize our
data well, and because PEAKS will only run Protein ID on all the spectra in a data
node. To create a new data node:
1. Make a new data node by
2. Select the relevant spectra
right clicking on the peptide data using shift+click and ctrl+click.
node. The new node appears as Then press the cut button.
“Data1”.
After pasting, we
must save Data1
to continue
91
3. Click the new node and press
the paste button. Pressing the +
next to Data1 will expand it
and reveal the pasted spectra.
Now we’ve essentially removed the already matched peptides from our dataset. We can
now run protein identification on Data1 or on the remaining spectra in our original
dataset. We can save that dataset in a new file or any of the other functions that apply
to regular nodes. Make sure the new node is selected before running protein ID (or any
other function) on it.
SCV
Using the Mass Calculator
The Mass Calculator is a simple
tool to help us determine the
molecular weight of a peptide. To
access the Mass Calculator, open
the “Tools” menu and click
“Mass Calculator”. The Mass
Calculator will appear.
We can also load the mass
calculator outside of PEAKS. To
access the mass calculator without
having to load PEAKS, click on
the Mass Calculator’s icon in the start menu. It will appear in the same program group
as PEAKS.
When using the
mass calculator,
remember to start
with water.
We can click any
of these buttons
multiple times to
repeatedly add
that mass.
Amino acids are represented by their single letter symbols. Clicking on an
amino acid’s button will add it to the ‘sequence’ above, and add its mass to the
mass of the peptide. Note that the peptide’s monoisotopic and average masses
are both computed.
92
Add a proton by clicking the “Proton” button. It will be represented by an
<H+> in the ‘peptide’ above.
To compute the mass of the peptide as if it had been modified, select a PTM
from the list, and press the “PTM” button to apply them to the peptide.
If the PTM we wish to add does not appear in the list, we may wish to enter
it’s mass manually. To add a mass numerically, click the “Num” button and
enter a numeric value in the dialogue box that appears. Press the “OK” button
on the dialogue and the mass will be added to the sequence.
To remove a mass that we’ve just added to the peptide, press “Undo”.
93
Chapter
8
Working with Results
Viewing, Post-Analysis, Exporting and Saving of results.
R
esults are what count. So the PEAKS 4.2 developers have made sure to
present them simply, effectively and allow you to get them out of PEAKS
easily. This chapter covers how to interpret the results, how to get the most
out of them with minimal effort, how to present them to others, and how to
save data and results together for future reference.
This chapter assumes that the user is familiar with all preceeding chapters.
94
SCV
The walkthrough
in Chapter 3 gives
a good summary of
this topic.
Viewing Protein identification results
To view Protein Identification results for a data file, we must have performed PEAKS
protein identification or inChorus protein identification on that data file. The result
from each protein identification search is represented by the time stamp and database
searched (found just under a data file’s “Protein ID Result”). Click on one to display
the results report. We can view results by peptide or by protein and check on the
search parameters we used to generate these results. We can manipulate the contents
of this multi-part report by filtering out what we don’t want to keep. Finally we can
export the report and sub reports in a number of ways.
that we used when generating this report are preserved for future
reference and are available by clicking on the search parameters tab.
Search parameters
is available by clicking on the Peptide View tab. In tabular format, it
displays relevant information about each peptide found. Since two peptides may match
to one MS/MS spectrum, they are visually grouped together (using colour) by the
MS/MS scan.
Peptide View
When we first load the report, it is sorted by MS/MS index number. This is analogous
to the scan number or DTA file name (unless spectra have been merged). In the
example above, there was one match returned for MS/MS spectrum #1. For spectrum
#2 there were two; LDAINENK and IDALNENK. For spectrum #3, there were
also two, and so on. Each peptide is given a score and the protein it matches is
displayed for reference under “Accession No.” If the report was generated after
inChorus protein ID, each peptide that had a search program agree (identify the
peptide) is given a checkmark under its column.
The columns themselves are customizeable. Right click anywhere in the report and
choose Toggle Column from the pop-up menu. The sub-menu that appears shows a
checkmark in each of the columns that are currently showing. Click any one of them to
show or hide a column. These settings will apply to all our reports.
The peptide view list is sort-able. Click on a column header to sort the list using that
column’s values. For example, sort by score. Clicking again on the same column header
will toggle ascending/descending sort. Use ctrl+click to set a second sort – one can
sort by Accession, then by score in this way. When sorting, the grouping by MS/MS scan
number will be retained except when sorting by Accession No.
95
Scores associated
with each peptide
represent the
quality of the
match and the
number of
programs in
agreement on the
peptide.
Clicking on this report will highlight the spectrum in the Peptide Data tree on the left.
Select multiple spectra by clicking and dragging, using shift+click or ctrl+click. In this
way, the highest scoring peptides may be selected and isolated for further analysis.
is accessed by clicking on the Protein View tab. It collects all the peptide
identifications together, summarizes which proteins were present in the sample, and
groups homologous proteins together. The same information is displayed in the
Peptide View as in this Protein View; however, the results are organized to best enable
us to evaluate at the protein level.
Protein Vew
96
The top section of this view (shown above) behaves like an index, listing each protein
found in the sample. Very similar proteins, containing the same set or a subset of the
matched peptides, are grouped together. To see the full list of proteins within each
grouping click the ‘+’ sign. In the example above, the Bovine Serum Albumin node has
been expanded to reveal several similar proteins. Clicking in the same place (now a ‘—’
sign) will collapse the list.
This view is helpful when building a summary that can be sent to a
customer/collaborator. Simply right click to export to a MS Excel file. We can export
interesting parts of the report or a whole summary. Mark proteins of interest by
clicking their checkboxes and export protein and peptide information for those.
Or highlight a homologue group and export proteins and peptides in that
group.
Or just export the whole report.
The columns themselves are customizeable. Right click anywhere in the report and
choose Toggle Column from the pop-up menu. The sub-menu that appears shows a
checkmark in each of the columns that are currently showing. Click any one of them to
show or hide a column. These settings will apply to all our reports.
Whenever we click on a protein, the Matched Peptides panel (bottom) changes to
display the spectra (and peptides) that were found to be supporting evidence for that
protein. The columns in this list are the same as the ones we choose for ‘Peptide View’.
It may be necessary to scroll this panel down to see the complete list. Clicking a
peptide in this list brings up the Main Processing Window for the corresponding
spectrum, and displays the ions that were found in support of this peptide (shown
below).
97
Scrolling down the Matched Peptides panel reveals the complete sequence of the
highlighted protein with the matched peptides highlighted in red. The strength of the
red colour is a visual indication of the confidence in that portion of the protein. Where
an EST database was used, the translated sequence is shown (with all six reading
frames concatenated).
usually shows de novo sequences for spectra that could not be
explained by matching to the identified proteins (as listed in Protein View), but the
exact behaviour is customizable. See below for a discussion of filters and how they
relate to the De Novo View. The list of peptides in the De Novo View behaves quite
like the list of peptides in Peptide View. Differences are as follows:
De Novo View
Note that since PEAKS 4.2 uses de novo sequences to help out in the
database search, it is sometimes useful to see which de novo sequences were
use to help in the search. Each sequence that is used in this way has a
checkmark in it’s PID column.
The parameters used to generate a de novo sequence may be slightly different
from the database search parameters. As such, PEAKS 4.2 records how each
de novo sequence was generated – this information is in the [Source program]
column.
Positional confidence information is available in de novo sequencing results.
Colour codes show the strength of confidence in an individual amino acid.
The colour codes are the same as those used in the main processing window
98
(red is the best, then purple, then blue, then black). Positional confidence can
also be seen by holding the mouse over a sequence.
are accessed by clicking on the ‘Filter Pane’ tab. These allow us to
manipulate the contents of the whole multi-part report. For instance, one may choose
to discard any protein hit that was not supported by at least two high scoring peptides.
The filters are very flexible, allowing you to create filters on any of the fields (score,
mass, search engine, etc) and any number of fields. The filters are also cascading such
that removing a protein from the results removes all peptides associated with only that
protein and vise verse. But all this can be a bit complicated, so please read on to the
section “Post analysis of results – preparing for publication”.
Result filters
SCV
Comparing proteins – multiple sequence alignment
After having identified some proteins, it may be useful to see how their sequences
compare. This is particularly useful when trying to identify specific isoforms of proteins
or antibodies. To display a multiple sequence alignment between two proteins, click on
the time and date stamp underneath a filename in the peptide data tree (left). This
brings up a multi-part protein ID report. Click on the Protein View tab to see a list of
identified proteins. Mark a few proteins by clicking on their checkboxes in the
‘Marked’ column. Then, in the bottom panel of this view, click the MSA tab. It will be
blank to start with, but click one of the two buttons on this panel to:
generate the MSA and display in the default web browser
generate the MSA and display it on the MSA panel.
99
SCV
Filtering results
PEAKS 4.2 provides us with an exhaustive list of all proteins and peptides that can be
found in the sample. But since everyone has their own criteria of what information is
required in the report and what is an acceptable result, a good hit, we must have a way
of filtering out the less critical information to leave us with the essentials.
In order to manipulate results, we must, of course, have done some protein
identification using PEAKS Protein ID or inChorus searching. Click on the time and
date stamp associated with this result under its file name in the peptide data panel on
the left. Once the report loads, click on the “Filter Pane” tab to bring up the filtering
options.
Choose a filter from the ‘Possible Filters’ list on the left by clicking on it. Options for
this filter will appear below, in the [Edit filter:] frame. Once we’ve set these options, we
press ‘Add filter’ to bring it to the list of ‘Selected Filters’. If we’d like to add another
filter, we can repeat the process, continuing to add as many filters as necessary. In this
way it is also possible to have two filters on the same property; we can set a range of
protein mass, for instance, by applying one filter on the upper bound of the mass and
100
adding another filter to be the lower bound of the mass. We can also have more
complex filters that involve multiple properties. The example above shows filters that
allow only proteins with more than one high scoring (greater than 60% score) peptide,
a standard requirement for publication.
Filters are grouped into three basic types to reflect what they act on: De Novo filters
act to remove proposed de novo sequences, Peptide Filters act to remove peptides
found in the database from the report and Protein filters act to remove proteins from
the report.
The filters cascade through each view in the multi-part report. For instance, filtering
out a protein (by mass perhaps) will remove it from the Protein View and remove all
peptides associated with that protein from the Peptide View list. The manner in which
the De Novo View is linked can be specified by the user (illustrated on the next page).
Filter sets can be saved and re-used between sessions, but remember to hit Apply
Filters to use them.
Once all the filters we need are set up and showing in the Selected Filters list, we must
press the Apply Filters button to use them on our results. For larger reports this can
take a few seconds, during which time the tabs of the multi-part report will be greyed
out. After completion, we can click on any of the tabs to see how the results have been
affected.
101
SCV
How filters act on de novo sequences
PEAKS 4.2 automatically relates de novo sequencing results to protein ID results. This
makes it easy to see which de novo sequences correspond to known contaminants and
which are truly new peptides. The relationship is always drawn back to the data, not
necessarily the sequence, which helps highlight important sequence variations. PEAKS
4.2 users can set what is displayed on the list of de novo sequences, according to the
following diagrams:
102
SCV
Filter examples
Any column of information in any part of the Protein ID report can be filtered. Filters
cascade throughout the report – i.e removing a protein removes all its associated
unique peptides, and removing all peptides from a protein removes that protein too.
Each filter can be applied several times over. So it can get a little complex. To illustrate,
here are a few examples:
Publication
Show proteins that have two high-scoring hits:
Add the Protein Filter called Query and in the [Edit Filter] section choose
‘greater than’ and type ‘1’ in the box (without the quotes).
Then add the Peptide Filter called ‘Score’ and and in the [Edit Filter] section
choose ‘greater than’ and type ‘50’ in the box (without the quotes).
Press the ‘Apply Filters’ button.
Digging for a protein by name
To illustrate this process, let us find a protein that contains the word ‘lactoglobulin’ in
the database entry’s description.
Add the Protein Filters called ‘Desc’
In the [Edit filter] section, we’re required to type in a regular expression
(regex). This allows us to use wildcards. A nice, common wild-card is .* that
means ‘anything of any length’. For example: .* lactoglobulin .* Will find
anything that contains the word lactoglobulin, with anything before and
anything after.
Press the ‘Apply Filters’ button.
Setting a protein mass range
If we know the approximate mass of the proteins we’re interested in, we should
eliminate all proteins that are not close in mass.
SCV
Add two filters: “Protein Filters: Mass >12000” and “Protein Filters: Mass <
32000”
Press the ‘Apply Filters’ button.
Saving/Loading Filter sets
We’re sure to use some common filters repeatedly. To save a Filter Set, press the ‘Save
As’ button on the filter pane. This saves all filters that we’ve added to the ‘Selected
Filters’ list. To recall a saved Filter Set, select it from the drop down list in the top right
103
corner of the filter pane. This will simply populate the ‘Selected Filters’ list with our
saved filters. Don’t forget to press the ‘Apply Filters’ button to apply them.
SCV
The bottom panel
in protein view
shows the
columns selected
for peptide view
Toggling columns
Still, the information in the report might be too intensive. Some users might not care to
see the start and end position of the peptide in the protein, while some users may wish
to see even more information. PEAKS 4.2 allows us to customize which columns are
shown. Right-click anywhere in De Novo View or the top section of Peptide View or
Protein View. In the pop-up menu that appears, hold the mouse over Toggle Column.
A sub-menu will appear showing a checkmark in each of the columns that are
currently showing. Click any one of them to show/hide a column. PEAKS will
remember which columns we select, and present us with these columns each time we
load a report.
SCV
Exporting Results
SCV
WYSIWYG reports
PEAKS 4.2 allows us to create interactive reports to share with collaborators,
colleagues and clients. The reports are available in HTML or Microsoft Excell (.xls)
formats and follow a ‘What you see is what you get’ (WYSIWYG) philosophy. All the
information you see on screen in PEAKS 4.2 will appear in the exported report. For
this reason, it is important that we complete results filtering and toggling columns
before exporting a report.
We can export
only one view, one
part of the report,
at a time.
In order to export a report, first choose the view to export by clicking on the De Novo
View, the Peptide View tab or the Protein View tab. Next, right-click anywhere in the
top section of the selected view and choose ‘Export Report’ from the pop-up window
that appears.
The report export dialogue will appear.
One must choose either HTML or
XLS fomat and specify a file name.
PEAKS 4.2 will load the report after it
has been created, but it makes sense to
always place the report in a place we
can find it later on. By default the
filename of the report will include the
time and date the report was created.
To change the location/filename one
can either type it in to the Fileame box
or click the folder icon to browse to a new location.
The bottom part of the Report Export dialogue asks us what we would like to include
in the exported report. When exporting from Peptide View or De Novo View we have
104
the choice of exporting the whole list or the selected ones. When exporting from
Protein View we have some more options, allowing us to include peptide details, the
complete protein sequence, a listing of proteins containing the same set or a subset of
the same peptides, or to include only marked proteins. Press the OK button to
complete the export.
SCV
Exporting peak lists
To export data to a PKL file, we select the data file (not an individual spectrum) to
export. Then, from the “File” menu, select “Export”, then “Export PKL File”. The
spectrum data will be saved in PKL format, but all sequencing and protein data will not
be preserved.
SCV
Exporting Sequences by spectrum
For most users, the WYSIWYG reports exporting will be enough, but PEAKS 4.2 also
provides other ways to export. To export peptide sequencing results to a FASTA
format file, select the data file (not an individual spectrum) to export. Then, from the
“File” menu, select “Export”, then “Export Peptide Sequence”. The sequencing data
will be saved in FASTA format, but will not retain any spectrum data.
To export peptide sequencing results to an HTML table, select the data file (not an
individual spectrum) to export. Then, from the “File” menu, select “Export”, then
“Export HTML File”. PEAKS will then ask us which results we would like to export.
We can choose from any de novo sequencing or Protein ID run we have done. Each will
be listed with the parameter set we used. The difference here is only that the results are
organized by spectrum rather than by peptide as in the WYSIWYG exporting.
SCV
Exporting Exclusion Lists
If we are repeating an experiment, it can be useful to exclude the peptides we have
already scanned and anlalyzed. In this way, we can focus on some potentially
interesting but lower intensity peaks. To tell the instrument to do this we must create
an exclusion list. PEAKS 4.2 has the ability to create an exclusion list that will be
compatible at least with Waters/Micromass instruments. To create the exclusion list,
simply select a few spectra from the peptide data tree on the left, then right click and
choose “Export to Exclusion list” from the pop-up menu that appears. The selection
of spectra can also be done using by clicking in the Peptide View or De Novo View of
a Protein ID report.
SCV
Exporting high-resolution spectral images
It is often useful to provide visual aids in reports, posters and papers. As such, PEAKS
4.2 provides the facility to export high quality images of a spectrum or part of a
spectrum zoomed in. In any case, PEAKS allows us to export exactly what’s shown on
the screen. So to export an image:
1. Bring up the main processing window for an MS/MS spectrum by
double-clicking on its precursor ion mz, or by double clicking a
105
peptide in any of the reports. The main processing window shows us
the spectrum of interest, along with any peptides matched to it.
2. Set up the colour, typeface and size of labels and peaks on the
spectrum. To do so, choose Edit menu Configuration Environment Preferences. Within the Environment preferences
dialogue, choose the ‘Colour’ or ‘Display’ tab to get at the relevant
settings.
3. (optional) If we want to export a picture of the Ion Table, we should configure what
columns are shown in the ion table before the export. To do so, select one of the Ion
Table Editor tabs from the Environment Preferences dialogue.
4. (optional) If we want to export a zoomed in region of the spectrum, we must do so
now by clicking and dragging horizontally over the area of interest.
5. Click the
export results button on the main processing window
toolbar, or right-click on any frame within the main processing
window and choose “Export Image” from the pop-up menu.
6. The Image Export Options Dialogue appears. On this window you
can export:
What the current spectrum
view (middle) frame is
displaying.
What the alignment (bottom)
frame is displaying
All the proposed peptides as
listed in the top left frame
A combination of the
alignment and spectrum
annotations.
a. Choose what you want to export.
b. Select a file type. Four popular formats are supported., but
either GIF or PNG formats are recommended.
c. Choose a file name. We can browse by clicking the folder icon
or just type a file name in the box.
106
d. (optional) Specify width and height dimensions in pixels. In
some cases the size is predetermined by the size of the frame
on our screen. Otherwise we can increase these numbers to
make the picture bigger.
e. To export high resolution images, increase the resolution by a
few hundred percent.
f. Press ok and you’re done.
SCV
Saving Results
Saving results will preserve our work for later use. Saving files in PEAKS’s .ANZ
format will preserve spectrum data, manual de novo sequence information, automatic de
novo sequence information, protein identification results, and information about any
PTM that were found in sequence.
To save the results of our analysis, we first select the data file we wish to save in the
Peptide Data Frame.
To save, click the
save icon in the main window toolbar, select “Save” from the
“File” menu or right click on the data file and select “save” from the popup menu.
This will save the processed spectra in .ANZ format and of the same name as the data
file we opened.
To change the name of the ANZ file, choose “Save as” from the “File” menu, or right
click on the data file and select “Save as” from the pop-up menu. We may then change
the file name.
To save all currently opened data files, select “Save all” from the “File” menu.
107
Chapter
9
About Bioinformatics
Solutions Inc.
BSI provides advanced software tools for analysis of biological data.
Bioinformatics Solutions Inc. develops advanced algorithms based on innovative ideas
and research, providing solutions to fundamental bioinformatics problems. This small,
adaptable group is committed to serving the needs of pharmaceutical, biotechnological
and academic scientists and to the progression of drug discovery research. The
company, founded in 2000 in Waterloo, Canada, comprises a select group of talented,
award-winning developers, scientists and sales people.
At BSI, groundbreaking research and customer focus go hand in hand on our journey
towards excellent software solutions. We value an intellectual space that fosters
learning and an understanding of current scientific knowledge. With an understanding
of theory, we can focus our talents on providing solutions to difficult, otherwise
unsolved problems that have resulted in research bottlenecks. At BSI, we are not
satisfied with a solution that goes only partway to solving these problems; our solutions
must offer something more than existing software.
The BSI team recognizes that real people will use our software tools. As such, we hold
in principle that it is not enough to develop solely on theory; we must develop with
customer needs in mind. We believe the only solution is one that incorporates quality
and timely results, a satisfying product experience, customer support and two-way
communication. So then, we value market research, development flexibility and
company-wide collaboration, evolving our offerings to match the market/user’s needs.
Efficient and concentrated research, development, customer focus and market analysis
have produced: PEAKS software for protein and peptide identification from tandem
mass spectrometry data, RAPTOR and PROSPECT Pro software for threading based
3D protein structure prediction and PatternHunter software for all types of homology
search sequence comparison.
108
Chapter
10
PEAKS Software License
This is the same agreement presented on installation. It is provided here for
reference only.
If we are evaluating a time limited trial version of PEAKS and we wish to update the
software to the full version, we must purchase PEAKS and obtain a full version
registration key.
1. License. Subject to the terms and conditions of this Agreement, Bioinformatics
Solutions (BSI) grants to you (Licensee) a non-exclusive, perpetual, non-transferable,
personal license to install, execute and use one copy of PEAKS (Software) on one
single CPU at any one time. Licensee may use the Software for its internal business
purposes only.
2. Ownership. The Software is a proprietary product of BSI and is protected by
copyright laws and international copyright treaties, as well as other intellectual property
laws and treaties. BSI shall at all times own all right, title and interest in and to the
Software, including all intellectual property rights therein. You shall not remove any
copyright notice or other proprietary or restrictive notice or legend contained or
included in the Software and you shall reproduce and copy all such information on all
copies made hereunder, including such copies as may be necessary for archival or
backup purposes.
3. Restrictions. Licensee may not use, reproduce, transmit, modify, adapt or translate
the Software, in whole or in part, to others, except as otherwise permitted by this
Agreement. Licensee may not reverse engineer, decompile, disassemble, or create
derivative works based on the Software. Licensee may not use the Software in any
manner whatsoever with the result that access to the Software may be obtained
through the Internet including, without limitation, any web page. Licensee may not
rent, lease, license, transfer, assign, sell or otherwise provide access to the Software, in
whole or in part, on a temporary or permanent basis, except as otherwise permitted by
this Agreement. Licensee may not alter, remove or cover proprietary notices in or on
the Licensed Software, or storage media or use the Licensed Software in any unlawful
manner whatsoever.
109
4. Limitation of Warranty. THE LICENSED SOFTWARE IS PROVIDED AS IS
WITHOUT ANY WARRANTIES OR CONDITIONS OF ANY KIND,
INCLUDING BUT NOT LIMITED TO WARRANTIES OR CONDITIONS OF
MERCHANTABILITY OR FITNESS FOR A PARTICULAR PURPOSE.
LICENSEE ASSUMES THE ENTIRE RISK AS TO THE RESULTS AND
PERFORMANCE OF THE LICENSED SOFTWARE.
5. Limitation of Liability. IN NO EVENT WILL LICENSOR OR ITS SUPPLIERS
BE LIABLE TO LICENSEE FOR ANY INDIRECT, INCIDENTAL, SPECIAL,
OR CONSEQUENTIAL DAMAGES WHATSOEVER, EVEN IF THE
LICENSOR OR ITS SUPPLIERS HAVE BEEN ADVISED OF THE
POSSIBILITY OF SUCH DAMAGE OR CLAIM, OR IT IS FORESEEABLE.
LICENSOR'S MAXIMUM AGGREGATE LIABILITY TO LICENSEE SHALL
NOT EXCEED THE AMOUNT PAID BY LICENSEE FOR THE SOFTWARE.
THE LIMITATIONS OF THIS SECTION SHALL APPLY WHETHER OR NOT
THE ALLEGED BREACH OR DEFAULT IS A BREACH OF A
FUNDAMENTAL CONDITION OR TERM.
6. Termination. This Agreement is effective until terminated. This Agreement will
terminate immediately without notice if you fail to comply with any provision of this
Agreement. Upon termination, you must destroy all copies of the Software. Provisions
2,5,6,7 and 10 shall survive any termination of this Agreement.
7. Export Controls. The Software is subject at all times to all applicable export control
laws and regulations in force from time to time. You agree to comply strictly with all
such laws and regulations and acknowledge that you have the responsibility to obtain
all necessary licenses to export, re-export or import as may be required.
8. Assignment. Customer may assign Customer's rights under this Agreement to
another party if the other party agrees to accept the terms of this Agreement, and
Customer either transfer all copies of the Program and the Documentation, whether in
printed or machine-readable form (including the original), to the other party, or
Customer destroy any copies not transferred. Before such a transfer, Customer must
deliver a hard copy of this Agreement to the recipient.
9. Maintenance and Support. BSI will provide technical support for a period of thirty
(30) days from the date the Software is shipped to Licensee. Further maintenance and
support is available to subscribers of BSI's Maintenance plan at BSI's then current
rates. Technical support is available by phone, fax and email between the hours of 9
am and 5 pm, Eastern Time, excluding statutory holidays.
10. Governing Law. This Agreement shall be governed by and construed in
accordance with the laws in force in the Province of Ontario and the laws of Canada
applicable therein, without giving effect to conflict of law provisions and without
giving effect to United Nations Convention on contracts for the International Sale of
Goods.
110
Chapter
11
Reference: PEAKS Paper
Please use the following references when publishing a study that involved the use of
PEAKS.
Bin Ma, Kaizhong Zhang, Christopher Hendrie, Chengzhi Liang, Ming Li, Amanda
Doherty-Kirby, and Gilles Lajoie. PEAKS: Powerful Software for Peptide De Novo
Sequencing by Tandem Mass Spectrometry. Rapid Communication in Mass Spectrometry
17(20): 2337-2342. 2003
111