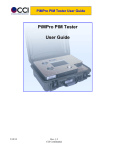
Download CCI PiMPro Quick Start Guide
Transcript
PiMPro Quick Start Guide
Rev. 1.4
PiMPro Quick Start Guide
1
Introduction
1.1 Making PIM & Return Loss Measurements (Instantaneous)
Perform the following steps to take a PIM and Return Loss measurement:
1.1.1 Turn-On PiMPro PIM Tester
1) Plug in the CCI PiMPro PIM tester to an AC source (120 or 220 VAC).
2) Turn on the power switch on the side of the unit.
3) When the PiMPro has completed its software load, the Main Menu screen will
appear as shown in Figure 1.
Figure 1 - Main Menu Screen
1.1.2
Select Quick Start Guide Icon
If you are unfamiliar with the PiMPro and have not been through PiMPro training, this
guide can be viewed directly from the touch-screen by depressing the Quick Start Guide
icon on the Main Menu.
1.1.3 Setting the Date & Time (First Time Only)
The date and time need to be set the first time the PiMPro is used, or whenever the unit
is moved to a different time zone. Follow the steps below to set the time and date:
Rev. 1.4
2
PiMPro Quick Start Guide
1.1.3.1
Select Configure System Icon
Press the Configure System icon found in the Main Menu screen shown in Figure
1 above. This will open the System Configuration screen as shown in Figure 2
below.
Figure 2 - System Configuration Screen
1.1.3.2
Select Date & Time Icon
Press the Date & Time icon to open the Date and Time Settings Menu in Figure
3. Enter the correct date and time by selecting the appropriate field and using the
up and down arrow keys to arrive at correct number. When done, press the OK
icon to return to the System Configuration screen.
Figure 3 - Date and Time Settings Menu
Rev. 1.4
3
PiMPro Quick Start Guide
1.1.4
Select PIM and Return Loss Icon
Press the PIM and Return Loss icon found in the Main Menu screen shown in Figure 1.
This will open the PIM and Return Loss screen as shown in Figure 4 below.
Figure 4 - PIM and Return Loss Screen with “TX OFF”
1.1.5 Calibrate the PiMPro
Calibration ensures that the PiMPro is generating the right transmit tones at the desired
power levels to ensure an accurate PIM measurement. We recommend that you always
calibrate the PiMPro before you take your first measurement (this is done automatically
by the software in case you forget). We also recommend that you occasionally recalibrate the PiMPro as you are conducting various PIM tests throughout the day.
1.1.5.1 Connect the PiMPro to a High Power Termination
The PiMPro Accessory Kit (CCI PN# PIMPro-AK) provides a Low-PIM HighPower Termination and a calibrated Torque Wrench for PIM measurement and
calibration purposes. Connect the Low-PIM High-Power Termination to the RF
Output of the CCI PiMPro PIM tester. Ensure that the connectors are all “clean”
prior to making the connections. Hand-tighten all connectors while ensuring that
the connectors are not misaligned. Once the connectors are hand-tightened, use
the Torque Wrench to tighten the connectors.
1.1.5.2
Select the Calibrate Icon
Press the Calibrate icon in the PIM and Return Loss screen shown in Figure 4.
The CCI PiMPro PIM Analyzer will set the power level individually for each of the
default test tone frequencies. The pop-up windows that appear while the
calibration is being performed are shown in Figures 5 & 6.
Figure 5 – P1 Calibration Pop-up Window
Rev. 1.4
4
PiMPro Quick Start Guide
Figure 6 - P2 Calibration Pop-up Window
1.1.5.3 Quick Cal
In the PIM & RL menu, after turning on the power to begin a measurement, you
may encounter an occasional popup window (see Figure 7) that indicates that a
“Quick Cal” is being performed. “Quick Cal” is a fine tuning of the power output
that occurs very quickly to ensure that the PiMPro is delivering accurate TX power
and making high precision PIM measurements.
Figure 7 - Quick Cal Pop-up Window
1.1.6 Connect PiMPro to the Feeder Line to be tested
Connect the RF Cable (System, Feeder or other) to be tested to the RF Output of the
CCI PiMPro PIM tester. Ensure that the connectors are all “clean” prior to making the
connections. Hand-tighten all connectors while ensuring that the connectors are not
misaligned. Once the connectors are hand-tightened, use the CCI-supplied Torque
Wrench to tighten the connectors.
1.1.7 Turn On RF Output
Press the GREEN RF icon as shown in Figure 4 to turn on the RF Output Power. The
RF Indicator text will change to “TX ON” and will begin flashing in Green as shown in
Figure 8 below. The RF icon will turn RED to enable you to turn off the RF when
desired. Additionally, an alternating RED and WHITE border will appear around the
“measurement” portion of the screen.
Figure 8 – PIM and Return Loss Screen with “TX ON”
Rev. 1.4
5
PiMPro Quick Start Guide
1.1.8
Record Measurement
The PiMPro PIM Analyzer will display the current PIM and Return Loss readings of the
feeder or device it is connected to. When you are ready to record the reading being
displayed (Note: the PIM readings should be stable before recording the measurement –
consult the PiMPro User Manual for more detailed information) press the Record
Reading icon on the PIM and Return Loss screen.
1.1.8.1 Enter Site Information
When the Record Reading icon is depressed, the Site Information Screen opens
as depicted in Figure 9. Enter information on the Operator (i.e. AT&T, Verizon,
T-Mobile, Sprint, etc.) and the Site Number. Also, enter your initials into the
Technician field. Pressing the bar on the right side of each field will bring up the
Keyboard Entry Screen depicted in Figure 10 which will allow you to enter the
desired information. When you have finished entering the required site
information, press the OK Icon.
Figure 9 - Site Information Screen
Figure 10 - Keyboard Entry Screen
Rev. 1.4
6
PiMPro Quick Start Guide
1.1.8.2 Enter Sector/Feeder Information
After completing the Site Information above, the Sector/Feeder Information
Screen is displayed as depicted in Figure 11 below. Depress the bar to the right
hand side of each field to enter the Sector and the Feeder information. Once the
information has been entered, press the OK icon at the bottom of the screen.
Note that the Site Information and Sector/Feeder Information are required only on
the first PIM measurement. Subsequent PIM measurements do not require reentry of this information.
Figure 11 - Sector/Feeder Information Screen
1.1.8.3 Select Label and Enter Comment
Once the Site Information and Sector/Feeder Information have been completed,
the Select Label Pop-up Window is displayed as shown in Figure 12. The
PiMPro PIM Analyzer provides an extensive list of default labels that describe
typical measurement points at most cell sites. Note: This list and how to add new
labels are discussed in detail in the PiMPro User Manual. Select the label that
best matches your measurement point. You can also enter a comment specific to
this measurement in the report by taping on the field to the right of the comment
label.
When the select label process is complete, depress the OK icon to return to the
PIM and Return Loss screen. A Cancel Reading button is shown giving the user
the option to cancel out of a reading in case the user accidentally hit the Record
Measurement button.
Figure 12 - Select Label Pop-up Window
Rev. 1.4
7
PiMPro Quick Start Guide
1.1.9
Select the Report Menu Icon
The PIM measurements taken thus far can be viewed at any time and a report can be
created by pressing the Report Menu icon. This action brings up the Test Report
Screen shown in Figures 13-14 below.
1.1.9.1 Viewing the Test Report
The Test Report that appears on the touch screen can be “scrolled” up or down by
dragging your finger up or down on the screen. You will notice the Site
Information and the Sector/Feeder Information that were entered in paragraphs
1.1.8.1 and 1.1.8.2 displayed at the top of the test report (See Figure 12).
Figure 13 - Test Report Screen (Site and Sector Info)
Scrolling down, the test report will contain the pass/fail limit points (in both dBm
and dBc units) and the test results. Note: The PiMPro Users Guide provides
detailed information on how to change the pass/fail points.
Figure 14 - Test Report Screen (Pass/Fail Limits and Test
Results)
Rev. 1.4
8
PiMPro Quick Start Guide
1.1.9.2
Saving the Test Report
If the test report as displayed is satisfactory, it can be saved by pressing the Save
Report icon. This action opens the Save Report pop-up window as shown in
Figure 15 below. The report can be saved to either the “Local Drive” or the “USB
Drive,” by selecting the appropriate icon. Please note that the user should be
sure to depress the icons and not the radio buttons in order to properly select
which “Drive” the Test Report will be stored in. The file name for the report is
automatically generated by the PiMPro Analyzer but can be changed by tapping
on the File Name bar. This action will bring up the Keyboard Entry Screen which
will allow you to override or modify the default file name. This automatically
generated file name is created by the PiMPro Analyzer as a concatenation of the
Operator, Site # and Sector information that was previously entered. Press the
OK icon to save the report. The “suggested” filename no longer contains the
sector information. Please note that special characters are not allowed.
Figure 15 - Save Report Pop-up Window
1.2 Making PIM (& RL) versus Time Measurements
CCI’s PiMPro PIM Analyzers also allow the user to perform PIM and Return Loss
measurements over a period of time. The default mode is a continuous measurement over
a period of 10 seconds. Note: The PiMPro User Manual describes how to change the
default test time period. Also, a more complex “Non-continuous” test mode is available
where the test time and test intervals can be customized.
1.2.1
Select PIM vs. Time Icon
Press the PIM vs. Time icon found in the Main Menu screen shown in Figure 1. This
will open the PIM vs. Time screen as shown in Figure 16 below.
Rev. 1.4
9
PiMPro Quick Start Guide
Figure 16 - PIM vs. Time Screen (Prior to Measurement)
1.2.2 Connect PiMPro to the Feeder Line to be tested
Loosen calibration equipment and connect cable to be tested per paragraph 1.1.6.
1.2.3
Take Measurement
Press the Start Plot icon on the PIM vs. Time window to begin the measurement plot.
Note that if the PiMPro PIM Analyzer has not been calibrated, the system will
automatically start a calibration cycle as described in paragraph 1.1.5. While the
measurement is being performed the “RF ON”
Icon will appear. The measurement
plot can be interrupted at any time by pressing the Stop Plot icon.
1.2.4
Select Record Plot Icon
Once the measurement plot has been completed, you can record the measurement (i.e.
save the measurement to the test report) by pressing the Record Plot icon. If the Site
Information and Sector/Feeder Information has not yet been entered, the system will
bring up the Site Information and Sector/Feeder Information screens as described in
paragraphs 1.1.8.1 and 1.1.8.2. Otherwise, the system will automatically open the
Select Label pop-up window (1.1.8.3) which will allow you to select the label that best
matches your measurement point.
1.2.5
Select Report Menu Icon
The PIM measurements taken thus far can be viewed at any time and a report can be
created by pressing the Report Menu icon. This action brings up the Test Report
screens shown in Figures 13-14 above with the exception that the PIM versus Time plot
now appears below the PIM & Return Loss measurements, and above the PiMPro
information box. Please follow the instructions in paragraph 1.1.9 to view and save the
test report.
Rev. 1.4
10
PiMPro Quick Start Guide
1.3
Select RX Interference Icon
The RX Interference icon will open up the “RX Interference” function window. This is a new
test function that looks for external interference in the Rx band. The test works by keeping
the transmitter amplifiers off and sweeping the receiver across the entire Rx band. The
“Start” and “End” RX frequencies and frequency” Step Size” can be adjusted from the
“Configure Frequency Parameters” pop-up window (see figure 17), which can be accessed
by touching the X-axis on the graph as seen previously. The IM Order can also be selected.
Additionally, as seen previously touching the Y-axis allows the user to specify the pass/fail
criteria. Please see figure 18 for a view of the completed sweep. Please note that as
before if Record Plot is selected the RX Interference Plot will be appended below the last
measurement taken prior to this measurement.
Figure 17 - Configure Frequency Parameters Pop-up Window
Figure 18 - Completed “RX Interference Sweep” Display
Rev. 1.4
11
PiMPro Quick Start Guide
1.4
Select Frequency Sweep Icon
Depressing the Frequency Sweep icon will open up the “Frequency Sweep” function
window. This is a new test function that takes continuous PIM measurements at varying
frequencies. The test works by keeping the first transmit tone fixed while moving the other.
It then repeats the test by keeping the second tone fixed and varying the other. The “Start”
and “End” RX frequencies and frequency step size can be adjusted from the “Configure
Frequency Parameters” pop-up window (see figure 19), which can be accessed by touching
the X-axis on the graph. The IM Order can also be selected. Additionally, touching the Yaxis allows the user to specify the pass/fail criteria. Additionally the Power can be adjusted,
and the IM Order can be selected. Please see figure 20 for a view of the completed sweep.
Please note that as before if Record Plot is selected the Frequency Sweep Plot will be
appended below the last measurement taken prior to this measurement.
Figure 19 - Configure Frequency Parameters Pop-up Window
Figure 20 - Completed “Frequency Sweep” Display
Rev. 1.4
12
PiMPro Quick Start Guide
1.5
Manage Resources
Depressing the Manage Resources Icon in the Main Menu will open up the Manage System
Resources Window (see figure 21). This window allows the user to view System
Information including Available Memory, Used By Reports (Memory Used by Reports), Used
by Old S/W (Memory Used by Old S/W Version), and Total Free Memory. This window also
allows the user to perform functions including Backup Reports, Clear Old S/W, Clear
Reports, and Exit.
Figure 21 - Manage System Resources Window
1.5.1
Backup Reports
Depressing the Backup Reports Icon allows the user to perform a “bulk” backup of all
reports on the PiMPro’s “Local Drive” to the “USB Drive.”
1.5.2
Clear Old S/W
Depressing the Clear Old S/W Icon allows the user to delete all old versions of S/W from
the PiMPro’s “Local Drive.”
1.5.3
Clear Reports
Depressing the Clear Reports Icon allows the user to clear all reports from the PiMPro
“Local Drive.” Please note that once this function has been selected a Warning pop-up
window will appear. Once the user accepts the action all reports on the “Local Drive”
will be deleted, and can no longer be retrieved (copied).
1.5.4
Exit
Depressing the Exit Icon returns the user to the Main Menu window.
Rev. 1.4
13
PiMPro Quick Start Guide
1.6 Autosave
PIM-Pro now automatically saves unsaved data recordings from a prior measurement
session in case power is lost or in case the user forgets to save measurements. This
feature works very well in the event of a power outage. See Figure 21 for an example of
the Autosave pop-up window after powering the PiMPro PIM tester. Please note that the
Autosave screen will be seen at PiMPro turn-on, especially after a power failure or a session
where the user did not save data.
Figure 22- Autosave Pop-up Window at PiMPro Power-up
1.7 Save Report
1.7.1 Length of Report Filenames
The number of characters allowed for filenames has been extended. Report filenames
can now include spaces. This improvement applies to the entire report subsystem
which includes Save, Copy, Rename and Open report. Please note that special
characters are not allowed.
1.7.2 Default Report Filenames
PiMPro generates a default filename for saved reports that the user can override and
change. The “suggested” filename no longer contains the sector information. Please
note that special characters are not allowed.
Rev. 1.4
14


