1
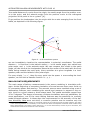
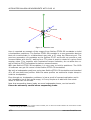
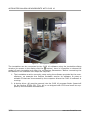
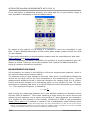
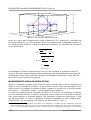
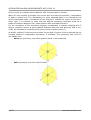
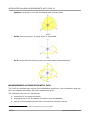
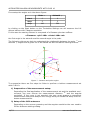
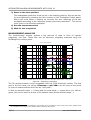
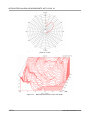
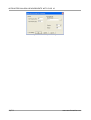
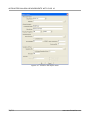
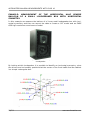
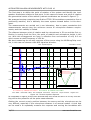
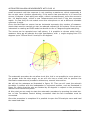
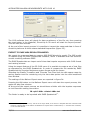
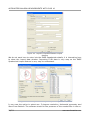
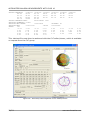
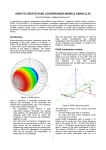
AN-002 APPLICATION NOTE AUDIOMATICA AUTOMATED BALLOON MEASUREMENTS WITH CLIO 10 by Daniele Ponteggia - [email protected] INTRODUCTION The acoustical response of a loudspeaker is angle dependent. A single on-axis response measurement cannot accurately characterize the system. It is possible to generalize and treat the system as single electrical input to multiple acoustical output. IN OUT S Figure 1 - Loudspeaker radiation model It is common practice to collect loudspeaker responses on-axis and off-axis, by means of different relative loudspeaker to microphone positions. The response is usually sampled at a given fixed resolution along the horizontal and vertical planes of the loudspeaker. These sets of measurements are often used to create technical documentation in form of polar pattern graphs. A good description on how to measure the polar response along a single plane is available on “Testing Loudspeakers” by Joe D'Appolito [1] and on CLIO manual [2]. The horizontal and vertical polar patterns are only a subset of the complete radiation of the loudspeaker into the surrounding space. If the complete spatial response of the loudspeaker needs to be characterized, a more complete description of the spatial sound radiation is needed. COORDINATE SYSTEM DEFINITION We model the source as a point and sample the response over a sphere surrounding the source. The point source model assumption can be objectionable, but if the mea surement distance (i.e. the sphere radius) is sufficiently large (compared to the source dimension) the model can be accurate [3]. To represent the three dimensional geometry of the problem we use the spherical coordinate system. A point into this system is described by means of three coordinates: AN-002/1009 1/33 AUTOMATED BALLOON MEASUREMENTS WITH CLIO 10 “the radial distance of a point from the origin, the zenith angle from the positive z-axis to the point, and the azimuth angle from the positive x-axis to the orthogonal projection of the point in the x-y plane” [4]. If we position the loudspeaker into the origin with the z-axis emerging from the front baffle, as depicted in the following figure. y φ r z θ x Figure 2 - CLIO coordinate system we can immediately visualize the representation in spherical coordinates. The radial distance r is fixed and is the balloon radius 1, is the zenith angle, also called here polar angle, and is the azimuth angle. We can compare this model to the earth globe, we can think at the loudspeaker placed at the center of the earth with the front baffle facing towards the north pole, every meridian at a given longitude is a loudspeaker polar and the latitude is the polar angle. For every triplet [ r , , ] , thus for every point into the space S surrounding the loudspeaker, we will have a transfer function H r , , . BALLON DATA REQUIREMENTS The main usage of balloon measurements is the source modeling in simulation software. At the beginning of computer simulation of sound sources there were limits on PC processing power and memory. The acoustic sources were modeled using a set of attenuation matrices, each containing the sound level pressure in respect to the onaxis level for a given octave or third octave band. The spatial resolution ranged from 15 to 5 degrees. The degree of accuracy of these simulations were not satisfactory for some applications, one of the most lacking features was the possibility to correctly model arrayed systems. In those days the requirements for the accuracy of the balloon directivity data were not strict, a common practice was to measure only the 1 In this case, since we are describing the coordinate system for the measurement of the polar response, the radius is the measuring distance. It is necessary to not confuse this with the loudspeaker model that will be created using these measurements. The model is often referred to 1 m on-axis measurement, but this is just a convention, and measurements needs to be carried out in the “far field”. 2/33 www.audiomatica.com AUTOMATED BALLOON MEASUREMENTS WITH CLIO 10 horizontal and vertical polar and mathematically interpolate the remaining data. In the recent years the mutual improvement of PC hardware and simulation software has removed the previous constraints, this has raised the requirements on balloon data to an higher level. The sources are now modeled using high resolution complex response data sampled at 5 degree (or finer) spatial resolution [6], with these elements the simulation of array systems can be carried out with high accuracy. Since the complex data is required, instead of the SPL modulus data only, the interpolation of the complete balloon data from the horizontal and vertical planes data, if mathematically feasible, is certainly highly questionable. While in the past it has been acceptable to interpolate magnitude only data to create matrices of sound pressure levels, the interpolation of complex data to create high resolution complex data balloons is not acceptable. If the source has to be modeled using the complex data, the measurement of the “complete” balloon response sampled at the desired angular resolution is needed. This involve a much more complicated measurement hardware than the simple plane polar measurements. LOUDSPEAKER POSITIONER We want to sample the response into the a sphere surrounding the loudspeaker. We will collect a set of responses by varying both the zenith angle and the azimuth angle. There are some different ways to do that: – using a set of n microphones and collect n responses at the same time, – using a set of n microphones and collect a single response at time, – using a single microphone and moving it around the source, – using a single microphone in a fixed position and rotating the loudspeaker. It is also possible to combine two of the above, as an example rotating the loudspeaker with a set of microphones placed on an arc over the loudspeaker. Every approach has its own pros and cons. In our experience a reliable and viable way is to use a single microphone in a fixed position and a computer controlled loudspeaker positioner to aim the source along the desired direction. This approach is the natural extension of the single plane polar measurements carried out using a computer controlled turntable. In respect to the (single) turntable approach, here we need a much more complicated hardware in order to rotate the loudspeaker over the two polar and azimuth angles as indicated in figure 3. The two rotation axis can be obtained using a custom robot positioner or using a couple of computer controlled turntables mechanically connected. 3/33 www.audiomatica.com AUTOMATED BALLOON MEASUREMENTS WITH CLIO 10 y azimuth polar x z Figure 3 - Rotation axes Here is reported an example of the usage of two Outline ET250-3D turntables to build a loudspeaker positioner. The Outline ET250-3D turntable is a new generation devices that can communicate in a bidirectional way with a PC using the Ethernet port. The previous generation of turntables as the Outline ET/ST series did not provide a real communication with the PC, waiting for a TTL pulse to start to rotate for a given fixed angular value. This, together with mechanical torque limitation, do not allow the usage of Outline ET/ST turntables for balloon measurements. With two Outline ET250-3D turntables 2 it is very easy to build a positioner. The CLIO 10 software can get full control of the Outline ET250-3D turntables. We built a loudspeaker positioner using two Outline ET250-3D turntables and standard 45 x 45 mm aluminum profiles. With the same profiles we realized a simple clamp to hold the loudspeaker. Even though our loudspeaker positioner is just a proof-of-concept realization and is not intended to be of real world usage, it is very simple as it was built from stock items in less than 10 minutes. Note that suspending heavy loads, as some loudspeaker boxes, can be harmful. Please be extremely careful when suspending loads. 2 It is possible to control also the LinearX LT360 turntable, but we found the Outline ET250-3D construction sturdier and our test jig was easier to assemble. 4/33 www.audiomatica.com AUTOMATED BALLOON MEASUREMENTS WITH CLIO 10 Figure 4 - Loudspeaker positioner The turntables can be connected to the CLIO 10 software using the turntables dialog window (to access to the dialog click the button), here is it possible to choose the model of each turntable and enter the connection parameters. Before connecting the turntables to the software two steps are required: 1. The turntables must be correctly setup using the software provided by the manufacturer, as example the Outline turntable require its software to setup a suitable IP that can be accessed by the computer where the CLIO 10 software is running. 2. A device driver .dll must be present into the CLIO 10 program folder (basert.dll for the Outline ET250-3D). This .dll is not shipped with CLIO and must be sup plied by the turntable manufacturer. 5/33 www.audiomatica.com AUTOMATED BALLOON MEASUREMENTS WITH CLIO 10 Here is an example of a LAN connection of the PC with CLIO 10 software and two Out line ET250-3D turntables: ET250-3D POLAR 192.168.0.69 NET SWITCH PC CLIO 8 192.168.0.1 ET250-3D AZIMUTH 192.168.0.70 We used the Outline XP-Commander software to set up the two turntables with the above IP addresses. Then we connect the CLIO 10 software using the Turntables Control dialog: The Option dialog can be opened by clicking on the button: Once the turntables are connected to the LAN and powered up it is possible to control them with the CLIO 10 by pressing the buttons and . 6/33 www.audiomatica.com AUTOMATED BALLOON MEASUREMENTS WITH CLIO 10 If the connection is established properly, the name and the current rotation angle of each turntable is displayed on the turntables dialog: By means of the buttons of the dialog it is possible to move the turntables in real time. To get a detailed description of the control panel usage, please consult the CLIO 10 user manual. To get more information on the turntables please check the manufacturers web sites: www.outline.it and www.linearx.com. Once a loudspeaker positioner is available, the problem of pointing towards a given direction is solved. There are still some problems that needs to be addressed before trying to measure the balloon response. MEASUREMENT DISTANCE A first question to answer is the definition of the the measurement distance, which is in turns the measurement sphere radius. The distance must be large enough to limit the “apex error” and diffraction effects but cannot be too large due to the size constraints of the measurement room 3. Typical measurement distances found in technical literature are ranging from 4 to 8 meters. Feistel and Ahnert showed in an interesting paper on the subject [3] that “for measurements of complex data there is a critical frequency where the phase error reaches / 4 . This maximum frequency is defined by: f crit =340 d 2 4x with d being the measuring distance and x the distance between an acoustic source and the Point of Rotation”. Thus when modeling a large source as a point source and measuring the response over a sphere surrounding it, large distances are necessary. As a solution to this problem it was recently introduced in EASE a new loudspeaker model (GLL) where it is possible to combine into a loudspeaker model different point 3 Outdoor measurements are highly discouraged since the polar measurements can last for few hours and the change of environmental conditions can severely affect the reliability (please note that this can be also a problem indoors). Furthermore outdoor wind and noise can affect the measurements. 7/33 www.audiomatica.com AUTOMATED BALLOON MEASUREMENTS WITH CLIO 10 sources in different points in space. It is thus possible to measure every single source as a point source at a shorter distance 4. A limitation of the measurement distance is usually due to the available room dimensions and type. There are three basic possible room types: fully anechoic, semianechoic and non-anechoic. In a fully anechoic space, apart from the measuring distance, the only problem to face is the mechanical stability of the test gig, the turntable must lie on an hard surface to avoid oscillations. Some positioning tools that are able to handle heavy loudspeaker rely on arms with wheels, these tools are very difficult to use over an anechoic cham ber cable floor. Regarding to the measurement distance: to get 8 m distance between source and microphone - taking into account the fact that the dimension of the loudspeaker positioner is not negligible – needs a very large and expensive chamber. In semi-anechoic or non-anechoic spaces it is easier to achieve large measurement distances, but here we need to face problems coming from the room reflections. These must be windowed out from the measured responses. With CLIO it is possible to window the impulse responses, but the resolution of the measurement is affected by the available free reflection time window. Nearer the reflections, shorter the window, lower the measurement resolution. The window length sets a frequency threshold above the measurement is reliable. In brief, early reflections means a short time window hence an high frequency threshold. The formula for the frequency threshold is quite simple: f LOW = 1 t window To get a sufficiently high frequency threshold the loudspeaker must be placed enough away from boundary surfaces. In practical terms, for a threshold of 100 Hz the needed reflection free time window length is 10 ms. Taking into account the travel time of the sound from the source to the receiver at a measuring distance of 6 m with a speed of sound of 340 m/s, the minimum distance from the first reflecting surface, is 3.62 m. This means that is needed to put the loudspeaker over a quite high pole or suspend it. If the space is non-anechoic means also the use of a really high ceiling, at least 7.24 m. A solution to the problem can be achieved eliminating the floor reflection using highly absorptive material placed on the ground between the source and the microphone position. This leads to a practical height for the loudspeaker, allowing measurement down to the 100 Hz range in large closed spaces. If a non-anechoic space is used to perform polar measurements it must be noted that the room rever beration time must be short enough to avoid time aliasing between successive measurements, if using an automated process the operation must be triggered to let the acoustic energy in the room to decay 5. A detailed and elegant explanation of the reflection free environment can be found on [5] where an ellipsoid of free reflections is defined. Here are reported only few practi cal considerations, if the room has a “shoe box” shape with the loudspeaker and the microphone placed as in figure: 4 5 It is also possible to predict the effect of the position of the point sources and the spatial effect of the crossover network. This is possible with CLIO 10 using the turntables control dialog. 8/33 www.audiomatica.com AUTOMATED BALLOON MEASUREMENTS WITH CLIO 10 ceiling reflection receiver wall reflection R S h floor reflection W H source wall reflection lateral reflection direct path ds d dr D Figure 5 - Rectangular room reflections given the room and measurement setup dimensions is it possible to calculate the threshold frequency. Is it also possible, given the height of the loudspeaker position h, the measurement distance d and the threshold frequency to calculate the minimum room dimensions: 2 c H= f LOW 2 d f LOW 2 d s= 2 h 2 c W =2⋅ d 2 − d − d 2 2 c 2⋅f LOW D=d 2⋅d s As said before, where a large anechoic room is not available, a practical solution to perform 3D polar measurements at large distances and wide bandwidth is a large lowreverberation room with hard floor and with an absorptive treatment on the floor between the source and the microphone. MEASUREMENT ANGULAR RESOLUTION Since it is possible to gather only a finite number of responses it will be necessary to define a rule to sample the surface S around the source. Under the assumption of a point source it is possible to sample a given number of points over a sphere surface with radius r . The sphere radius r is the measurement distance. In order to characterize the complete emission of a source it is necessary to sample over the complete sphere, in case of symmetry of the emission it is possible to sample only a semi-sphere or a quarter sphere. The resolution of both the polar angle and the azimuth angle must be specified. It seems reasonable to use a regular sampling interval6, as an example of 5 degrees for both angles and . 6 Non regular sampling of the sphere of emission of a loudspeaker is possible and can significantly reduce the amount of data to be gathered, but currently commercial simulation softwares are using regular sampled data. There are some interesting application as the reconstruction of the loudspeaker polar pattern using spherical 9/33 www.audiomatica.com AUTOMATED BALLOON MEASUREMENTS WITH CLIO 10 In theory an higher sampling can better follow the spatial pattern of the source, but it takes more time to measure using our single microphone 7 approach and more storage space for the measurement files. The 5 degrees resolution for a complete sphere seems to be a good trade off between those factors. The following image show the 2664 points to be sampled for a 5 degrees full sphere polar measurement set: y x z Figure 6 - Full sphere measurement points The following table reports the number of measurements, the estimated completion time8 and the storage space a 5 degree resolution balloon measured with a MLS size of 16k with CLIO 10 and two Outline ET250-3D turntables in an anechoic chamber: Number of points Estimated time [h:mm] Storage space [MB] Full sphere 2664 2:45 670 Half sphere 1369 1:25 355 Quarter sphere 703 0:45 182 Polars only 144 0:09 38 Using a different resolution for the polar and the azimuth angle is possible, this is the case of only horizontal and vertical polars, with a given resolution (as low as 1 degree as stated by some loudspeaker manufacturers) and resolution 90 degrees. The resolution to be used depends on the application of the polar data sets. If the aim is the creation of simple horizontal and vertical polar patterns graphics there is no need to measure the full sphere balloon, an horizontal and vertical polar measurement set is sufficient. If the aim is the simulation of the complex interaction between acous 7 8 harmonics where a non regular sampling can be adopted. In case of multiple microphone approach the hardware setup can also become very complex. This time is relative to the case of no delay between measurements, that is in an anechoic environment. In case of delay between measurements the delay times the number of measurements must be added to the estimated time. As an example a full sphere balloon with a 2 second delay takes a total time of about 3 hours. 10/33 www.audiomatica.com AUTOMATED BALLOON MEASUREMENTS WITH CLIO 10 tical sources, a complete sphere balloon with complex data is needed. When it's not possible to sample the source with the desired resolution, interpolation of data is carried out. The interpolation of polar sampled data is an interesting and quite complicated topic, a treatment of this subject is outside the scope of this document. Here it is possible to state that the angular sampling resolution must be a trade-off between data set size, measurement time and data accuracy. For the simulation of the interaction between loudspeaker a regular sampling with 5 degree resolution seems a good tradeoff between data size and accuracy and is currently the standard in electroacoustic source polar measurement [7]. As briefly outlined in the previous section the number of points to be measured can be reduced thanks to loudspeaker symmetry, if available. The symmetry that CLIO 10 can handle are: – None: no symmetry, the whole sphere needs to be measured, – Half: symmetry over the vertical plane, 11/33 www.audiomatica.com AUTOMATED BALLOON MEASUREMENTS WITH CLIO 10 – Quarter: symmetry over the horizontal and vertical plane, – Axial: axial symmetry, a single polar is requested, – H+V: horizontal and vertical polar are interpolated mathematically 9 MEASUREMENT AUTOMATION WITH CLIO The CLIO 10 software can control the loudspeaker positioner (two turntables) and perform a complete automatic 3D polar measurement set. The software take care of everything: 9 ● execution of the measurements, ● management of the turntables to position the loudspeaker ● saving of the measurements with a convenient naming scheme. This feature is intended to be used on magnitude only source models. 12/33 www.audiomatica.com AUTOMATED BALLOON MEASUREMENTS WITH CLIO 10 The automated procedure can also be halted and resumed in a later time. With CLIO 10 there are two different polar modes: 1D polar mode and 3D polar mode. The 1D polar mode can be seen as a legacy mode and is the same as the previous software versions, the 3D polar mode is the new one it has been introduced to manage the measurement of loudspeaker balloons. The 3D mode is available only under the QC version of the software. 1D Polar Mode: The 1D Polar Mode perform a set of measurements automatically by varying one parameter and controlling a single turntable. It is intended as legacy mode that is compatible with older versions of the CLIO software. If you are coming from a previous CLIO version, please notice that the turntable is controlled from the Turntables Settings dialog instead of the External Hardware dialog. Here we do not want to go into the details that can be found on the CLIO 10 user manual. 3D Polar Mode: The 3D Polar Mode can perform set of polar measurements using one or two computer controlled turntables10. In its common usage we need two computer controlled turntables connected to the PC, and we need to setup the Polar and Azimuth angles in the Autosave Settings dialog. In this dialog we need also to set the filename, the autosave folder and the file format (binary and/or text). 10 In the 3D mode only computer controlled turntables as the Oultine ET250-3D and the LinearX LT360 can be used, if two turntables are not available the user can choose as second turntables the manual turntable. This means that the user needs to manually provide for the correct azimuth rotatioin of the loudspeaker. 13/33 www.audiomatica.com AUTOMATED BALLOON MEASUREMENTS WITH CLIO 10 If we setup the angles as in the above figure: Polar Azimuth start 0 0 step 5 5 stop 180 360 by clicking on the Start button on the Turntables Settings we will measure the full sphere balloon with 5 degree resolution. In this case the naming scheme is composed of a filename plus two suffixes: <filename> <phi*100> <theta*100>.mls the first angle is the azimuth and the second angle is the polar. The following picture can help to understand the relationship between the polar and azimuth angles and a given file of the saved set with the above naming scheme. y 90° -180° 180° 180° φ z 0° 0° θ x 270°/-90° Figure 7 - Azimuth and polar angles To summarize there are five steps to follow to perform a balloon measurement set with CLIO 10: 1) Preparation of the measurement setup: Depending the final application of the measurement set and the available environment, the user choose the measurement distance d and the angular resolution. If the room is not anechoic the user must arrange a convenient measurement setup and analyze the energy decay to decide the delay time between measurements. 2) Setup of the CLIO autosave: Depending on the source symmetry and the angular resolution the user need to fill the Autosave settings dialog. 14/33 www.audiomatica.com AUTOMATED BALLOON MEASUREMENTS WITH CLIO 10 3) Reset to the start position: The loudspeaker positioner must be put in the starting position, this can be easily accomplished by pressing the Sync button on the Turntables Control panel. Some care must taken in setting up correctly the zero reference of the two turntables according to the reference system previously described 11. This will be more clear in the following examples. 4) Run the measurement set 5) Wait for the completion MEASUREMENT ANALYSIS The measurement process creates a big amount of data in form of impulse responses .mls files. These files can be obviously singularly analyzed using the MLS&LogChirp control panel. MLS - Frequency Response 110.0 dBSPL 100.0 Response 0,0 (on-axis) 90.0 Response 0,45 80.0 Response 0,90 70.0 60.0 50 100 200 500 1k CH A dBSPL Unsmoothed 48kHz 16K Rectangular Start 0.00ms 2k Stop 7.79ms 5k Hz FreqLO 128.34Hz 10k 20k Length 7.79ms Figure 8 - Frequency responses The 3D naming scheme is also compatible with the CLIO directivity module. The first part of the file name, the string <filename> <phi*100> can be seen as the prefix of a set of measurements which are an “half-polar”. In fact the azimuth angle is fixed and the polar angle ranges from 0 to 180 degrees, this can be seen as a slice of the balloon taken at the azimuth angle . 11 With the Outline ET250-3D turntables the zero position of the turntable is lost at every power down, please return the turntables at the physical zero position before powering off the units. 15/33 www.audiomatica.com AUTOMATED BALLOON MEASUREMENTS WITH CLIO 10 In the following example we will display the directivity of the 10° azimuth angle half polar. Figure 9 - =10 azimuth angle half polar The root file name to choose is <filename> 1000, then set Z-Start=0, Z-Stop=180 and Z-ref=0, as in the following settings screenshot: Then the directivity can be seen in form of classic polar plots (figure 10) or as waterfall plot (figure 11) or colormap directivity plot. Notice the fact that with these tools only a small amount of the data collected during the 3D measuring process is analyzed, in particular the classic polar plot show only one frequency of a single polar. 16/33 www.audiomatica.com AUTOMATED BALLOON MEASUREMENTS WITH CLIO 10 Figure 10 - Polar plot of the azimuth angle half polar at 1 kHz Figure 11 - Waterfall directivity of an half-polar 17/33 www.audiomatica.com AUTOMATED BALLOON MEASUREMENTS WITH CLIO 10 CLIO 10 feature a 3D analysis module. This module allows to visualize the response balloon at the standard third octave frequencies and to export the data in different forms: – EASE .xhn ASCII format – CLF .tab ASCII format – Time Response .txt files for import with EASE SpeakerLab The 3D analysis module can manage the entire set of measured impulse responses with the naming scheme and symmetry as previously described. The analysis module is the natural counterpart of the 3D measure automation. The 3D mode of the Waterfall, Directivity & 3D module can be accessed by selecting the 3D from the drop down menu. Figure 12 - 3D analisys window The settings of this menu are quite simple, being the Root File Name, Symmetry and Rotation. The Root File Name can be choose pressing the browse button and then se lecting any file of the data set12. 12 Please note that while the 3D autosave allows for different angular resolutions, the 3D analysis module accept only a file set with a 5 degree resolution. This is indeed a limitation together with the fixed third octave analysis frequencies, but the 3D analysis module must be seen as a tool to briefly check the validity of the measured data set than an detailed inspection tool. 18/33 www.audiomatica.com AUTOMATED BALLOON MEASUREMENTS WITH CLIO 10 Figure 13 - 3D analysis settings 19/33 www.audiomatica.com AUTOMATED BALLOON MEASUREMENTS WITH CLIO 10 Figure 14 - Example of color balloon The allowed symmetries are exactly the same as in the case of automated measurement: none, half, quarter, axial, H+V. The Rotation parameter is the angle between the reference azimuth axis ( =0 ) of the measured data set and the reference azimuth axis of the balloon that will be created with the Root File Name data set. This will be more clear later in the first example. Pressing the go button the software checks if all the needed files are present, then start the import process. A progress window is showed since the task can take few minutes. The required amount of time depends on many variables, from MLS sizes of measurements to disk transfer rates. At the end of the import process the balloon show up, it is possible to rotate the bal loon and to inflate/deflate it, which means using different ranges for the balloon radius. It is possible to color the balloon where different radius are mapped using the classic CLIO colormap shading. It is also possible to superimpose a reference balloon. The 3D analysis tool allows also to export the measured data to the most used loudspeaker directivity formats. EXPORT TO EASE EASE is a widely used software for electroacoustic simulations. Basically there are two types of source models, SPK models and GLL models. The directivity of SPK models is based on a tabular data approach, where for each frequency band (in third octave from 100 Hz to 10 kHz) there is a table of the SPL 20/33 www.audiomatica.com AUTOMATED BALLOON MEASUREMENTS WITH CLIO 10 attenuation as function of the and angles with a 5 degree resolution. The GLL (Generic Loudspeaker Library) models are based on an object oriented approach, one of the object of a GLL is the GSS source model which describes the directivity and other characteristics of the source. The GSS can be still based on the tabular data approach, but that can also store the directivity as a set of high resolu tion impulse responses with an angle resolution finer up to 1 degree. CLIO 10 can export data to create SPK or GSS source models. EASE SPK models: The SPK model is stored in a set of proprietary binary files that are editable using the EASE SpeakerBase module. The link between the measured balloon and the SPK model is a text file .xhn which contain data on the directivity of the balloon and some accessory information. The CLIO 10 3D directivity module is able to export the balloon in this format, to create an SPK model the .xhn file must be imported using EASE SpeakerBase. It must be noted that CLIO 10 is able to export .xhn files containing only magnitude data, phase data is not included. Together with the directivity CLIO 10 can export an on-axis response and the impedance in third octaves. This speed up the editing process while into the SpeakerBase. EASE GLL models: The GLL model is stored again in a proprietary binary file, the GLL model can be edited using the EASE SpeakerLab software. The source definition menu of the SpeakerLab can import set of measured impulse responses with a given resolution and symmetry. EASE SpeakerLab can import CLIO time data impulse response text files with the CLIO naming scheme, except for the fact that the filename must be “IR”. The CLIO 10 3D directivity module can automatically mass export the set of measured binary .mls impulse response files in the time data format requested by the EASE SpeakerLab. EXPORT TO CLF The CLF (Common Loudspeaker Format) is a freely available format created and supported by a group of software developers and CLF data authors. The format is based on a binary file which is compiled starting from a text file using the CLF editor software13. The approach is similar to the previously described SPK. In this case the data is again in tabular format with 5 degree resolution and third octaves from 25 Hz to 20 kHz. Detailed information can be found on the www.clfgroup.org web site. The CLIO 10 3D directivity module is able to export the balloon in the CLF v2 .tab text file format. As in the case of .xhn files, CLIO 10 can export an on-axis response and the impedance in third octaves. This speed up the editing process while into the CLF editor. 13 The CLF Editor is freely available on request from www.clfgroup.org 21/33 www.audiomatica.com AUTOMATED BALLOON MEASUREMENTS WITH CLIO 10 Figure 15 - CLIO 10 3D export form 22/33 www.audiomatica.com AUTOMATED BALLOON MEASUREMENTS WITH CLIO 10 EXAMPLE: MEASUREMENT OF THE HORIZONTAL HALF SPHERE BALLOON OF A SMALL LOUDSPEAKER BOX WITH HORIZONTAL SYMMETRY In this example we measure the balloon of a 2-way small loudspeaker box with horizontal symmetry and then we export the data to create a CLF model and an EASE GSS high resolution sound source model. Figure 16 - Small 2-Way Loudspeaker By looking at this loudspeaker it is possible to identify an horizontal symmetry, since the drivers are horizontally positioned at the center of the front baffle and the cabinet is a simple rectangular box. Figure 17 - Cabinet Coordinates Relative to the Point of Rotation 23/33 www.audiomatica.com AUTOMATED BALLOON MEASUREMENTS WITH CLIO 10 The first step is to define the point of rotation of the system and identify the loudspeaker dimensions relative to that point. In this case we choose as a point of rotation the geometrical center of the cabinet (cabinet coordinates are showed in figure 17). We arranged a setup comprising two Outline ET250-3D turntables connected to form a positioning machine, this is basically the same system showed before in this docu ment. The measurements are carried out in our laboratory, due to space constraints this measurements cannot obey the minimum source to microphone distance requirements, and their validity is limited. The distance between point of rotation and the microphone is 50 cm and the first re flection is coming from the floor, the point of rotation and microphone height is 140 cm. With this arrangement we have a reflection free environment of only 6.6 ms which means a cutoff frequency of 150 Hz. We start measuring the on-axis response of the source using the MLS&LogChirp module, in this case we choose a 16k MLS signal as stimulus. MLS - Impulse Response 4-29-2008 6.11.22 PM 0.10 Pa 0.060 0.020 -0.020 floo r re flec tion h = 1.40 m =2 .80 m direct path = 0.50 m -0.060 -0.100 0 1.5 3.0 4.5 Ax: 1.4746 ms Ay: -0.0008 Pa Az: 0.5073 m 6.0 7.5 9.0 11 Bx: 8.1356 ms By: 0.0008 Pa Bz: 2.7986 m CH A dBSPL Unsmoothed 48kHz 16K Rectangular Start 0.00ms Stop 8.13ms Figure 18 - On-axis impulse response 12 FreqLO 123.08Hz ms 14 15 Length 8.13ms As illustrated in figure 18 the time window stop time must be set to 8.14 ms, this setting will be the preset for all the polar measurements. Getting the correct on-axis position between the source and the microphone can be very difficult, especially if the microphone distance is of several meters. A trick that can be used is to repeatedly measure the response and moving the turntables with 24/33 www.audiomatica.com AUTOMATED BALLOON MEASUREMENTS WITH CLIO 10 small increment until the response is not reaching a maximum, which supposedly is the on-axis value. Another opportunity, if the source has symmetries, is to move the source 10 degree of axis along one angle, collect a measurement, move the source to the -10 degree angle, collect a new measurement and check if the two responses match. In case they do not match move the microphone or set a different turntable reference 0 angle. Given the fact that our source has an horizontal symmetry the number of measurements that must be carried out can be reduced respect the full sphere. Since we are interested in creating an EASE model we decide to use a 5 degree angular sampling. The source can be sampled over half sphere, it is possible to choose which half to measure. Here we will sample the right hemisphere, with angle ranging from 270 degrees up to 355 and from 0 and up to 90 degrees. Figure 19 - Loudspeaker horizontal symmetry The automatic procedure do not allow to do this, this is not possible to use a start angle greater than the stop angle, so we will use here a small trick to perform the automatic measurement procedure without any manual intervention. We will set the autosave as illustrated in figure 20. Then we will reset the azimuth turntable 0 position with the loudspeaker in horizontal position, such as illustrated in figure 21, notice that the axis are rotated by 90 degrees in respect to the previously defined CLIO reference system. At this point we are ready to start the automatic procedure by pressing the start but ton on the Turntables Control dialog, remember that the two turntables must be connected. Once the procedure is completed it is possible to open the 3D analysis menu and load the measured data. 25/33 www.audiomatica.com AUTOMATED BALLOON MEASUREMENTS WITH CLIO 10 Figure 20 - Autosave settings x y Azimuth turntable z 0 Polar turntable Figure 21 - Horizontal symmetry autosave start position The correct setting for the analysis of the collected data are reported in figure 22, we must use an Half symmetry and a Rotation of -90 degrees to convert the 0 measured azimuth angle to 270 degrees. 26/33 www.audiomatica.com AUTOMATED BALLOON MEASUREMENTS WITH CLIO 10 Figure 22 - 3D analysis settings The CLIO software then will check for data consistency of the file set, then pressing the start button in the Waterfall, Directivity & 3D menu will start the import process. This will take few minutes. At the end of the import process it is possible to inspect the measured data in form of directivity balloons at third octave standard frequencies (figure 23). EXPORT TO EASE HIGH RESOLUTION MODEL We export the measured data to create a GSS EASE directivity model. The GSS model is created using the EASE SpeakerLab software, which is available with the electroacoustic modeling software EASE. The EASE SpeakerLab can import set of time data impulse responses with CLIO format and naming scheme. Using the export feature of the 3D CLIO menu it is possible to create a set of text files as requested by the EASE SpeakerLab. In order to prepare the file needed by EASE SpeakerLab the Impulse Responses output format must be choose. Selecting the Enable Truncation and Truncate Text Files limit the disk space usage by saving smaller text file containing only the time data points into the valid measured time window. The settings of the Balloon Export menu are reported in figure 24. Pressing the OK button on the Balloon Export menu will start the export process, this again will take few minutes. At the end of the export process we should have a folder with the impulse responses as .txt files with naming convention: IR <phi*100> <theta*100>.txt The folder is ready to be imported with EASE SpeakerLab 14. 14 Note that the export process every .mls file in the origin folder, if the source is sampled with finer resolution CLIO will show 5 degree data on its balloon visualization but export all the measurements, i.e. with the finer resolution, in .txt time data format. 27/33 www.audiomatica.com AUTOMATED BALLOON MEASUREMENTS WITH CLIO 10 500 Hz 1 kHz 0 dB 6 12 2 kHz 4 kHz 18 24 30 8 kHz 16 kHz Figure 23 - Directivity balloons 28/33 www.audiomatica.com AUTOMATED BALLOON MEASUREMENTS WITH CLIO 10 Figure 24 - Impulse responses balloon export features We do not want here to enter into the EASE SpeakerLab details, it is interesting here to show the import data window. Importing CLIO data is very easy as the EASE SpeakerLab import feature is very easy to understand. Figure 25 - EASE SpeakerLab Import Impulse Response Window In our case the option to select are: 5 degrees resolution, Horizontal symmetry and Start From Bottom. The software check for the presence of the needed files in the se 29/33 www.audiomatica.com AUTOMATED BALLOON MEASUREMENTS WITH CLIO 10 lected folder. Pressing the import button will start the import process, at the end of the process the data is in GSS format ready to be edited into a GLL model. Figure 26 - Balloon Imported in EASE SpeakerLab In fact our procedure here generate only directivity information, some items must be added to the GSS model as power handling and impedance, but these topics are outside of the scope of the present document. Please consult software manufacturer specific documentation. When editing the loudspeaker model into EASE SpeakerLab some care must be made in drawing the case of the source, in fact here we are dealing with an ideal point source that we measured rotating around the defined Point of Rotation (POR). The data annotated in figure 17 may help to create a proper case drawing for the point source as it gives the case and POR coordinates. EXPORT TO CLF FORMAT The CLF format uses a tabular approach to store the directivity data. The CLF models are created starting from a text file which contains the directivity tables along other source characteristics. CLIO 10 is capable of automatically create a .tab text file with the measured source directivity that comply with the CLF v2 specifications. Here is it possible to use a measured on-axis response or the on-axis response of the balloon data, it is also possible to shift the level of the on-axis response to refer to the 1m/1w measurement distance and driving. It is also possible to use a .sin measurement of the source electrical impedance or, as in this example, use a nominal impedance value. Here is a small strip of the file text created by CLIO: 30/33 www.audiomatica.com AUTOMATED BALLOON MEASUREMENTS WITH CLIO 10 Figure 27 - CLF export <CLF2> <VERSION> 1 <MODELNAME> Rogers <INFOFILE> <MANUFACTURER> LS3/5 <WEB-SITE> url <DESCRIPTION> description <COLORS> <MOUNTING> <WEIGHT> 1 <MINBAND> 100 <MAXBAND> 20000 <MEASUREMENT-CONTACT> name <MEASUREMENT-EMAIL> emailaddress <MEASUREMENT-DATE> 2009-Nov-10 <MEASUREMENT-NOTE> <MEASUREMENT-ENVIRONMENT> <MEASUREMENT-DISTANCE> 1 <MEASUREMENT-INPUTVOLTAGE> <TYPE> <passive> <SENSITIVITY> 89.85 92.12 93.78 88.53 91.75 91.41 93.25 92.30 90.60 88.45 88.59 91.57 92.74 94.44 91.65 <SENSITIVITY-INFO> <IMPEDANCE> 15.00 15.00 15.00 15.00 15.00 15.00 15.00 15.00 15.00 15.00 15.00 15.00 15.00 15.00 15.00 <IMPEDANCE-INFO> <TOTMAXINPUT> <power> 100.00 <METHOD> <RADIATION> <fullsphere> 31/33 feature 94.01 91.02 90.38 92.52 88.36 90.74 90.42 91.67 89.70 15.00 15.00 15.00 15.00 15.00 15.00 15.00 15.00 15.00 <IEC-268-1> www.audiomatica.com AUTOMATED BALLOON MEASUREMENTS WITH CLIO 10 <AXIAL-SPECTRUM> <nodata> <nodata> <nodata> 89.85 92.12 93.78 94.01 91.75 91.41 93.25 91.02 90.60 88.45 88.59 90.38 92.74 94.44 91.65 <AXIAL-SPECTRUM-INFO> measurement info <BALLOON-SYMMETRY> <none> <BALLOON-ARC-ORDER> <reversed> <BALLOON-REF> <relative> <SIGN> <BAND> 100 0 -0.21 -0.67 -0.70 0.03 0.93 0.81 1.14 0.68 5.59 1.71 2.99 1.75 2.85 3.37 4.27 4.05 5.41 4.31 8.58 3.73 <nodata> 92.52 88.36 90.74 <nodata> 90.42 91.67 89.70 <nodata> 88.53 92.30 91.57 <ROTATE> 90 <reversed> 0.80 1.54 3.47 3.73 0.01 1.10 2.69 2.49 -1.15 1.27 3.86 4.14 0.72 2.42 4.76 3.50 This .tab text file must then be authored with the CLF editor/viewer, which is available on request from the CLF group. Figure 28 - Directivity data imported in CLF reader/viewer 32/33 www.audiomatica.com AUTOMATED BALLOON MEASUREMENTS WITH CLIO 10 CONCLUSIONS CLIO 10 feature a set of tools to automatically measure the 3D response of loudspeakers, analyze measured data sets and export data according to actual standards and simulation software needs. The setup of a 3D measurement is simple and do not require any assistance reducing the manual intervention to the initial setup of the system. The simple 3D visualization tool allow to check data consistency and to perform a first analysis of the results. The CLIO 10 3D export feature allow to export data into the most common formats for source simulations. REFERENCES [1] J.D'Appolito, “Testing Loudspeakers”, Audio Amateur Press, 1998 [2] “CLIO 10 User's Manual”, Audiomatica, 2009, www.audiomatica.com [3] S.Feistel and W.Ahnert, “The Significance of Phase Data for the Acoustic Prediction of Combinations of Sound Sources”, AES 119th Convention – New York, (2005 October 7-10) [4] http://en.wikipedia.org/wiki/Spherical_coordinates (retrieved 06/06/08) [5] C.Struck, S.Temme, “Simulated Free Field Measurements”, JAES, Vol. 42, No. 6, 1994 June [6] S.Feistel and W.Ahnert, “Modeling of Loudspeaker Systems Using High-Resolution Data”, JAES Vol. 55, No. 7/8, 2007 July [7] AES56-2008: AES standard on acoustics - Sound source modeling - Loudspeaker polar radiation measurements 33/33 www.audiomatica.com


![RessqM, Enhanced Version of RESSQ [Javandel et al., 1984]](http://vs1.manualzilla.com/store/data/005674408_1-e8a4b9f66c80cdc83d847a710e5b4b1f-150x150.png)