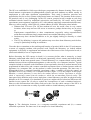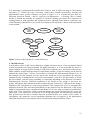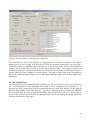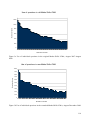
1
Reports from the πCETL
Teaching Resources & Activities Action
Group
Introduction Norton
2
1. Radiotherapy in Practice: eLearning Material on Radiotherapy Physics Parvin & Blake
4
2. OpenRad eLearing Package Parvin
15
3. Interactive Screen Experiments Hatherly, Jordan & Cayless
16
4. An Interactive Scren Experiment for Astronomy Hatherly
27
5. Use of 3D Virtual Environments in Teaching Astronomy & Physics Lucas & Kolb
29
6. The Celestial E-Sphere Lucas
36
7. Using a virtual world for teaching the motion of projectiles Lucas
39
8. 3D Immersive Screen Experiments Lucas
43
9. PIRATE -- the piCETL Robotic Astronomical Telescope Explorer Kolb et al
57
10. Software architecture for an unattended remotely controlled telescope Lucas
64
11. CAPITAL (Collection of Astronomy and Physics Images for Teaching And Learning) Lucas 73
12. The design of an image bank for astronomical images Lucas
85
13. DVD Image Banks for Astronomy and Meteorology courses Ross & Lewis
90
14. Physics in Context Timelines Lambourne
104
15. Maths Skills eBook Jordan
110
Introduction
This book is a compilation of various reports that are related to piCETL projects in
the areas of Teaching Resources and Teaching Activities. It represents the situation
in mid-2010, as the piCETL project draws to an end.
The first two reports included here are linked with the OU’s Masters modules in the
area of medical physics. As noted later, the Radiotherapy in practice package is a set
of e-learning materials which are part of the 60 CATS point course Radiotherapy
and its physics which lies within the Frontiers in Medicine strand of the OU Masters
in Science award. The report on the use of this material summarises the responses to
student questionnaires and looks at how the design approach used may have
facilitated and enhanced the students’ learning experience. OpenRad is another elearning package which has been developed within the OU to be sold externally as a
CPD resource.
A major activity within the piCETL has been the development of Interactive Screen
Experiments and other material designed to give students experience of virtual
worlds. The next six reports included here each relate to this theme. Paper 3 is a
summary report on the Interactive Screen Experiments (ISEs) themselves and is a
major review of their conception, production, use and evaluation. Many ISEs have
already been developed, and several more are at various stages of planning or
production; an example is presented here in Paper 4 of one in the astronomy area.
ISEs have been trialled in several OU courses and it is envisaged that much greater
use of them will be made in the future, for the reasons outlined in the report here.
Papers 5 and 6 continue with the astronomy theme. The first is on the development
of a 3D graphics application that has the prospect of being used in many and varied
applications in the teaching of physics and astronomy. The particular application
discussed here is that of a telescope simulator which allows students to experience
the setting up and alignment of an astronomical telescope prior to using the real thing
at an observatory. Evaluation of the application reveals the benefits it confers. The
next brief paper in this set is a report on an application which grew out of that just
described. It is an interactive, 3D map of the night sky referred to as the Celestial eSphere and has already had various uses as a teaching tool and as an outreach /
demonstration tool.
Paper 7 considers the use of a ‘virtual world’ in the teaching of projectile motion –
an archery simulator for use in a course exploring the science in sport. The final
paper in this set is a comparative review of 3D immersive screen experiments,
2
contrasting ‘real’ experiments with interactive screen experiments and immersive
screen experiments, using a simple spectrometer as an example.
A second major initiative in the piCETL has been the development of remotely
operated experiments. The next two papers therefore report on the development of
PIRATE – a robotically operated telescope situated in Mallorca and used for group
project work in the OU undergraduate teaching programme. Paper 9 summarizes
PIRATE itself, whilst paper 10 gives the background to the software development
underlying the successful operation of the hardware.
Another important activity of the piCETL within the remit of this report is the
development of image banks for use in teaching, and the next three papers in this
book all relate to this area. Paper 11, the report on CAPITAL describes how the
database to hold the images has been designed and implemented, whilst the paper 12
reports on a particular use for a bank of astronomical images. Paper 13 reports on
how these image banks have been used in two OU Level 1 courses on Astronomy
and the Weather respectively.
The final two reports in this book are concerned with a project to produce ‘science
timelines’ and a Maths Skills eBook. The timelines project summarized in paper 14
focuses on the use of the history of physics as a tool for enriching and enlivening the
teaching of physics itself. The timelines provide basic chronological information
concerning developments in physics; setting them in the context of other scientific
and historical events This maths skills e-book comprises a hyperlinked e-book which
is supported by a series of online interactive questions. It is designed to provide
mathematical preparation for students embarking on one of the OU’s Science Short
Courses, or to be used as revision material before embarking on a larger course such
as Exploring Science. The report includes an extensive evaluation of student
feedback to using the resource.
Andrew Norton
June 2010
3
Radiotherapy in Practice: e-Learning material on
Radiotherapy Physics
Canan Blake, Institute of Educational Technology
Elizabeth Parvin, Department of Physics and Astronomy and piCETL
ABSTRACT
This multimedia learning environment has been designed for a course of the UK Open University’s
MSc in Science programme. It provides an introduction to radiotherapy for students with a broad
range of backgrounds. It enables students with no experience of radiotherapy to have a better
understanding of the working environment and working practices in the field by providing an
opportunity to observe the procedures and machines in use in hospitals and make direct links
between them and the underlying physics which is taught in the course.
The evaluation of the multimedia learning environment was carried out in two phases. The first
phase involved inspecting the e-tutorial and its interface by going through a set of tasks to evaluate
its understandability and ease of learning, a technique generally called Cognitive Walkthrough.
The second phase was user evaluation. i.e. evaluating what users get out of it and what kind of
issues arise, if any, when they are using it. To collect data for the second phase we used online
questionnaires at the beginning of the course and telephone interviews when students finished the
course.
Although the preparation of the e-learning material involved a large amount of time and effort it
proved very popular with students, particularly those without previous hospital experience and we
believe it made a substantial contribution to the success of the course.
In this paper we shall describe the e-learning material and present the results from the study with a
view to providing ways of understanding how the design approach (combination of video
sequences supported by text, diagrams and animations) may have facilitated and enhanced
students’ learning experience.
Keywords: multimedia learning, distance learning, radiotherapy, evaluation
INTRODUCTION
The ‘Radiotherapy in Practice’ e-learning material that has been evaluated in this study forms part
of the course material for the Open University’s Masters level course ‘Radiotherapy and its
physics’. This 60 CATS point (30 ECTS points) course is part of the Frontiers in Medicine Strand
of the OU Masters in Science and can be taken as part of the MSc in Medical Physics.
4
All the OU Masters in Science courses are open to anyone with an honours degree in science or a
science-related subject. The students therefore come from a wide range of backgrounds; in the case
of this course some of them will be working in a hospital environment, although not necessarily in
radiotherapy, others will be graduates in some other science with no experience of radiotherapy at
all. This e-learning material was prepared for students who are not familiar with the work of a
radiotherapy department and aims to give them an introduction to the equipment and procedures
used in a modern hospital. It also has potential use as Continuing Professional Development (CPD)
material for a variety of health professionals.
The material consists of video clips of the different activities in a radiotherapy department, each
one being linked to further information in the form of text, diagrams and animations. The video
was filmed in the Royal Berkshire Hospital, Reading with the invaluable assistance of the staff of
the radiotherapy department. The first sections of the material describe the roles of the staff
involved and discuss the clinical aspects of radiotherapy treatment; later parts concentrate on the
science and technology.
Overall cost of producing the teaching material is of the order of UK£ 20,000. This included the
cost of video filming, sound recording, graphic design, software development, and consultants’
fees.
Content of the material
The e-learning material consists of seven main sections, preceded by a Welcome section; details are
given in Table 1. The Welcome and Introduction must be completed before the student can proceed
to the remainder of the material. Each subsection has a video clip which lasts approximately five
minutes. Down the right hand side of the screen there are links to explanatory text, diagrams or
animations. Figure 1 shows two examples of the screen. The links are highlighted at the appropriate
point in the video; the student can choose to go to those links at that moment, in which case they
can return to the video at the point at which they left it, or the student can study the material in the
links at a later time. The glossary, a searchable pdf file, is always available.
The programme has to be installed on the student’s own computer before operation and the
student’s progress is tracked and the record stored on their computer. The record can be erased by
the student if required.
The total time allocated for study of this material is up to 15 hours, the largest part of that being
during the first few weeks of the course. During that introductory period of the course the students
are recommended to watch all the video sequences to get an overall feel for the different areas of
radiotherapy; during the later part of the course, where they focus on individual topics, they are
recommended to revisit the appropriate section, watch the video and use the links to find out more
information.
5
Table 1: Breakdown of the material
Main section
Sub-section
Welcome
Introduction
Comments
Audio and stills. Must be completed before
proceeding
Introduction
Radiographer
Medical physicist
An introduction by an oncologist, with short
‘vignettes’ by members of the different
professions explaining their role and the
training they have undergone
Clinical Technologist
Oncologist
Clinical
Perspectives
Dealing with the patient
Treatment success
Teamworking
This section aims to put the physics of
radiotherapy into its clinical context. The
oncologist featured is a specialist in prostate
cancer and he has used this as an example.
Treatment regimens
Prostate cancer
The last word (a comment
on the future)
Treatment
Planning
Mould room
Simulator
This section follows the planning process from
imaging through to the assessment of the
completed treatment plan.
Contouring
Planning
The DVH
Teletherapy
Linac
Inside the linac
Quality Assurance
This section deals with the physics and
technology of the linear accelerator and ends
with a video clip showing the treatment
procedure for two patients
Beam parameters
Treatment (lung)
Treatment (head/neck)
Brachytherapy
A demonstration of the different methods of
brachytherapy, especially high dose rate (HDR)
treatment
Unsealed
sources
A demonstration of treatment with Iodine 131
for thyroid cancer
Dosimetry
A review of the different methods used for
measuring dose
6
Figure 1: Two typical screens. The links on the right hand side are highlighted at the appropriate
point in the video. Note the link to the glossary which is a pdf file.
7
EVALUATION
In any educational evaluation the aim is to assess and improve the effectiveness of whole courses
and their various components and identify the influences and effects of various contextual factors.
To achieve this there is a variety of rationale, assumptions and methods that can be employed (from
behaviourist, measurement oriented paradigm to integrative, mixed-methods approach-including
remote evaluations, see for example). We applied a mixed methods approach by using techniques
that were suitable for distance learners. (See for example Johnson and Onwuegbuzie, 2004 and
Greene and Caracelli, 1997 for mixed methods approach).
We evaluated the learning materials with the aim of
(1) determining their usefulness as a way of helping students with quite diverse backgrounds;
(2) investigating students’ expectations and opinions about the use of this particular approach
in familiarising themselves with techniques and approaches used in radiotherapy practice in
hospitals.
The evaluation activities were carried out in two phases. The first phase involved inspecting the etutorial and its interface by going through a set of tasks to evaluate its understandability and ease of
learning, a technique generally called Cognitive Walkthrough. It was carried out by the first author
as an external evaluation activity.
The main aim of the Cognitive walkthrough is to evaluate the design of a user interface. It requires
the use of task scenarios to emphasize the users’ cognitive process and model to guide analysis.
Although it is difficult to standardize or categorize rationale for design changes and there is also an
inherent bias because of task selection, cognitive walkthrough is a useful technique to carry out to
make sure known usability problems are addressed before users are asked to evaluate it (see Lewis
and Rieman, 1993; Newman and Lamming, 1995, Preece et al, 1994).
The findings from this first phase of the evaluation, mainly usability related issues, were made
available to the course team (the group of people who design and develop an Open University
course) and necessary revisions were carried out before the resources were sent to students.
The second phase was user evaluation. i.e. evaluating what users get out of it and what kind of
issues arise, if any, when they are using it. To collect data for the second phase we used online
questionnaires at the beginning of the course. As Open University students are working at a
distance, we also arranged telephone interviews with students when they finished the use of the
multimedia materials.
Questionnaires
The questionnaire that was used at the beginning of the course aimed to obtain views and factual
information from users. It contained both closed questions, open-ended questions and Likert type
questions in three sections. These sections were covering
(1) the background information about the students,
(2) the effectiveness of the multimedia learning material and
(3) the interactivity/usability aspects of it.
We provided the questionnaire online, using the Open University’s online survey system (ELSA) .
Students just needed to click on the URL in their email and could easily fill in the questionnaire.
See Figure 2 for a screenshot of the online questionnaire.
8
Figure 2. A screenshot of the online questionnaire.
Results from the questionnaire
Twenty seven students answered the questionnaire. This is slightly higher than 50 percent of the
course population. Students were contacted using e-mail and online reminders and also by a
message from the Course Team chair on FirstClass (the computer conferencing system used in the
many of the Open University courses) 3 weeks after the original email date.
Students had a wide range of professional backgrounds.. A general classification of the jobs
reported by students showed that the majority of the students were working in a related area (as
Clinical technologists (N=11), Radiographers (N=4), Medical physicists (N=1) Clinicians (N=2),
Teaching (N=2) and others (N=7).
Most students had some experience of radiotherapy mainly as part of their job, although the nature
of this experience varied with the job. In addition, some students had experience as a patient or a
relative of a patient. However one third of students reported that they did not have any previous
experience of radiotherapy (Please note that these categories of experiences are not mutually
exclusive).
The majority of students said that they were studying the course to improve their knowledge about
radiotherapy and/or to get the named degree, MSc in Medical Physics. Other reasons stated were
interest / enjoyment of the subject matter, advancement of their career and improving skills in
9
dealing with radiotherapy related activities. The majority of students believed their study of the
course was closely linked to their professional life.
Expectations from the course
0
5
10
15
20
25
Improve knowledge
Degree
Interest / enjoyment
Advance career
Improve skills
No. of students
Figure 3. Students’ expectations from the course
In the second part of the questionnaire we asked students about their use of the multimedia learning
materials. They were asked how many times they used each section and whether they found it
worthwhile and enjoyable. The e-tutorial had seven sections:
There was not a significant difference between the students’ study of the different sections of the etutorial. On average slightly more than half of the students reported studying them more than once
and more than three quarters of students reported finding all sections worthwhile during the early
part of the course. Slightly less than half of all students said they found them enjoyable. The
majority of students reported that they studied the e-tutorial at home (N= 24), and only three
students were studying both at home and at work.
When asked if they had learned anything new after studying the e-tutorial, the majority of students
(N=24) said they had learned something new. Even students who were familiar with the material
indicated that it helped with some aspect of their study. Some comments from students are
presented below:
“… it enables students to view a Radiotherapy Department in action demonstrating the interaction
between various health care professionals. Allowed me to see the new techniques employed in
areas such as treatment planning.”
“As I am not currently working in Radiotherapy / Radiobiology these e-tutorials give me a good
background and complement the texts.”
“… just summed up what I had read – a little about dosimetry and physics.”
10
“I knew nothing about radiotherapy prior to staring this course and the e-tutorial is a much easier
method of learning than reading books!”
“It gave me a great overview of radiotherapy and taught me a lot about the different types of
people who work in a hospital radiotherapy department which I knew very little about before.”
We also asked students what was the best thing about the e-tutorial as a learning tool. Most
students commented on the way the learning material was different from traditional learning
resources in terms of its visual properties, interactivity and provision of several resources (glossary,
animations, and transcriptions) that were linked interactively.
Best feature as a learning resource
0
2
4
6
8
10
12
14
16
Visual/interactive
approach
Ease of use
Good overview
Other
No. of students
Figure 4. Best features of the learning resource
When asked about the least helpful aspect of the learning materials many students did not have
anything to report as negative in terms of its potential to promote learning (N=11) and three
students said that it could cover more areas and could be longer. The negative points mentioned,
for the most part, were minority complaints about lack of interactivity and difficulty and/or
simplicity of certain sections.
In the last part of the questionnaire we asked students to rate usability and interactivity aspects of
the learning material. Almost all students rated the following interface aspects as good or very
good:
The layout of the items on the screen
Diagrams / Animations
Glossary / Definitions
Video files
Audio
Transcripts
11
Other text files
Icons
Ease of navigation
Transcripts of audio files accompanying the videos and the glossary were used by respectively 21
and 25 students. Given that we were not aware of any students on the course with hearing
difficulties, this was a surprisingly high number – it seems that students used the transcript to
navigate within the video on a second studying (see comments overleaf)
Table 2. Students’ rating of interaction with the learning material.
It did not always do what I
was expecting:
It
has
good
quality
presentation
It is easy to operate
It helps you learn
It stimulates thought
It reduces study time
It reduces study components
It helps your course work
It is good for interdisciplinary
work
The instructions and prompts
are clear and understandable
The help given by the etutorial is very relevant
There are too many steps
required to get something to
work
SA
A
5
D
20
7
20
9
13
6
3
10
9
16
13
18
9
9
13
17
2
12
19
8
1
8
18
1
10
15
1
1
SD
2
2
21
2
1
4
As can be seen from Table 2 students stated that their interaction with the learning materials were
straight forward, useful and helped by clear and understandable instructions.
When invited to write down their general comments on the learning materials the majority of
students wrote positive comments, although there were two students who had technical problems.
Some comments from different students are presented below.
“I think the presentation is good. It is in an easy to follow logical order which relates well with the
course programme.”
“The glossary was very good - I would have liked it to be expanded. It would be useful to have
direct access to the glossary.” [There is direct access to the glossary]
“The presentation was good. Having different individuals present their own area of expertise kept
it from becoming boring - which could have happened if 1 person tried to describe everyone’s
roles.”
12
“Transcripts were very useful. This allowed me to view the video and read the transcript
highlighting areas that I required to revisit. After reading the transcripts I could then watch the
video concentrating on the areas I require to revisit. “
Telephone interviews
At the end of the course we contacted students who agreed to be interviewed about their experience
of ‘Radiotherapy in Practice’ multimedia learning materials at the time of filling in the online
questionnaire. 15 students agreed to be interviewed but we could only reach 10 students due to
reasons like international mobile numbers or getting no answer.
During the interview we asked students questions related to their use of the learning resource and
the course in general. Questions included:
• whether they have studied the resource again after the initial study at the beginning of the
course.
• what aspects were most valuable to them
• any changes they would like to see in the resource, and
• if their expectations of the course were met.
Almost all the students said that they studied the learning material again after their initial study at
the beginning of the course. The videos of different radiotherapy departments were found to be
very useful for students with limited background in radiotherapy practice. Even students with some
background in radiotherapy indicated that being able to ‘see’ what happens in a radiotherapy
department where they don’t have any role was very useful for them. For them the sections on
treatment planning and physics of radiotherapy were valuable.
CONCLUSION
As mentioned previously a huge amount of time and effort went into design and development of
the learning material. However students were extremely happy with the learning material
specifically and the whole course in general. We believe that, by demonstrating the practical
aspects of radiotherapy and linking them to the underlying physics and technology, this e-learning
material contributed to the success of the course. This study shows that distance teaching of
subjects such as this can be greatly enhanced by the use of multimedia material.
Acknowledgements
The authors would like to acknowledge support for the production and evaluation of this tutorial
from the Open University’s Pi-CETL and also the enormous contribution made by the staff of the
Royal Berkshire Hospital, especially Andrew Doggart, medical physicist.
REFERENCES
Greene, J. and Caracelli, V.J. (1997) Defining and describing the paradigm issue in mixed method
evaluation. In J. Greene and V.J.Caracelli (Eds). Mixed method evaluation: the challenges and
benefits of integrating diverse paradigms, New Directions for Evaluation, 74: 5-17.
Johnson, R. and Onwuegbuzie, A. (2004) Mixed methods research: a research paradigm whose
time has come, Educational Researcher, 33(7): 14-26.
13
Lewis, CH. and Rieman, J. (1993) Task-centered user interface design: A practical guide.
Electronically published book available at http://hcibib.org/tcuid/.
Newman, W.M. and Lamming, M.G. (1995). Interactive system design. New York: Addison
Wesley.
Preece, J, Rogers, Y., Sharp, H., Benyon, D., Holland, S. and Carey, T. (1994) Human-Computer
Interaction. New York: Addison Wesley.
14
OpenRad e-learning package
Elizabeth Parvin, Department of Physics and Astronomy and piCETL
The OpenRad package has been developed to fulfil a need for teaching on radiation protection for
both our own students and for all levels of staff in hospitals, clinics, dental surgeries, vets, etc. It is
intended to replace CALRAD, a teaching package produced in 1997 by a consortium led by
Dundee University. CALRAD had become out of date in that the software environment was noninteractive and low resolution, and also because the radiation protection guidance cited therein has
been replaced by new 1999 and 2000 legislation. A thorough review of other available materials
showed there to be no really suitable package available and yet there is a strong demand for
radiation protection teaching.
The OpenRad project aimed to utilize OU’s teaching expertise in medical physics to develop an elearning teaching programme for OU courses that can also be sold externally as a CPD package.
This first stage has been developed at a basic level; with the ultimate aim of adding two further
levels at a later stage with external funding.
The product teaches basic radiation physics and the principles behind the safe handling of
radioactivity i.e. radiation protection.
It consists of interactive teaching material covering:
•
Basic atomic physics
•
Radiation quantities and their measurement
•
Biological effects and radiation risk
and includes questions to test the student’s understanding of the material.
OpenRad is initially being delivered as a downloadable .exe file for OU students or on DVD. It is
envisaged that, at a later date, it will be available to download as a commercial package on the
internet.
The academic staff working on the package were Liz Parvin, Jamie Harle (central academics), Liz
Berry (AL) and the animations etc. were developed by Rob Lucas of the pi-CETL.
E.M. Parvin April 2010
15
Interactive screen experiments – innovative virtual
laboratories for distance learners
P A Hatherly1,2,4 , S E Jordan1,2 and A Cayless2,3
1
Department of Physics and Astronomy, The Open University, Walton Hall, Milton
Keynes MK7 6AA, United Kingdom.
2
piCETL, The Open University, Walton Hall, Milton Keynes MK7 6AA, United
Kingdom.
3
The Open University in Scotland, 10 Drumsheugh Gardens Edinburgh EH3 7QJ,
United Kingdom.
4
Author for correspondence: [email protected]
Abstract. The desirability and value of laboratory work for physics students is a
well-established principle and issues arise where students are inherently remote from
their host institution, as is the case for the UK's Open University. In this paper, we
present developments from the Physics Innovations Centre for Excellence in
Teaching and Learning (piCETL) in the production and technology of the virtual
laboratory resources, Interactive Screen Experiments, and the benefits and
drawbacks of such resources. We also explore the motivations behind current
implementation of Interactive Screen Experiments and examine evaluation strategies
and outcomes through a series of case studies.
Key words: virtual laboratory, distance learners, laboratory training,
PACS 01.40.Fk, 01.50.ht, 01.50.hv, 01.50.Lc, 01.50.Qb
European Journal of Physics, 30 (2009) 751–762
1. Introduction
The concept and implementation of virtual laboratory resources in the physical sciences has many
consequences. These relate to the purpose a virtual laboratory is seeking to address, the experience
of both students and tutors, and the suitability of an activity. In this paper, we explore these
concepts in the context of a particular class of virtual laboratory, the Interactive Screen Experiment
(ISE), pioneered by Kirstein [1,2] and Schumacher [3], introduced to the UK as the Reality Viewer
by Bacon [4,5] and now being developed at the UK Open University (OU) in partnership with the
University of Reading through the HEFCE funded Physics Innovations Centre for Excellence in
Teaching and Learning (piCETL) initiative [6]. Additionally, we will examine how, and for what
purpose, these resources have been incorporated into OU courses, and summarise evaluation in a
selection of case studies.
16
The OU was established in 1969 to provide degree programmes by distance learning. There are no
formal entrance requirements for undergraduate courses and most students are adults, usually in
employment or with other significant responsibilities. Their study is therefore part-time and
opportunities for face-to-face contact with personal tutors are limited. The situation in the sciences
for practical work is very challenging. In the OU context, practical work is taught at week long
residential schools hosted by traditional universities and staffed by OU tutors, and by home
experiments (some apparatus supplied by OU, with students supplying common household items).
However, such a strategy, whilst effective, cannot address all issues. Particular points include:
• Distance/lack of access (The OU has students all over the world, some in very remote
locations; others may not have full access to resources, perhaps because they are in prison
or
hospital);
Employment responsibilities or other commitments (especially caring responsibilities)
mean that some students simply cannot attend conventional laboratory sessions;
• Students may have declared disabilities or be just slightly lacking in dexterity or visual
acuity;
• The OU, by definition, is open to all; students may never have done laboratory work before,
or may be particularly lacking in confidence.
Given the above constraints on the teaching and learning of practical skills in the OU environment,
a means of engaging students with practical work outside the laboratory (or indeed without
equipment) is necessary to supplement and enhance the effectiveness of the real practical work, or
(where unavoidable) to act as a replacement.
Before discussing the ISE concept in detail, it is necessary define what is meant by a virtual
laboratory, understand what value it can bring and, importantly, what it cannot (and indeed ideally
should not) do. In the most general terms, a virtual laboratory is a computer-based activity where
students interact with an experimental apparatus or other activity via a computer interface. Typical
examples include a computer-coded simulation of an experiment, whereby a student interacts with
programmed-in behaviours, and a remote-controlled experiment where a student interacts with real
apparatus via a computer link, yet the student is remote from that apparatus. The latter case is
distinguished from a computer-controlled experiment, where a student will directly control an
apparatus in his or her vicinity via a computer interface (figure 1). For the purpose of this paper
therefore, a virtual laboratory is one where the student interacts with an experiment or activity
which is intrinsically remote from the student or which has no immediate physical reality. The
latter part of this definition may seem to imply that a virtual laboratory can have no physical reality
behind it at all. For example, in a simulation of gravity we might code for behaviour different to the
familiar inverse square law (if only to explore the consequences of such a simulated universe).
However, this disconnection with reality need not be the case; the whole concept of the ISE is to
provide as close a connection to reality as possible within a virtual laboratory environment.
a
b
Figure 1. The distinction between (a) a computer-controlled experiment and (b) a remote
controlled experiment. The latter case is an example of a virtual laboratory
17
It is important to understand the benefits that resources such as ISEs can bring to the learning
experience [7]. Within the Open University context these include accessibility, training and
augmentation; some specific examples are given in figure 2. It is of particular note that one
frequently perceived benefit – that of replacing real laboratories – is missing. This is simply
because it should not normally be regarded as a benefit. Nothing can replace the experience of
working hands-on with apparatus and equipment, hence, although better than no experience, the
virtual laboratory should not be perceived as providing a full experience, unless such replacement
is unavoidable.
Geographically
remote
students
Advanced
personnel
development
Accessibility
Reduce
hazards and
risk
Build
confidence
Training
Introduce new
instruments or
techniques
Address visual
or other
impairment
Augmentation
Reliability
Unstable or
complex
set-up
Figure 2. Some of the benefits of a virtual laboratory
2. The ISE concept
In its broadest sense, an ISE can be defined as a highly interactive movie of an experiment, filmed
as that experiment was being performed. By highly interactive, it is not meant that the movie is
simply capable of being moved forward or backward at different rates; this limited interactivity,
whilst valuable, would curtail the range of experiments possible. A specific example can be used to
illustrate the point. Figure 3 shows a screen-shot of a simple ISE demonstrating Hooke's Law. In
this example, the user interacts with the movie (the interactive screen experiment) by using the
computer mouse to manipulate the on-screen representation of the dial. The dial rotates as would
the real example, with the spring extending or contracting depending on the direction of rotation.
Simultaneously, the force indicated (equivalent to the tension in the spring) is shown by the
pointer. Moving the dial controls the frame-to-frame motion of the movie, with each frame being a
snapshot of the experiment as it was being performed. This example also serves to strengthen the
distinction between ISEs and coded simulations. In the simplest case the behaviour of the spring
might be programmed using a straight-forward Hooke’s Law case with no element of nonlinearity.
In the case of the interactive screen experiment though, the images presented on the screen are
taken from a real experiment, recorded as it was being performed. The interactivity (turning the
dial) governs how the movie switches between recorded frames as a result of user action. In
consequence, the interactive screen experiment illustrates the real physics of the phenomenon
rather than an idealised representation and it will inherently include nonlinear effects.
18
Figure 3. An example of a simple interactive screen experiment.
3. Using and evaluating ISEs
ISEs can be put to a variety of uses depending on the requirements and context of the learners and
of the learning outcomes of the courses in which they are included. In this section three uses of
ISEs in Open University courses will be examined through case studies.
For each ISE designed for Open University use, evaluation needs to address the following
questions:
• Are students able to use the ISE effectively and efficiently?
• Are any instructions provided appropriate and easy to use, or is it appropriate that the ISE has no
instructions?
• Are there any bugs or other flaws in the software?
• How do students perceive and react to the ISE?
• Does the ISE achieve its intended aim, for example enabling the student to complete assessment
tasks associated with the activity the ISE is supporting?
Wherever possible the evaluation is objective – recording and observing what students actually did,
not what they say they did. Since it may only be possible to observe a small number of students in a
controlled environment, it is frequently appropriate to make use of qualitative research
methodologies.
3.1. Case study 1 - S104 Exploring Science
S104 Exploring Science is the OU's new flagship level one course, delivered for the first time in
2008, providing an introduction to the physical, life and Earth sciences. Students study at a distance
using provided course materials (books, DVDs etc) as well as on-line support and assessment. One
aspect of the course is the inclusion of experiments performed at home by students, using both
readily available household items and more specialist items provided by the OU.
One experiment, completed approximately one third of the way through the 9-month course,
requires students to set up a simple spectrometer for themselves, using a diffraction grating that is
provided, a paper protractor that can be downloaded from the course website and various
19
household items (e.g. light bulbs, cardboard, drawing pin, pin, cotton). Most students find the
experiment useful and enjoyable, with the following comments being typical of many:
• "I really enjoyed this experiment. I was surprised at how interesting and successful it was. I even
got my parents to observe the difference in the spectrums of the bulbs, and was able to explain to
them how the energy-efficient bulbs work. It was good because I was able to share my new
knowledge." (S104 student)
• "[students] are normally quite blown away that you can look inside the atom with just day to day
equipment…" (S104 tutor)
However, the experiment requires some skill and dexterity to set up and requires moderately high
visual acuity. Some students are therefore unable to perform it. In addition, students in prison may
be forbidden access to some of the required household items. Therefore an ISE version of the
experiment has been produced (figure 4) for download from a hidden part of the course website or
as an executable file on CD-ROM. Students who are unable to perform the real experiment for
themselves are advised to contact their tutor, who will arrange access. Other students are not told
that the ISE exists, since it is preferable that students perform the real experiment wherever
possible.
Figure 4. An ISE representation of the S104 diffraction experiment
Students need to use the ISE by themselves, without direct supervision from a tutor, so a set of
brief instructions has been produced. However students are advised that in general they should just
follow the instructions given to all students in the course text (because they are, after all, doing the
same experiment, and keeping the experience as close to reality as possible is desirable). Tutors are
given guidance on how to support students in using the ISE should they have any queries and they
are also given guidance on how to mark any assignments where the student's report is based on
their use of the ISE.
3.1.1. Evaluation Methodologies.
Evaluation of the S104 ISE was via two methodologies; monitoring of use and observation in the
OU's Institute for Educational Technology (IET) Usability Laboratory.
For the presentation of S104 which started in October 2008, the students' performance of the
diffraction grating experiment is to be assessed in a tutor-marked assignment. Of the 1600 students
20
studying this presentation of the course, approximately 20 (including 8 in prison or secure units)
needed to use the ISE. Feedback from students and tutors will be analysed to discover; students'
reasons for using the ISE, whether they were able to interact successfully with the ISE, whether the
instructions were clear and appropriate, and whether students who used the ISE were able to
complete the related assessment tasks as successfully as those who performed the real experiment.
The IET Laboratory was used to investigate the ISE’s usability in a controlled setting. Quesenbery
[8] identifies the 5 dimensions of usability as effectiveness (the completeness and accuracy with
which users achieve their goals), efficiency (the speed with which users can accurately complete
their tasks), engagement (the degree to which the product is pleasant and satisfying to use), error
tolerance (how well the design prevents errors or helps with recovery from those that do occur) and
ease of learning (how well the product supports initial orientation and subsequent use).
Following accepted practice for usability laboratory evaluation (see for example [9] and [10]),
participants interacted with the ISE without assistance other than an initial briefing. They were
however provided with printed guidance notes. The participants' interaction with the ISE was
observed live and recorded for subsequent analysis (figure 5). A verbal think-aloud protocol was
used, whereby the participants were asked to talk about what they were doing or trying to do. After
the evaluation session itself, each participant was asked to comment retrospectively on the reasons
for their actions and on their reaction to the ISE.
Figure 5. A screen-shot of a recorded IET Usability Laboratory session.
3.1.2 Early findings from the IET Usability Laboratory.
Six volunteer participants (two students taking S104 at the time of the study, and four tutors) were
observed as they attempted the ISE. The outcomes will be presented in fuller form in a future
paper, and are here discussed in summary.
Students and tutors found the ISE easy to use, and made comparisons with the real experiment,
noting a connection between the ISE and reality. On the whole, participants found the ISE and
instructions clear and accessible (a cosmetic issue surrounding accessing the ISE via a web browser
was identified and addressed). An issue arose because two blue spectral lines were visible in the
grating images in the ISE, whereas the course text described just one such line. The source of this
discrepancy was traced to the spectral response and sensitivity of the camera used in imaging the
21
spectrum, which differed significantly from that of the human eye in the blue region. Hence, lines
which are distinctly blue and violet to the eye both appear blue in the images. This issue is now
explained and clarified in the ISE instructions to avoid confusion but other aspects are deliberately
not explained, to enable students to pursue their own investigation as they would if doing the real
experiment.
3.2 Case Study 2 - SXR103 Practising Science.
SXR103 Practising Science is a one-week level 1 residential school course. The primary aims of
the course are to:
• introduce the nature of practical work in the laboratory and in the field, and the skills of
recording, reporting and interpreting data;
• develop confidence in working with a variety of laboratory and field equipment and
techniques;
• introduce literature and web-based research;
• develop team-working, problem solving and oral communication skills.
In many ways, SXR103 is the experimental partner to S104, in that the physical, life and Earth
sciences are addressed in a way which emphasises the unity of science. For example, the school
does not comprise pure physics, chemistry, biology and Earth science laboratories, but rather takes
a more integrated approach. In particular, one activity involves measuring low levels of
radioactivity in rocks, combining skills in physics and Earth science; another involves the use of
spectroscopy in environmental analysis.
For most students, SXR103 represents their first encounter with experimental science, an encounter
which for some can prove daunting. A particular concern is the students' lack of familiarity and
confidence with experimental equipment; it is such an issue that ISEs are designed to address. To
examine the effectiveness of ISEs in developing confidence and competence at residential school,
an ISE based on the setting up and calibration of a simple grating spectrometer was created to assist
students in the environmental analysis laboratory (figure 6(a)). The ISE is highly structured, taking
its cue from the workbook students are provided with for the environmental analysis laboratory.
The first steps are to set up the spectrometer by focusing the telescope and collimator. The
advantage to students at this point in the ISE is a visualisation of what "in focus" means in the
spectrometer context; to ensure this, the ISE is structured to give constructive feedback, and to
require correct set-up before the student can proceed to the calibration section. As in the real
activity, calibration uses an intense sodium discharge lamp. A consequence of the intensity is the
presence of flares in the spectrometer view (figure 6(b)) which, to the inexperienced eye, may be
mistaken for true spectral lines. Since ISEs are based on images from real experiments such
imperfections are automatically present. Students can therefore gain intangible experience, which is
often difficult to describe without examples, before encountering the real spectrometer.
22
a
b
Figure 6. An ISE illustrating the setting up and use of a simple grating spectrometer. (a) An
introductory screen allowing familiarisation with components. (b) Taking measurements with the
spectrometer ISE, showing the presence of flares.
3.2.1. Evaluation Methodology.
A typical residential school day comprises laboratory or field trip activities during the day, and
tutorials and workshops in the early evening. The spectrometer ISE was made available as an
optional workshop activity over several evenings (limited to five students per session), to which
students about to perform the environmental analysis laboratory were encouraged to come.
Students were observed as they were working through the ISE and encouraged to complete a short
survey concerning the usability and the benefits of the ISE.
Observations and responses from students were of value, but the ultimate test of the value of ISEs
in developing confidence and competence is in the real laboratory. To this end, students who
participated in the ISE workshop were followed up in the environmental analysis laboratory and
their response to the real spectrometer in the light of the ISE experience evaluated through brief
interviews. As with the S104 study, numbers were insufficient for a statistically significant
analysis, hence the outcomes should be viewed as qualitative.
3.2.2. Evaluation Outcomes.
The survey was structured as a series of objective questions in four categories; starting the
spectrometer ISE, setting up the spectrometer, taking measurements and the value of the ISE. In
each of the four categories, the responses were overwhelmingly positive. Students were able to
access the ISE, using both on-screen and printed guidance. It was interesting to note that a number
of students needed to perform the setting up more than once to get a satisfactory result - illustrating
the connection to a real experiment. The ability to make a mistake in this way illustrates the value
of an ISE over a simple instructional manual in that making mistakes at the familiarisation stage
means that the likelihood of students repeating the error in the real experiment is reduced. This
outcome was emphasised in the final section of the survey, where students reported both an
improvement in confidence for the forthcoming laboratory, and that they had data taken by
themselves from the ISE to check against the real experiment.
When students were interviewed following their experience in the laboratory, the value of the ISE
was borne out through comments such as: "I knew what I was looking for [when using the
spectrometer]". These comments addressed the use of the equipment (students were familiar with
the various components of a spectrometer), taking measurements (measuring angles using a
Vernier scale had been introduced) and observation of spectral lines (students were aware of the
difference between real spectral lines and optical artefacts).
23
3.3 Case study 3 - SXR207 Physics by Experiment
SXR207 Physics by Experiment is a one-week residential physics course in which participants
carry out a variety of laboratory activities appropriate for second level physics students. The
primary aim of the course is to develop practical laboratory and data handling skills. To this end,
SXR207 is centred around four separate laboratory experiments, which are supported by lectures,
workshops and tutorials. Students spend a total of six hours in each of the four practical experiment
sessions. Subjects covered include magnetic fields and forces, electrical oscillations, the Compton
effect, and a variety of short experiments based mainly on wave phenomena.
Because time in the laboratory sessions is limited, the use of ISEs was considered as a means of
preparing students for the laboratory work. Of the four experiments, the Electrical Oscillations
Laboratory was chosen for this trial because it involves the most complex measuring equipment.
This work revolves around measurements made on inductors and resonant circuits using a standard
analogue oscilloscope. The large array of controls on a typical oscilloscope can be very daunting to
an inexperienced student; a large percentage of students will not have previously used such an
instrument. Based on past experience, such students tend to spend a significant proportion of their
time learning how to operate the oscilloscopes. This can take a significant fraction of laboratory
time. A typical comment from experienced tutors is that in many cases, the measuring equipment
was getting in the way of the students being able to work on the actual learning objectives of the
experiment. The objective of the trial was therefore to prepare the students for the measurements
that they would be required to make with the oscilloscope, thus allowing them to concentrate on the
physics and maximising their use of laboratory time.
Another advantage of choosing this experiment was that a suitable software package was readily
available. The Virtual Oscilloscope [11] is an online package developed by the Technical
University of Berlin. This is based on a typical oscilloscope very similar to the model used in the
SXR207 Electrical Oscillations Laboratory and is made available for non-commercial purposes.
The Virtual Oscilloscope package includes an online tutorial, but experience from a limited trial in
the previous year indicated that students needed additional guidance relating specifically to the
laboratory work that they were about to carry out. A scripted activity based around the skills and
measurements specifically required for the oscillations experiment was therefore developed for use
with the Virtual Oscilloscope. This activity involved the students making various measurements
on signals provided within the software package, and was intended to take approximately 30
minutes.
3.3.1. Evaluation Methodology.
In the week of evaluation, the Virtual Oscilloscope activity was offered to students in parallel with
an existing computer workshop. Of the 65 students registered on the course, 28 elected to take part
in the trial. Most stated that they chose the activity because they had little or no previous
experience of using an oscilloscope. All students who took part did the online activity before the
actual practical laboratory.
Evaluation has been based mainly on the comments of two experienced tutors who have run this
laboratory on a number of occasions in previous years, and who were therefore very familiar with
the usual timings and rates of progress through the laboratory. These tutors were asked to comment
on the students' progress compared to other years.
3.3.2. Evaluation Outcomes.
Both tutors commented that the students appeared more confident in using the oscilloscope than
usual. They also stated that there was a marked decrease in the number of students asking for help
24
or guidance. Tutors teaching this laboratory would normally give introductory demonstrations on
how to use the oscilloscopes. However, because the students had grasped the basic principles from
the online activity, these demonstrations were not required this time and the students were able to
get on straight away with the actual laboratory work and measurements.
In this respect, the use of the Virtual Oscilloscope has succeeded in its objectives of training the
students in the use of the measuring equipment and allowing them to concentrate on the physics
content of the laboratory work. Based on this experience, the activity will be formally incorporated
into future presentations of SXR207.
4. Conclusions
ISEs have been presented as an innovative solution to developing and enhancing laboratory
practise and access for distance learners, and as a means of providing training and experience for
teaching laboratories. Through evaluations in three case studies using a variety of methodologies,
we have demonstrated the effectiveness of ISEs as learning resources, and illustrated their range of
effectiveness.
The overall success of the studies has been such that the reported ISEs have been formally included
in the S104, SXR103 and SXR207 courses to ensure that their benefits are felt by future cohorts of
students.
5. Acknowledgements
The authors would like to thank the Physics Innovations Centre for Excellence in Teaching and
Learning for its support of the reported projects, the Open University's Institute for Educational
Technology for the use of its usability laboratory and the UK Higher Education Funding Council
for financial support.
We acknowledge the inspiration of the pioneering work of Kirstein [1, 2], Schumacher [3] and
Bacon [4, 5] in this area, and we thank Schumacher in particular for useful discussion.
We would also like to thank the course teams for S104, SXR103 and SXR207 for their support and
encouragement.
References
[1]Kirstein, J (1999): Interaktive Bildschirmexperimente - Technik und Didaktik eines neuartigen
Verfahrens zur multimedialen Abbildung physikalischer Experimente, Thesis TU Berlin
[2] Kirstein, J and Nordmeier, V (2007) Eur. J. Phys. 28 S115-S126
[3] Theyßen, H, Aufschnaiter, SV, Schumacher, D (2002) Teaching and Learning in the Science
Laboratory, vol 16 ch 2, ISBN 978-1-4020-1018-7 (Print) 978-0-306-48196-3 (Online)
[4] Bacon, R (2004) LTSN Physical Science News vol. 5, Issue 1, p10
[5] Bacon, R, (2003) Simulations in Physics and Astronomy Special Interest Group, Reality
Viewer, http://www.st-andrews.ac.uk/~bds2/ltsn/reality.htm (accessed 18th November 2008)
[6] Lambourne, R (2007) Eur. J. Phys. 28 S29-S36
[7] Hatherly, PA (2008), in press
25
[8] Quesenbery, W (2003) The five dimensions of usability. Albers, M.J. & Mazur, B. (eds)
Content and complexity: information design in technical communication. Mahwah, New Jersey:
Lawrence Erlbaum Associates pp 81-102
[9] Dumas, JS, and Redish, JC (1993) A practical guide to usability testing. Norwood, New Jersey:
Ablex Publishing Corporation.
[10] Stone, D, Jarrett, C, Woodroffe, M & Michocha, S (2005) User interface design and
evaluation. San Francisco: Morgan Kaufmann
[11] Debik, P (2002), http://www.virtual-oscilloscope.com (accessed 18th November 2008)
26
An Interactive Screen Experiment for Astronomy:
The Luminosity of the Sun
P.A. Hatherly
ISEs have frequently been investigated and discussed as means of providing practice and
preparation for students ahead of residential or home-based experiments. However, other purposes
include providing a means for students to investigate rare or dangerous phenomena or to
experience experiments which require costly equipment. With legislation appearing in 2009
restricting the sale of high power filament light bulbs, a new use was conceived; that of capturing
an experiment before the materials required become either obsolete or unobtainable.
The second level Astronomy course, S282, includes an activity to determine the luminosity of the
Sun using a Bunsen oil spot photometer method. Very simply, this method exploits the
translucency of an oil spot on a paper screen, which is placed a variable distance in front of a
reference light source, and directly between the reference source and the source under investigation
(Figure 1). The distance between the screen and the reference source is varied until the perceived
brightness of the oil spot as viewed from the front matches that of the rest of the screen. That is, the
light flux falling on the oil spot (and being transmitted through the screen) is the same as that
reflecting from the rest of the screen from the investigated source. By knowing the distances
between the sources and the screen, and the luminosity of the reference, the luminosity of the
source of interest can be determined.
Figure 1
A schematic of the S282 luminosity of the Sun experiment.
The S282 activity uses a high power (>100 W) clear filament light bulb as the reference, precisely
the type of bulb restricted under the 2009 legislation. The conventional options available to the
course are:
1. Remove the activity from the course
2. Provide students with pre-prepared data
Neither option is academically acceptable as a replacement, hence a third option the provision of an
ISE was decided upon. The ISE is structured to present the student with screens describing the
experiment to orient the student before moving on to the main experiment screen, shown in Figure
2.
27
Figure 2
The main screen of the Luminosity of the Sun ISE.
Students interact with the experiment by either dragging the screen in the overhead view at the
bottom of the image, or using the “left” and “right” buttons provided. The movements of the screen
are reflected in the two images at the top left and right, which show the screen being moved and the
brightness of the oil spot changing accordingly. Students adjust the position of the screen until the
brightness of the spot (as seen in the top right image) matches the rest of the screen. Using a
draggable on-screen ruler (not shown), students can then measure the distance from the screen to
the bulb, which then allows the luminosity of the Sun to be determined.
Whilst not completely replicating the real experiment (for example, the students do not need to
assemble and align the apparatus), the ISE does provide many of the interesting experimental
aspects. Of the original For example;
•
Assessing the brightness of the oil spot against the rest of the screen
•
Measuring the distance from the screen to the bulb
•
Evaluating the effect of the bulb being cooler than the Sun
•
Understanding the effect of the bulb being not a point source
•
Considering reproducibility in experiments
The ISE is optionally available to students from the 2010 presentation of S282 as part of their
second assessment exercise, the first being an experiment planning exercise. We will therefore be
evaluating the outcomes and effectiveness of the ISE at the conclusion of the course.
The ISE was written in Flash Actionscript 3, and is therefore supported on a wide range of
platforms as well as being readily web-deliverable. Additionally, the production of the ISE
introduced the educational and experiential value of this phase as much of the initial work was
carried out by a student placed with us under the Nufffield Bursary Scheme, and provided the
student with significant experimental and technical experience.
28
Use of 3D virtual environments in
Teaching Astronomy and Physics
Robert Lucas and Ulrich Kolb
Department of Physics and Astronomy, The Open University, Milton Keynes MK7 6AA UK
For correspondence: [email protected]
Abstract
We have developed several 3D graphics applications to support our teaching. Some of these
applications create virtual environments. In particular a telescope simulator has been used to
introduce students to the controls of a particular telescope that they will then subsequently use at an
observatory. Most students have never used a telescope before and find controlling one rather
challenging. This results in significant wasted observing time at the observatory. The developed
application simulates the sky, the telescope, and the handcontroller. They sky is rendered in a
familiar planetarium style. The telescope is a 3-D, fully-animated and textured graphical entity that
gives the user the look and feel of the real telescope. The handcontroller works identically to the
actual one except within the application it is clicked on with a mouse. This enables the students to
gain a familiarity with aligning the telescope before commencing the course. It also allows them to
gain a working knowledge of using celestial coordinates and the night sky. This paper descibes the
simulator and how it has benefitted students.
Introduction
The Open University runs a one-week residential course in Observational Astronomy and
Planetary Science (SXR208 2008) at Observatori Astronomic de Mallorca (OAM 2008). Groups
of five or six students share a telescope dome. The domes house a 30cm Meade SchmittCassegrain telescope on an equatorial mount equipped with an SBIG 1001 CCD camera. The
telescope is computer controlled via a handset connected to Right Ascension and Declination drive
motors. Sidereal tracking of the stars is automatically performed by virtue of the equatorial mount
being aligned with the celestial north-pole. The students must complete preparatory tasks before
their week at the OAM and write up the results of one of their evenings’ observations as a report
(Norton 2004). There are several courses that run in the spring and several in the autumn. At the
beginning of each observing session the students must align the telescope with a known star in
order to allow the coordinates indicated on the telescope’s computer handset to coincide with the
actual coordinates that the telescope is physically pointing at. Without this alignment (commonly
known as synchronisation) it would be difficult if not impossible to find faint targets. Most course
students have never used a telescope before and find this task rather challenging. As a result, the
synchronisation procedure often takes up too much of the precious dark time needed for data
acquisition. The students feel rather intimidated by the telescope hardware, they may not be
familiar with the constellations, the finder-scope inverts its image, and of course they are required
to work in the dark. After performing a synchronisation most students will assume that this has
worked perfectly and guide the telescope to the first star field that they need, which will often be
quite faint and hard to identify by eye. If they do not find what they are looking for immediately,
they waste time trying to identify the field, and then perhaps declare that the telescope doesn’t
29
work! An experienced observer will on the other hand always check that the synchronisation has
worked by guiding the telescope to a bright, easily identified star and checking the coordinates on
the handset agree with those in the catalogue. What is needed here is a little confidence in using
the kit as these operations seem elaborate and intimidating to the first-time user. In order to give
the students this experience before their arrival at the OAM a simulator was written. This is a 3-D
immersive program showing the night sky as they will see it during the observing times when they
are at the OAM. The telescope is rendered in 3-D and can be moved in the same way as the actual
telescope using a modelled hand-controller which mimics the real one in every way but in its
control interface (it must be interacted with via the mouse). The user can move forward and away
from the telescope and can rotate around it in order to obtain the view needed. In particular, when
aligning on a star, a rough alignment along the tube of the telescope can be performed before using
the finder-scope feature (this shows the finder-scope view with cross-wires centred on the screen).
The students are set a number of tasks to complete using the simulator and must submit a trace
produced by the simulator as part of their assessment.
Implementation
The simulator is a C++ program using the OpenGL library (Shreiner et al, 2006) and the GLUT
API (GLUT 2008). A finite state automata (Hopcroft and Ullman 1979) models the handset whose
transitions were carefully plotted by interaction with the actual controller. This gives a near perfect
recreation of the interface. The only differences being: (1) only a limited set of features are
implemented, i.e. those deemed useful for this exercise, (2) the user clicks with a mouse rather than
actually presses buttons. An example of the graph of the finite state automata is given in figure 1
as a directed graph. The key presses are shown in ellipses, the display is shown in rectangles, and
the state numbers are shown in triangles. Once this diagram has been obtained it can easily be
implemented as a transition matrix.
Figure 1. A sample of the graph of the controller’s finite state automata. The key presses
are shown in ellipses, the display is shown in rectangles, and the state numbers are shown in
triangles
The limited number of buttons on the handset leads to some controls being achieved by pressing
and holding a button down for a certain interval. Synchronizing on a star is achieved by pressing
30
and holding the Enter button for a few seconds. These peculiar interface issues are re-created in
the simulator where, in this instance the user would click on the Enter button with the mouse and
hold the mouse button down as though it were the button on the handset.
The object-orientated features of C++ were extremely beneficial to the implementation with
objects being created for each of the main entities, in particular: the telescope, the controller and
the sky. The complexity of the various coordinate systems needed was tamed by the objectoriented approach. A screen-shot, is shown in figure 2.
Figure 2. The simulator on start-up
The stars are modelled using a single 2-D star texture mapped to the relevant size depending on
apparent magnitude. They are coloured according to their spectral type and bill-boarded so that
they always point towards the camera. The night sky as it will appear when the students are
actually at the observatory is plotted. The program automatically selects the spring or autumn sky
corresponding to the date of the next course depending on the computer’s current date. This allows
the students to become familiar with the bright stars that they will commonly use for alignment.
The celestial sphere rotates as per real time. The star data is from the HYG database (Astronomy
Nexus. 2008). The constellation outlines can be plotted, making star identification that much
easier. The line segments can also be seen in the finder-scope view. In the simulation, the celestial
sphere is relatively close to the telescope to keep the zenith reasonably low (the monitor is a flat
surface in-front of our eyes, it does not have a ceiling we can look up at). This does cause some
parallax difficulties. In the real world stars are effectively at infinity, no parallax being
identifiable. In the simulation this is not the case. However, slightly altering the telescope position
has resolved any parallax problem that we might have had.
The telescope is built in an hierarchical fashion literally from the ground up, pushing and
popping the transformation matrices to negotiate the hierarchy of components in the drawing.
Depth checking is used to remove hidden surfaces and several low-level lights are used to make the
telescope visible against the dark sky. The lights can be switched off, leaving the telescope as a
dark shadow faintly visible against the stars of the night sky. The finder-scope view is rendered as
a 2-D image centred on the screen.
31
A trace facility that writes to disk all the interactions that the student makes was implemented in
order that we could assess the competence of the students in controlling the program. In particular
we use this facility to grade the students’ performance in the assessment that we set. This is a
sample of such a trace. The screen of the handheld controller is shown between the parallel lines
with the state number in square brackets:
============================[102]
STAR226 STAR
MAG 0.770000
================================
============================[107]
Coordinates
matched:STAR226
================================
Coordinates matched for OurStarNo = 12
CurrentMeadeStarNo = 226 at RA = 297.69 deg Dec = 8.87 deg
StarName = Altair
Actual RA = 297.65 Actual Dec = 8.81
============================[ 4]
->TELESCOPE
OBJECT LIBRARY
================================
============================[ 7]
RA = 19:50:46
Dec =+08:52:02
================================
Setting Slew Speed to: 0.13
A number of buttons are available on-screen for changing the position of the observer within the
scene. The observer can also change his position by using the mouse. The mouse gives a very
immediate and intuitive way of moving around.
It is possible for the students to drive the telescope into the mount as with the real telescope
setup (the camera does not fit through the forks), in which case a warning is given and the
telescope resets its position and the simulated computer is rebooted.
Student use
The students are given a tutorial guide to the software that requires them to run the simulator
and perform a series of tasks indicated by the text. The tasks include: switching on the telescope’s
computer, slewing the telescope, changing the speed of slewing, using the finder-scope, use of the
mode key to show sidereal time, Right Ascension (RA) and Declination (Dec). They are then
taken through the process of synchronizing on a star with the constellations and RA/Dec coordinate
lines visible. Finally, they are asked to manually slew to a particular star using its RA and Dec
coordinates. Although both the actual telescope and the simulator can ‘goto’ any of a large number
of stars, either by name or coordinates, we discourage this as the camera may hit the telescope
forks during an automatic slew causing considerable damage to a very expensive piece of kit!
32
For the test, the students are asked to align on a different star depending on the season in which
they are doing the course. They are asked to do this without the constellations nor the RA and Dec
grid being visible. For example:
For those doing the course in the autumn
(1) Manually drive the telescope to Arcturus and then synchronize on it.
(2) Then drive the star to the RA and Dec of Rasalhague.
(3) When you have reached Rasalhague repeat the synchronization process on Rasalhague.
Student survey results
The first survey was voluntary and few students took part. Therefore it was difficult to make
definite conclusions. Although the little feedback we had was encouraging and enabled us to make
some small improvements. For the second survey the students were given an incentive of earning
extra marks.
These are the results of the second survey. All the students were given a questionnaire to fill in
before and after they had completed their week at the observatory. For the pre-week survey we
analysed 48 responses. Most of the questions dealt with issues of installation, time taken, crashing,
support given and ease of use. The responses have been very useful in developing the application
further. In particular stars near the horizon were showing in the main view but not consistently in
the finder-scope. We were also able to improve the user interface which some users had found
rather slow to react in this version.
For the post-week survey we analysed 52 student responses, all but seven of the students tried
the simulator. The ones that didn’t reported various reasons, including lack of time (4), failure to
install (1), wouldn’t run on a Mac (1). Questions were posed as five point Likert items. The
results on the familiarity they gained using the simulator are given in table 1:
Table 1. Familiarity gained from using Meade simulator
For obervational projects the Agree
MeadeSim activity helped as I (5)
was already familiar with…
(4)
Neut
(3)
(2)
Disag
(1)
No resp
(0)
[7.1] the concept of RA and 17
declination
[7.2] the general set-up of 16
telescope, camera, controls
[7.3] the telescope mount
15
11
8
3
5
1
14
9
3
2
1
13
8
4
4
1
[7.4] slewing the telescope
22
10
7
3
1
1
[7.5] using the controller to find a 22
star
[7.6] using the controller to match 20
the coordinates of a star
[7.7] slewing to a star using RA and 15
Dec
10
8
4
0
1
14
7
1
2
1
8
8
2
1
1
Other, more general points are given in Table 2.
33
Table 2. General points
Agree
(5)
[8.1] I had forgotten details of 2
MeadeSim when I used the real
telescope for the first time
[8.2] I was confused by the two 7
different handsets
[8.3] I found the simulator activity 27
useful
(4)
9
Neut
(3)
9
(2)
8
Disag
(1)
16
No resp
(0)
1
12
9
8
8
1
10
5
1
2
1
Among other issues that surfaced included how slowly the program would run under Vista.
This is a significant problem as some reported the performance under Vista made the simulator
unusable. Fortunately it appears that disabling the Windows Desktop Manager resolves this issue
which can be achieved by selecting Windows Classic or Basic interface style. There are two
versions of the Meade hand-controller in use at the OAM and the slight differences in their
functionality caused some confusion (the simulator only uses the earlier type of handset).
Discussion
The data clearly indicates that the student perception is that the simulator benefitted them.
There are 37 positive responses (i.e. agree strongly or agree) to the question ‘I found the simulator
activity useful’ and only 4 negative and 5 neutral. This is supported by the more detailed responses
in the first table where around 30 of the students have responded positively to each question.
In addition to this questionnaire data we also have some responses from the tutors. In all cases
these have been positive. Typically the tutors are noticing a significant improvement in first night
performance with students showing a marked familiarity with the telescope operation and handset.
This is one of the tutor’s comments:
Since it has been introduced tutors have had to spend significantly less time teaching students
how to operate a telescope and could focus on the more essential bits of the tutoring.
Although simulators are not uncommon in Astronomy, these are usually either text based or 2D. Telescope simulators are available but these often are just a means of obtaining data for the
students to analyse rather than being focused on the control of such a device, such as the Indoor
Telescope (Dukes 1990). This is also true of the Virtual Telescope (Norton 1998) and even more
so for the ASCOM (ASCOM 2008) simulated telescope driver that has no visual component at all!
It is the 3-D animated visualisation of the telescope embedded in a planetarium style program that
makes this application unique. The level or realism given by the 3-D program is seen as a huge
advantage. Students find it very attractive and commonly describe it as ‘cool’, but more
importantly, it actually gives them a feel for the real thing.
Further development
A current requirement is that the students’ performance, as indicated in the trace file, is to be
marked automatically. A specific format for this is to be decided on and implemented. The current
comprehensive trace will be kept for diagnostic purposes and for resolving any issues that may
arise from the automation.
34
We have currently implemented an indexed database of some two million stars. We intend to
simulate the behaviour of the camera and allow the students to practise imaging and calibration.
We envisage the Maxim DL photometry package (Maxim DL 2008) being used alongside the
simulator with the simulator’s camera implemented as an ASCOM device.
Conclusions
The data clearly indicates that the student perception is that the simulator benefitted them and
this is reinforced by the comments of the tutors. The simulator particularly benefits from an
accurate representation of the hand-controller, the night sky and the telescope. The accurate
modelling of the hand-controller is due to its painstaking mapping and implementation as a finite
state automata. The accurate rendering of the night sky and the telescope is due to the
sophisticated 3-D modelling functionality of the OpenGL graphics library as well as the benefits
inherent in an Object Oriented programming language.
Acknowledgements
Thanks to all the students who tried the simulator and all the tutors who gave us their feedback.
Special thanks to Dr. Alice Peasgood for doing much of the data analysis.
References
ASCOM, (2008) “ASCOM – Standards for Astronomy” http://ascom-standards.org/, (accessed
December 2008)
Astronomy
Nexus,
(2008)
“Astronomy
Nexus
The
HYG
Database”
http://astronexus.com.node/34, (accessed December 2008)
Dukes, R.. (1990). Microcomputers in the teaching of astronomy. In J. Pasachoff and J Percy (Ed.),
The Teaching of Astronomy (pp. 159-170). Cambridge University: Press.
GLUT API, (2008) “The OpenGL Utility Toolkit (GLUT) Programming Interface API Version 3”
http://www.opengl.org/resources/libraries/glut/spec3/spec3.html, (accessed December 2008)
Hopcroft, J. E., and Ullman, J. D. . (1979). Introduction to Automata theory, Languages and
Automation.: Addison-Wesley Publishing Company Inc.
Norton, A.. (1998). A Virtual Telescope for the Open University Science Foundation Course. In L.
Gouguenheim. D. McNally and J Percy (Ed.), New Trends in Astronomy Teaching (pp. 100105). Cambridge University: Press.
MAXIM DL, (2008) “Maxim DL Version 5” http://www.cryogen.com/, (accessed December 2008)
Norton, A.. (Ed). (2004). Observing the Universe. Cambridge University: Press.
OAM, (2008) “Observatori Astronomic de Mallorca” http://www.oam.es/, (accessed December
2008)
Shreiner, D., Woo, M, Neider, J. and Davis, T. . (2006). Open GL Programming Guide: AddisonWesley Publishing Company Inc.
SXR208, (2008) “Observing the Universe” http://courses.open.ac.uk/sxr208/sxr208_index.cfm,
(accessed December 2008)
35
The Celestial E-Sphere
Dr. Robert J Lucas
PiCETL
The Open University
Introduction
The Celestial E-Sphere originally came from an idea from Dr. Bob Lambourne who expressed a
desire for a Celestial Sphere that you could see from outside, rather like the desk-top spheres that
you can buy. There was some discussion about the possibility of modifying the open source of
Stellarium, a very popular planetarium package, but this was perceived as probably being very
complex. The final impetus came when using the Sky Maps tool of the Sloan Digital Sky Survey
website, shown below.
This showed a celestial sphere from the outside. Although the functionality was very limited, you
couldn’t ‘go inside’ the sphere for example, the aesthetic appeal of seeing the heavens presented in
this form was evident.
Initial Version
The program is written in C++ using the OpenGL graphics library. Data for 30,000 stars was read
into an array from the HYG database (The Astronomy Nexus. http://astronexus.com/node/34).
The stars’ positions were plotted using simple spherical geometry. They are modeled using a
single star texture mapped to the relevant size depending on apparent magnitude. They are
36
coloured according to their spectral type. The textured stars are ‘bill-boarded’ that is their two
dimensional image always faces the camera so as to appear three dimensional.
It was evident from very early in the development that the sphere presented a very striking
animation that was aesthetically pleasing whilst being of obvious educational value. In particular
the animation is very smooth, commonly running at 60 frames per second on a reasonably good
machine equipped with a graphics card.
Additional development
Features were added that corresponded to a typical planetarium demonstration (I actually based
trhese on Roger O’Brian’s presentation at the Mallorca Observatory’s planetarium in September
2007). These include:
• constellations and their boundaries;
• ecliptic;
• labelling of solstices;
• north and south celestial poles;
• labelling of coordinates;
• projection of equator onto celestial sphere;
• Sun, Moon and planets with ephemeris calculations;
• horizon for anywhere on Earth;
• altitude of some stars;
• motion of Sun and planets.
37
User Feedback
The first outing for the Celestial E-Sphere was at Astrofest in February 2007. Scores of attendees
asked about the program making very admiring comments. Several of followed up since and asked
for copies. In all cases where there has been feedback it has been very positive.
Some of the lecturers and tutors at the OU expressed interest in using it for teaching on some of the
Astronomy courses including S282. This further influenced the features that have been included.
In particular, after implementing several hardwired tours complete with audio it was realised that
what would be more effective would be a general macro recording and playback facility that the
tutors could use themselves. This facility allows the user to capture any interactive sequence that
can then be replayed. A soundtrack can be added to this. Thus it is possible to create self-running
tutorials.
The application has been demonstrated to the staff at the National Space Centre in Leicester. They
have expressed a desire to use it projected onto a stage using the Pepper’s Ghost principle which
will make the sphere look like it is hanging in space. This is to form part of their section which is
targeted at 16-18 year old students of Physics.
The application has also been presented at several CETL conferences and at a Physics and
Astronomy departmental meeting. In all cases it has met with considerable enthusiasm.
Conclusion
The Celestial E-Sphere certainly has a high ‘wow factor’ whilst being of huge educational value.
Concepts such as the Sun crossing from the South to the North hemisphere at the spring equinox
can be appreciated with an immediacy that is lacking from normal static descriptions and
schematics.
The provision of a macro-record and playback facility allows anyone to design tutorials using the
E-Sphere. We are looking forward to the evaluation of such material now that this has been added.
38
Using a virtual world for teaching the motion of projectiles.
Presented at The Open CETL Conference. 24-25 September 2008. The Open University. Walton
Hall, Milton Keynes.
Dr. Robert J Lucas
PiCETL Educational Programmer
Introduction
This project was developed as a demonstrator for the E-Learning in Physical Science for Sport
(ELPS). Its purpose is to demonstrate the sort of application that can be developed to support
Physics teaching using examples from sport. The idea was to develop an application that was more
like a piece of kit that could be used in a variety of ways, rather than a multimedia title that you
access in a linear way and is restricted to teaching exactly the material that it covers. The students
could explore the application and perform a variety of experiments. To an extent the application
was to be open-ended in that worksheets could be provided and used alongside the application at
any point without the need for the application to be changed. In this way it was to be analogous to
actually having a bow and arrow and being able to use it to perform a variety of experiments.
Figure 1
Normal screen view from behind the bow.
Implementation
The Archery application was implemented using C++ and the OpenGL package which had been
used for earlier applications such as [1,2]. There is no collision detection or Physics engine
included in OpenGL and both of these had to be explicitly coded. The use of Object Oriented
39
programming was extremely beneficial allowing the implementation of programming objects for
the main components of the application such as the bow and the arrows. This allowed a rapid
development time of around four weeks and excellent stability. The only changes that have been
necessary have been to the user controls.
Description
A virtual world has been created using OpenGL in which the user can move around and fire arrows
from a bow (Fig 1). The trajectory in 3-D space is plotted in real-time and can be halted at anytime
allowing the user to examine the components of its velocity vector (Fig. 2). The user’s freedom to
move in three dimensions means he can reposition himself close to the arrow to view its velocity
vectors. He can also position himself in the line of fire if he so wishes and have the rather
disconcerting view of arrows flying past.
Figure 2
Showing the velocity vectors
There is an option to include air resistance. Two-dimensional graphs of height against time and
force against stretch are also plotted. All possible plots have deliberately been avoided to enable
students to engage in their own graph drawing. My view is that students should be using pen and
paper alongside the application to fully engage and understand the principles being demonstrated.
The arrow casts a shadow on the ground from an overhead light source. When there is no air
resistance this shadow moves at a constant speed as the horizontal component of the arrows
velocity is constant. This provides an effective demonstration of how the horizontal component.
when it has no forces acting on it, is unchanging.
The package has been evaluated in the classroom by several teachers who have also indicated what
material could usefully be added. Their comments and our responses will be discussed.
40
User experiences
These are some of the comments made by staff that evaluated the package:
In general simulation looks brilliant & certainly has great potential.
I love the idea of being able to stop the arrow mid flight & look at
the velocity components. These vectors seem a bit small though, unless you zoom in, which
means you are too close to be able to view the whole trajectory & easily compare
components at different places along it.
The height/time graph is great, not sure if force extension graph for bow is useful?
First, the Y13s liked it – and enjoyed using it – however they were not sure how much they
learned (they’re quite good students and had projectiles well sussed last year!!)
They were surprised by the scream – but then, eventually, that seemed to be their driving
motive! A good touch
The Y12s who are just starting projectiles liked it as part of a lesson – put things into
perspective.
I usually start this topic with a home grown Powerpoint to convince them that horizontal
and vertical motion are independent – then the text book – then this program would fit in
well.
The following is a more subtle point:
I think it’s important somehow to make it absolutely clear to students that this is a
simulation and uses only those physical laws and relationships that have been programmed
in. In a way, it’s a sophisticated animated interactive diagram not an experiment. It will
only tell them anything about the real world if the simulation is compared with real
projectiles.
I’m not convinced of the importance of this remark. The application is very clearly a simulation as
it is being carried out on a computer. It also does tell the students something about the real world
regardless of any comparison with real projectiles, although this is to be encouraged.
All of the negative remarks concerned the user interface:
I found the manipulation quite awkward (despite reading the ReadMe file assiduously), but
maybe that’s because I’m a complete novice at this sort of gaming stuff.
It wasn’t intuitive – it took a while for the computer savvy students to figure out what was
needed – there are several key conventions for game-players which these key-strokes did
not follow.
moving around is tricky at first, but you do get the hang of it.
Perhaps a few buttons to return you to behind firing position/side view/behind target would
be useful.
These comments and suggestions have been taken on-board and the user interface is now rather
more intuitive.
41
Recommendations:
These were some of the suggestions made for how the application was to be used:
Concerning activities, I’d like to see at least some that refer to real live practical work
alongside the simulation. I suggest the following (ideally preceded by play-time where students
familiarise themselves with the simulation and its controls).
Basic projectile motion
2
Turn off air resistance
By trying a few examples, collect data to show how horizontal position and velocity change
with time, and how vertical position and velocity change with time. Display the data
graphically. Try different launch angles and speeds.
Experiment with some real projectiles (eg toy bow and arrow, catapulted marble, tennis
ball) and see how range depends on the factors above. Be as quantitative as possible.
Compare the results with the simulated results.
Turn on air resistance and see if the simulated results become closer.
Although the approach was ultimately rejected for the ELPS project in favour of a conventional
screen-by-screen title using Flash, it is felt that the evaluation showed the project to be very
successful in terms of user acceptance and the rich learning experience it provided.
Furthermore, since the ELPS team have found it rather hard to provide all the screens necessary for
their multimedia approach they have recently decided to use the Archery program to plug their
shortfall.
Thanks to Elizabeth Swinbank, John Barker, Cecilia Collier and their classes for their evaluation
and many useful comments.
References
[1] The Celestial E-Sphere (BBC Sky at Night cover disk.
www.open.ac.uk/picetl/projects/esphere accessed (2009)
July 2008.
Also
[2] Lucas R and Kolb U (2009). Use of 3-D virtual environments in teaching astronomy and
physics. Frontiers in Science Education Research. Ayhan Bilsel and Mehmet U. Garip (Ed.).
Eastern Mediterranean University Press 2009.
42
3-D Immersive Screen Experiments
Robert J Lucas
PiCETL
The Open University
[email protected]
Abstract
We are currently piloting a range of computer simulated science experiments as 3-D virtual
environments. These are rendered on a PC in 3-D and use photographs of specific parts of the
actual apparatus as textures to add realism to the simulation. In particular, photographs are used to
represent the consequential views of an experiment. These particular views may also be animated
depending on the state of the experiment. The work combines the photographic approach of the
Interactive Screen Experiments (ISEs) with the advantages of a fully simulated 3-D environment
where the user can interact with the apparatus in a more natural and intuitive way. The potential
advantages are that users can quickly adapt to the environment and in particular the controls. They
gain realistic views of the physicality of the experiment as they are not just seeing it from a
particular viewpoint, but from wherever they see fit to place themselves within the experiment’s
scene. They are immersed in the experiment in a way that mitigates some of the objections to
online as opposed to real laboratory experimentation. It is also the case that the results of initial
calibration or setup carry over into the main part of the experiment. This is perceived as an
extremely important teaching element of Physics practicals as the user learns that care in setting up
an experiment is an essential part of being able to get good results. Furthermore there is no need to
represent scales, read-outs or controls as separate parts of the interface; these can all be rendered at
their correct physical positions within the experiment. The first of these experiments based on the
use of a diffraction grating has been fully implemented and has been evaluated with a Physics A’
level class. The application and its evaluation will be presented. A more complicated experiment
using a spectrometer has also been modelled which raises issues of complexity. These issues will
also be discussed.
Introduction
2-D simulations are used extensively in Physics. We can find simulations of a simple pendulum to
an atomic reaction in this form. However, there are situations when 2-D is not enough and to gain
a true insight into how something behaves we need 3-D. This is the case for the programs
described below. The Celestial E-Sphere [8] was developed to help students understand celestial
coordinates and various aspects of the motion of celestial bodies, and it is impossible to see how
this could have ever worked as anything but a 3-D program.
The Meade Simulator [6] is used to help students studying the Open University course, Observing
the Universe [3], gain familiarity with controlling a telescope. It simulates the night sky, a
computer controlled telescope and its hand controller. It is the 3-D that gives this program the look
and feel of the actual telescope and enables the students to come to terms with how to control it,
enabling them to advance much more quickly when faced with the real thing. This has been in use
for several years and has proved itself to be of enormous value in getting the students to a stage
where they can master the controls of the telescope without wasting precious dark time at the
observatory.
The 3-D Immersive Screen Experiments are a natural progression from these. Having
implemented these 3-D programs and then faced with the 2-D Interactive Screen Experiments it
43
was at once obvious that the many difficulties that were inherent in the 2-D approach could be
entirely avoided by rendering these experiments in their own 3-D virtual world.
Styles of interactive experiment
The idea of virtual laboratory resources that can be used on a computer is described in [5] and in
particular the Interactive Screen Experiments (ISE) and several implementations are described.
Several of which are also discussed here.
ISEs [2, 5] are perhaps the most common form of experiment that students can interact with on a
personal computer. These use photographs to give 2-D views of the actual apparatus in use during
an actual experiment. They are basically interactive movies and as such give a comforting feeling
of reality. However, due to the combinatorial explosion of the necessary photographs there often
needs to be compromises made in the degrees of freedom that the user can access. Despite this
there have been many successful implementations and the OU and other institutions are actively
engaged in producing these. This lack of ability to cope with multiple degrees of freedom leads to
poor flexibility and scope as pointed out in [10] where an ISE showing a Michelson-Interferometer
is compared to a video which scores the same low value for flexibility but actually does better than
the ISE for scope. The terms ‘scope’ and ‘flexibility’ are well defined within this paper.
It is interesting to note that [11] makes the following observation about simulations: this approach
(simulations) can lead to the oversimplification of real experiments. As a simple consequence of
this fact, students may run into difficulties facing the complexity of the real world. In [2] we find a
similar but stronger statement that Simulations are optimized to an idealized view on how nature
would behave according to the accepted theory. Although a simulation may do this to the
detriment of the learning experience and this leads to the oversimplification noted above, a
simulation does not have to do this; it is free to use photographs of actual experiments in the same
way that an ISE does. The simplification inherent in the paradigm of the ISE is of a different
nature. The simplification is due the inability to represent multiple degrees of freedom.
Although ISEs claim not to be simulations - “Note that an ISE is emphatically NOT a simulation“
[12], in fact many of them are. It is emphatically not the case that every frame that a user sees is a
photograph of a state of an experiment, but is most usually a photomontage where the selections,
positions and orientations of the photographs are controlled by a program that is simulating the
behaviour of the original experiment. This is true of the ISEs discussed here. Whether it is
admitted that the ISEs are simulations or not, there is an inherent oversimplification in the ISE
paradigm due the inability to represent multiple degrees of freedom and this has a direct bearing on
the usefulness of the ISE as a teaching tool. This point will be taken up later in the paper.
3-D Immersive Screen Experiments also use photographs of a real experiment but these are
reserved for consequential views such as a spectrum, rather than the mundane views, such as the
back of a voltmeter. The apparatus of the experiment is reproduced as 3-D models. These models
are programmatically animated to simulate their real-life behaviour. The user’s eye is implemented
as a software camera that can be positioned anywhere within the scene in exactly the same way that
most computer games are programmed, indeed a games language is used as it provides many useful
facilities such as collision detection. Clearly this approach is much more complicated to program
than the 2-D ISE, in fact the modelling of the apparatus needs engineering accuracy so that all parts
work properly together. This is where there is a large departure from the games approach, which
mostly attempts to fool the user into believing that the operation of a device is realistic by often
exaggerating its behaviour, although there are an increasing number of games, particularly of the
racing type, that strive to emulate the actual underlying physics.
44
Degrees of freedom
To demonstrate some of the challenges of reproducing an experiment on-screen, a concrete
example of a simple experiment is used. Figure 1 shows the set-up for a diffraction grating
experiment as used on the OU course, level one course, Exploring Science [4]. This experiment
can be constructed by the student on a dining table and used to obtain the angles of various
coloured light diffracted by the grating seen here mounted into a 35mm slide. A bedside or office
light illuminates the inside of a shoebox. A slit in the shoebox allows light to reach the diffraction
grating that then diffracts the different colours of the light into various directions. A paper
protractor is used to measure angles. A pin and length of cotton is a sighting device that the user
looks along when determining the direction of a particular colour. The angle of diffraction can
then be read from the protractor by examining the pin’s position. The diffraction pattern consists
of a bright white central region with rainbow coloured regions on either side that repeat themselves
several times. The white pattern in the centre is called the zero order and each rainbow of colours
is called an order and they are counted outwards with the left and right ones next to the centre
being the first order, the next pair moving outwards is the second order and so on.
Figure 1 The diffraction grating experiment
If this were to be faithfully reproduced by a set of photographs we would need to deal with all the
possible configurations. For the sake of performing an experiment we will only consider those that
directly bear on the experimental results that are to be obtained. For example, in reality it is always
possible when performing an experiment to stand on our heads, but if this has no bearing on the
useful visualisation of the experiment, the degree of freedom that allows us to perform such a
manoeuvre will be excluded. One might imagine an experiment in which standing on one’s head
was useful. It is just a question of choosing those degrees of freedom that are of use for the
experiment being considered. In reality and ignoring pointless degrees of motion there are three
degrees of freedom for the user’s eye, up/down, left/right, in/out. There is one degree of freedom
in the shoebox that can move to the left or right to centre the zero order diffraction pattern so that
its position reads zero on the paper protractor. Finally, the pin can be moved along the edge of the
protractor adding one more degree of freedom. If one hundred photographs are used for each
degree of freedom,10 billion photographs would be needed to represent the entire experiment in all
its possible configurations. Note that the required number is the product of the number required for
each degree of freedom. This perhaps is why it is sometimes said that ‘the whole is more than the
sum of its parts’ as in a very real sense the whole is the product of the parts. This can be simplified
by not allowing the eye to move forward or backwards or up and down. A further simplification
would be to have the experiment already calibrated. So what remains are only the eye and pin
moving in a plane. This would need 10,000 photographs and in practice this proves too many and
the ISE that was actually produced combines the pin movement with the eye movement [5]. See
figure 2 where the image of the slide is superimposed onto an aerial photograph of the
45
experiment’s current configuration and the eye is assumed to be on a line from the centre of the
slide to the pin.
Figure 2 The diffraction grating ISE
This is perhaps one compromise too far, as we now have the diffraction pattern changing as the pin
is moved which is emphatically not the case. The diffraction pattern seen depends only on where
the eye or camera is. This is an example of how the combinatorial explosion at the heart of the ISE
forces such compromises often with unfortunate effect. Some might say, and exactly this has been
heard, that it is obvious that the viewpoint is along a line through the pin to the slide. This was said
by a lecturer of Physics at university level, so doubtless it was obvious to him. However, such
assumptions should never be made of a student who potentially comes to this experiment with no
expectations of its behaviour at all. Additionally, there is nothing intuitive about how the image on
the diffraction grating appears to move as the viewpoint changes, if anything it is counter intuitive
upon first viewing.
In practice the purely photographic approach of the ISE restricts us to reproducing just one degree
of freedom at a time. Bronner [2]) states ‘Obviously, it is not feasible to include all degrees of
freedom in a single ISE’, this would seem to be an understatement and rarely more that one degree
of freedom is seen in an ISE. Reproducing the experiment as a 3-D simulated environment allows
all useful degrees of freedom to be retained but at the expense of a much more complicated
simulation.
Figure 3 shows the same diffraction experiment rendered as a 3-D graphics simulation. Here the
user can move his eye (the software camera) in all three directions. It is possible to move behind
the shoebox and see what kind of light bulb is being used (the experiment is commonly performed
with an ordinary tungsten filament and an energy saving bulb which produce quite different
spectra). Note that there is no way of knowing what bulb is being used in the ISE other than
reading the notes which are not part of the simulation. The pin can be moved independently and
the shoebox can be moved left and right to perform the calibration. The final point is significant
46
because the position of the zero order is one of the plotted points on a graph used to calculate the
frequency of the various colours of light. And it is the accuracy of this point that needs to be taken
account of when plotting a best-fit line. That there is an issue of accuracy concerning this point is
very hard to appreciate if it is assumed that the apparatus has been set up with no possibility of
moving this position. It is also necessary to perform this calibration with some care. This is a
point worth emphasising because it is a major learning outcome that taking care in any set-up or
calibration procedures affect the quality of the results that can subsequently be obtained.
Figure 3 The diffraction grating 3D Immersive Screen Experiment
This ‘1-degree of freedom at a time’ often leads to a ‘flattening out’ of the experiment into a linear
set of objectives where one degree of freedom is used to achieve the first goal and once achieved
the experiment moves on the achieving a second goal using another degree of freedom now
completely divorced from the first. Physics experiments are not like this, they are overwhelmingly
built from many interacting facets. Figure 4 shows a spectrometer.
47
Figure 4 A commercially available spectrometer
The tube with the square appendage is the collimator used to produce a narrow beam of light. The
other tube is a telescope with a reticle eyepiece used to accurately align on whatever image is
produced by what is placed on the central platform. Commonly a prism or diffraction grating is
placed on the table and the telescope is moved on the central vertical axis to view the spectrum.
Essentially the spectrometer can be used to perform a very accurate version of the shoebox-andprotractor diffraction experiment described above. Performing the experiment with a spectrometer,
however, means that the user must know how to use this piece of apparatus and be able to control
it.
Before measurements can be made with the spectrometer it is important to focus the telescope on a
distant object. In reality we point the telescope out of a window in the laboratory and focus on a
distant tree or building.
The ISE of the spectrometer experiment requires that the user focus the telescope before being
allowed to continue with the measurements. Once focused, the telescope is always focused. It is
no longer possible to un-focus it. In reality it is the quality of the focus obtained by the student that
has a direct bearing on the results he obtains. Part of the knowledge acquired by the student is how
to deal with this parameter, the quality of the focus. He learns that a deal of care in performing the
focus pays off in the result he gets. He may not learn this the first time he uses a spectrometer, but
it is all part of the experience that he gains in a real laboratory. The ISE will always give him the
results of a perfectly focused telescope, hence the user will have no experience of trying to garner
readings from a less than perfectly focused instrument and is unlikely to learn either the
significance of the focusing or the consequences of it. The user is simply being made to jump
through a hoop to achieve the necessary focus to proceed.
Figure 5 shows the spectrometer experiment rendered as a 3-D graphics program. Here the
telescope is being focused on a distant pylon visible through the window of the laboratory.
48
Figure 5 The Spectrometer 3D Immersive Screen Experiment
The user is able to move his eye/camera in all directions. The various parts of the spectrometer can
be moved by either dragging with the mouse or using keys. The various knobs, such as the focus
knob, can be turned by placing the mouse over them and then using the mouse wheel. This gives a
very intuitive feeling for the focusing in particular; note that whatever focus is achieved is carried
over into the experiment itself. If the telescope is poorly focused the user will find it difficult to
obtain accurate readings as in the real experiment.
Another compromise that we find with the purely photographic ISE approach is that the view
presented of the experiment will not necessarily yield a usable view of the scale that is being used
for data collection. In the case of the spectrometer [5] it is necessary to represent the vernier that is
used for measuring the angle of the telescope by a different window. This is an artifice that does
not shed light on the workings of the spectrometer but obscures them. The student will almost
certainly know how a vernier works but seeing it in its rightful place and being able to see its
readings change when the telescope is moved gives the student a much better opportunity to
understand it within the context of the experiment. Figure 6 shows how the vernier of the 3-D
Immersive Screen Experiment is read by simply moving the eye/camera up to it.
49
Figure 6 Reading the vernier scale
Implementation
The models used in the shoebox diffraction grating experiment were extremely easy to implement.
However the spectroscope demanded some complex programming and modelling.
The spectroscope must be modelled as individual components that are assembled and animated by
the program. Every moving part must be constructed as an individual 3-D model. Each
component must accurately fit with all associated components so that they work together. For
example, the main scale seen above, must be capable of moving accurately against the vernier scale
which must give accurate results at all positions. This requires a high polygon count to achieve
smoothness and a high degree of precision so that components fit together well. The spectroscope
was created using a 3-D modelling program called Milkshape [7]. Figure 7 shows a view from
within this program of the base and main scale. Construction of such a model is a painstaking
business. This model took a total of about 30 hours to build and another 30 to animate correctly.
The fixed base and scale account for over two thousand polygons. Although this may seem like a
large amount, modern computers equipped with graphics cards can easily cope with an order of
magnitude more than this. The knobs and the focus tubes are modelled separately so that turning
the focus knob causes the focus tube to move in or out. This enables the student to understand how
the focus is achieved and reinforce his understanding of the lens equation.
50
Figure 7 The Milkshape 3D modelling application
The telescope is modelled as a single lens magnifying glass. There is a second software camera
(the first is the camera used for the user’s eye) inside this telescope pointing towards the centre of
the spectroscope. This camera copies its view to a buffer in memory. The lens equation is used to
determine how the pixels of the telescope’s memory buffer are to be dispersed over the eyepiece
lens and it is this simulation that gives the focusing its realistic behaviour.
Figure 8 shows an exploded view of the spectroscope.
Figure 8 Exploded view of the spectrometer
51
The Blitz3D games language [1] is used to bring all the components together and simulate their
behaviour.
In the classroom
We evaluated the 3-D Diffraction simulation with two lower sixth form physics classes consisting
of a total of 22 students. All students successfully used the program to obtain the necessary
readings that enabled them to plot the graphs and calculate the wavelengths of blue, red, and green
light. This in itself is very encouraging. The students were immediately able to explore the room
containing the experiment to check what kind of bulb was being used and position themselves (i.e.
the software camera) and the pin in order to take the necessary readings in the space of a single
lesson.
They were given two sets of questions. The answers to all questions were given as a number 1 to
5, where 5 indicates ‘strongly agree’ and 1 indicates ‘strongly disagree’. The first set tested their
understanding and the second set, asked for their views of the simulation. The questions are given
in appendix I and the results in appendix II. On ease of use the responses were extremely positive
with all students bar one recording a score of 4 or 5. On being as realistic as the real experiment
only 2 out of the 22 rated it poorly as 2 or 1, but there were 7 undecided here. On the question of
having the same look-and-feel of the actual experiment there were only 5 negatives in total but 8
undecided and 9 positive. Thus on look-and-feel the positives outweigh the negatives by nearly
two to one. This is perceived as encouraging for a first attempt at an immersive 3-D experiment
where the user interface was restricted to simple key presses and there is clearly scope for
improving upon this.
On the idea of replacing real experiments with 3-D simulations they were rather negative which
was expected and this was the same for whether they thought that they could learn as much from
the simulation as a real experiment.
On all the other questions they were very evenly split, but if divided into two groups, one that did
well on the test and those that did not do so well, there is an interesting result. Those that did well
are very positive about the use of the simulations for revision and preparation but do not rate the
simulation as realistic as those that didn’t do so well, and this group is less positive about the
possible uses for revision and preparation. For example, of the weaker group, 7/10 were positive
about the realism but only 2/10 were positive about the usefulness for revision. In the stronger
group, only 5/12 were positive about the realism whereas 9/12 were positive about the usefulness
for revision. This is perceived as quite logical; those who are very competent can perceive the
weaknesses of the simulation (the degree of realism in this case) but also understand its strengths
too (that despite the lack of total realism it still has useful potential as a revision aid). In contrast
the weaker students are more easily convinced of the realism but perhaps lack the necessary degree
of abstraction to perceive its use as a revision aid.
Conclusions
The crucial part of many physics experiments is how all the varying parameters interact, in
particular how the set-up or calibration of an instrument has an effect on subsequent measurements.
We are clearly able to reproduce this with the Immersive 3-D Screen Experiments that proves very
difficult if not impossible with the ISE approach due to the combinatorial explosion of the
necessary photographs and this is a problem that impacts on all ISEs. Currently there are no ISEs
that have set-up or calibration procedures of any complexity that carry forward the accuracy
achieved in this initial phase into the main body of the experiment. The nearest behaviour to this is
in the Diffraction from a steel ruler ISE [9] where leaving the laboratory light on causes a
reduction in the quality of the results (as clearly the spectra are easier to see in the dark). This
52
causes a doubling of the required photographs which remains feasible. A binary set-up procedure
such as this is clearly of limited value as set-up or calibration procedures are rarely this simple. It
is situations such as achieving a focus (i.e. there is a continuous range of values) that are extremely
hard if not impossible for the ISE approach because of the huge number of required images needed
to implement a second or third degree of freedom.
A common criticism of simulations is that they do not reflect reality, but here we are able to exploit
photographs from real experiments as textures within the 3-D environment and thereby preserve
the realism from the actual experiment just as the 2-D ISEs do.
Furthermore, we do not need to create programming artefacts to represents scales or controls of any
kind. These can be represented at the positions that they are found in reality. Classroom trials
clearly show that students are receptive to this approach although healthily sceptical that such
programs can replace the real thing.
An immersive 3-D simulation using photographs allows us to implement a highly realistic
experience of an experiment where we can utilise many degrees of freedom allowing us to retain
the physicality of the original experiment as well as the essential feature that the quality of the
experimental results are dependent on the care taken with the initial set-up and calibration
procedures.
References
[1] Blitz3d (2009) http://www.blitzbasic.com/ (accessed April 2009)
[2] Bronner P, Strunz A, Silberhorn C, Meyn J. (2009) Interactive screen experiments with single
photons. European Journal of Physics. 30 (2009) 345-353.
[3]
Observing
the
Universe
Open
University
course
courses.open.ac.uk/sxr208/sxr208_index.cfm, (accessed December 2008)
[4]
Exploring
Science
(2009)
Open
http://www3.open.ac.uk/courses/bin/p12.dll?C01S104
University
SXR208
course
S104
[5] Hatherly P, Jordan S and Cayless A (2009) Interactive screen experiments – innovative virtual
laboratories for distance learners. Eur. J. Phys. 30 (2009) 751-762)
[6] Lucas R and Kolb U (2009). Use of 3-D virtual environments in teaching astronomy and
physics. Frontiers in Science Education Research. Ayhan Bilsel and Mehmet U. Garip (Ed.).
Eastern Mediterranean University Press 2009.
[7] Milkshape (2009) http://chumbalum.swissquake.ch/Celestial E-Sphere
[8] The Celestial E-Sphere (BBC Sky at Night cover disk.
www.open.ac.uk/picetl/projects/esphere accessed (2009)
July 2008.
[9]
Measuring
laser
wavelength
with
a
steel
http://www.reading.ac.uk/acadepts/sp/picetl/publish/ISEs/SteelRule2.htm
accessed
20010)
Also
rule.
(February
53
[10] Altherr S, Wagner A, Eckert B and Jodl H.J. Multimedia material for teaching physics
(search, evaluation and examples). Eur. J. Phys. 25 (2004) 7-14)
[11] Gorghui G, Gorghiu L.M, Suduc A.M, Bizoi M, Dumitrescu C and Olteanu R.L. Related
Aspects to the Pedagogical Use of Virtual Experiments. Research, Reflections and Innovations in
Integrating ICT in Education VOL 2. ISBN 978-84-692-1790-0 Ed. Mendez-Vilas 1, Salano
Martin A, Mesa Gonzalez J.A. and Mesa Gonzalez J. Formatex, Badajoz, Spain (2009).
[12]
Hatherley
P,
Macdonald
J.
Interactive
Screen
Experiments.
http://www.open.ac.uk/picetl/activities/theme.php?themeId=460261fae1b28 accessed (2009)
Appendix 1
Questionnaire for evaluation of 3D-ISE Diffraction
(A) Understanding of the experiment
These questions should be answered with a Y for yes or a N for no.
(1) The zero order spectrum is visible at zero degrees from a line drawn from the diffraction grating
at a right-angle.
(2) All the diffraction patterns occur in pairs.
(3) When sin(θ) is plotted against the order, the gradient gives the wavelength of the light?
(4) Moving the position of the eye (camera) alters the diffraction pattern that can be seen.
(5) Moving the position of the sighting pin alters the diffraction pattern that can be seen.
(6) The higher order diffraction patterns are brighter than the lower order ones.
(7) Each of a pair of diffraction patterns constituting an order occur at the same angle of view but
on opposite sides of the zero line.
The following questions require more than just yes or no.
(8) At the zero order how are the various colours diffracted?
(9) List the sources of the uncertainties in your measurements.
(10) Why are the uncertainties not necessarily the same for all the measurements?
54
(B) Opinions about the experiment
These questions should be answered by circling one of the values given where 5 is ‘strongly agree’,
1 is ‘strongly disagree’.
(1) I found the controls easy to use. ( 5 4 3 2 1 )
(2) The simulation was a realistic simulation of the real experiment. ( 5 4 3 2 1 )
(3) Using the simulation improved my understanding of the experiment. ( 5 4 3 2 1 )
(4) The simulation had the look and feel of the actual experiment. ( 5 4 3 2 1 )
(5) I would find such simulations useful as a way of revising certain experiments. ( 5 4 3 2 1 )
(6) Simulations like this could usefully replace actual experiments. ( 5 4 3 2 1 )
(7) I would learn as much from this simulation as from the real experiment. ( 5 4 3 2 1 )
(8) It would be useful to do this simulation before doing the actual experiment. ( 5 4 3 2 1 )
Space for general comments
Please feel free to put any comments you like here. In particular we are keen to hear of any
suggestions which will help us to improve the simulation.
55
Appendix 2 Results
Student who did well
Student
1
2
3
5
6
8
10
11
14
16
20
22
A1
A2
A3
A4
A5
A6
A7
A8
A9
A10
B1
B2
B3
B4
B5
B6
B7
B8
1
1
1
1
1
1
1
1
1
1
1
1
1
1
1
1
1
1
1
1
1
1
1
1
1
1
1
1
1
1
1
1
1
1
1
1
1
1
1
1
1
1
1
1
1
1
1
1
1
1
1
1
1
1
1
0
1
1
1
1
1
1
1
1
1
1
1
0
1
1
1
1
1
1
1
1
1
1
1
1
1
1
1
1
0
1
1
1
1
1
1
1
1
1
1
1
1
1
0
1
1
0
1
1
1
1
1
0
1
1
0
0
0
0
0
1
1
0
0
1
4
5
5
5
4
3
4
4
5
5
4
5
4
2
3
5
5
3
3
3
4
5
3
3
5
2
4
5
4
4
3
4
2
5
3
2
4
2
4
5
4
3
3
3
3
1
3
2
4
4
5
5
5
4
4
4
3
1
3
4
3
1
3
2
1
2
1
4
1
1
1
3
3
2
3
2
3
2
1
3
4
3
2
2
3
3
4
4
5
3
2
4
5
5
3
4
0
1
1
0
1
1
0
1
1
1
1
1
1
1
0
0
1
1
0
1
1
0
1
1
1
1
0
1
1
1
1
0
0
0
1
1
0
0
0
1
1
1
0
0
1
1
1
0
0
0
0
0
0
1
0
0
1
0
1
1
4
5
4
5
4
4
4
5
4
5
3
4
5
5
4
4
5
1
3
4
2
1
2
3
3
4
3
5
4
3
3
2
4
5
3
3
4
1
5
4
3
3
5
3
2
3
5
1
3
3
1
1
2
5
1
3
5
1
4
1
1
1
4
2
1
4
3
1
4
2
2
1
3
2
2
3
4
5
5
4
Students who did not do so well
4
7
9
12
13
15
17
18
19
21
1
1
1
0
0
0
0
0
0
0
1
1
1
1
1
1
1
1
1
1
1
1
1
0
0
0
0
0
0
0
0
1
1
1
1
1
1
0
1
1
56
PIRATE – the piCETL Robotic Astronomical Telescope Explorer
Ulrich Kolb, Robert J Lucas, Vadim Burwitz1, Stefan Holmes,
Carole Haswell, Juan Rodriguez2, Samantha Rolfe3, John
Rostron4, John Barker
Department of Physics and Astronomy
The Open University
Walton Hall
Milton Keynes
MK7 6AA
Abstract
We have set up PIRATE, a remotely operable 35 cm astronomical telescope in a robotic dome at
the Observatori Astronomic de Mallorca, to pilot the real-time use of a telescope by distanceleaning students from their home. Remote access software, webpages and course materials for third
level Open University students were developed. The experience from the first cohort of students of
a 10 week-long project based on PIRATE demonstrates the success of the PIRATE concept for
teaching practical science at a distance, and highlights the benefits distance learning students draw
from a stimulating framework that facilitates group working.
1
The PIRATE hardware
In 2007 piCETL made an investment of order £30 k to purchase an off-the-shelf telescope with a
robotic mount, guider scope, CCD cameras, auxiliary hardware and control software. The initial
aim was to set up a remotely operable facility that allows student access in real-time via the
internet. The initial aim if this project was to demonstrate the feasibility and explore the benefits of
such a device for the university-level teaching of practical science, in particular in the distance
learning context.
Exploiting a long-standing collaboration, the Physics Innovations CETL Astronomical Telescope
Explorer (PIRATE), was erected at the Observatori Astronomic de Mallorca (OAM), a teaching
observatory in the rural heart of Mallorca. The OAM is the host site of the residential weeks of
SXR208 (Observing the Universe), a second level OU residential school course in observational
astronomy and planetary science.
PIRATE initially moved into a temporary enclosure with a roll-off roof, constructed by OAM staff,
on top of the catering building on the OAM campus. Although successfully used for the first
commissioning phase of PIRATE it became clear that the enclosure was not robust enough to
guarantee the fail-safe operation of PIRATE by effectively unsupervised remote student users.
1
2
3
4
Max-Planck Institut für Extraterrestrische Physik, and OAM
OAM
Nuffield-funded summer student 2008
EPSRC-funded OU summer student 2009
57
In 2009 further funding became available for a 3.5 m robotic dome in clam-shell design,
manufactured by Baader Planetarium (Mammendorf, Germany). The dome could be purchased at a
highly discounted price in exchange for dome control software development. In August 2009
PIRATE moved into this new dome, erected on top of the main observatory building at the OAM,
and has been in operation ever since.
The main optical component of PIRATE is a 14 inch (35 cm) f/10 Schmidt Cassegrain telescope (a
Celestron 14). This is equipped with an SBIG STL 1001E CCD camera with 1024x1024 24µm
pixels, resulting in a field of view of 21 arcmin and a pixel scale of 1.21 arcsec per pixel. The CCD
camera has an 8 position filter wheel with 5 broadband filters (Clear, and Johnson B, V, R, I) and 3
narrow-band filters (Hα, OIII, SII). The telescope is mounted on a Paramount ME, a robotic
German Equatorial Mount, manufactured by Software Bisque. A smaller guiderscope (a refractor
with 8 cm aperture and 60 cm focal length, by Celestron) is mounted on top of the Celestron-14
tube. The guiderscope is equipped with its own CCD camera (SBIG ST402 ME, with 765x510
pixels of 9 µm, giving a field of view of 40 arc min in the RA direction).
All main electrical components are connected by remote-control power distribution units with built
in web servers (by Leunig GmbH).
The Baader Planetarium All-Sky dome is equipped with a rain sensor and uninterrupted power
supply (UPS). The dome closes automatically if it detects rain, or if there is a power cut, or if it
loses the connection to its control computers. The maintenance of the facility is carried out by the
OAM free of charge in exchange for a share in PIRATE observing time.
The internet link to PIRATE was upgraded in 2009 from a standard asymmetric DSL telephone
line with correspondingly very slow upload (outgoing) speeds to a symmetric 34Mb/s data link via
a transmitter on site into a commercial high-speed network.
2
PIRATE software
The PIRATE control software consists of commercially available and bespoke piCETL-developed
applications.
The planetarium software The Sky (Sotware Bisque) acts as the driver for the mount, while the
CCD image processing software MaxImDL (Diffraction Ltd) controls the CCD cameras. The
freeware FocusMax operates the focuser. The observatory control program ACP (DC Dreams) is
the central hub linking all of these components together, and is also the server for the student web
interface.
The two main newly developed applications are the dome driver (the Baader Planetarium all-sky
dome is a new product and didn’t have an ASCOM-based driver) and the remote switch server. The
latter acts as a sort of super-hub that allows users to switch essential hardware components on and
off (e.g. the mount, cameras, light in the dome) via phidgets, as well as to open and close the dome,
and to launch ACP.
An expert user can log on remotely onto the PIRATE control PC and hence achieve direct,
complete control of PIRATE, no different from what a local observer in the control room at the
OAM would be able to do. This mode of remote observing is unsuitable for non-expert student
users because of the confusing interface and, more importantly, the security risk in allowing
unchecked access to the main control unit of the system.
58
A more detailed account of the PIRATE software, and of the issues involved in developing the
bespoke components, are presented in the companion paper by Lucas & Kolb (this volume).
3
Student interface
The student users have a number of interfaces and tools at their disposal that allow the successful
acquisition of photometric data with PIRATE throughout an observing run, without granting
security-level access to the system.
3.1 ACP
The main observer tool is the web interface of ACP, which chiefly takes care of the telescope
slewing and tracking, as well as the actual operation of the main camera to acquire images, both
calibration frames and star fields. ACP is a powerful tool that automates the vital tasks of focusing
the system, auto-guiding during exposures, and plate-solving (i.e. comparing star patterns on the
acquired frame against catalogued star coordinates to determine the actual image centre), and a
corresponding pointing update if required, to centre the field on the desired position. ACP provides
the user with progress reports on these tasks, but does not normally require user intervention at this
stage.
ACP also provides a low-resolution preview of any newly acquired images, and allows the user to
browse and download selected full-resolution image files. One image file is about 2Mb in size;
typical observing runs deliver between 50 and 500 images. The student users are asked not to bulk
download these data throughout the observing run so as not to slow down the data line needed to
control the PIRATE system. Instead, an automated FTP process transfers any new data every
morning into the central PIRATE data archive hosted at the OU’s Walton Hall campus. The
archive has a secure, user-friendly front-end which facilitates the download of bulk data by
students.
3.2 The observer’s area on the PIRATE homepage
Throughout the observing run the PIRATE user has to monitor the environmental conditions, to
establish that it is safe to use the telescope, and to assess the likely impact on the acquired data.
PIRATE is equipped with a host of sensors and additional monitors to deliver as complete a picture
of the sky conditions as possible. For security reasons direct access to these monitors cannot be
granted to a large number of non-expert users. Instead, an automated web feed was developed that
provides diagnostic images and sensor readings for an auto-updating web page hosted on the
PIRATE homepage (http://pirate.open.ac.uk). These data include interior and exterior webcam
views of the PIRATE dome, an all-sky 360 degree panorama view (covering altitudes higher than
about 40 degrees), an infrared weather satellite animated clip, and weather data such as
temperature, humidity and wind speed. A rapidly updating webcam feed gives the impression of a
live video stream, allowing students to monitor the opening and closing of the dome, and the
slewing of the telescope.
All live primary diagnostic data and images are frequently copied to an OU server, and taken from
there to feed the diagnostic webpage. Thus the student-user webpage does not reveal the IP address
of any of the diagnostic monitors, and the PIRATE data line is not slowed down by the potential
large volume of traffic generated by multiple user access to these devices.
59
Figure 3.1
homepage).
Screenshot of the PIRATE environmental monitor page (S382 tab of the PIRATE
3.3 The Observer’s Log wiki
PIRATE observers keep a detailed log of their activities during the observing run. This includes
information on the actual target and image data (such as exposure time and filter used), as well as a
record of environmental conditions and notes on any unexpected behaviour or problems. This
Observer’s
Log
is
kept
in
the
form
of
an
OU-hosted
wiki
(http://www.open.ac.uk/wikis/PIRATE/Observer%27s_Log) which can be edited only by
registered users, but read by anybody. Crucially, the log is also used as a communication tool
throughout the observing night. Expert PIRATE users (who may or may not be affiliated with the
OU) can monitor the work of the student observer and may be able to offer advice on any reported
problems by adding comments to the wiki log entries.
60
Figure 3.2
4
Screenshot of a sample Observer’s Log entry.
Student-use and supervision
The way PIRATE is being employed for student-use addresses the desire to give real-time control
of PIRATE to a large number of students while still maintaining a manageable hands-on feeling.
This latter requirement effectively limits the number of simultaneous users to 2-4 students.
Members of such a small observer team can simultaneously log on via ACP and receive real-time
status updates. The team members take on different roles throughout the observing night, such as
operating PIRATE, keeping the Observer’s Log, taking responsibility for monitoring
environmental conditions, and inspecting new data for image quality.
In addition, a satisfactory student experience demands that observers obtain and subsequently
analyze what they would consider “their own” data. This is made difficult by the unpredictability
of the weather. On average, one out two OAM nights is useful for differential photometry, a typical
higher-level application of PIRATE, throughout spring and summer.
For the 10 week-long PIRATE project in the third level OU course S382 (Astrophysics) this was
resolved by forming a number of project groups of about 10 students each. A project group is
responsible for staffing observer teams of 2-4 students for nights allocated to the group. The project
group students share all of the data their teams acquire, and collaboratively analyze and interpret
these data. Each group was given enough observing nights to ensure that any individual student
could contribute in at least three observing runs as part of an observer team. Taking part in at least
one half of an observing night was set as one of the conditions for the successful completion of the
61
project. In this way up to 70 students can be served as part of the S382 PIRATE project. In the
2010 pilot presentation the number of students was limited to 30.
The greatest organisational challenge from a teaching point of view was to deliver an introduction
into the safe use of the PIRATE facility to the cohort of S382 distance learning students within a
manageable time frame. This was achieved in the form of a series of Elluminate-mediated group
evenings which then split into a number of smaller groups of up to 5 participants (including tutor)
who communicated via Skype while operating PIRATE. In the Skype session each student is asked
to control PIRATE for a few minutes, with the tutor watching and talking the student through
procedures. Skype rather than Elluminate was used because of its superior sound quality, and
because it is less demanding on student PCs that are already serving a host of PIRATE control
applications.
During subsequent observing nights members of the observer team kept in constant audio contact
via Skype. They could also contact a nominated night duty astronomer (NDA), an expert PIRATE
user, via Skype or an emergency telephone number. The NDA role is important to safeguard a
satisfying student experience and the well-being of the hardware. The NDA initially acts as a tutor
for the first phase of the first observing night of an observer team, but then takes on a simple
trouble-shooting or emergency role.
5
Evaluation
Here we can only briefly touch upon the recent experience of using PIRATE with OU students
studying the 10-week PIRATE project of S382. The goal of the project is to acquire a long-term
light curve in different broadband filters of an as yet unclassified, or little studied, periodic variable
star, and constrain the physical nature of this source.
At the time of writing this project is ongoing, and a fuller account of the rich feedback on the
teaching and learning experience will be presented elsewhere. It is already clear that the
collaborative nature of the PIRATE project was a resounding success, as evidenced by the fact that
the 25 active project students, distributed between three project groups, generated more than 1000
VLE forum postings between them in the first 7 weeks of the project. These postings range from
simple statements of availability to discussions of results of the data analysis.
At the time of writing the phase of scheduled observing nights for the S382 PIRATE project draws
to a close. PIRATE was in use during 38 out of 41 available nights. About 20 night delivered goodquality long-term light curves, but most of the remaining nights still gave some useful data, albeit
with more noise. A non-negligible fraction of observing nights was cut short some time after
midnight due to high humidity levels at the OAM, a seasonal characteristic of the site in spring.
The dome had to be closed to protect the equipment from condensation on unheated surfaces. The
installation of further protective devices that would enable the use of the system at high humidity is
being investigated.
Throughout the S382 observing period there were no serious technical glitches. It was necessary to
call out OAM staff for night-time assistance only on three occasions. On two of these the UPS unit
of the dome developed a fault and prevented the remote use of the dome. This recurring technical
problem is being addressed jointly with the dome manufacturer. The other OAM call-out arose
after the sudden loss of any communication with the PIRATE system. This turned out to be a
planned night-time internet downtime for upgrade work by the local internet service provider
which was not communicated to the OU.
62
Other minor operational problems could all be easily resolved by the NDA via super-user access to
the system. After the initial teething phase of 2-3 weeks with numerous hardware and software
problems the routine workload of the NDA settled at a pleasingly low level, with very few
occasions where observer teams contacted the NDA because of a problem.
The student-use of PIRATE was much more enthusiastic than anticipated. Observer teams
routinely stayed up into the small hours even in largely clouded nights, wrestling with the system to
still obtain some useful data. As a result, the alternative “bad weather tasks” were rarely used. This
highlighted the fact that PIRATE delivers data that are useful in a teaching context even in rather
poor conditions when professional observers would long have given up observing.
The expected failure of automated processes such as the auto-guiding or the focusing in non-ideal
weather conditions – what was initially perceived as a threat to the successful use of PIRATE by
non-expert student users - turned out to be a valuable feature contributing to meeting the learning
objectives. Guider, focus and pointing failures all leave characteristic marks on the acquired
images, and the correct reading of these, as well as the discussion and implementation of counter
measures, constitutes a vital part of practical scientific investigations. It also gives the experience
of being involved in an interactive, real-time experiment, much more so than a faultless system that
automatically returns perfect results on the press of a button.
Another extremely beneficial feature is the regular, long audio-contact of students when they work
as part of an observer team (normally at least three times during the project, but many students
volunteered to take part more often for at least some fraction of additional observing nights). This
is a unique chance for sharing and discussing course-related science, data analysis techniques and
results, or technical issues. It is obvious that these team meetings provide an enormous additional
stimulus for continued active engagement with the project as a whole. The first observing night of a
team also always involves the NDA who can provide further reassurance and advice on the project
in general, and at times engage in deep and stimulating discussions with students.
The PIRATE project requires students to work throughout the night when they are part of an
observer team. There was some initial concern about the sustainability of this mode of study, with
the often held view that a remotely operable telescope on the other hemisphere, offering night-sky
access during the UK day-time, would be advantageous to a facility at effectively the same
longitude as the UK. This concern was probably unwarranted. Due to work commitments a
significant fraction of OU distance learning students appears to prefer studying in the evening –
and they regard the night-time work as the natural extension of a period when they would study
anyway (which is not to say that night-time work isn’t demanding!).
Conclusions
The use of the PIRATE facility represents a novel and ambitious approach to teaching practical
science at a distance. The technological challenges are significant, and work to improve the current
hardware and software setup is ongoing. The third level 10 week-long PIRATE project in S382
was received with great enthusiasm by S382 students, and can be regarded as a resounding success.
The presentation of the project did not only prove the feasibility of including a remotely operable
observatory in distance teaching, but also very clearly highlights the enormous learning benefits of
giving remote students in small groups real-time control of a versatile measuring device. A future
expanded use of this, and similar facilities, should become integral part of the OU science
curriculum.
63
Software architecture for an unattended remotely controlled telescope
Robert J Lucas and Ulrich Kolb
Department of Physics and Astronomy
The Open University
Walton Hall
Milton Keynes
MK7 6AA
1. Introduction
PIRATE (Physics Innovations Robotic Astronomical Telescope Explorer) consists of a14 inch (35
cm) f/10 Schmidt Cassegrain telescope (a Celestron 14) on a robotic mount, in a robotic dome on
top of the main observatory building at the Observatori Astronomic de Mallorca (OAM).
PIRATE's main duties are for supporting research and teaching and it is the latter that brings quite
stringent requirements for security whilst still offering the students comprehensive access and a
rich experience. We cannot rely on the students closing the dome in bad weather, it must happen
automatically. Additionally the observatory site is commonly unmanned during observing
sessions, i.e. there is no one there to re-boot PCs, remove dust caps, attach dew shields, or make the
telescope safe during bad weather. We have to achieve all these things without local assistance or
remove the need for them in the first place.
Figure 1. A view of the PIRATE installation at the OAM
2. The hardware components
The companion paper by Kolb et al (this volume) describes the hardware from the viewpoint of its
astronomical or observational parameters. Here the hardware will be described pointing out the
features where relevant that impact on the remote control aspects of PIRATE. The hardware
consists of the following devices:
•
An AllSky dome made by Baader Planetarium (www.baader-planetarium.com/). This is
of the clamshell design, so there is no dome slit that needs to be rotated in order to keep a
celestial target in view. The dome is normally powered from the mains but it has a battery
64
back-up which is essential for closing the dome during a power cut. It is equipped with its
own temperature sensors for ambient and cloud as well as a rain sensor.
•
A PC running Windows XP known as PC1. This hosts all the necessary software for
controlling all aspects of the telescope. Much of this software is bespoke and its design will
be discussed in this paper. There is also a great deal of software that is "off the peg", such
as ACP (acp.dc3.com/) for executing imaging plans and MaxIm DL (www.cyanogen.com/)
for camera control and imaging.
•
A backup PC also running Windows XP and known as PC2. This is used for monitoring
weather from the non-dome sources of weather information and for a backup for PC1
should that computer develop a fault.
•
A German Equatorial Mount (GEM), this is a Paramount ME, an extremely robust mount
that has been designed with remote operation in mind (www.bisque.com/me/). This is
connected to the PC via a serial port.
•
A Celestron Optical Tube Assembly (OTA) as described above. This is attached to the
mount and has no electrical connections. (www.celestron.com/).
•
A guide 'scope consisting of an inexpensive Celestron refractor. This also has no electrical
connections.
•
A main camera, SBIG 1001, with a controllable Peltier cooler, for long exposure, high
resolution imaging and photometry. This is coupled to a filter-wheel containing eight
filters. The camera and filter-wheel connect to the PC via USB. (www.sbig.com/).
•
A guiding camera, SBIG 402, with controllable Peltier cooler' for accurate guiding of the
mount. This takes a very small image of a suitable star every few seconds, the centoid of
the star is calculated in Maxim DL and depending on how the star wanders, various guiding
alterations are sent to the mount to compensate.
•
An Optec electronic focuser with temperature compensation. This is used with FocusMax
to achieve as near perfect focus as possible through all the different filters
(www.optecinc.com/). This is connected to the PC via a serial port.
•
Heating strips for the main OTA and the guide 'scope. These are to prevent dew build up
on the correcting lens of the main OTA and the objective lens of the guide-scope.
•
Two banks of four Phidgets which are PC controllable mains power switches which we use
for powering up much of the hardware described above (www.phidgets.com/).
•
Several webcams giving views of PIRATE from inside and outside the dome. These are IP
enabled and can be accessed directly from the internet as well as from the PIRATE web
pages (http://pirate.open.ac.uk/).
65
Figure 2. Representative view of connections showing how power is supplied to the various
PIRATE hardware components.
3. The off-the-peg software
3.1 The Sky
This is a planetarium style program by Software Bisque (the manufacturers of the Paramount) that
also doubles as the driver for the Paramount GEM. It gives a view of the present state of the
heavens and where the telescope is currently pointing.
3.2 MaxIm DL
The imaging software, MaxIm DL, controls both cameras and the filter wheel. As well as
controlling exposure times and guiding it also provides the means to cool the cameras to particular
temperatures. Not only does it do these functions via a visible interface but it also exposes a
number of ASCOM (http://ascom-standards.org/) programmable objects, such as camera and
document objects that can be used by other programs such as the main plan controller, ACP. But
as importantly, we can use these in our own programs.
3.3 T-Point
This application works in conjunction with The Sky, which it is supplied with, to improve polar
alignment and improve pointing by mathematically modeling all the various factors that contribute
to pointing errors such as tube flexure. It does this by using a series of observations where operator
chosen stars are driven to by The Sky driving the mount and then the operator manually applies a
66
correction to the position to centre the star in the field of view whether through an eyepiece or on a
CCD chip. Clearly, one of the factors that can introduce a pointing inaccuracy is any error in polar
alignment, hence T-Point can advise on what corrections to make in Alt -Az to improve the mount.
In the case of the Paramount it makes very precise recommendations in terms of the number of
turns to make to the Alt-Az knobs that control the precise alignment of the mount.
3.4 Pin Point
This uses a database of 2 million stars to match against any image. This is used to correct for any
pointing errors by identifying the matched stars in the field and then calculating the necessary
movement to be applied to the mount to correct for any error. In practice this means that we can
guarantee that our targets are perfectly centred on our imaging chip.
3.5 FocusMax
FocusMax (http://users.bsdwebsolutions.com/~larryweber/) is a freeware application that allows
excellent automated focusing. It calibrates the focus control by taking a series of exposures at
different focus positions and plotting these positions against the half-flux diameter of a stellar
image. It then calculates the lines of best fit, which it calls the V-curve. The obtained V-curve can
then be used to compute the ideal focus position given the half-flux diameter of a star image.
Different V-curves are calculated for all the filters.
3.6 ACP
(See Figure 3) This is the main controlling application that coordinates the use of the above
software components. Principally it allows the execution of observing plans and the remote
operation via a web interface. However, in achieving these main aims it provides a myriad of
functions from automated flat taking to dome control and integration of weather data.
3.7 VNC
This provides us with remote access to the control PC at the observatory via the internet
(www.realvnc.com). When executed from any other PC, which can be anywhere in the world, it
presents a scrollable window that is the screen of the control PC. The computer can then be
controlled by the keyboard and mouse of the remote machine exactly as if you were sitting in front
of it.
67
Figure 3. The ACP web user interface
4. The bespoke software
4.1 Powering the hardware devices, the SwitchServer
From early on, it was clear that we needed to be able to switch the electrical supply to all devices
from the control PC; we would then have remote access to powering these devices via VNC. One
of the authors had some experience of using Phidgets to control switching of hardware for
stereoscopic use and a check of their specifications verified that they would be within their
capabilities for switching mains circuits. Initially a simple Phidget Switcher was coded that gave
us the ability to switch on and off devices by using this program on PC1, which we could then use
remotely via VNC. However, we knew that this was not going to be a viable solution for any
students using PIRATE as we did not want them to have any direct access to PC1 as this might
cause any number of security issues. Therefore we needed to investigate how remote access to the
switches could be provided.
The Phidgets come with software for remotely controlling them over the internet and even had
facilities for setting and querying variables that might have been used for controlling other aspects
of PIRATE. Unfortunately these remote facilities could not be used as they required multiple
TCP/IP connections using addresses that were not compatible with the Open University’s firewall
restrictions. Hence it was necessary to build our own SwitchServer that used a single TCP/IP
connection with an address and port number of our choosing.
68
It was clear that the dome would need to be controlled remotely. We were involved from the
earliest stages with the design and implementation of the AllSky ASCOM compliant dome driver.
The dome has its own temperature and rain sensors. We had made the design decision that the
firmware that controls the opening and closing of the dome leaves via a set of four motors and
position sensors should be as autonomous as possible. So it was decided that should the dome rain
sensor detect rain then the firmware should close the dome without any instruction being required
from the driver. It was also decided that should the firmware not be polled by the driver for more
than a minute then it should assume that the connection to the PC had failed and in this case the
firmware should close the dome. We believe that this makes the entire system considerably safer
as we do not need to rely on the controlling PC issuing the necessary command in response to the
conditions. The chain of command between the detection of the rain and the closure of the dome is
as short as it can be.
The SwitchServer can issue open and close directives by use of the ASCOM dome object exposed
by the driver. Additionally the dome driver is used to access the current ambient temperature
which is subsequently used to determine target temperatures to cool the cameras to. The cameras
need to be cooled to as low a temperature as is feasible to minimize thermal noise in the
electronics. This needs to be done in stages to prevent condensation building on the chips. First
the cameras are connected and the coolers switched on. Then an initial setpoint is chosen as 5
degrees below ambient. When this is reached there is a programmed pause before issuing the next
setpoint. This continues until the final setpoint (as calculated from the ambient temperature) is
reached. Finally the power that is being provided to the Peltier cooler is monitored, if this is close
to 100% then the final setpoint is increased by 5 degrees to ensure that the temperature can be
maintained. Although different target temperatures are used for each camera, the algorithm
described above is essentially the same.
The SwitchServer also has access to sunrise and sunset times and will close the dome should it find
it open during daylight and not allow it to be opened in daylight. This is because the OTA has no
cap so that if the dome were to be open during the day then it is possible that the Sun might shine
down the tube causing the cameras to become very hot and probably sustain damage.
69
Figure 4 The SwitchServer running on the control PC
The SwitchServer can be used directly by logging onto PC1 locally or remotely. For remote
student access it uses a single TCP/IP socket to listen for incoming connections. On receiving a
connection request it establishes the connection on a second socket and waits for the command
string to arrive via the data received event associated with the socket. The request is parsed, the
associated password is validated, and finally the command is passed to the relevant object (which is
usually either the dome, phidget or camera object). The above screen shot of the SwitchServer
shows the command strings being received in the large scrolling window at the bottom right of the
application.
4.2 The SwitchClient
The SwitchClient sends commands to the SwitchServer. The user needs to provide a password and
this is concatenated with each command sent so that it can be validated by the SwitchServer. A
program has been written that generated passwords that are valid from midday of the night in
question until midday on the following day. Typically a different group of students use PIRATE
on each night until all of the groups have had their turn and then they start over. Each group is
issued with a password that is valid for their particular session preventing one group interfering
with the observations of any other.
70
Figure 5. The SwitchClient showing the cooled cameras and ACP having been started.
The SwitchClient connects to the TCP/IP socket on the SwitchServer for each command issued.
This means that several different users can use the SwitchClient at the same time. Typically the
students in an observer team will nominate one to actually submit the commands whilst the others
will be able to watch the current state by simply clicking on the Refresh button. When the
command has been executed on PC1 a message string is returned via TCP/IP to the SwitchClient
that contains the status of all of the checkboxes and writeable labels that you can see in the picture
of the SwitchClient given above.
5. Evaluation
PIRATE went live with its first set of students on 17th April 2010. For the most part it has
performed well with very little down time, and the student response was very positive. A detailed
first evaluation is given in the companion paper by Kolb et al (this volume).
There have been a few operational things we would have done differently, such as giving ourselves
one evening per week to perform upgrades and testing. We also have experienced ongoing
problems with the dome and driver which has on occasion meant that the night duty astronomer
had to step in and take manual control of the dome. We are improving the situation continuously as
new problems arrive.
6. Improvements
There are several improvements that we will be implementing before the next student cohort begins
its use of PIRATE. In particular we want the SwitchServer to monitor the internet for
communication problems and we want it to have access to more of the weather information, in
71
particular the humidity and wind speed sensors that are not part of the dome’s setup but are
currently monitored on the second PC.
7. Conclusions
When we started this project we thought that very nearly all of the requisite software and hardware
would be available off the shelf. This has not been our experience. We have found ourselves
climbing a steep learning curve where, because of the security issues involved in giving students
access to an unmanned telescope, we have had to provide a great deal of the controlling software
which has needed a good deal of thought to enable us to negotiate various restrictions whilst
providing the needed functionality. Ultimately we have achieved what we set out to do. We have
had a very successful first cohort of students using PIRATE and most problems that have arisen
have been swiftly resolved. We hope that our experiences will be of value to others who wish to
provide similar facilities.
72
CAPITAL: (Collection of Astronomy and Physics Images for
Teaching And Learning)
Robert J Lucas, PiCETL
Overview
A database and associated application has been designed and implemented that supports a general
image bank facility from which particular image banks can be constructed. An Explorer type view
is used to select images for a particular course. Upon completion of the selection and editing an
individual image bank is automatically generated. The design and coding has been completed and
we are currently awaiting a sufficiently large dataset to populate the master image bank.
The following describes the functionality of the Image Bank Editor which is the core application of
the CaPITAL project.
Introduction
An image bank is a hierarchical collection of images and their associated data. The image banks
all have a rigid structure which can be navigated using the Image Bank Editor or Windows
Explorer.
This is a view of the S194 image bank from Windows Explorer. This view will be used to
familiarise you with the hierarchical structure that is used.
At the top is the name of the image bank, S194. Within this folder are all the folders that store the
sections. These are: ‘050_stars’, ‘Astrobiology’, ‘Galaxies, ‘The Solar System, ‘The Sun’ and
‘The Universe’.
The ImageBank.mdb file can be ignored for the moment. Each of the folders can be double clicked
to reveal its contents (or the plus sign single clicked). For example opening ‘Galaxies’ reveals:
73
Here we have three subsections: 07010_the Milky Way, 07020_other galaxies and 07080_clusters
of galaxies.
We can open one of these such as 07080_clusters of galaxies in the same way to reveal:
Each of the folders listed here are for a single image. If we open one of them you will find:
This contains the image itself, its thumbnail, a caption file in Rich Text Format and a record
descriptor file, ImageData.mdb. This last file is an Access database file which contains all the
other attributes of the image, such as its copyright and web information.
The contents of this folder should never be edited directly. The Image Bank Editor described
herein looks after the contents of each of these folders for you and gives you a simple Explorer-like
interface to the image data.
74
What you should take away from this section is the simple hierarchical structure. At the top we
have image banks, beneath these we have sections, beneath these we have sub-sections and beneath
these we have the image folders which store all the data for each image, one folder to one image.
A quick look at the Image Bank Editor
The panel on the left is a tree view (the same sort of view that Windows Explorer uses). This lets
you drill down to the images within each Image Bank’s sections and subsections.
If a subsection is currently selected then a left-to-right scrolling list of the images in that subsection
is displayed at the bottom of the screen. An image may be selected by clicking on it. When an
image is selected all its associated data is displayed in the tabbed dialog on the upper right. Each
tab stores a related set of data. The data displayed on the tabbed dialog is dependent on the type of
image you have selected, for example diagrams have different attributes than a telescope image.
Using an existing image bank supplied on disk
If you are given an image bank on disk, either it will either be an entire image bank set and be in a
folder called ImagebankRoot. In this case copy the entire folder to your C drive root. Or you will
be given a single subject image bank such as S282. Copy this to your ImagebankRoot folder
(create one if necessary, it should be in the root of your C drive).
Creating a new image bank
75
When you run the application the root folder for the Image Bank will be highlighted in the Tree
control on the left.
Any folders appearing inside this are complete image banks. One of these folders should be the
ImageBankMaster (it is possible to work on any image bank without having the master databank
present). This is the image bank that contains all the images and associated data. Any other image
banks that appear here are subsets of the master image bank tailored to particular courses.
To create a new image bank select New from the File menu. You will be prompted to supply a
name for the new image bank. If you are starting the master image bank then use the name
ImageBankMaster.
Once you have given the name and clicked on OK the new image bank will be created as a folder
of this name and will appear in the Tree View.
Notice the lack of a plus sign to the left of the folder icon for S357. This is because the folder is
empty and has no sections or subsections defined for it.
76
Creating a new Section
With the new image bank selected:
Choose New from the file menu:
When you have given the section a name click on OK and the section folder will be created. It can
be seen by clicking on the plus sign next to the S357 node:
Creating a new Sub-section
With the section selected:
77
Select New from the File menu:
When you have given a name for the sub-section and clicked on OK. The folder for the subsection will be created. Clicking on the plus to the left of the section name will let you see it:
Creating an image folder
With the relevant sub-section selected:
78
Choose New from the File menu:
Now you must choose what type of image you are adding from the drop-down list box. A unique
name is supplied for you although you can change it. It is not important that this name is just an
arbitrary string, it is only used internally, it will never appear to a user and you will select images
from their thumbnails not their name. So it is a good idea to accept the name that is suggested. In
any event the name must start with the letters ‘IB’ as this is how the folder is identified as an image
folder.
Pressing OK will create a new image folder with the name given in the folder of the subsection that
was selected (in this case ‘Star formation’. This new image folder is initialised with a caption file,
and a skeleton record file. You can now edit these and add an image to complete your new image
entry.
Editing image data
79
When the subsection ‘Star formation’ is selected the images within the section are displayed at the
bottom of the screen. In this case all we can see is the label ‘IB10001’ as we have not assigned an
image to it yet.
If we click on the label for the image, i.e. ‘IB10001’ then selecting New from the File menu will
prompt us to select an image:
80
The pull-down list at the bottom of the dialog allows different image types to be listed. Choosing
and image and clicking on Open will prompt you for whether you wish to have a thumbnail image
created for this image:
Selecting Yes will automatically create a thumbnail image that will be used for selection purposes.
The thumbnail will immediately appear in the scrolling selection window at the bottom of the
application:
81
Editing an image’s data fields
You can access all of the data fields via the tabs on the right-hand side of the application. Any
changes made can be saved by selecting Save from the File menu. Alternatively, if you select
another image after making edits then the application will prompt you to save your edits or
abandon them.
There is one data field that is treated quite differently from the others, that is the Caption field.
This is because it can contain formatted characters and is stored in Rich Text Format, this requires
a word processor such as Microsoft Word in order to edit it.
Editing an image’s caption
The Image Bank Editor needs to know how to invoke your Word processor. You need to create an
entry in the applications ‘ini’ file. If you don’t, the entry will default to simply ‘winword.exe’
which may or may not work on your computer. Here is a typical imagebank.ini file:
[Editor]
c:\Program Files\Microsoft Office\Office11\Winword.exe
[DisplayImage]
TRUE
[ROOT]
c:\ImageBankRoot
[NEXTIMAGENUMBER]
82
IB 10002
Under the label [Editor] a complete path to the Microsoft Word editor has been given. This
guarantees that the Image Bank application will be able to run Word. If you want to find out where
Winword.exe is on your system then use Explorer to search for it. Then copy and paste the entire
path into the ini file. The ini file should be edited with Notepad which is usually found in
Accessories.
Clicking on Edit will invoke Word to open the caption file which you can then edit:
83
When you have finished editing your caption, save the caption from within Word and then close
Word. To see the edited caption from the Image Bank Editor, click on Update Display.
Common errors
On updating a record you get the message Error search key was not found in any record. This
generally indicates that the Access record has become corrupted. It can be repaired from within
Access by choosing Compact/Repair from the Tools menu. The tree view within the editor
indicates which Access mdb file needs to be repaired.
Data conversion tips
When copying and pasting text from the htm files to Word, this should be done one column at a
time. After pasting all the text should be selected and the font colour changed to black.
When observation dates span a period of time, the observation date field should be left blank and
the dates put into the notes section.
There is no need to input any keywords as these are created automatically from the full text of the
captions.
84
The Design of an Image Bank for Astronomical Images
Robert J Lucas
Department of Physics and Astronomy
The Open University
Abstract: Image Banks, which are collections of images with associated data and captions, are a
valuable teaching tool for Astronomy courses at the Open University. Until now web pages have
been created for each image and its associated information. This paper examines how a database,
front-ended by a multimedia authoring tool, can provide a much more flexible and maintainable
architecture for producing Image Banks. Accessibility issues are discussed.
Introduction
Image Banks are used within several Astronomy courses presented by the Open University. They
typically consist of between one and two hundred images with titles, captions (often running to a
thousand words or more), dates, credits and scale information. The idea is that these images can be
browsed by logical sections or by searches on the captions. The student might be investigating a
certain kind of object. Sometimes exercises can be carried out on the images such as measurement
of a particular feature. The image banks are perceived as being vital components of the relevant
courses.
Until recently these image banks have been created by using Dream-Weaver to create a set of
individual web-pages that incorporate the image and the various text fields. Hence a particular
image and its various text fields will become a single web page. The web-page approach has some
advantages: everyone has a browser with which they can view the image bank, so there’s nothing
to install and the image bank will run straight from the CD/DVD. Also screen readers such as
JAWS (Job Access With Speech) are able to read the text for partially sighted and blind users.
It is foreseen that Image Banks will be used more widely, thus a more generic approach to creating
and maintaining them is seen as highly desirable. Ideally, we would like to have a viewer which
can be used with any set of images so that the viewer and the sets of data it can use can be
maintained independently of each other.
Requirements for an Image Bank Viewer.
(1) A generic approach can be taken to viewing the images that does not require each image to be
individually processed to produce a web-page or some such viewing medium. It shouldn’t be
necessary to produce pages that list all the hyperlinks to sections and subsections. These should be
generated automatically from the data.
(2) The viewer must not rely on the user having any particular application installed unless this is
something that the user must have anyway (such as a web browser).
(3) It should not need to be installed.
(4) It should run directly from the CD/DVD.
(5) We want to be able to pan and zoom images.
(6) Measurement tools should be incorporated into the viewer.
(7) Accessibility should be addressed.
85
Proposing a solution
The first requirement suggests a database approach with each image being associated with a record
in a table. This table would store all the textual items and give the path to the particular image. A
page can then be created that can display any of the images with its associated data fields.
Additionally, pages giving hyperlinks to each of the sections can be generated at run-time.
The second requirement rules out using Power Point, Word or whatever as either the application
delivery mechanism or as an Active X component for viewing images or documents.
The third requirement makes component-based applications unusable. Hence, VB, C, C++ and
Delphi are all going to be problematic as development tools.
Requirement 4 limits us to certain multimedia application generators that are designed with exactly
this in mind.
Requirement 5 should be available in any programming environment and we would certainly
expect a multimedia-authoring package to be able to provide this.
Requirement 6 can be satisfied just a long as a minimal amount of programming is available to us.
Requirement 7 will be discussed in its own section ‘Accessibility’.
Database Connectivity
It is clear that an Image Bank that is required to work with various collections of images and their
associated data should be a database application. With the added requirements of needing to
operate directly from CD/DVD with no installation then a multimedia development tool with
ODBC (Open DataBase Connectivity) is going to be the only solution. These requirements are met
by the Opus Professional Multimedia development environment. This has the additional advantage
of permitting programming in Java.
ODBC drivers, which are available as part of the Windows Operating System, give access to a
huge range of databases some of which are not actually genuine databases at all, but are just treated
as such. This is achieved via SQL (Standard Query Language). This allows us to select fields
from tables of information, apply conditions on whatever is selected and impose ordering on
retrieved datasets. Whether we have a genuine database system such as Oracle, or a table of data in
the form of an Excel spreadsheet is of little consequence as we access both using identical SQL
strings. There are questions of efficiency and sharing which commercial database systems address
but simply don’t apply here where we have a relatively small, non-shared dataset. A fully-fledged
database system such as Oracle would not be feasible here. It couldn’t be provided on a runnable
CD/DVD, it would require the user to have Oracle installed, and it’s very expensive amongst many
other reasons. A PC based system such as Access would provide all that we want, but again it
could not be used on a runnable CD as it would need to create a log file at run time which could not
be achieved on a read-only device. Hence, an Excel spreadsheet will serve as the database, with
the connection to the application provided by a suitable ODBC driver.
86
Accessibility
It is certainly not clear that Opus can provide the necessary Accessibility features as its controls do
not even support a tab ordering which would allow it to be controlled via the keyboard rather than
the mouse. Some experimentation has shown that tab-ordering can be achieved by programming it
in for each screen, but it is surprisingly clumsy and elaborate. However, it is an easy matter to use
keys for the same functions as on-screen buttons. For example, the PgDn key can be used instead
of mouse-clicking on the Page Forward button.
Screen readers such as JAWS need access to the underlying text in order to be able to render it as
speech. This is only usually the case for the major Microsoft applications like Word where it has
been specially provided for or in HTML documents where the source text is not encoded
(surprisingly screen readers never do screen-scraping coupled with Optical Character Recognition,
they always require special hooks to be provided that give them access to the underlying text).
In addition to tools such as JAWS which are aimed squarely at the partially sighted or blind user,
there are a multitude of Text To Speech (TTS) applications available. A common facility is being
able to paste text into them and have it converted to WAV or MP3 format, i.e. the text is rendered
into a spoken form and stored as a sound file in one of the Windows standard formats. The latest
generation of TTS programs, such as Natural Reader from AT&T is really very good with a tonal
quality that is good enough to be used where students would prefer to listen to the captions rather
than read them. Thus we can take all the text from our captions and other fields and translate them
to sound files that can be played by the multimedia application. Additionally we can make help on
navigating and using the application available as both text and speech. This actually works better
than using an application like JAWS which tends to deliver an unnecessarily large amount of
information about the current window. Whereas, our application restricts itself to exactly what the
blind user needs to know.
Formatted text
There is a requirement for some formatting of the text such as subscripts used in chemical formulae
and superscripts to indicate numerical powers. These are surprisingly awkward to deal with. A
superscript character is not simply an item of a character set. It is such an item plus additional
attributes set for this item. So when a character string is read in from a database character field
there is no such attribute data and any such formatting simply does not exist.
Unicode gives us the capability of storing wide character sets, but these do not address consistently
the need for superscripts and subscripts. Typically some values such as 2 for squared and 3 for
cubed will exist but little else. For this reason Unicode is simply a red-herring.
The options that remain are to:
• Mark all cases of special formatting with escape sequences so that the formatting can be
applied once the data has been extracted into the application.
• Store the data in a standard format such as RTF (Rich Text Format).
Perhaps surprisingly SQL based databases do not have the capability to store any formatted text
directly. There is no formatted text type in the SQL Standard. If the second option is to be used
87
then a binary type is needed for a database field which is to store it. Or store each of the captions
in its own formatted file which is then referenced in the database.
Having stored it, as binary (which precludes the use of text files or spreadsheets as our database
source, something that we might wish to do if we were to use ODBC) then we need to be able to
retrieve the formatted text and then display it in its formatted form. We also need to be mindful that
we might wish to change other attributes of the text, such as size for readability.
Opus will allow us to use a document viewer to view any Active X document. However, this
requires the application that views this format to be present on the end-user’s machine. This
clearly cannot be guaranteed in the case of Word or Excel. The only viable format is RTF which
can be displayed without recourse to an external application.
Image Bank Design
The design for the Image Bank used an Excel spreadsheet as the database. The Image Bank
application was written in Opus and used an ODBC connection to the database. The database
stores the captions, the image file paths and other information such as credits and image size. In
the first instance, superscripts and subscripts were catered for using escape sequences. This is not
ideal and in future we will store the captions in individual RTF files with a reference to them in the
caption field of the database.
Features, such as being able to do on-screen measurements, panning and zooming were
exceptionally easy to program into the application using the underlying Java language and the
available set of multimedia functions.
The Image Bank viewer which shows the measurement of the distance between two sunspots.
88
Conclusions
A high-level multimedia authoring tool coupled to a database has proved an excellent architecture
for the design of the Image Bank. We are now looking at designing a Resource Library from
which Image Banks for different courses can be automatically generated from the department’s
entire collection of image and image-related data. This will require the course editor to simply
select the images required for the course causing the entire CD/DVD image to be created. This
will remove the hard work currently needed to create a new Image Bank and also remove the
possibilities for errors.
Although we haven’t as yet incorporated the text to speech technology into our current version (due
to licencing difficulties), the effectiveness of this approach is manifestly obvious. Our students can
spend their time looking at the images instead of reading the text. Additionally we can provide
instructions for using the package as speech generated directly from the Help text.
References:
A Guide to the SQL Standard. C.J. Date with Hug Darwen. Addison Wesley 1993.
Illuminatus Opus Pro User Manual and Additional Features. Digital Workshop Ltd.
89
DVD Image Banks for Astronomy and Meteorology Courses
Shelagh Ross* and Stephen Lewis
Department of Physics and Astronomy *and π-CETL
Abstract Image banks have been compiled for introductory courses in astronomy and meteorology
and delivered to students on DVD. Material in the image banks includes images, slide sequences
and video clips, each with an associated caption that is tailored to the learning outcomes of the
course. The reactions of students to both the content and the architecture of one of these image
banks are examined.
1
Introduction
The first Level 1 Open University (OU) course in astronomy included a book, Images of the
cosmos, which assembled a large number of colour pictures. When the course was re-written as
S194 Introducing Astronomy, designed for delivery to students through electronic media, these
pictures were compiled into an ‘image bank’ on DVD. A more recent course, S189 Understanding
the weather, has further developed the original image bank shell and has built up a new DVD
resource of meteorological images. (Both DVDs contain other items in addition to their respective
image bank.) The purpose of each course-specific image bank is to provide core information that is
not in the course book, as well as to enrich and reinforce other course material. In both courses
some assessment questions are based on the image bank component.
The ultimate aim is to widen the scope of the project from relatively small, course-specific, image
banks so as to develop a large repository of easily retrievable pictorial material that can be stored
on a server for the use of members of staff seeking to illustrate OU courses, or other types of
presentation. All necessary information, including caption, provenance and copyright details, is
stored with every individual image, thus greatly reducing the workload associated with sourcing
suitable illustrative material.
As the OU begins to explore moves towards courses that are delivered entirely online and available
for global audiences, the DVD images banks may also be seen as representing a first step in the
provision specifically for teaching and learning of large amounts of visual information with
associated captions.
The technical design issues of these images banks has been discussed by Lucas (2009). Both image
banks use an Opus front-end to access a database on CD/DVD, with no installation being required
on students’ computers.
2
The S194 astronomy image bank
The astronomy image bank contains 187 images, mostly stills but also a few very short (~10
frames) animations. The availability of many NASA images at no cost was a major factor in being
able to put together this collection for distribution to students within the typical budgetary
constraints for course production.
90
This image bank is divided into sections, as shown in Figure 1, with these sections matching the
chapter structure of the S194 course text. For example, the highlighted section called ‘The Stars’
maps to the text chapter entitled ‘Star birth and death’.
Figure 1 The S194 section index, with thumbnails.
Clicking on a thumbnail or section title brings up the subsection index, as shown in Figure 2 for
‘The Stars’. Keyword searching is possible from either the section index or the subsection indices.
Figure 2 The subsection index, with thumbnails, for the ‘Stars’ section shown in Figure 1
91
Figure 3 illustrates an individual image screen. The window in which the images are displayed is
always square format (unused areas are blacked out), with explanatory captions in a text window
alongside. Image credits are clearly displayed for each image, as are dates when this is relevant.
Neither window can be resized by the user.
There is a step-wise zoom facility, using either buttons or the keyboard, that allows images to be
blown up. There is also a drag facility, using the mouse, that allows images to be moved within the
image window, which can help students to focus on particular details. Use of these two facilities in
combination may be necessary for some students with visual impairment to be able read the labels,
as they are not machine readable.
The caption in Figure 3 is quite short, but most are much longer than this. The text in the captions
is compatible with screen readers, and text can also be enlarged and shrunk using key
combinations. If the text size is too big for the entire caption to fit in the window, a scroll bar is
available. Even at ‘default size’, scrolling is required for many captions. There is no facility for
printing either the images or the captions from the image bank display. They are, however, listed in
an un-encoded Excel spreadsheet and students who are willing to explore the DVD files can obtain
the captions that way, although no instructions are provided for doing so.
Figure 3 An example of an image screen with labelling on the image.
It is possible to measure distances within images by left and right clicking in the image window.
This is only applicable to images that have their size recorded in the database; unfortunately, it is
not obvious to students which images those are, other than by trial and error.
92
3
The S189 meteorology image bank
This image bank contains a total of 85 ‘items’, mostly still images but also slide shows of satellite
images and one animation. The course was produced in partnership with the Royal Meteorological
Society (RMetS). The availability of many still images at no cost from the RMetS collection, was
a major factor in enabling certain sections of this image bank to be built within the course
production budget.
The categories within the S189 image bank are associated with activities, rather than specific
sections of the text as was the case for S194. For example one category, the ‘Cloud catalogue’, is
designed to help students recognise different types of individual cloud, and is followed up by an
interactive quiz on the OU VLE. The category called ‘Cloudscapes’ allows users to study examples
of skies in which different kinds of clouds are present simultaneously. The index/thumbnails for
this latter category is shown in Figure 3.
Figure 4 The index for the ‘Cloudscapes’ section of the S189 image bank
The original shell used for the S194 image bank was further developed for S189. Links were added
within some of the captions, enabling students to jump straight to other specified images for
comparison or contrast. ‘Slide shows’ were included as well as individual images. For example,
sequences of images from a geostationary satellite, taken once every three hours over a period of
five days, are shown at approximately one second intervals to illustrate the movement of a
hurricane across the Atlantic until it made landfall. One animation of tropical cyclones from the
Earth Simulator Center in Japan is also included.
4
Evaluation and discussion
The S189 image bank was evaluated by online questionnaire, using a mixture of closed and open
question types (see Appendix 1). 240 students were invited to participate in the evaluation and 65
93
completed questionnaires were received; this response rate of 27% is fairly typical at the OU for
these kinds of evaluations.
The S189 image bank was chosen for the evaluation for two reasons. First, it represented a ‘test’ of
the suitability of the shell for courses other than the one for which it had originally been designed.
Secondly, the S189 image bank had additional features that are not available in S194 package.
4.1
Learning aspects
All the respondents had used the image bank package more than once, with 42% accessing it
between 2 and 6 times, and 58% more than 6 times. Over 86% of respondents had accessed all
sections, with 97% accessing the ‘Cloud catalogue’. All respondents rated the image bank as ‘very’
or ‘fairly’ useful in helping them to achieve the learning outcomes of the course. Typical comments
included:
‘A picture paints a thousand words and adds a lot to understanding’
‘It helped [in] retaining information, rather than just reading a book, and was far more enjoyable.’
‘An absolutely excellent addition to the course. It brought to life many of the things discussed. Also, the
process of moving away from the book and looking up the images and returning to the book helped to focus
the mind.’
However, one strategic learner remarked that
‘The image bank was necessary in order to complete certain sections of the course, but I admit that was
usually the only reason I spent any time viewing.’
The ‘Cloud catalogue’ and ‘Cloudscapes’ sections were by far the most popular in terms of both
usefulness and interest. A number of respondents commented specifically on the high quality of the
images in these sections. Most of the replies to the question about the best aspects of the image
bank also referred to these two sections, and several students suggested that they could usefully
have contained even more images.
4.2
Navigation, accessibility and formats
The original S194 shell was designed round a particular course structure, with sections, numbered
subsections and individual numbered images within subsections. The numbering system (e.g.
‘IB0098 Eskimo Nebula’ as an image within subsection 05060) is visible to students. This may be
a help to S194 students in that ‘05’ in the subsection number denotes images relevant to Chapter 5
of the course text. It was therefore necessary to display the image numbers in the S189 image bank
as well, even though they are of no use to S189 students and add an unnecessary layer of
complexity. The questionnaire did not draw attention to the image numbers, but no student
commented on them, so it may reasonably be assumed that they did not present any particular
barrier to usability.
Under the S194 system it requires three selections/ mouse clicks to get from a section index to a
particular image and its caption (via subsection index/thumbnails, to the index/thumbnails for a
specific subsection, to an individual image). This rigid structure was not really suitable for S189,
where subsections were not always required. For example, in the case of the ‘Tropical cyclones’
animation it still requires three clicks to get from the section index to the animation, with two of
those essentially being redundant, since the animation is the only item within that section.
Navigation is also complicated by the fact that when there are several images within a subsection it
is necessary to return to the subsection index each time in order to click on the thumbnail for the
next image in the sequence. It is also necessary to go back to the index each time after using one of
the links within captions.
94
Probably as a result of these aspects, a significant proportion of students had some difficulty with
navigation. Only 40% of respondents said it was ‘very easy’ to find their way through the image
bank, with 49% saying it was ‘fairly easy’ and 11% ‘not particularly easy’. 46% of respondents has
used the links from captions to related images. Many of the comments about the worst aspects of
the image bank related to the difficulties of moving from image to image, referring to the interface
as ‘clunky’. Three typical comments on this issue were:
‘The way of moving from image to image was very cumbersome.’
‘It is not possible to simply click forward to the next picture, but one has to go back to the menu first. Very
inconvenient when you want to compare different pictures of the same cloud for example.’
‘Having to 'go back' to a menu in order to see the next image was unhelpful. Also, when looking at a cloud
image that had a link to another in the text, the only way to get back to the first was to start again - this put
me off using the link feature. A selection tree down the left side that was always accessible would have
been a great asset.’
However, most students had worked out the navigation for themselves, since only 12% had
accessed the Help function.
Many respondents had used the tools for manipulating the images: 65% had enlarged or shrunk
images and 48% had ‘scrolled’ images (e.g. to centre part of an enlarged image within the picture
window). These features are probably most useful in relation to the satellite images. Only a quarter
of respondents had zoomed to enlarge the text within the caption window, but this option may be of
crucial importance in making the image bank accessible for those with less than perfect vision.
However, there was a comment to the effect that it would have been better had it been possible to
enlarge the whole image plus caption (i.e. Figure 2) to full screen.
Keyword searching from the section index brings up thumbnails and titles of individual images.
Searching is also possible from the subsection index but then brings up the same set of thumbnails
(i.e. not only those within that subsection). This is less of an issue in S194, where there is little
overlap of subject matter between sections, than in S189. However, only 3 of the 65 S189
respondents had tried a keyword search. It is not clear whether this is because they could find
images easily without it or because they were simply unaware of the feature.
The image bank software is not compatible with the present OU policy of browser-based delivery
of other DVD assets. The image banks therefore have to be produced separately and then added to
the DVD at a late stage. This can cause problems with production schedules and quality assurance.
The OU is also rapidly moving towards online delivery of course material, in which case image
banks would have to be presented as browser-based pages. The final section of the questionnaire
was designed to find out what students would see as the pros and cons of moves to online formats.
All but 2 of the respondents used broadband as opposed to a dial-up internet connection for their
OU studies, so did not envisage any technical difficulty in accessing an online version of the image
bank. However 70% of respondents preferred the option of a DVD to an internet-based image bank
that would – like other online course material – be password-protected and might therefore only be
accessible while students were registered on the course. The DVD was highly rated as a product to
keep: 83% of respondents said that they expected to refer to it even after they had completed the
course, 33% said that having the DVD to keep was very important to them, and 27% wanted to be
able to show sections of the DVD to people in the future. Only 3% of respondents would not keep
the DVD once they had finished the course.
‘Happier to use DVD … than having to go online to view images.’
‘[In] trying to assess the value of online information against a DVD, then the DVD wins in every aspect.’
95
This desire by the majority of students to keep a copy of the image bank on DVD must be viewed
in the context of the current delivery methods, in which the course book is also a physical object
that students value highly and want to keep at the end of the course. The attitude to course assets
might be different in a regime in which all parts were delivered solely online. 88% of respondents
said that in the case of online access only they would find it ‘very’ or ‘fairly’ useful to be able to
download and save the entire image bank on their own computer, rather than simply accessing I t
page by page. 80% of respondents wanted to be able to print and/or cut and paste text from the
captions, which is not possible with the current DVD version.
5
Conclusion
The S194 and S189 image banks have been popular with students, but there are clear deficiencies
in the shell. The original shell was set up to map to a particular course structure and does not
necessarily match well to other courses. A more flexible system would be a great advantage,
allowing image banks to be more closely tailored to the requirements of individual courses with
minimal programming effort. There are specific issues related to navigation and general userfriendliness. A better way of moving between images is definitely required. It would be
advantageous for the user to be able to make the image window fit the screen (whatever resolution
has been set). It would also be very useful to be able to display images at ‘normal size’ (i.e. one
pixel on screen for one pixel on the image) so as to see the images at the best possible quality.
Students would greatly appreciate a facility that would allow them to print or to cut and paste from
the captions.
The other significant issue to be considered in any further development relates to the integration of
the image banks with the OU’s current browser-based delivery system for most DVD-based assets,
and subsequently with online delivery. to its possible extension into to a larger scale project. For
image banks to be included in a wider range of courses, issues of compatibility will need to be
addressed.
The current format of the image bank is perfectly suitable as a basis for a larger repository of
pictorial material related to physics, astronomy and meteorology that could be accessed by staff.
However, issues of copyright would have to be seriously addressed before such a system could be
set up.
References
Simon Greene and Robert Lambourne (2006) Introducing Astronomy, second edition, The Open
University, milton Keyens.
Lucas, R.J. (2009) The design of an image bank, New Directions, issue 5, 26-30.
Shelagh Ross, Stephen Lewis and Nicholas Braithwaite (2008) Understanding the weather, The
Open University, Milton Keynes.
Acknowledgements
The authors would like to thank Bob Lambourne and Simon Greene, who pioneered the S194
image bank; Nicholas Braithwaite, who contributed to the S189 image bank; and Rob Lucas who
carried out the technical development.
96
Appendix 1: Feedback questionnaire
Feedback questionnaire: The S189 Image Bank
This questionnaire relates solely to the Image Bank, not to the other components of the S189 DVD.
1. How many times did you access the Image Bank?
(Please select one only)
Not at all - please go to Q10
Once
2 - 6 times
More than 6 times
Questions 2 - 5 are about your overall impressions of the S189 Image Bank.
2. Which of the sections of the Image Bank did you access?
(Please select all that apply)
Cloud catalogue
Cloudscapes
Meteorological instruments: surface-based instruments
Meteorological instruments: satellite images
Meteorological instruments: balloons, aircraft and radar
Tropical cyclones
97
3. How useful was the Image Bank to you in helping you to achieve the Learning Outcomes of the course?
(Please select one only)
Very useful
Fairly useful
Not particularly useful
Not at all useful
4. How would you rank the individual sections of the Image Bank in terms of their usefulness?
(Please rank each section from 1 = Most useful to 6 = Least useful)
Cloud catalogue:
Cloudscapes:
Meteorological instruments: surface-based instruments:
Meteorological instruments: satellite images:
Meteorological instruments: balloons, aircraft and radar:
Tropical cyclones:
98
5. How would you rank the individual sections of the Image Bank in terms of their interest?
(Please rank each section from 1 = Most interesting or enjoyable to 6 = Least interesting or enjoyable)
Cloud catalogue:
Cloudscapes:
Meteorological instruments: surface-based instruments:
Meteorological instruments: satellite images:
Meteorological instruments: balloons, aircraft and radar:
Tropical cyclones:
Questions 6 - 7 are about navigating the S189 Image Bank and using its features.
6. How easy was it to find your way through the Image Bank?
(Please select one only)
Very easy
Fairly easy
Not particularly easy
Not at all easy
99
7. Which of the following tools or options within the Image Bank did you use?
(Please select all that apply)
Help
Keyword search
Enlarge or shrink images
'Scroll' images (e.g. to centre part of an enlarged image within the window)
Zoom to enlarge caption text
Links from captions to related images
Questions 8 - 11 allow you to express your opinions about the S189 Image Bank in your own words.
8. What in your opinion is the best aspect of the Image Bank and why?
Please type in the box below:
9. What in your opinion is the worst aspect of the Image Bank and why?
Please type in the box below:
10. If you did not access the Image Bank at all, why was that?
Please type in the box below:
100
11. Please add any other comments you have about the S189 Image Bank:
Please type in the box below:
Questions 12 - 17 relate to possible future developments of Image Banks for Science Short Courses.
12. What kind of internet connection do you use most frequently for your OU studies?
(Please select one only)
Broadband
Dial-up
Don't know
13. If an Image Bank were to be made accessible over the internet, rather than from a DVD, the user would
require a broadband connection for every visit to the Image Bank. An internet-based Image Bank would
be accessible to students only while they were registered on the course. Which access route would you
prefer if there were a choice?
(Please select one only)
Internet
101
No preference
DVD
14. How highly do you rate the DVD as a product to keep once you have completed the course?
(Please select all that apply)
I expect to refer to the DVD even after I have completed the course
I will not keep the DVD once I have completed the course
I want to be able to show sections of the DVD to people in the future
Having the DVD to keep is very important to me
15. How useful would you find it to be able to save individual images or captions from an Image Bank on your
own computer?
(Please select one only)
Very useful
Fairly useful
Not particularly useful
Not at all useful
102
16. How useful would you find it to be able to download and save an entire Image Bank on your own
computer?
(Please select one only)
Very useful
Fairly useful
Not particularly useful
Not at all useful
17. How useful would you find it to be able to print or to copy and paste text from Image Bank captions?
(Please select one only)
Very useful
Fairly useful
Not particularly useful
Not at all useful
Thank you very much for completing this questionnaire.
Please submit your responses by clicking on the button below.
Submit
If you have any technical problems accessing or submitting this questionnaire please email: The OU ELSA Team.
103
PICT - Physics In Context Timelines
Robert Lambourne, Department of Physics & Astronomy and piCETL, The Open University
Introduction
Much has been said and written about the use of the history of physics as a tool for enriching and
enlivening the teaching of physics itself and similarly for science more generally (see references).
Some have argued that in any subject a powerful narrative strengthens teaching and that a subject’s
history is generally a natural and plentiful source of such narratives. Others have pointed out that
the teaching of scientific process in particular cries out to be illustrated with examples, and that
these are most easily found in the history of the subject. Critics of the use of history have asserted
that ‘real’ history is often complex and misleading, so that only a crude potentially misleading
sloganizing can be offered in place of real history in conventional physics courses. Some have
admitted they find history dull and prefer to present physics in a way that ignores the ‘historical
baggage’ and concentrates instead on the logical structure of the subject as currently understood.
The project described in this paper will certainly not decide between these views, nor attempt to
reconcile them. Indeed, it may provide some support for each camp, opposed as they may be.
The PICT project – Physics in Context Timelines – provides basic chronological information
concerning developments in physics; setting them in the context of other scientific and historical
events. The historical context is fairly thin; though global in coverage, the relatively few facts that
are mentioned have an occidental, European and even a British emphasis. The scientific context is
richer, often occupying as much space as the physics it contextualises.
The timelines are primarily intended for the use of those teaching physics and astronomy at
university level. It is expected that others, particularly students, will find the timelines useful but
they are not the primary audience. Amongst the uses that lecturers may find for the timelines are
the following;
•
•
•
•
•
•
•
•
Identifying the order in which basic developments occurred
Associating a date with an event
Associating one or more named individuals with an event
Finding the dates of birth and death of a named individual
Following the key developments in the career of a named individual
Following the key developments in a named field of study
Identifying anniversaries.
Identifying the historical and scientific context of an event.
The timelines are not intended to be a source of deep historical insight. They are intended rather to
provide an initial orientation based on chronology. They are certainly open to the charge of
sloganizing and even the simple information they contain must be treated with some care, as
explained later. For this reason the information they provide should generally be checked against
authoritative sources that provide a more complete account of events. Nonetheless the timelines
can play a useful role in the preparation of teaching material and if they save some lecturers time
and effort in assembling basic historical information, they will have achieved their goal.
104
This paper will describe the nature of the timelines as currently constructed along with plans for
future updating and further technical developments.
Content of the timelines
There are 4 distinct timelines, each covering a broadly defined historical period.
Timeline 1:
Timeline 2:
Timeline 3:
Timeline 4:
Ancient history (776 BC – 476 AD)
Medieval history (476 AD – 1492 AD)
Early modern history (1492 AD – 1799 AD)
Modern history (1799 AD – present)
The timelines vary greatly in the degree of detail they provide, becoming increasingly detailed
with time. The earliest, Timeline 1, covers 1250 years in little more than a page. The latest,
Timeline 4, takes 53 pages to cover about 200 years. Their effectiveness in distinguishing physics
from other sciences also changes with time as physics itself becomes a more clearly defined
discipline within the scientific enterprise.
An extract from Timeline 4 is shown below. This is representative of the general style. Its specific
features are discussed in more detail in the next section.
1833
1833
1833
1833
1833
1833
1834
1834
1834
1834
1834
1834
1834
1834
1835
1835
c1835
1835
1835
1836
1836
1836
1836
Abolition of slavery throughout the British Empire
‘Scientist’ coined by Whewell (who also suggested ‘physicist’ etc.)
Publication of third volume of Principles of Geology (pro Hutton)
Introduction of Lenz’s law of induction (originally for forces)
Diffusion rate related to reciprocal root density by Graham’s law (of
effusion), osmosis studies follow leading to colloidal chemistry
Discovery of the first (malt) enzyme (1878 coinage) Payen & Persoz
Babbage produces his first design proposal for an analytical engine
Ellipsoids shown to be possible equilibrium figures for rotating fluids
Hamilton introduces the principle of least action & Hamiltonian
mechanics
Solitary wave observed in a canal by Scott-Russell (reported at BA
1844)
Lloyd’s mirror used to demonstrate interference
Discovery of the Peltier heat due to current crossing a junction
Carnot’s work (stripped of caloric) made available by Clapeyron with
the Carnot cycle shown on an indicator diagram; dP/dT = L/T V (later
called the Clausius-Clapeyron equation) derived using a Carnot cycle
Early human history divided into Stone, Bronze and Iron Ages
Poisson introduces the law of large numbers in probability theory,
based on the 1713 ‘Golden theorem’ of Jacob Bernoulli
Introduction of the Coriolis force
Development of first effective electric telegraph (aided by Henry) see
‘44
Barzelius notes accelerative effect of some chemicals and coins
‘catalyst’
Darwin arrives at the Galapagos on HMS Beagle
Humboldt proposes global magnetometer network to study
geomagnetism
Invention of the zinc-copper Daniell cell (an improvement on Volta’s)
Marine screw propeller patented (indep. by Gatling 1839) (see 1829)
Discovery of first animal enzyme (named pepsin) by Schwann
William Whewell 1794-1866
Charles Lyell 1797-1875
Heinrich Lenz 1804-1865
Thomas Graham 1805-1869
Anselme Payen 1795-1871
Carl Jacobi 1804-1851
John Scott-Russell 1808-1882
Jean Peltier 1785-1845
Émile Clapeyron 1799-1864
Christian Thomsen 1788-1865
Gustav-Gaspard
Coriolis
1792-1843
Samuel Morse 1791-1872
Charles Darwin 1809-1882
Alexander v Humboldt 17691859
John Daniell 1790-1845
John Ericsson 1803-1889
Theodor Schwann 1810-1882
105
1837
1837
1837
1837
1837
1837
Victoria becomes Queen of England (until 1901)
Poisson distribution introduced
Solar constant measured by Pouillet and independently by J Herschel
Proposal by Agassiz that an ice age had existed
Faraday introduces the dielectric constant
Electric telegraph patented by Cooke & Wheatstone (indep. of Morse)
1837
1837
Work on gas absorption in blood by Magnus clarifies role of the lungs
Large cerebellum cells found by Purkinje (coined plasma &
protoplasm)
Darwin begins his first notebook on transmutation of species
1837
John Herschel 1792-1871
Louis Agassiz 1807-1873
Charles Wheatstone 18021875
Gustav Magnus 1802-1870
Jan Purkyně 1787-1869
Detailed entries and their limitations
As the rows and columns in Table 1 indicate, each entry occupies from 1 to 3 lines with single line
entries predominating. Each entry covers four columns. The first column contains the relevant
year, the second column summarises the event or achievement. The third column provides the
name of a relevant person, usually a scientist (with dates of birth and death where known) but
sometimes another historical character. The fourth column is for the insertion of markers and
serves a technical function in the electronic version of the Timeline.
When event summaries in Column 2 begin with the name of a scientist, as in the first entry for
1834 which begins with ‘Babbage’, that is an indication that Babbage has been mentioned earlier
in the timeline (in 1822, in fact), so his full name and dates are not repeated on this later occasion.
In other cases, the relevant scientist will usually be listed in Column 3 and may also be mentioned
in Column 2.
Within the set of entries devoted to a particular year, the primary ordering is by field. In keeping
with the ‘physics in context’ approach the physics achievements are generally in the middle of the
entries for a particular year. They are generally preceded by those belonging to general history
(highlighted in blue), philosophy, mathematics, computing and astronomy. Physics entries are
roughly presented in the order; classical mechanics, classical fields, optics, quantum mechanics,
quantum fields, particles, nuclei, atoms, molecules, physics of matter and plasma physics. Those
entries are then followed by any that refer to technology, earth science, biology, medicine,
psychology and social science.
The events chosen for inclusion are mainly the personal selection of the author and therefore
represent the author’s own limitations. However, some effort has been made to consult colleagues
with a range of expertise and this has resulted in some additional broadening of the coverage. All
who contributed to this process are again thanked for their help.
One technique used to ensure a reasonable breadth of context from the latter part of the 19th
Century onwards is evident in the attempt to give some recognition to all those efforts that were
eventually rewarded with a Nobel Prize. This is usually indicated by following the summary of the
development with a parenthetical comment such as (N P ’79 with Smith and Jones), indicating the
award of the 1979 Nobel prize for Physics for the work being described, the prize being shared
with Smith and Jones. Nobel awards for Chemistry or for the joint field of Medicine and
Physiology are respectively indicated by N C and N M.
Timelines are appealingly simple but that strength is also a potential weakness. A frequently
encountered problem is that of associating a specific date with an event. In some cases scientists
106
have recorded the moment when a key discovery has been made. More often a scientific idea is
associated with the date of a particular publication. However, it is not uncommon for a
development to have been made and applied, and possibly passed on to others, a year or more
before it is reported in print. For this reason there can often be uncertainty about the date of an
event by a year or so unless the exact nature of the event is made clear. An effort has certainly
been made to do this but in some cases more research is still needed and hence some ambiguity
remains. In a few cases major developments emerged from a lengthy developmental process and
all that it has been possible to do at this stage is to assign an approximate date to the event, as
indicated by the conventional use of ‘c’ as an abbreviation of circa in association with the year.
Because of the abbreviated nature of all entries in a timeline, the basic rule is that all information
should be checked in more extended sources before being quoted in print. The timeline is intended
to give an initial orientation not a definitive historical account.
Sources of information
The existing timelines have been constructed using a wide variety of information sources, mainly
secondary. The starting point was a range of biographical and historical dictionaries, particularly
the Hutchinson Biographical Dictionary of Scientists (Hutchinson, 1997) and the Macmillan
Dictionary of the History of Science edited by W. F. Bynum, E. J. Browne and Roy Porter
(Macmillan, 1983). Amongst the most useful of the one volume surveys of the history of science
was the venerable A History of the Sciences by Stephen F Mason (Collier Books, 1962). A useful
one volume survey of mathematics was A Concise History of Mathematics by Dirk J Struik (Dover
Books, 1987).
For general developments in the history of physics important sources were the books From Falling
Bodies to Radio Waves and From X-rays to Quarks by Emilio Segre (Freeman, 1984 and Freeman,
1980, respectively) and for more detailed coverage of recent advances, the three volumes of
Twentieth Century Physics (Institute of Physics Publishing, 1995) and Inward Bound by Abraham
Pais (Oxford University Press, 1986). On the specific topic of Albert Einstein’s life and times
there is the incomparable ‘Subtle is the Lord’ by Abraham Pais (Oxford University Press, 1982)
and the lesser known but greatly valued The Einstein Decade by Cornelius Lanczos (Elek Science,
1974). On quantum mechanics; Sources of Quantum Mechanics by B. L. van der Waerden (Dover,
1968), The Old Quantum Theory by D. ter Haar, Wave Mechanics by Gunther Ludwig and Atomic
Spectra by W. R. Hindmarsh (all published by Pergamon Press in 1967, 1968 and 1967
respectively). On quantum fields and QED; Selected Papers on Quantum Electrodynamics by
Julian Schwinger (Dover, 1958) and QED and the men who made it by Silvan Schweber
(Princeton, 1994).
On particles and nuclei, three of the most useful references were; The Birth of Particle Physics
edited by L Brown and L Hoddeson (Cambridge University Press, 1983), The Experimental
Foundations of Particle Physics edited by Robert N Cahn and Gerson Goldhaber (Cambridge
University Press, 1989) and The Origin of the Concept of Nuclear Forces edited by L. M. Brown
and H. Rechenberg (Institute of Physics publishing, 1996).
Much valuable information regarding condensed matter physics was obtained from Solid State
Science edited by Dennis Weaire and Colin Windsor (Adam Hilger, 1987), and from Out of the
Crystal Maze by L Hoddeson, E. Braun, J. Teichmann, and Spencer Weart.
107
Two very useful works relating to cosmology and astrophysics were; A Concise History of Solar
and Stellar Physics by Jean-Louis Tassoul and Monique Tassoul (Princeton University Press,
2004), and The Cosmic Century by Malcolm Longair (Cambridge University Press, 2006).
At the risk of revealing my shallowness in biology, I should also acknowledge my indebtedness to
The Science of Life by G Rattray Taylor (Thames and Hudson, 1963), which did much to help me
to gain an initial orientation in that field.
On the specific topic of Nobel prizes and their recipients, apart from the invaluable Nobel website,
the most useful sources were Pioneers of Science by Robert L. Weber (Institute of Physics
Publishing, 1980) and A Century of Nobel Prize Recipients edited by Francis Leroy (Marcel
Dekker, 2003).
Much use was made of web-based resources though information found from electronic sources
was generally checked from other media. An exception to this was a rich source of information
regarding the history of solar and magnetospheric physics that it was not always possible to
confirm from independent sources. This was the detailed timeline of solar and terrestrial physics at
http://measure.igpp.ucla.edu/solar-terrestrial-luminaries/timeline.html. Another greatly valued
source of information was the MacTutor History of Mathematics Achive created by John J
O'Connor and Edmund F Robertson at the University of St Andrews and available at http://wwwgroups.dcs.st-and.ac.uk/~history/ .
Using the timelines
So far, the timelines have only been available as a Microsoft Word document (in .doc format). In
this simple format the easiest way to seek information on a particular topic is to use the ‘find’
command that is available in all modern versions of Word. The use of the related ‘find next’
command allows the user to follow interesting tracks through the timelines. So, for example, a
search of Timeline 4 using the term isotope produces the following results.
1913
Soddy (N C 1921) proposes concept of isotope
(Frederick Soddy (1877-1956) first appeared in the timelines in 1901 for his work with Rutherford
showing that radioactive decay involved element transmutation.)
1913
1916
1919
1923
1931
1931
1932
1932
1934
Precise atomic weight determinations support isotope theory (N C
1914)
Systematic method of using Maxwell’s transfer equations to
determine non-equilibrium distribution functions and transfer
coefficients leading to the discovery of thermal diffusion (later
used in isotope separation)
Start of mass spectroscopy isotope studies by Aston (N C 1922)
First use of (lead) isotope tracers (N C 1943)
Isotope effect seen in hyperfine structure of thallium and mercury
spectra by Schüler and Keyston
Crude theory of isotope effect in atomic spectra developed by
Bartlett based on non-relativistic hydrogen-like wave functions
Discovery of nuclear fusion in light isotopes (tritium)
Breit and Rosenthal and independently Racah develop improved
theory of isotope effect in atomic hyperfine structure with
relativistic wave functions
Formation of first artificial radioisotopes and first observation of
Theodore Richards 18681928
Sydney Chapman 18881970
Francis Aston 1877-1945
Georg Hevesy 1885-1966
H Schüler 1894-1964
J E Keyston ????Paul D Bartlett 1907-1997
Mark Oliphant 1901-2000
Giulio Racha 1909-1965
Frédéric
Joliot-Curie
108
beta+ decay (the ‘fourth kind’ of radioactivity, see 1938 for the
fifth) (N C 1935)
c1935
1937
1940
1940
1940
1940
1941
1942
1950
1953
Isotope studies prove rapid turnover of fats and other body
constituents
Segrè and Perrier form first artificially produced element (43technetium) which has no stable isotopes
Segrè et al synthesise astatine (no stable isotopes)
Gas thermal diffusion proposed for uranium isotope separation
and work with McMillan on synthesis of transuranic elements
Simon and Kurti establish feasibility of gas diffusion isotope
separation
Synthesis of first transuranic isotope 93-neptunium by McMillan,
its beta decay was shown to yield 94-plutonium (’41) by Seaborg
et al (N C ’51)
Mass spectroscopy of lead isotopes date rock sample to 2570 years
b.p.
Isotope separation by gas diffusion planned (Oak Ridge
production ‘45)
Discovery of the isotope effect in superconductor critical
temperatures by Maxwell and Reynolds et al
Meteorite isotope studies by Patterson et al give Earth age of 4550
My
1900-1958
Irène Joliot-Curie 18971956
Rudolf
Schoenheimer
1898-1941
Carlo Perrier 1886-1948
Philip Ableson 1913-2004
Nicholas Kurti 1908-1988
Edwin McMillan 19071991
Glenn Seaborg 1912-1999
Alfred Nier 1911-1994
John Dunning 1907-1975
Emanuel Maxwell 19132000
C A Reynolds 19??Clair Cameron Patterson
1922-1995
A search based on the term ‘isotopic’ takes the user on a different route and leads to the
introduction of isotopic spin in 1937.
It is intended that a modified version of the timeline will be made available via the piCETL
website with an electronic tagging facility in column 4 so that users can select a subset of entries
that may be printed or searched independently of the rest of the timeline(s).
References
Nielsen, H. and Thomsen, P. V. 1990, History and philosophy of science in science education, Int.
J. of Sci. Educ., 12(3), 308-16
Seroglu, F. and Panagiotis, K. 2001, The contribution of the History of Physics in Physics
Education: a review, Science and Education, 10(1-2), 153-172
Stuewer R. H. 1998, History and Physics, Science and Education, 7, 13-30
Matthews, M. R. 1994, Science Teaching. The Role of History and Philosophy of Scince,
Routledge, New York/London
Brush, S. 1989, Hisory of Science and Science Education, Interchange, 20(2), 60-70
Sebesta, J. 1996, On the history of national physics in physics teaching, Science and Education, 5,
313-318
Heering, P. 2000, Getting shocks; Teaching secondary school physics through history, Science and
Education, 9, 363-373
Steele, D. et al (Eds.), 1970, The History of Scientific Ideas: A Teacher’ Guide, Hutchinson
Educational, London
Vlahakis, G. 2007, Physics Education and History of Physics, Frontiers of Physics education,
GIREP-EPEC Conference 2007, 44-55
109
The Maths Skills ebook : final report
Sally Jordan
Physics Innovations Centre for Excellence in Teaching and Learning
The Open University
January 2009
Abstract
A hyperlinked ebook has been produced, based on the content of the Open University Science
Short Course Maths Skills Booklet. The ebook is supported by a series of online interactive
questions and both are available to around 16000 students per year on a wide range of Science
Faculty courses. The ebook and questions have both been well received by students. The Maths
Skills ebook includes hyperlinks, to enable students to link between different parts of the resource
and its electronic nature means it is accessible to students all over the world. It can be updated
easily and has been expanded to include all the mathematical topics taught in S154 Science Starts
Here, to make it useful as a revision aid for students on S104 Exploring Science. The Maths Skills
questions were produced at minimal cost by providing additional data-sets when interactive
computer-marked assignment (iCMA) questions were written and programmed for S154 and the
diagnostic quiz ‘Are you ready for Level 1 Science?’
Background
Most of the Open University’s Science Short Courses assume only the most basic mathematical
skills (addition, subtraction, multiplication and division of positive numbers), but sometimes
slightly more advanced skills (e.g. decimals, fractions, percentages, negative numbers) are
required in the courses themselves, as well as some knowledge of the application of mathematics
to science e.g. an appreciation of the importance of SI units. Rather than repeating the teaching of
these skills in each of the 10 point courses, it was brought together into a printed Maths Skills
Booklet, supplied to students on most of the Science Short Courses. The Maths Skills ebook was
written to replace the Maths Skills Booklet, with updated and extended content. It is available on
each of the course’s website as a downloadable .pdf file. The Maths Skills ebook is not intended to
be studied from beginning to end (though we know that some students do this) but rather to be a
resource for students who discover that they are unfamiliar with a particular mathematical
technique assumed by their course.
For students studying S104 Exploring Science, the function of the ebook is slightly different,
enabling them to revise mathematical topics that the course assumes. Intending S104 Students are
encouraged to take the ‘Are you ready for Level 1 Science’ quiz, and if their mathematical skills
are not up to the level required by S104, to start by studying S154 Science Starts Here (which has
very similar mathematical content to the Maths Skills ebook). However, it is likely that students
who are generally well prepared for S104 may feel rusty in minor or very specific areas and they
are encouraged to use the Maths Skills ebook to revise these topics.
The style of the ebook is based on that used for the electronic version of S151 Maths for Science as
part of the PPLATO (Promoting Physics Learning and Teaching Opportunities) Project (1,2), but
the academic content is at a lower level.
110
Why a hyperlinked ebook?
The Maths Skills ebook includes hyperlinks, to enable students to link between different parts of
the resource. This means, for example, that they can go straight from the contents page to the
relevant section of the ebook. A particular advantage of the structure is that answers to in-text
questions are not immediately visible, but can be accessed by a single click once students have
attempted the question for themselves (see Figure 1). A second click returns the student to the
teaching text.
The ebook is accessible to students all over the world, and another advantage is that it can easily
be updated and expanded. Sections have been added in the light of increased understanding of
students’ mathematical misconceptions, gained, in part, from the πCETL project ‘S151 students’
mathematical misconceptions’ (3, 4), and in response to new uses for the ebook. For example:
• a section was added on the addition, subtraction, multiplication and division of fractions when
it became apparent that lack of understanding of these operations causes problems at a higher
level;
• sections were added on graph plotting, symbols and equations and calculator use, in response
to S104 students’ difficulties in these areas.
Figure 1. The link from a question to its answer in the Maths Skills ebook
111
The Maths Skills questions
In addition to the Maths Skills ebook itself, a bank of interactive online questions has been
developed, covering the same mathematical topics. Students can use these questions to check their
understanding, and targeted feedback is given in response to common errors, as shown in Figure 2.
Students can attempt each online question as many times as they would like, with differing datasets providing extra opportunities for practice.
Production of the Maths skills ebook and questions
The Maths Skills ebook was produced by a consultant. Most of the content was imported direct
from the handover text of the Maths Skills Booklet (and later from S154). Most equations had to be
re-entered in LATeX because they had been entered in a mixed style into the original file (so, for
1 1 5
example, in + = , each of the fractions had been entered as MathType objects but the
2 3 6
addition and equals signs had been entered as symbols). If the whole equation had been entered as
a MathType object in the original file, as is the case for modern courses, the equations could have
been imported direct. Most figures were converted from .eps to .pdf files but some large figures,
which did not easily fit onto a page of the ebook, were redrawn. The most time-consuming part of
the conversion was the alteration of pagination to make for comfortable on-screen reading, with no
scrolling, and in entering hyperlinks to refer students from questions to their solutions and from
one part of the text to another. The format was similar to that used in the earlier PPLATO resource
Maths for Science, which had been to produced to fit on the lowest resolution monitor that a user
could reasonably be assumed to be at that time; if starting from scratch now, a higher resolution
monitor could be assumed. The different format of the Maths Skills Booklet and the Maths Skills
ebook is illustrated in Appendix 1.
Figure 2 Targeted feedback in response to an incorrectly answered interactive question.
The Maths Skills questions were produced at minimal cost by providing additional data-sets as
interactive computer-marked assignment (iCMA) questions were written and programmed for
S154 Science Starts Here and the diagnostic quiz ‘Are you ready for Level 1 Science?’ (5).
Appendix 2 shows an example of the programming instructions for a question that was used in
112
S154, ‘Are you ready for Level 1 Science?’ and the Maths Skills ebook, illustrating the way in
which each application has its own independent data-sets and reference to the relevant points in the
text.
Changes made as a result of feedback from S104 students
The strong advice to intending S104 students remains that they should use ‘Are you ready for level
1 science?’ to guide them towards an appropriate starting point and, if appropriate, study S154
before S104. However the S104 Course Team recognises that there will always be some students
who have not done this. Therefore the content of the Maths Skills ebook has been extended to
include all the mathematical content of S154 (sections have been added on equations and symbols,
graph plotting and calculator use) and from the second presentation of S104, all students have been
encouraged to use the ebook and interactive questions before S104 course start and early in the
course, to help them to revise their basic mathematical skills. From September 2008, the Maths
Skills ebook and the linked interactive questions have been available on the Studying Science
website as well as course-specific websites, to enable students to access these resources before the
have access to the course-specific websites.
Additional questions were added in August 2008, so coverage of Maths Skills questions is now
similar to that the Maths Skills ebook, with the exception of Section 9 (Significant figures) and
Section 13 (Equations and symbols), where there were no iCMA questions available for use at
minimal resource (i.e. by simply adding data-sets to questions being programmed for another
purpose).
Evolution of the Maths Skills ebook and questions
September 2000
September 2002
October 2003
February 2005
December 2006
February 2007
September 2007
October 2007
First Science Short Course (S190 Global warming) includes an appendix of
‘Maths Skills Boxes’ from S103 Block 2. For subsequent Science Short
Courses these boxes were reprinted into a separate booklet.
First presentation of S151 Maths for Science. Evaluation of student
responses to S151’s e-assessment questions in 2003 and 2005 led to insights
into students mathematical misconceptions.
Release of first version of ‘Maths for Science’, a hyperlinked e-book
version of the S151 course book, produced by the PPLATO consortium with
FDTL funding.
Content of the Maths Skills Boxes updated and extended to form the Maths
Skills Booklet, supplied to students on most Science Short Courses. Content
determined following conversations with Science Short Course Chairs and
teaching revised in the light of insights gained from S151 analysis.
Release of the first version of the Maths Skills ebook, incorporating the
content of the Maths Skills Booklet, with further revisions and additional
content (in particular arithmetic with fractions).
Maths Skills ebook, prepared with funding from πCETL, released to Science
Short Course students (alongside Maths Skills Booklet).
Maths Skills ebook released to Science Short Course students with no access
to printed Maths Skills Booklet.
Fifty Maths Skills interactive questions released to students alongside the
Maths Skills ebook.
First presentation of S154 Science Starts Here (some content reused from
Maths Skills ebook).
113
February 2008
April 2008
August 2008
September 2008
First presentation of S104 Exploring Science. Maths Skills ebook provided
as a revision aid for mathematical topics assumed by the course.
Update to content of Maths Skills ebook, with sections added on equations
and symbols, graph plotting and calculator use.
Additional 12 Maths Skills questions released.
Maths Skills ebook and questions available on Science Faculty website, to
enable S104 students to access them before S104 course website opens to
students.
Content of the Maths Skills ebook (January 2009)
Section 1
Section 2
Section 3
Section 4
Section 5
Section 6
Section 7
Section 8
Section 9
Section 10
Section 11
Section 12
Section 13
Section 14
Section 15
Doing calculations, with or without a calculator
Negative numbers
Fractions, ratios and percentages
Decimal numbers and decimal places
Units of measurement
Measuring areas and volumes
Scientific notation
More about powers and units
Significant figures
Reading data from tables
Representing data: pie charts, bar charts and histograms
Representing data: graphs
Equations and symbols
Tips for tackling mathematical questions
Using your scientific calculator
Use of the Maths Skills ebook and questions
The Maths Skills ebook and questions are available on the course websites of the following current
Open University courses (with the number of students registered on each course in 2008 given in
brackets):
S104 Exploring science (approx. 3000 students on presentations starting in 2008)
S216 Environmental science (490 students)
Science Short Courses
S180 Life in the oceans (1563 students)
S186 Volcanoes, earthquakes and tsunamis (1523 students)
S187 Elements of forensic science (1 presentation only; 799 students)
S189 Understanding the weather (2 presentations only; 825 students)
S194 Introducing astronomy (1426 students)
S196 Planets: an introduction (3 presentations only; 967 students)
S197 How the Universe works (1109 students)
SA188 Archaeology (3 presentations only; 1786 students)
SK183 Understanding human nutrition (2460 students)
SK185 Molecules, medicines and drugs (2047 students)
SMK184 Chance, risk and health (369 students)
114
Since November 2008, the Maths Skills ebook (but not the questions) has been available on the
course website for SK(YN)277 Human biology (which has 1382 students on the 2008K
presentation).
The sum of the student populations of these courses during 2008 is 16256, though in adding the
populations some of the students will have been counted several times. Note that students on the
Science Short Courses still have access to a pdf version of the original Maths Skills Booklet, which
contains a subset of the content of the Maths Skills ebook. Students on S104, S216 and SK277
only have access to the material via the Maths Skills ebook, unless they have it from a previously
studied course.
During 2007 and early 2008, the Maths Skills ebook was also available on the course websites for
S182, S199 (discontinued courses) and SDK125.
In addition, the Maths Skills ebook and questions are available to all registered Open University
students from the Studying Science website and the Physics and Astronomy subject website.
Evaluation
Use of the Maths Skills ebook
It is difficult to ascertain the number of students who are actually using the Maths Skills ebook,
since usage can only be logged if the ebook is placed as a separate ‘resource’ on a website. For
S216, where this is the case, there were 281 downloads of the Maths Skills pdf file during 2008.
To put this in context, 490 students started the course and just over 300 took the examination.
There were 386 downloads of the Maths Skills ebook from the Studying Science website in the
two and a half months to 1st November 2008. This extrapolates to around 1850 downloads per
year, probably more given that in the future S104 students will be encouraged to access the Maths
Skills ebook from the Studying Science website before the S104 website opens.
Use of the Maths Skills questions
The ‘old’ version of the Maths Skills iCMA, available from August 2007 to August 2008, was
attempted by 1703 people. The expanded version of the iCMA, available from late August 2008,
has already been attempted by 1276 people (as of 9th December 2008). The pleasing increase in
use can probably be attributed to increasing use by S104 students.
Most students appear to work through the questions in the Maths Skills iCMA in a linear order
and, in contrast to S104’s summative iCMAs, where students frequently look at all the questions
before attempting any, most students attempt each question immediately after they have looked at
it for the first time. However some students just pick particular questions and attempt these out of
order. This behaviour is likely to increase in the future, since S104 students who have difficulty
using the superscript function in S104 iCMAs are now advised to try specific questions in the
Maths Skills iCMA (questions 39, 40, 41, 43, 45, 47, 48, 49, 51, 52, 53 in the version available
from August 2008) for practice.
115
Use of questions in old Maths Skills iCMA
1200
Number of users
1000
800
600
400
200
0
1
3
5 7
9 11 13 15 17 19 21 23 25 27 29 31 33 35 37 39 41 43 45 47 49
Question number
Figure 3a Use of individual questions in the original Maths Skills iCMA, August 2007-August
2008
Use of questions in new Maths Skills iCMA
1000
900
800
Number of users
700
600
500
400
300
200
100
0
1
4
7
10 13 16 19 22 25 28 31 34 37 40 43 46 49 52 55 58 61
Question number
Figure 3b Use of individual questions in the extended Maths Skills iCMA, August-December 2008
116
The way in which use drops off with progress through the iCMA (see Figure 3) is similar to that
observed in formative-only use of other computer-marked assignments (for example the S151
Maths for Science Practice Assignment and the ‘Are you ready for level 1 science?’ diagnostic
quiz). However, there are a number of different features, notably that use drops markedly at
Question 4 in each version of the iCMA, despite the fact that this question is different in the two
versions. In the original version, Question 4 requires students to evaluate a number raised to a
power (this question is Question 7 in the new version, where there is a less marked drop in usage);
in the new version Question 4 requires students to perform some arithmetic on their calculator. In
other situations, substantial drops in use of formative-only iCMAs can frequently be linked to
questions perceived by students to be difficult, complex or time consuming. In other formativeonly uses, such as the S154 Practice iCMA, variants of the original Maths Skills iCMA’s Question
22 (shown in Figure 4a) have caused many students to stop proceeding through the iCMA,
apparently because they had to enter numbers into eight separate boxes. This effect was so marked
that the question has been simplified (with the new version shown in Figure 4b). However,
Question 22 does not seem to have been a particular stumbling block to students’ progress through
the Maths Skills iCMA. Similarly, in other situations, students seem to be put off when they have
to perform a calculation. However Question 35 of the original Maths Skills iCMA (Question 39 of
the new version), although not well answered, did not appear to result in a noteworthy drop in use.
One explanation of these findings is that the Maths Skills iCMA has two characteristically
different types of user: one is put off early in the iCMA when they encounter a mild difficulty e.g.
needing to use a calculator (probably necessary for each Question 4) or to enter a slightly complex
answer (as is the case for the question that is Question 14 in the original version and Question 17
in the new version, both of which were linked to an above average drop in usage). However the
more determined students continue and are less likely to be deterred by later complex questions
such as Question 22 in the original Maths Skills iCMA.
(b)
(a)
Figure 4 (a) A problemmatic iCMA question, though apparently not when used in Maths Skills
questions. (b) A simplified version of the same question.
Details of students’ use and success with each question in the Maths Skills iCMA are given in
Appendix 3. The least well answered question was Question 37 in the original iCMA (Question 41
in the new version) – a unit conversion from m3 to litres and cm3. There was no significant
difference in the performance of the five variants of this question and of the 308 students who had
attempted this question in the extended version of the iCMA by the time it was analysed (early
January 2009), just 62 (20.1%) got the question right at the first attempt whilst 42 were correct at
the second attempt, 18 were correct at the third attempt and 186 (60.4%) remained incorrect after
117
three attempts. Of the 758 responses, only 122 (16.1%) were entirely correct. More students were
able to correctly convert to litres than to cm3, with the most common error being for students to
give a value for the volume in cm3 that was 100 times larger than the value in m3 i.e. applying the
conversion factor from m to cm instead of from m3 to cm3 . Two questions that required a unit
conversion from, for example, Gs to s, with the answers required in scientific notation (Question
45 only in the original iCMA; questions 52 and 53 in the new version) were also poorly answered.
Again there were no significant differences between the different variants of the questions.
Common errors included answers being numerically correct but not in correct scientific notation
(e.g. 347 x 106 or 347000000 instead of 3.47 x 10⁸), the value stated being expressed in scientific
notation with no attempt at unit conversion, and problems with expressing scientific notation (so
answers given as, for example, 3.478). Surprisingly, given that use of the superscript function is
known to cause problems in early S104 iCMAs, very few students appeared to experience
problems with the superscript function, e.g. by entering 3.47 x 10⁸ in the above example). As part
of a joint COLMSCT/piCETL project ‘Investigating the effectiveness of interactive online
assessment for student learning’, the behaviour of Maths Skills questions will be compared with
the behaviour of similar iCMA questions used in different types of assessment (e.g. diagnostic use,
summative use in S154, formative use in S154).
Response to the Maths Skills iCMA feedback question.
The final question on the Maths Skills iCMA asks for comments on the both the questions and the
Maths Skills ebook itself. This question is clearly identified as optional and its content is given in
Appendix 4a.
352 students registered comments between September 2007 and December 2008. Of those who
gave feedback on the original version of the Maths Skills questions (to August 2008) and who gave
an identifiable course, 28 were studying S194, 15 were studying S186, 14 were studying S104, 14
were studying S197, 14 were studying SK185, 10 were studying S180, 10 were studying S196, 9
were studying SK183, 7 were studying SA188, 6 were studying S199, 3 were studying S182, 2
were studying S216 and 2 were studying SMK184. Interestingly, four students only mentioned
courses that do not offer or advertise the ebook or questions to their students (these courses
included A197, ED209, MU120, S103, S282 and S283).
Of those students who gave feedback on the extended version of the Maths Skills questions (from
August 2008) and who gave an identifiable course, 28 were studying S104, 10 were studying
S194, 9 were studying S189, 4 were studying SA188, 3 were studying each of S197, SK185 and
S216, 2 were studying each of S180 and S197 and one was studying each of S182, S186, S196,
S199, SK183. Not surprisingly (given the growing prominence of the ebook and questions, and the
links to them from the Studying Science website, a larger number of students only mentioned
courses that do not explicitly mention the ebook or questions to their students. However it is
slightly worrying that four of these students were studying S154 (whose mathematical content is
almost identical) and two were studying maths courses at a slightly higher (S151) or considerably
higher (MST209) level. Other course mentioned included S278, S367, SK120, SK123 and SK195.
The considerably higher proportion of students studying S104 reflects the fact that S104 was not in
presentation when the Maths Skills ebook was first released and also the fact that it has been given
considerably greater prominence for students studying the second presentation of the course
(which started in October 2008).
118
Summary of responses to the question ‘Which sections of the Maths Skills ebook have you
read?’
Of the 193 responses to this question, 111 (57.5%) indicated that the student had not yet looked at
the ebook at all. The overwhelming majority of these had chosen to start by using the Maths Skills
questions in order check their understanding. However two students had not been able to find the
ebook and another had chosen to read the hardcopy Maths Skills Booklet rather than the ebook.
Two students indicated that they had only read a small part of the ebook, three indicated that they
had skim-read it, and others indicated by the following responses that they had selected relevant
parts of the ebook in other ways:
• Dipped in and out to parts where my knowledge needed a boost
• Looked up when my answers incorrect’
• Only [read the] contents page
• [Only read the] introduction
• The sections I wasn’t confident in
• Not in depth, have studied maths to university level year 2
• Not read whole sections, just recapped on info I wasn’t 100% confident on
In contrast, 45 of these students (23.3%) said that they had read all of the ebook, 8 students said
that they had read most of it and 17 identified the specific sections that they had read.
Summary of responses to the question ‘Have you found the Maths Skills eBook useful?’
Of the 103 responses from students who had used the ebook, 97 (94.2%) were entirely positive,
ranging from ‘yes’ to ‘very’ to ‘incredibly useful – could not manage without it’ (from an S194
student).
The six responses that were not unambiguously positive were:
• Mostly yes (from an S216 student)
• Some of it (from an SK183 student who had only read an ‘odd few [sections] so far’)
• No (from an S194 student who had read ‘only the contents page’)
• Yes, but not particularly for SK183 (SK183 student)
• Depresssing – lots out of my league (SK185 student)
• Only to realise that I wasn’t as rusty as I thought (S194 student)
Many of the students who said that they had found the ebook useful went on to explain why. The
following sample of comments gives an indication of the range of uses to which the ebook is being
put:
• Yes - refreshing very old knowledge (S197 and SK185 student)
• Excellent. It has made sense of a very confusing subject that I have struggled to cope with (S154
and S186 student)
• Yes, it has helped me brush up on some maths skills that i've not used in several years (S194 and
S197 student)
• Yes, good revision (S104 student)
• It was a good recap of most things (S104 student)
Summary of responses to the question ‘Have you found these questions useful?’
Of the 206 responses to this question, 197 (95.6%) were entirely positive, ranging from ‘yes’ to
‘highly’ to ‘Yes very. Fun too’
119
The nine responses that were not unambiguously positive were:
• Some (from the SK185 student who thought the Maths Skills ebook was out of their league)
• Kind of (SDK125, SMK184, SK185, SK195 student who had not read the ebook)
• No (from an S194 student who had read ‘only the contents page’)
• No (S180 and S250 student who had not read the ebook)
• Not really, but wanted to check (S194 student)
• Some of them (S104 student who wanted rearranging equations to be incorporated)
• Yes, but most were very simple (A197, S282, S283 student)
• They weren’t bad (S194 student also doing A level maths who thought, wrongly, that she or he
had found an error)
• No (SA188 student whose suggestion was ‘Make the questions less ambiguous. We are not all
maths graduates’)
Many of the students who said that they had found the Maths Skills questions useful went on to
explain why. The following sample of comments gives an indication of the range of uses to which
the questions are being put:
• Yes – I have identified weak areas to work on (S104 student)
• Yes - to consolidate learning (SK183 student)
• yes. tells me what I need to revise (S104 student)
• yes I now know where my weaknesses are in my mathmatic application to math problems. (S104
student)
• These questions were extremely useful to enable me to practice what I have learned in my other
courses (S154, S151 and S186 student)
• Yes, they have helped to jog my memory! (S194 and S197 student)
• Yes – a good refresher (S189 student)
• Brilliant revision (S189 student)
• Yes, they remind me to be careful when giving answers (MST209 student)
• Yes but have realised I may struggle with the course (S104 student)
Summary of responses to the question ‘Can you suggest any improvements to the Maths
Skills ebook?’
All of the responses to this question are listed in Appendix 4b. Most of the responses fall into the
following 5 categories:
• Confirmation that the ebook is useful in its current form. e.g. ‘no, it is fine as it is’
• Requests for the inclusion of specific additional topics. Some of these e.g. calculator use, were
added when the ebook was expanded and others e.g. more on unit conversions, might be
reasonable. However some of the topics requested, especially those taught within S104 and
S151, are probably not appropriate for an introductory resource.
• Requests for an ‘advanced’ ebook.
• Comments relating to functionality of the ebook itself. Additional information will be provided
to S104 students, so that they appreciate that they do not have to be online in order to use the
ebook and that it is designed to be used interactively so is not suitable for printing. It is a pity
that there is no easy answer to the S194 student who said ‘I would love to be able to cut and
paste the rules (stuff in blue boxes mainly) and useful tips into my own notes as a quick reference
or just as there is a glossary of terms in the course book I would love one for maths terms which
I could keep along side coursework.’
• Complaints from students who hadn’t been able to find the ebook. Some S104 students appear
not to have realised that the link to the ebook from the S104 course website is an ‘active
120
heading’; the link on the website will be made clearer for the 2009B and subsequent
presentations.
Summary of responses to the question ‘Can you suggest any improvements to these
questions?’
All of the responses to this question are listed in Appendix 4c. Most of the responses fall into the
following 9 categories:
• Confirmation that the questions are useful in their current form. E.g. ‘No, they were very clear
and well laid out’; ‘None, the questions are great.’
• Requests for more questions; sometimes more questions on particular topics.
• Requests for different variants of the same questions. Many students appear not realise that these
are already available.
• Requests for more detailed explanation of the concepts. In most cases, these students would be
best advised to follow the reference given to the Maths Skills ebook.
• A score at the end.
• Separate pre- and post- tests.
• Comments relating to the functionality of the questions e.g. a request for a faster webservice; a
comment that the superscript function didn’t work (from a student using an unsupported
browser); a request for the ability to return to the same place in the test (this already happens by
default).
• Comments relating to difficulty in differentiating between the + and the ÷ sign and between n
and m on screen.
• Comments from students who thought that their correct answer had been marked as incorrect (in
all cases the answer had been accurately marked).
S104 Exploring Science Student Survey
The second survey of S104 students included questions about their use of the Maths Skills ebook
and also more general questions about their mathematical preparedness for S104 and their feelings
about the teaching of mathematical skills within the course. This online survey was open for five
weeks in June and July 2008, and 400 students received an email inviting them to complete it.
Only 87 students responded (a response rate of 21.2%).
42.5% of the students had used the Maths Skills ebook and 97.3% of these had found it useful. The
only negative comment received about the Maths Skills ebook was ‘I don’t think the maths skills
booklet or the video-based activities go into enough detail…’ So far as the Maths Skills ebook is
concerned, this comment seems to reflect a misunderstanding about its purpose. We need to make
it clearer to students that the Maths Skills ebook’s purpose in S104 is primarily to help them to
revise topics that are assumed or only taught briefly elsewhere in the course.
Most students were happy with the teaching of mathematical skills in S104 as a whole, e.g. ‘I
found the approach to learning maths in S104 extremely useful, and helped me gain confidence
and understanding in something which I could previously fumble through without such full
understanding.’ However it is clear that some students had underestimated the mathematical level
of the course (e.g.‘If I was doing this again I would have definitely taken a basic maths course to
get me up to speed’). Some had taken S154 Science Starts Here before S104 (as advised for
students who are lacking in basic mathematical confidence) and had found this to be invaluable,
e.g. ‘This provided me with a much needed refresher in mathematics, so when I came to S104 I
was confident with the maths.’ However some students had not appreciated their need to study
121
S154 (only around 50% had attempted the ‘Are you ready for level 1 science?’ quiz) and others
had not been able to afford to do so. These findings point towards the need to do everything
possible to make intending S104 appreciate its mathematical level, but also towards an extended
use for the Maths Skills ebook, for students at the beginning of their study of S104 who find that
they are not as prepared as they should be.
Informal feedback
From time to time our attention is drawn to feedback on the Maths Skills ebook and questions that
has been given elsewhere, for example on course forums. An SK183 student said ‘I am just over
halfway through it and really enjoying it. Certainly highlights how much you forgot since you
leave school (a while ago for me)!’ An SK277 student said ‘I found the OU eSkills maths book
really helpful in explaining to me the maths that we need for this course... It explains the maths,
gives examples and also has a questions section, so you can practice what you have learnt’
An S103 tutor and adviser for the Open University in the West commented ‘it looks just like the
sort of book students should have by them while they are studying all of the level 1 science
courses: a generic level 1 Maths Skills Booklet, not confined to Science Short Courses’.
Conclusions
The Maths Skills ebook and questions have been well received by students on a wide-range of
courses, especially S104 and Science Short Courses. The ebook is now also made available to
students on courses for which it was not specifically designed (e.g. SK277, S216) and the ebook
and questions are available to all registered students by the Studying Science website.
The ease with which the ebook can be updated is a particular advantage and this has enabled its
content to be aligned with that of S154, thus providing a thorough coverage of all the
mathematical skills assumed by S104. The ebook’s content was originally designed to cover all the
mathematical skills assumed by Science Short Courses, but would be sensible to check that
courses written since 2006 do not make any additional mathematical assumptions. Some students
have requested the addition of more advanced topics, as taught in S104. It does not seem
appropriate to include these topics in an introductory ebook; if an ‘advanced’ ebook is required
then Maths for Science (based on the content of S151) could be used.
It is important that students, tutors and study advisers appreciate the role of the ebook in their own
course(s) so, for example, students on SA188 , SK183 and SK185 realise that they do not need to
understand all of it whilst S104 students realise that the role of the ebook is to help them to revise
concepts assumed by the course (not to teach topics such as rearranging equations, which are in
S104 itself).
A few students seem to have difficulty finding and using the ebook; the link on the S104 course
website will be made clearer from the 2009B presentation, and additional advice will be provided
(so that students appreciate that they do not have to be online in order to use the ebook and that the
ebook includes further instructions for its use).
The production of the Maths Skills
questions written for S154 and ‘Are
quality OpenMark questions can be
have, if anything, been even more
students chose to use the questions
questions, by the inclusion of extra data-sets when iCMA
you ready for level 1 science’, highlights the fact that good
produced at minimal resource. The Maths Skills questions
enthusiastically received than the ebook itself, and many
before looking at the ebook itself, in order to check their
122
understanding. In the light of this, when funding and staff availability permit, it would be useful to
add up to 10 new questions to Maths Skills questions, so that there are questions on all the topics
taught in the ebook. The advice on the ‘information’ screen at the beginning of the Maths Skills
questions should also be improved, so that students (irrespective of which course they are
studying) appreciate that they can obtain different variants of most of the questions, that the
superscript function only works in supported browsers and that they should follow the references
provided to the ebook for further information on the skills being tested. Some of the issues raised
by students (for example the difficulty in differentiating between the + and ÷ symbols on screen)
are common to all OpenMark questions and will be investigated.
As part of a joint COLMSCT/piCETL project ‘Investigating the effectiveness of interactive online
assessment for student learning’, the behaviour of Maths Skills questions will be compared with
the behaviour of similar iCMA questions used in different types of assessment (e.g. diagnostic use,
summative use in S154, formative use in S154).
The use of hyperlinks in teaching media has been discussed by, for example, Jonassen (6),
Laurillard (7) and Rouet & Potelle (8). An investigation into the Maths Skills ebook’s usability
and student perceptions of it, especially relative to the hard-copy Maths Skills Booklet would be an
interesting topic for future research.
Acknowledgements
The financial assistance of the Physics Innovations Centre for Excellence in Teaching and
Learning is gratefully acknowledged as are the contributions of Greg Black (Learning and
Teaching Solutions) who programmed the Maths Skills questions and Richard Jordan (consultant)
who produced the Maths Skills ebook and checked the Maths Skills questions.
References
(1) Promoting Physics Learning and Teaching Opportunities (PPLATO) website.
http://www.pplato.co.uk/ [accessed 23rd December 2008]
(2) Tinker, M.H. (2004) Promoting Physics Learning and Teaching Opportunities, MSOR
Connections, 4(3), p40.
(3) Jordan, S.E. (2008) S151 students’ mathematical misconceptions. piCETL project website.
http://www.open.ac.uk/picetl/activities/details/detail.php?itemId=460d36631fee9 [accessed 23rd
December 2008]
(4) Jordan, S.E. (2007) The mathematical misconceptions of adult distance-learning science
students. CETL-MSOR Conference, Loughborough, 11-12 September 2006. Maths, Stats and OR
Network, p. 87-92.
(5) Jordan, S.E. (2007) OpenMark development for S104 and other level 1 courses. piCETL
interim report.
(6) Jonassen, D. (1991) Hypertext as instructional design, Educational Technology Research and
Development, 39(1), 83-92
(7) Laurillard, D. (1993) Rethinking university teaching: a framework for the effective use of
educational technology. London: Routledge. p.120-126.
(8) Rouet, J.-F. & Potelle, H. (2005) Navigational principles in multimedia learning. In. R.E.
Mayer (ed) The Cambridge handbook of multimedia learning. Cambridge: Cambridge University
Press. p.297-312
123
Appendix 1
A comparison of the style of the Science Short Course Maths Skills Booklet and the Maths
Skills ebook.
(a) From the section on ‘Reading information from a graph’ in the printed Maths Skills Booklet
124
(b) From the section on ‘Reading information from a graph’ in the Maths Skills ebook
125
Appendix 2
Instructions for an iCMA question to be used in S154, ‘Are you ready for level 1 science?’
and the Maths Skills questions.
Question 2.10 (with different data-sets for multi-use)
Percentage to fraction of simplest possible form
Question:
Express <p>% as a fraction in its simplest possible form.
<p>%=
[box]
[box]
Datasets
<cancel ref>
Cancelling is discussed
further in Box 2.5
Cancelling is discussed
further in Box 2.5
Cancelling is discussed
further in Box 2.5
Cancelling is discussed
further in Box 2.5
Cancelling is discussed
further in Box 2.5
blank
L1 AYRF
blank
blank
blank
blank
Maths Skills Cancelling is discussed
further in Section 3.1
eBook
Cancelling is discussed
further in Section 3.1
Cancelling is discussed
further in Section 3.1
Cancelling is discussed
further in Section 3.1
Cancelling is discussed
further in Section 3.1
S154
Correct answer is
<course ref>
See Box 2.5
<p>
15
<c> <n>
5
3
<d>
20
See Box 2.5
55
5
11
20
See Box 2.5
95
5
19
20
See Box 2.5
18
2
9
50
See Box 2.5
34
2
17
50
35
65
6
22
38
Section 45
5
5
2
2
2
5
7
13
3
11
19
9
20
20
50
50
50
20
Section 85
5
17
20
Section 14
2
7
50
Section 26
2
13
50
Section 42
2
21
50
blank
blank
blank
blank
blank
See
3.3
See
3.3
See
3.3
See
3.3
See
3.3
<n>
.
<d>
126
Prompts
<Answer>
<p>
<p>%=
100
Cancelling by <c> gives:
<p> <n>
=
100
<d>
<Cancel>
You are on the right lines, but your answer is not in the simplest possible form. Look for a number
to cancel by that will give a simpler but equivalent fraction. <Cancel ref>
<General prompt 2>
Remember that a percentage is a fraction expressed in hundredths, then check that your answer is
in the simplest possible form. <Course ref>
Appearance of prompts
Prompt 1
For all incorrect answers say:
Your answer is incorrect
Prompt 2
<p>
say:
100
Your answer is still incorrect.
If answer is given as
<Cancel>
For all other incorrect answers say:
Your answer is still incorrect.
<General prompt 2>
Prompt 3
For all incorrect answers say:
Your answer is still incorrect.
<Answer>
127
Appendix 3
Usage of individual questions in the Maths Skills iCMA, August 2007- 9th December 2008
Question
number
in ‘old’
iCMA
Users
Aug
2007 to
Aug
2008
Mean
‘score’ †
Aug 2007
to
Aug
2008
Question
number
in ‘new’
iCMA
Users
Aug
to
Dec 2008
Mean
‘score’ †
Aug
to
Dec 2008
Subject
1
2
3
1218
1139
1099
2.92
2.35
2.90
1
2
3
4
5
974
905
876
619
622
2.91
2.35
2.95
2.52
2.81
4
970
2.23
6
617
2.78
7
582
2.82
precedence, all +/− or ×/÷
precedence, mixed +/− and ×/÷
precedence, with brackets
precedence – using calculator
powers notation
evaluation of number to power
evaluation of number to power (no
calculator)
evaluation of number to power (with
calculator)
calculation including power
precedence – more complicated
writing division in different ways
writing division as fraction
ordering negative and positive
numbers
addition of negative number
subtraction of negative number from
negative number
division by a negative number
multiplication of two negative
numbers
equivalent fractions and simplest
possible form
express percentage as a fraction in
simplest possible form
express fraction as a percentage
percentage of value
fraction of value
proportion as ratio
proportion as fraction
proportion as percentage
equivalence of fractions, decimal
numbers and percentages
Addition/subtraction of fraction
Multiplication of fractions
Division of integer by fraction
Division of fraction by integer
Division of fraction by fraction
equivalence of fractions, decimal
numbers and percentages
equivalence of fractions, decimal
numbers and percentages
5
6
7
8
9
926
874
866
865
868
2.64
2.35
2.83
2.92
2.96
8
9
10
11
12
584
560
555
566
567
2.82
2.48
2.84
2.93
2.97
10
11
850
853
2.81
2.43
13
14
566
557
2.83
2.45
12
13
828
818
2.47
2.62
15
16
538
536
2.60
2.65
14
741
2.14
17
486
2.27
15
699
2.41
18
470
2.43
16
17
18
19
20
21
22
690
687
670
650
637
629
600
2.74
2.88
2.84
2.42
2.72
2.78
2.42
19
20
21
22
23
24
460
460
450
438
435
433
2.82
2.86
2.90
2.52
2.78
2.82
23
24
25
26
27
583
542
535
527
505
2.13
2.32
2.34
2.02
2.39
25
26
27
28
29
30
419
400
395
388
379
363
2.17
2.35
2.38
2.12
2.50
2.84
31
344
2.76
128
28
539
2.75
32
350
2.79
29
534
2.69
33
350
2.76
30
31
32
33
34
35
516
499
497
493
488
473
2.52
2.29
2.34
2.67
2.17
1.86
34
35
36
37
38
39
357
346
344
350
350
339
2.64
2.43
2.57
2.68
2.18
1.95
36
37
418
387
2.32
0.94
40
41
313
287
2.44
0.94
38
39
406
371
1.48
2.24
42
43
318
304
1.64
2.25
40
375
2.71
44
292
2.74
41
359
2.32
45
286
2.26
42
359
2.69
46
272
2.68
47
238
2.03
48
219
1.81
49
50
51
52
53
54
55
252
227
216
190
189
219
208
2.73
1.89
1.51
1.08
1.15
2.51
2.08
56
57
58
59
60
61
62
222
235
201
213
201
206
227
2.57
2.69
1.92
0.48∗
2.91
2.70
2.44
43
315
1.54
44
306
1.58
45
46
47
294
324
308
1.07
2.47
2.07
48
49
50
312
316
308
2.68
2.66
2.06
Rounding to number of decimal
places
Rounding to number of decimal
places, including rounding up
SI unit of length and its abbreviation
SI unit of mass and its abbreviation
SI unit of time and its abbreviation
unit conversion e.g. kg to g
unit conversion e.g. kg to mg
calculation of area of rectangle
including units
calculation of volume of cube in m3
unit conversion from m3 to litres and
cm3
correct scientific notation
decimal to scientific notation – big
number
scientific to decimal notation – big
number
decimal to scientific notation – small
number
scientific to decimal notation – small
number
use of scientific notation on
calculator
use of scientific notation on
calculator – inc. entry of e.g. x 10−7
negative powers notation
evaluation of negative power
units in negative powers notation
unit prefixes and scientific notation
unit prefixes and scientific notation
reading value and units from table
using values from table to calculate
ratio
reading from bar chart
reading from line graph
gradient of straight-line graph
plotting graph – choice of axes
plotting points on graph
best fit curve
best fit straight line
† Although the questions are purely formative, most are allocated a score of 3 if the student is correct at the
first attempt, a score of 2 if the student is correct at the second attempt and a score of 1 if the student is
correct at the third attempt. Each question’s mean score therefore provides a first measure of student
performance. The students are not aware of their score, either for an individual question or overall.
∗
The maximum score for this question is 1.
129
Appendix 4a
Content of the feedback question on the Maths Skills iCMA
130
Appendix 4b
Responses to the feedback question ‘Can you suggest any improvements to the Maths Skills
eBook’
From original version of iCMA (to August 2008)
• more explanation of certain points such as m s-1 (S194 student)
• Include question on radians/degrees conversion to assist with S194 (S194 student)
• I would love to be able to cut and paste the rules (stuff in blue boxes mainly) and useful tips into
my own notes as a quick reference or just as there is a glossary of terms in the course book I
would love one for maths terms which I could keep along side coursework. (S194 student)
• I am struggling with the scientific calculator having never touched one before. I would willingly
have bought a particular one if the OU could supply a 'noddy guide' (S194 student)
• to send to furhter guidance if don't get anser right, or if faced with a question that you haven't a
clue, can get some guidance straightaway (S182 student)
• Not really - good layout and not too heavy
• Perhaps an explanation as to how it should be used, i.e. how to return to the question from the
answer page. I had to keep signing on to the web ultil I tumbled to it.(SA188 student)
• None - Booklet gives all necessary information for required calculations
• Please explain how the 3D pie chart works. I couldn't make sense of it at all!
• no, it is fine as it is
• some answers could be explained in more detail I struggled with some of the notation
calculations (SK185 student)
• no, very useful, illustrates areas of wekness and where to go and swat up to improve
• rearranging equations could be incorporated (S104 student)
• It would be good to have an advanced version too (A197, S282, S283 student)
• tell people where the maths skills ebook is (S199 student who had not found the Maths Skills
ebook)
• Some sections are really easy – reading a table, and some really really hard.(S194 student)
• maybe a few more formulae relevent to s104. (S104 student)
• This ebook has proved to be very useful, it is clear and easy to understand,although a paper copy
would be useful, so that students would be able to acess the info and practice their maths without
having to be on line. (S154 and S186 student)
• More exercises about converting units and more ratio's and more scientific notation exercises.
(S194 student)
• In some chapters I would be nice to have more different examples
• none perhaps questions which involve problem solving similar to questions in s104 (S104
student)
• It would be good if there were different questions so that you could complete this over and over
and not get the same questions each time.
• Help on calculator buttons? (S186 student)
131
From revised version of iCMA (from August 2008)
• None, its pretty good as is.
• section on ppm
• good as it is
• It would be better if the ebook link took me to the book rather than the questions. I answered
most of them without an explanation of workings
• maybe a few pictures and colour
• I would prefer to have something I can carry round with me and not have to sit at the computer
continuously - for eg when I've got a few mins spare there is no time and possible no opportunity
to log on to a computer (S189 student)
• On answering the Maths Skills questions, direct links to the appropriate chapter of the ebook
that open in a new window would be very useful
• a link back from the answer to the question
• you don't ned the really easy question as it put me off to start with. though the rest is pretty
useful (S187 student)
• send me one and I'll tell you (SK120 student)
• Yes change it. Put more harder questions in (S104 student)
• Expanding on using calculators (S104 student)
• More detail, more sections. (S194 student)
• To be able to print it off in less pages so you can read through it like a workbook - reading on a
computer is (S151 student)
• Maybe an interactive study guide using Macromedia Flash with audio and video.
132
Appendix 4c
Responses to the feedback question ‘Can you suggest any improvements to these questions’
Original version (to August 2008)
• Actually - I wouldn't mind some more - to ensure I'm covering everything - and retaining the
knowledge, even after the course! (S197 and SK183 student)
• the superscribe button didn't work so well on my computer :-( (student using an unsupported
browser)
• If one area is giving trouble (ie answers incorrect), additional questions, for practice, could be
offered.
• If a question is answered wrong, provide hints with guidance of how to solve the questions. Not
just giving the solution and working after the question is answered correctly.
• I thought they were sufficiently challenging, but I am rusty, so maybe there could be a 'really
hard' section at the end with a mish-mash of questions from different areas
• more questions in Section 8 (S194 student)
• More sets for practise? Perhaps whole sets in a particular area that require practise.
• only more of them please.
• This was, for me, a good refreasher.
• Score at the end with average number of attempts per question
• some basic explanation as you go along. eg I did not know the term SI (SK185 student)
• make them in a form to be downloaded onto and used on a handheld PDA or iPOD, so they can
be used in the same way as a hand-held game, to improve with practising.
• I didn't realise which book was being referred to. It would have helped me if the book was named
on the question pages.(S196 student)
• None - Questions cover information included in booklet
• No, they were very clear and well laid out.
• I couldn't find a way of doing them in more than one go - i.e. I couldn't see a way tosave my first
batch of answers and just continue from where I'd left off, rather than having to start all over
again. But perhaps I just missed it?(odd because this student had signed on)
• don't use questions where you need a calculator or pen and paper. I was trying to do them in my
head.(S199, S186 student)
• when you have to reattempt a question it would be nice to see the advice that has just been
presented to you
• I can,t remember which question, but the answer was something like 7.88 * 10 to the power of 9. My calculator gave an answer of 0.000000007 so I couldn,t actually get the correct
answer.(Section on calculator use has now been added to ebook)
• including some on orders of magnitude would be useful for S196 (S196 student)
• maybe arrows depicting how many steps the decimal point should move. I'm still not sure of one
answer. Some questions are a little difficult to read as a lay-person (SK185 student)
• I find it very surprising that after testing and explaining scientific notation, you then use several
incorrect examples. For instance 7.98x10^-9 - 10x10^-10 when really it should use 1x10^-9.
• is all good!!!
• Faster webserver
• It would be helpful if one could refer to the book while attempting the questions. My knowledge
is lacking in a few places, and while I do not need to read the whole book, some questions left me
floundering! (MU120 student)
133
• On the version I did, Q43 was something like 7.98 x 10^-9 - 10^-10 but it marked my answer as
incorrect and and gave the correct answer as 7.88 so I think this might be an error, but enjoyed
doing the test.(S216 student who had not read the ebook)
• set out clearly
• Once 3rd attempt wrong give full worked answer. Sometimes it just gives the answer without
explanation to how it got there.
• The questions are varied already and do give good practice during and before the course so
personally I do not have any suggestions for improvements.(S154 and S186 student)
• Having not read the maths skill book, and wanting to see how much i knew and had forgotten,
some of the questions were a little ambiguous for me. A help button on the questions that shows
the information displayed usually once you have answered a question wrong twice, would be
useful.
• Maybe it would be useful to explain clear the rules about powers and roots.(S194 student)
• not really. did s151 maths for science and passed. tried this exercise as revision practice. (S104
student)
• Make a pre- test so people can guage where they are before studying a whole book. I certainly
know where my weaknesses ar now (S194 student)
• It would be useful to have a reminder of the units of measurements and how they relate to each
other in terms of powers etc. (S186, S154 and S151 student)
• Time questions in Scientific notation (S186 student)
• No, it seems fine as it is.
• I used the questions to test my existing knowledge, being able to audit performance pre- and
post- study of the ebook would have proved useful (S186 student)
• More of them!
134
Revised version (from August 2008)
• Would like to be tested on negative powers and roots(S216 student)
• A score at the end (S104 student)
• None, the questions are great.
• Difficult to differentiate between plus and division symbols
• i found the questions very helpful. especially explainations if incorrect answers are entered. it
was just the refresher i needed
• more questions please, maybe a second set
• no-they were a good challenge (S104 student)
• not to sure why i got one wrong - i thought time always went along the x axis (S197 student who
had not read the ebook)
• You might want to check Section 4) Question 33 - As i'm taking A2 Maths and we have been
taught that if you were to round 4.8479 to 1d.p's then you would have 4.9 as the 7 causes the 4 to
become a 5 and therefore the 8 a 9. But we may have been taught wrong (S194 student who had
not read the ebook)
• no. They were great, but some needed a bit more explaining I thought (S187 student who had
‘/got bored’ of the ebook and so only read a few sections)
• Maybe some more in-depth questions on each topic would be useful
• Most helpful that you have to answer the computer, whereas if you read the book you could skip
the difficult bits more easily
• perhaps a before and after skill question so that people can focus on the parts they need to
improve on and then test if they've "got it" (S104 student)
• Well if the questions were relevant ie if I'd been offered the e book it might help. (SK120 student
who had not found the ebook)
• More of them
• yes, make the questions less ambiguous; we are not all maths graduates. (SA188 student)
• more of them
• One of the questions was unclear purely due to font. I thought it said 632 mm and it was only
when I got it wrong twice and peered at it really hard that I realised it was nm
• Would be helpful if you could leave the test and revisit it at the point where you left rather than
starting again from the beginning (S104 student, signed on so should have been able to do this)
• Have a second version divided into same sections so that we can retry parts we got wrong first
time
• Improve representation of divide / addition symbols - they look very similar when displayed on
screens set to high resolution
• make the addition sign more clearer
• Sometimes I got an answer partially correct or in the wrong format or not rounded down to a
smaller number so that the answer was wrong, I think this will discourage some students who
are struggling with the maths. (S199 student)
• an option to save and come back to test. (S180 student, signed on so should have been able to do
this)
135