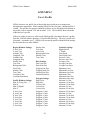
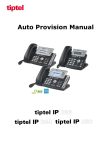
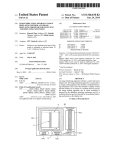
1
Naval Interactive Data Analysis System User’s Manual Version 5.4c GeoResources Institute Mississippi State University www.gri.msstate.edu Copyright © 2007 Mississippi State University Prepared for the Naval Oceanographic Office March 2007 TABLE OF CONTENTS SECTION 1 INTRODUCTION ...................................................................................................................1 1.1 SCOPE ................................................................................................................................................. 1 1.1.1 Identification ............................................................................................................................. 1 1.1.2 System Overview ....................................................................................................................... 1 1.1.3 Data Overview........................................................................................................................... 1 1.1.4 Functionality Overview ............................................................................................................ 2 1.1.5 Document Overview.................................................................................................................. 2 1.2 CONVENTIONS .................................................................................................................................... 2 SECTION 2 INSTALLATION AND EXECUTION..................................................................................3 2.1 INSTALLATION .................................................................................................................................... 3 2.2 EXECUTION (LAUNCHING THE APPLICATION) .................................................................................. 3 2.2.1 The Java Command .................................................................................................................. 4 2.2.2 The Java Heap Size ................................................................................................................... 4 2.2.3 The Properties File.................................................................................................................... 4 2.2.4 The User’s Profile...................................................................................................................... 4 SECTION 3 DATA MANAGEMENT MODULE......................................................................................5 3.1 GRAPHICAL USER INTERFACE ........................................................................................................... 5 3.1.1 Main Menu ................................................................................................................................ 5 3.1.2 Project Section........................................................................................................................... 6 3.1.3 Map Section ............................................................................................................................... 6 3.2 PROJECT AREA ................................................................................................................................... 6 3.2.1 Create Project Area .................................................................................................................. 6 3.2.2 Delete Project Area ................................................................................................................... 7 3.2.3 Project Area Info....................................................................................................................... 7 3.3 DATASET ............................................................................................................................................. 8 3.3.1 Create Dataset ........................................................................................................................... 8 3.3.1.1 LLT Datatype Options.......................................................................................................................... 9 3.3.1.2 Bathy Datatype Options ....................................................................................................................... 9 3.3.2 Delete Dataset .......................................................................................................................... 10 3.3.3 Dataset Info.............................................................................................................................. 10 3.4 DATA ................................................................................................................................................. 10 3.4.1 Ingest Data............................................................................................................................... 10 3.4.2 Delete Data............................................................................................................................... 10 3.4.3 Inventory Data ........................................................................................................................ 11 3.5 ANALYSIS .......................................................................................................................................... 11 3.6 HELP ................................................................................................................................................. 11 SECTION 4 DATA ANALYSIS MODULE..............................................................................................11 4.1 ANALYSIS CONTROL WINDOW ........................................................................................................ 12 4.1.1 Main Menu .............................................................................................................................. 12 4.1.1.1 4.1.1.2 4.1.1.3 4.1.1.4 4.1.1.5 4.1.1.6 4.1.1.7 4.1.1.8 4.1.1.9 Create ViewGraph ............................................................................................................................. 13 Read Data .......................................................................................................................................... 13 Export Data........................................................................................................................................ 16 Data Status......................................................................................................................................... 17 Change Units...................................................................................................................................... 17 Bring to Front .................................................................................................................................... 17 Where’s the Tools............................................................................................................................... 18 Repaint All.......................................................................................................................................... 18 Save User Profile ............................................................................................................................... 18 4.1.2 Mouse Position ........................................................................................................................ 18 4.1.3 Classification Status................................................................................................................ 19 4.1.4 Data Container ........................................................................................................................ 19 i 4.1.4.1 Coastline Data Options...................................................................................................................... 19 4.1.4.2 LLT Data Options .............................................................................................................................. 19 4.1.4.3 Bathymetry Data Options................................................................................................................... 20 4.1.5 Keyboard Shortcuts ................................................................................................................ 21 4.2 TOOLS WINDOW ............................................................................................................................... 21 4.2.1 Zoom ........................................................................................................................................ 21 4.2.2 Polygon..................................................................................................................................... 22 4.2.3 Profile Isolation ....................................................................................................................... 23 4.2.4 Synthetic Profiles .................................................................................................................... 24 4.3 GRAPHICAL WINDOWS .................................................................................................................... 26 4.3.1 Region Window ....................................................................................................................... 26 4.3.2 Graph (Profile) Windows ....................................................................................................... 27 APPENDIX A GLOSSARY..................................................................................................................... A-1 APPENDIX B INSTALLATION PROCEDURES.................................................................................B-1 APPENDIX C NIDAS PROPERTIES FILE ......................................................................................... C-1 APPENDIX D NIDAS ICONS ................................................................................................................ D-1 APPENDIX E INPUT/OUTPUT FORMATS.........................................................................................E-1 APPENDIX F USER’S PROFILE ...........................................................................................................F-1 APPENDIX G PROFILE FLAGS .......................................................................................................... G-1 ii TABLE OF FIGURES Figure 1. Data Management Module.............................................................................................................. 5 Figure 2. DMM Zoom with Grid and Rivers.................................................................................................. 6 Figure 3. Project Area Dialog......................................................................................................................... 7 Figure 4. Dataset Dialog for LLT and Bathymetry ........................................................................................ 8 Figure 5. Data Version Dialog...................................................................................................................... 10 Figure 6. DAM Analysis Control Window................................................................................................... 11 Figure 7. Read Data Dialog .......................................................................................................................... 14 Figure 8. Export Data Dialog ....................................................................................................................... 16 Figure 9. Data Status Dialog ........................................................................................................................ 17 Figure 10. Save User Profile Dialog............................................................................................................. 18 Figure 11. LLT Data Options Dialog ........................................................................................................... 19 Figure 12. Bathymetry Data Options Dialog ................................................................................................ 20 Figure 13. DAM Tools Dialog ..................................................................................................................... 21 Figure 14. Polygoned Data ........................................................................................................................... 22 Figure 15. Polygon Options Dialog.............................................................................................................. 22 Figure 16. Polygoned Profiles and the Polygon Subset Dialog .................................................................... 23 Figure 17. Profile Editing Dialog ................................................................................................................. 24 Figure 18. Synthetic Profiles Dialog ............................................................................................................ 24 Figure 19. Synthetic Average for Temperature and Salinity ........................................................................ 25 Figure 20. Region Window .......................................................................................................................... 26 Figure 21. Profile Windows ......................................................................................................................... 28 TABLE OF TABLES Table 1. Format Compatibility ..................................................................................................................... 17 Table 2. Format Summary ...........................................................................................................................E-1 Table 3. Data type abbreviations .................................................................................................................E-1 Table 4. Bathymetry Old Charter Format - Binary......................................................................................E-3 Table 5. Bathymetry New Charter Format - Binary ....................................................................................E-3 Table 6. LLT Master Format - Binary.........................................................................................................E-4 Table 7. LLT MoodsAdmin Format - Text .................................................................................................E-6 Table 8. LLT Moods2K Format - Text........................................................................................................E-8 Table 9. LLT CASTAR Format - Text......................................................................................................E-12 Table 10. Generic Text Format for Master and MoodsAdmin Data – Text ..............................................E-12 Table 11. Generic Text Format for Moods2K Data – Text .......................................................................E-13 Table 12. Polygon Information Format – Text ..........................................................................................E-14 Table 13. Synthetic Profiles Format – Text...............................................................................................E-15 Table 14. Master and MoodsAdmin Flags ................................................................................................. G-1 Table 15. Moods2K Flags .......................................................................................................................... G-2 iii NIDAS User’s Manual March 2007 SECTION 1 INTRODUCTION 1.1 Scope 1.1.1 Identification Naval Interactive Data Analysis System (NIDAS) Version: 5.4c Contract No: N62306-01-D-B001 0029 Contractor: Mississippi State University GeoResources Institute Principal Investigator: Clifton Abbott Mississippi State University GeoResources Institute Box 9652 Mississippi State, MS 39762 Telephone: (662) 325-9435 Facsimile: (662) 325-7692 1.1.2 System Overview The objective of the Naval Interactive Data Analysis System (NIDAS) is to provide the Naval Oceanographic Office (NAVOCEANO) with an interactive overlay capability for several types of oceanographic, meteorological, and satellite defined data, and create 3-D gridded fields of temperature and salinity profiles constructed from a combination of “provinced” data (user derived) and gridded data. NIDAS is programmed totally within the Java Programming Environment which is a Sun Microsystems product. NIDAS strives to stay compatible with the Java version NAVOCEANO officially supports as well as the version of Microsoft Windows operating system. NIDAS supports the following versions: Operating System: Windows NT, 2000, XP Java Runtime Environment: 1.4.2_05 1.1.3 Data Overview NIDAS operates using numerous oceanographic data categories stored in an internal data management system. Data management, configuration, and control functions for the data management system are performed internally within NIDAS. The data categories employed by NIDAS are: 1 NIDAS User’s Manual March 2007 • Bathymetry - ocean depth at a specific minute resolution, • Coastline - vector coordinates of the shoreline at several different resolutions from the World Vector Shoreline datasets, and • LLT - oceanographic profiles identified by a Latitude Longitude Time reference. NIDAS will analyze data such as temperature, salinity, sound speed, density, and conductivity and will graph that data against depth. Data formats for LLT data are prescribed by the Master Oceanographic Observation Data Set (MOODS). The formats for LLT are described in Appendix E. The LLT data category is described as profile data taken at a specific latitude and longitude, at a specific time, and measured at multiple depths in the ocean. A profile contains depth values and will contain just temperature; temperature and salinity; or temperature, salinity, and sound speed. If the profile has just temperature and salinity, then sound speed, conductivity, and density are calculated when read into memory. If sound speed is measured, then only conductivity and density are calculated. 1.1.4 Functionality Overview The NIDAS user interface is divided into two main modules. The first module is the Data Management Module (DMM) allowing project areas, datasets, and data versions to be created, edited, and deleted. The second is the Data Analysis Module (DAM) allowing the data to be manipulated, analyzed, quality controlled, synthesized, and exported. 1.1.5 Document Overview The purpose of this document is to provide a user’s guide for NIDAS and to describe techniques/procedures that users may employ in producing a useful oceanographic product using NIDAS. Appendix A contains a glossary of terms and acronyms used in this document. Appendix B provides the installation procedures for NIDAS. Appendix C provides a description of the properties file that NIDAS uses. A description of the icons used in NIDAS is available in Appendix D. Information about all the input and output files that NIDAS uses and creates is provided in Appendix E. Appendix F lays out the user’s profile, while Appendix G provides the profile flags available. 1.2 Conventions To simplify and standardize the communication of procedural details to the user, this manual adopts the following conventions: • Mouse Button Convention: Most “click” or “select” operations with the mouse use the left button. Unless otherwise specified, instructions to “click” or “select” refer to the left mouse button. When a “click” or “select” using the middle or right 2 NIDAS User’s Manual March 2007 mouse button is required, the specific mouse button will be indicated in the text. Otherwise the left mouse button should be assumed. • Non-interactive Textboxes: Textboxes with a tan-colored background are noninteractive. They provide information only and cannot be modified by the user. • Dragging the Mouse: Dragging the mouse refers to clicking the left mouse button, moving the mouse across the screen, and then releasing the mouse button. • Polygoning: The act of creating a polygon around data. Data that is located within a polygon is referred to as being polygoned. SECTION 2 INSTALLATION AND EXECUTION 2.1 Installation A full installation of NIDAS can only be done from an installation CD. The installation includes a starter database, a properties file, and a default user profile. The installation can be performed by either an administrator or a normal user. The difference is that as an administrator, program shortcuts and start menu items can be added for all users instead of a single user. Install instructions and requirements are provided with the CD and more information is available in Appendix B. Upgrades are also provided and can be obtained from the NIDAS website or from the installation CD. The NIDAS website is located at http://www.gri.msstate.edu/research/nidas. Upgrades are packaged to minimize download size. This is done to allow the upgrade to fit on a floppy disk so that it can be easily moved from an unclassified environment to a classified one. In order to achieve this, previous upgrades are not necessarily included with the current upgrade, requiring upgrades to be applied in order. 2.2 Execution (Launching the Application) NIDAS provides shortcuts for launching the application in the software directory, the start menu, and the user’s desktop. If the shortcut is lost, it can be easily recreated with the following information: Target: <Java Software Directory>\bin\javaw.exe -Xmx100m -jar “<NIDAS Software Directory>\bin\n.jar” Start in: “<NIDAS Software Directory>” Icon: “<NIDAS Software Directory>\images\nidas.ico” 3 NIDAS User’s Manual March 2007 2.2.1 The Java Command There are two java commands that can be used to start NIDAS. The default for NIDAS is “javaw.exe”, or the window style. The other command is “java.exe”, or the command prompt style. Using the window style will start NIDAS just like any normal application. The command prompt style will create a command prompt window with the application. The advantage to the command prompt style is that any command line messages that are produced from NIDAS can be seen, including java error messages. If problems are suspected within NIDAS, the command prompt style is preferred so that any error message can be reported to the NIDAS Bug Database (available from the website). 2.2.2 The Java Heap Size The Java heap is an area of memory set aside for the use of NIDAS. NIDAS starts out at a default heap size and when more is needed, the heap grows up to the maximum heap size. When the maximum size is reached, NIDAS will produce error messages saying “Out of Memory”. These messages can be seen through the command prompt window that is produced when using the “java.exe” command (refer to section 2.2.1). The maximum heap size can be set with the “-Xmx” option. The target provided for the shortcut in section 2.2 shows this option being used to set the maximum size to 100 megabytes (100m). The setting of 100 megabytes should be used as a minimum and can be increased as needed. This setting should not be set to more than half of the total memory available. 2.2.3 The Properties File NIDAS has a properties file that provides the location of certain NIDAS components. Also provided are some default values and ranges for certain items within the software. More information on the properties file is provided in Appendix C. 2.2.4 The User’s Profile NIDAS creates a profile for each user the first time that user starts NIDAS. This profile stores the user’s preferences on many items located within the application. Along with the profile, a “workspace” directory is created and is named the same as the user’s name. The user profiles and the “workspace” directories are located in “<NIDAS software directory>\Users”. More information on the user’s profile in provided in Appendix F. 4 NIDAS User’s Manual March 2007 SECTION 3 DATA MANAGEMENT MODULE 3.1 Graphical User Interface The Graphical User Interface (GUI) (Figure 1) for the DMM is arranged into three sections: the menubar section which includes a toolbar; the project section which shows both project areas and datasets; and the map section. 3.1.1 Main Menu The menubar provides three main items and a toolbar. The main items on the menubar are File, Tools, and Help. The items under the Tools pull-down menu are Figure 1. Data Management Module also provided on the toolbar. The menu items are described in detail later and are listed here as follows: File o Reset – resets the selection on the project areas and the datasets. Also resets the map section. o Exit – exits out of the NIDAS application. Tools o Project Area Create – creates a new project area. Delete – deletes the selected project area. All datasets and data within the project area will be deleted. Info – view the information for the selected project area. Certain items can be edited. o Dataset Create – creates a new dataset. Delete – deletes the selected dataset. All data within the dataset will be deleted. Info – view the information for the selected dataset. Certain items can be edited. o Data Ingest – ingest data into the dataset. Each data file ingested is referred to as a data version. Delete – delete a data version from the dataset. Inventory – inventory the dataset to see stored data. o Analysis – leave the DMM and enter into the DAM. Help – Displays some “about” information for NIDAS. 5 NIDAS User’s Manual March 2007 3.1.2 Project Section The project section shows the current project areas and datasets that have been setup for NIDAS. NIDAS allows project areas to be setup to allow a hierarchal structure to the data. For example, a project area could be an exercise in the Gulf of Mexico or the Yellow Sea. Under that project area, multiple datasets can be created to allow further structuring of the data. Within the same project area, different datasets could represent seasons, survey ships, instruments, or historical data. When a project area is selected, the region is shown by a bounding box in the map section. 3.1.3 Map Section The map section provides a global map for the use of selecting or displaying areas that are associated with project areas. The user can create a bounding box around an area by clicking the left mouse button and dragging the mouse to encompass the area. The boxed area is cleared when the reset menu item is selected. The global map shows the current position of the mouse and provides a zoom utility. Figure 2. DMM Zoom with Grid and Rivers The zoom utility provides a way for the area of interest to be more precise within small areas. With an area selected, click the “Zoom” button to display the area. While in the zoom window, a grid, country boundaries, and rivers can be overlaid by clicking the right mouse button within the zoom window and selecting the appropriate item (Figure 2). The new area can be made by dragging the mouse across the window to create a new box. Only the last box made is kept. When finished, choose the “Quit” item by clicking the right mouse button within the zoom window. If the area needs to be zoomed even further, click “Zoom” again. 3.2 Project Area The project area is the top level container for data and defines the geographical region for the analysis module. Project areas can be created, deleted, or edited. 3.2.1 Create Project Area A project area can be created by choosing the “Add Project Area” toolbar button or by choosing create under the “Tools->Project Area” menu option. Information for the project area includes the name, description, the user creating the area, a time stamp, an additional project identifier, classification, and the minimum-maximum latitude and 6 NIDAS User’s Manual March 2007 minimum-maximum longitude of the region. The creator and the time stamp are retrieved from the system and can not be changed and are therefore shown with a tan background. Tooltips are provided as the mouse hovers over the text fields. Project Area Name – 50 character string. After creation, the name can not be edited. Description – 50 character string. After creation, the description can be edited. Creator – Prefilled by the system and can not be changed. Date (time stamp) – Prefilled by the system and can not be changed. Project – An extra project descriptor. After creation, the project can be edited. Class – The general classification for the project area. This field is not used anywhere else and can be edited. Minimum and maximum Latitude and Longitude – These values are specified in decimal degrees and can be provided by one of three ways. The user can provide these values directly, by creating a bounding box on the global map before entering this dialog, or by selecting another project area before entering this dialog. When a bounding box has been created or when the user has selected another project area, those coordinates are prefilled in this dialog. These values can be edited after creation. After all the values have been provided, press “Add” to create the project area. All fields must be provided. 3.2.2 Delete Project Area A project area can be deleted by selecting the project area from the list and selecting the “Delete Project Area” button from the toolbar or by selecting “Tools->Project Area->Delete” from the menubar. A dialog will display all of the area’s information and will provide a “Delete” button. Once the dialog’s “Delete” button is pressed, the project area will be deleted along with all datasets and data versions located under that project area. CAUTION, THERE IS NO OPTION TO UNDO THIS ACTION. Figure 3. Project Area Dialog 3.2.3 Project Area Info By selecting the “Project Area Info” button from the toolbar, or from the “Tools->Project Area” menubar, all of the area’s information will be displayed as shown in Figure 3. If editing is needed, the user can make changes and press the “Update” button. Those items that display a tan background are not editable. When editing the region’s latitudes and 7 NIDAS User’s Manual March 2007 longitudes, NIDAS will notify the user when the new coordinates result in a data version within the project area being excluded by the new coordinates. 3.3 Dataset The dataset allows further structuring of data within the project area. For example, different datasets could represent different exercises in the same region. The dataset also defines some default data options for use within the analysis module. Datasets can be created, deleted, or edited. 3.3.1 Create Dataset A dataset can be created by choosing the “Add Dataset” toolbar button or by choosing create under the “Tools->Dataset” menu option. Information for the dataset includes the name, datatype, the user creating the dataset, a time stamp, classification, description, and some default values for the dataset. The creator and the time stamp are retrieved from the system and can not be changed and are therefore shown with a tan background. Tooltips are provided as the mouse hovers over the text fields. After all the values have been provided, press “Add” to create the dataset. All fields must be provided. Dataset Name – 50 character string. After creation, the name can not be edited. Datatype – LLT or Bathy. After creation, the type can not be edited. Creator – Prefilled by the system and can not be changed. Date (time stamp) – Prefilled by the system and can not be changed. Class – The general classification for the dataset. This field is not used anywhere else and can be edited. Description – 50 character string. After creation, the description can be edited. Figure 4. Dataset Dialog for LLT and Bathymetry 8 NIDAS User’s Manual March 2007 3.3.1.1 LLT Datatype Options Most of the options for the LLT datatype, shown in Figure 4, are associated with three “time ranges”. When data is ingested, the center Julian date is determined. Three subsets are created based on that center date. The first subset includes data that is within a plus or minus range around the center date. The second subset is an additional minus range from the first subset. The third subset is an additional plus range from the first subset. For example, a data version may include data for all 12 months. The center date is calculated to be day 182, or July 1st. The first subset value of 60 would include data from May, June, July, and August (from day 122 to 242). The second subset value of 120 would include data from January, February, March, and April (from day 2 to 121). The third subset value of 120 would include data from September, October, November, and December (from day 243 to 362). To allow all the data to display together in the same subset with the example above, set the “+/-” value to 182 and both the “-” and the “+” value to 0. This will put all 12 months in the same subset. +/- (plus/minus) – Days plus or minus from center date. - (minus) – Additional days before the plus/minus field. + (plus) – Additional days after the plus/minus field. Color 1 – Display color for data residing in the “+/-” range. Color 2 – Display color for data residing in the “-” range. Color 3 – Display color for data residing in the “+” range. PolyColor 1 – Display color for data residing in the “+/-” range that has been polygoned. PolyColor 2 – Display color for data residing in the “+/-” range that has been polygoned. PolyColor 3 – Display color for data residing in the “+/-” range that has been polygoned. IsoColor – Display color for a profile that has been isolated through the “Profile Isolation” tool. IsLocation – Display data on the Region window. IsProfile – Display data on the Profile windows. IsDepth – Display depth vertices on the profiles. 3.3.1.2 Bathy Datatype Options Bathymetry data is based on bottom depth at a specific resolution. To display bathymetry, NIDAS takes a range of depths and displays every nth depth. For instance, NIDAS can display every 10th depth from 100 meters to 200 meters. This would show depths 100 meters, 110 meters, 120 meters, and so on. Min – Minimum depth. Max – Maximum depth. Interval – Depth interval to display. Color – Display color for depths. 9 NIDAS User’s Manual March 2007 3.3.2 Delete Dataset A dataset can be deleted by selecting the dataset from the list and selecting the “Delete Dataset” button from the toolbar or by selecting “Tools->Dataset->Delete” from the menubar. A dialog will display all of the area’s information and will provide a “Delete” button. Once the dialog’s “Delete” button is pressed, the dataset will be deleted along with the data versions located within that dataset. CAUTION, THERE IS NO OPTION TO UNDO THIS ACTION. 3.3.3 Dataset Info By selecting the “Dataset Info” button from the toolbar, or from the “Tools->Dataset” menubar, all of the dataset’s information will be displayed. If editing is needed, the user can make changes and press the “Update” button. Those items that display a tan background are not editable. 3.4 Data The data area is where the “real” data is located. The “real” data is stored as data versions. Data versions could represent different months within the same dataset. Data versions can be ingested, deleted, or inventoried. Figure 5. Data Version Dialog 3.4.1 Ingest Data Data can be ingested by choosing the “Data Ingest” toolbar button or by choosing “Ingest” under the “Tools->Data” menu option. Information for the data includes the file name and the version name. For LLT data, new data can be appended to an existing version by providing the same version name. After all the values have been provided, press “Add” to ingest the data. All fields must be provided. In order for the version to be ingested, some of that data has to reside within the project area’s region. If the entire data file being ingested resides outside the region, an error message is generated. If some of the data resides within the region and some outside the region, a warning message is generated and the data is ingested. Data files that can be ingested are Bathymetry Charter files, LLT Master files, LLT MoodsAdmin files, LLT Moods2K files, and LLT Model Data files. These data files are described in Appendix E. 3.4.2 Delete Data A data version can be deleted by selecting the “Data Delete” button from the toolbar or by selecting “Tools->Data->Delete” from the menubar. A dialog will display all of the 10 NIDAS User’s Manual March 2007 versions available in the dataset. Selecting a version will display the version’s information and will provide a “Delete” button. Once the dialog’s “Delete” button is pressed, the version will be deleted. CAUTION, THERE IS NO OPTION TO UNDO THIS ACTION. 3.4.3 Inventory Data By selecting the “Data Inventory” button from the toolbar, or from the “Tools->Data” menubar, all of the versions available in the dataset are listed (Figure 5). Selecting a version will display the version’s information, none of which are editable. 3.5 Analysis The “Analysis” tool takes you from the DMM and into the DAM. A project area must be selected. The DMM windows will disappear while in the DAM and will reappear when the DAM is exited. The DAM is discussed in detail in Section 4. 3.6 Help The Help menu currently only provides an “About” item which displays information about the NIDAS application. A dialog will appear showing the version of the NIDAS software, the release date of this version, the version of the Java Runtime Environment (JRE) for which NIDAS was released for, and the version of the JRE currently running. SECTION 4 DATA ANALYSIS MODULE The GUI for the DMM is arranged into three areas: the analysis control window, the tools window, and the graphical windows. The analysis control window is where everything is driven and controlled. A set of tools are provided in one central location. The graphical windows are a set of seven windows where data is displayed and manipulated. There is one graphical window showing a regional, top-down view of the project area that was selected before entering the DAM. Five windows are vertical profile graphs of Depth verses Temperature, Salinity, Sound Speed, Conductivity, and Density, while one window is plotting Temperature verses Salinity. Figure 6. DAM Analysis Control Window 11 NIDAS User’s Manual March 2007 4.1 Analysis Control Window The control window, shown in Figure 6, is divided into four sections providing a menubar, mouse tracking, classification status, and a data container holding data that has been read into memory. 4.1.1 Main Menu The menubar provides four pulldown menus providing control of the DAM. The pulldowns includes File, New Window, Data, and Options. These menus are also accessible by clicking the right mouse button between the data container and the classification area. The menu items are described in detail later and are listed here as follows: File o Create ViewGraph – provides a method to create a viewgraph of the different graphical windows. This capability is meant to provide a starting point for items going into publications. o Exit – exits out of the DAM and enters back into the DMM. New Window o Region – Opens the regional graph window. Opens by default when entering the DAM. o TvD – Opens the Temperature verses Depth graph window. o SvD – Opens the Salinity verses Depth graph window. o SSDvD – Opens the Sound Speed verses Depth graph window. o CvD – Opens the Conductivity verses Depth graph window. o DvD – Opens the Density verses Depth graph window. o TvS – Opens the Temperature verses Salinity graph window. Data o Read Data – Reads Data into memory. o Export – Exports data to a file. All Data – Exports all data in memory. Polygon Data – Exports only the data that has been polygoned. o Status – Provides a status window on data in memory. Options o Change Units – Allows the units to be changed for the depth and temperature values. o Bring to Front – Changes the reaction of windows to the position of the mouse. o Where’s the Tools – Location of the Tools window. o RePaint All – Refreshes all of the windows. o Save Profile – Saves the user’s profile. Save Entire Profile – Saves without user interaction. Save Partial Profile – Saves with user specifying the items to save. Reset – Resets the user’s profile. 12 NIDAS User’s Manual March 2007 4.1.1.1 Create ViewGraph The user can take the graphical windows that are open and put together a viewgraph for use outside of NIDAS. This capability is only meant to provide a starting point and expects the viewgraph to be finished in a professional imaging package. The viewgraph window allows the user to add or remove any of the graphical windows that were opened before entering the viewgraph tool. The view area allows those images to be moved around by dragging them with the mouse. Text can be added and placed on the view area. When clicking on an object, whether an image or text, a thin box is shown around the object identifying it has been selected. When adding text to the view area, the user can set the font, the initial position of the text, the font size, the style, and color. Once applied, the text is added to the view area, and can be moved by dragging it with the mouse. The text can be edited by doubleclicking the text. The size of the page can be changed, however the largest size is 792 pixels by 612 pixels. The page can have either a portrait or a landscape orientation. This size equals to a 8.5” by 11” page. The canvas color can also be changed. The viewgraph can be saved as an image or sent to the printer. The image formats available are GIF, JPEG, PNG, or TIF. It is suggested that if the user desires the viewgraph to be printed, it should be saved and printed outside of NIDAS. The Java print function tends to take a lot of time to send to the printer. 4.1.1.2 Read Data The “Read Data” dialog, shown in Figure 7, allows the user to read data that has been ingested in the data management system and makes it available for displaying and analyzing. The dialog allows the user to select the type of data and which dataset is to be read. The data types available are LLT and Bathy while the available datasets are dependent upon what the user previously setup before entering the DAM. Once the data type and dataset has been selected, the user then chooses which data version to read from the “Versions” list. For the convenience of the user, the ETOPO5 bathymetry global dataset has been provided with NIDAS and is available for use. 13 NIDAS User’s Manual March 2007 Figure 7. Read Data Dialog NIDAS provides the ability to filter the LLT data based on 18 parameters. The data that is filtered is not read into memory. The parameters are as follows: Latitude/Longitude – The default settings for the latitude and longitude are set to the region of the project area. Changing this parameter allows the user to restrict the data being read to a certain area within the project area. Time – The default setting for the time range is from January 1, 1800 at 0 hours to the current date and hour. Setting this parameter allows the user to restrict the reading to a specific time range. For example, if a historical dataset contains data from years 1995 to 2000, the user can request only the data from 1997. The user can set this range by using the “Time” section on the dialog. This will allow the setting of the minimum and maximum month, day, year, and hour. Appling the time settings will move those settings to the Time parameter. Month – The default for the month range is all twelve months. Setting this parameter allows the user to read only a specific month range from the dataset. From the example for Time, the user may only want the summer months in the year 1997. Tau – The default range for tau is 0. Setting this parameter allows the user to restrict the data being read to a specific tau. This parameter is only applicable when reading model data. Classification – The default for the classification is the minimum to the maximum classification. Setting this parameter allows the user to restrict the reading to just a specific class of data. 14 NIDAS User’s Manual March 2007 Parameters – The default for the parameters is to read only that data that has Temperature only or that has Temperature and Salinity. Changing this setting will allow the user to read that data with only Salinity or with Sound Speed. Warning: The default setting for this parameter may filter out some data. Cruise ID – The default for cruise ID is set to a minimum to maximum value. Setting this value will allow the user to filter data based on a specific MOODS cruise ID. Instrument – The default for instrument is set to a minimum to maximum value. Setting this value will allow the user to filter data based on a specific instrument. Source Code – The default for source code is set to a minimum to maximum value. Setting this value will allow the user to filter data based on a specific source code. Water Depth - The default for water depth is set to a minimum to maximum value. Setting this value will allow the user to filter data based on a specific water depth. First Depth - The default for first depth is set to a minimum to maximum value. Setting this value will allow the user to filter data based on its first depth value. Last Depth - The default for last depth is set to a minimum to maximum value. Setting this value will allow the user to filter data based on its last depth value. Originators Station Name - The default for the originator’s station name is blank. Setting this value will allow the user to filter data based on the originator’s station name. Cast Number - The default for cast number is set to a minimum to maximum value. Setting this value will allow the user to filter data based on a specific cast number. Cruise Number - The default for the cruise number is blank. Setting this value will allow the user to filter data based on a specific NAVOCEANO cruise number. Security Key - The default for the security key is set to a minimum to maximum value. Setting this value will allow the user to filter data based on a specific key. Quality Review Code - The default for the quality review code is set to a minimum to maximum value. Setting this value will allow the user to filter data based on a specific code. After setting the parameters and selecting the version to read, click the “Read” button to read the data into memory. A toggle button for controlling that data will appear in the data container on the Analysis Control Window with the name of the version. The user can select another data version to read or close the read dialog. 15 NIDAS User’s Manual March 2007 4.1.1.3 Export Data The “Export” dialog, shown in Figure 8, provides a way for the user to export LLT data and can be invoked from one of three methods. The first method is by exporting all the data of the displayed versions. The second is by exporting data that has been polygoned, and the third is by exporting data that has been isolated. The third method is only available from the profile isolation tool. In all three methods, the export dialog functions in the same manner. Figure 8. Export Data Dialog The export dialog contains a section displaying the data versions available for exporting and a section for choosing the format to export. The data versions shown represent the entire version, those that have been polygoned from that version, or those that have been isolated from that version, depending on how the user invoked the export dialog. If the user is exporting polygoned data, there will be an additional version listed with the name “Polygon”. This version will represent the vertices of the polygon itself. Along with each version, the user can provide a header statement and can choose the location of the saved file. A browse ability is available for choosing the location of the saved file and defaults to the user’s export directory provided by NIDAS. This export directory is located in the user’s workspace provided by NIDAS (refer to Section 2.2.4). The user also has the capability to export based on flags for each profile. There are two different sets of flags that can be shown depending on the format of the data. One set is used for data in the M2K format and another set based on the Master flags. The Master flags are ten temperature flags and ten salinity flags. The temperature flags are AND’ed together with the salinity flags. The M2K format has several flags for temperature, salinity, and sound speed, and several miscellaneous flags. The behavior can be set to either AND each section together or to OR them together. An option is also provided for the user to quickly select all flags. The flags for each data version are preset to export what is normally considered an acceptable profile. If the number of profiles exported is not what is expected, check the export flags. Refer to Appendix G for more information on flags. Each data version listed in the export dialog has an “Export On/Off” button, allowing the user to select the versions to export. The export is turned off by default. 16 NIDAS User’s Manual March 2007 The format section allows the user to select the export format. Each format is discussed in detail in Appendix E. The formats available for exporting is the Master format, the MoodsAdmin format, Moods2K, CASTAR, and a simple Text format. Each format contains more information than what NIDAS uses and is not always convertible to other formats. Table 1 shows the compatibility between formats. When all of the export options have been set, the user can start the exporting by clicking “Export”. A status window will appear showing how many profiles were exported. Master MoodsAdmin Moods2K Master X X MoodsAdmin Moods2K X X CASTAR X X Text X X X Table 1. Format Compatibility 4.1.1.4 Data Status The “Data Status” dialog, as seen in Figure 9, provides the user with metadata about each data version in memory. The format for each version is shown along with the version’s name. Then the total number of profiles stored for that version in the database is shown. The number of profiles read from the database and the number being displayed is also shown. The number that was read may Figure 9. Data Status Dialog be different from the total number in that version depending upon the filter parameters when read. The number being displayed may be different from that which was read depending upon the display flags and the time frames from the version’s display options (refer to Section 3.3.1.1). The user should click the “Update” button to make sure the information being provided are the current numbers. 4.1.1.5 Change Units The “Change Measurement Units” dialog provides the ability for the user to change the units in which the depth values and the temperature values are shown. The choices for depth are meters (default), feet, and fathoms. The choices for temperature are Centigrade (default) and Fahrenheit. 4.1.1.6 Bring to Front The “Bring to Front” menu item changes the behavior of the graphical windows in response to the mouse. By default, when the mouse moves into one of the graphical windows, the user must click on the window in order to bring that window to foreground. By selecting the “Bring to Front” menu item, the graphical window will be brought to the 17 NIDAS User’s Manual March 2007 foreground when the mouse moves over that window, thus removing the need to click the window. 4.1.1.7 Where’s the Tools The “Where’s the Tools” menu item provides a method to bring the Tools window to the foreground. While the user is analyzing and manipulating data, the Tools window may get lost behind other windows. With this option, the user can find the tools without having to move windows out of the way. 4.1.1.8 Repaint All The “Repaint All” menu item provides a method to refresh all of the graphical windows. The repaint removes polygon lines and highlighted profiles and leaves the graphical windows with a normal view of the data being displayed. 4.1.1.9 Save User Profile Figure 10. Save User Profile Dialog The user’s profile can be saved either in its entirety or partially. Saving the user’s profile entirely requires no interaction from the user and a message is shown that the profile was saved. Saving the profile partially requires the user to select which items are to be saved. The dialog (Figure 10) contains five tabs organizing the items in the profile. The five tabs are window settings, data settings, polygon settings, synthetic settings, and print settings. In addition, the window settings are further divided into the seven different graphical windows. By default, all of the items in the profile that have been changed are selected to be saved. The changed items are shown with the saved value and the unsaved value. Refer to Appendix F for more information on the items in the user’s profile. 4.1.2 Mouse Position The mouse tracking section of the Analysis Control Window, shown in Figure 6, provides the position of the mouse within all of the graphical windows. When the mouse is in the Region window, the latitude and longitude position is reported. The other windows similarly report the position of the mouse labeled with the appropriate parameters. When no position is reported, the mouse is not within one of the graphical windows. 18 NIDAS User’s Manual March 2007 4.1.3 Classification Status The classification status section of the Analysis Control Window provides the highest classification statement for all the data that is currently in memory within NIDAS. If multiple versions are in memory with different classification levels, only the highest is shown. 4.1.4 Data Container The data container section of the Analysis Control Window (Figure 6) provides a holding area for all of the data that is in memory. The container will provide scroll bars if needed. Versions can be turned on or off as needed. Each version within the container is an object and has menu items available by clicking the right mouse button on the version. By default, the first version in the container is the coastline being used within the Region window. Every version listed in the data container, with exception of the coastline, can be renamed or deleted from memory. Each item in the container has associated data options. The LLT data items have a “Save Flags” item. The flags for each LLT data version can be saved back to the database for later use. 4.1.4.1 Coastline Data Options Data options for the coastline data can be changed by right clicking the “Coast” data item in the Analysis Control Window data container. The user can change the resolution of the coastline and the color. The choices for the resolution are 20 km, 8 km, 3 km, 1 km, 600 m, and 400 m. 4.1.4.2 LLT Data Options Data options for LLT data can be changed by right clicking the data item in the Analysis Control Window data container. There are several sections on the Data Options Dialog (Figure 11) with settings for the user to change. The “Time Frames” section allows the user to change the settings for the three time range subsets that are available (refer to Section 3.3.1.1 for a description of the three time subsets). The default values for the time frames are set to the values specified for the dataset when it was created within the DMM Figure 11. LLT Data Options Dialog (refer to Section 3.3.1). The center date was found for the version and is shown. The center can be shifted from its original value and a Julian calculator is provided for the user. The number of days, along with data color and polygon color can be changed for all three time subsets. 19 NIDAS User’s Manual March 2007 The line size and point size for the displaying of the data, the polygoned data, and the isolated data can be changed. The default values for these sizes are stored in the user’s profile. The line size is used in the profile windows while the point size is used in the Region window. The color for isolated profiles can be changed along with the “Show” options. These items default to the settings provided when the dataset was created. The “Show” options include the “Location”, “Profile”, and “Depth” toggle buttons. The location button determines if the data will be shown in the Region window. The profile button determines if the data will be shown in the profile windows, and the depth button determines if a vertex will be drawn at each depth point on the profile. The “Compress Spikes” option provides the ability to compress spike depths from data so they do not appear. Spikes are depths that have missing temperature or salinity data. Missing values are specified as being -99, and if drawn would show the profile spiking out from the rest of the depths. The flagging option provides a method for the user to display only profiles with specific flags. By default, flags are set to those that are considered acceptable profiles. For the Master and MoodsAdmin format, there are ten flags for temperature and ten for salinity. For displaying data, these flags are OR’ed together. For the M2K data, the user can select the behavior. There is also an option to quickly select or deselect all flags. There is a major difference in the way profiles are display by flags between the Master/MoodsAdmin format and the M2K format. The Master/MoodsAdmin format splits the temperature and salinity profiles so they are displayed independently. Therefore, the temperature profile could be shown without the corresponding salinity profile, and vice versa. The M2K format shows the corresponding temperature and salinity no matter which one was selected by the display flags. Flags are discussed in Appendix G. 4.1.4.3 Bathymetry Data Options Data options for Bathymetry data can be changed by right clicking the data item in the Analysis Control Window data container. The user can modify the minimum, maximum, and interval values (refer to Section 3.3.1.2 and Figure 12). The isolines that are produced from the bathy data can be labeled with the depth. The user can toggle this label on and off and Figure 12. Bathymetry Data Options Dialog change its color and size. The color of the isolines can be changed along with the line width. 20 NIDAS User’s Manual March 2007 4.1.5 Keyboard Shortcuts The Analysis Control Window provides a few keyboard shortcuts for ease of use. These shortcuts are also available from the graphical windows. The shortcuts are as follows: Ctrl-G F1 F2 F3 F4 F5 F6 F7 Ctrl-R F8 F9 - Create Viewgraph Open the Region Window Open the Temperature Window Open the Salinity Window Open the Sound Speed Window Open the Conductivity Window Open the Density Window Open the Temperature vs. Salinity Window Read Data Where’s the Tools Repaint All 4.2 Tools Window The Tools Window, shown in Figure 13, currently has four tools for the analyzing of data. These tools include the zoom tool, the polygon tool, the profile isolation tool, and the synthetic profile tool. The current tool selected is indicated at the bottom of the window. Where applicable, the tool is turned on by clicking the tool button once and turned off by a second click. A tool may also be turned off when another tool is turned on. Where applicable, these tools may have configuration options that may be seen by right clicking over its button. Figure 13. DAM Tools Dialog 4.2.1 Zoom The zoom tool allows the user to zoom into a specific region on the Region window. The user can also zoom into the graphical windows in order to narrow the view to a certain section of the graph. The user zooms by dragging the mouse across the graphical window to the desired location. When zooming from the Region window, the profile windows only display the profiles located within the new zoomed area. The user can return to the original area by right clicking in the graphical window and selecting “Default SZ”. 21 NIDAS User’s Manual March 2007 4.2.2 Polygon The polygon tool allows the user to draw a polygon around certain data. The process of drawing a polygon includes two steps: drawing the vertices and then closing the polygon. The user must first create the polygon’s vertices by clicking the left mouse button at the desired locations. When the vertices have been placed, the user closes the polygon by clicking the middle mouse button. The polygon is then drawn and data within that polygon are highlighted (Figure 14). A normal polygon requires at least three vertices. However, the profile windows will allow a special “polygon” with only two vertices. This will grab the data that intersects the polygon. The data that is polygoned is highlighted with the characteristics that are defined in the data’s display options. Figure 14. Polygoned Data By right clicking the polygon tool button, the user can invoke the polygon’s options dialog (Figure 15). The vertex color and style can be selected as well as the edge color, that is, the color of the connecting line between the vertices. The vertex size and edge size can be changed. The polygon tool has an additional behavior that can be turned on called “Multiple Polygons”. This behavior allows the user to quickly compare different areas of the region by displaying each set of data in a different color. The different colors are set within the polygon option dialog. When the polygon tool is turned off, the polygon tool is reset to the original behavior. 22 Figure 15. Polygon Options Dialog NIDAS User’s Manual March 2007 4.2.3 Profile Isolation The profile isolation tool must have polygoned data before it can be invoked. The isolation tool opens a “Polygon Subset” dialog (Figure 16) with a list of the profiles within the polygon. This list shows certain information about each profile such as the Figure 16. Polygoned Profiles and the Polygon Subset Dialog profile date, cruise number, ID, latitude, longitude, instrument number, source number, number of depths, and the value of the last depth. The user can select one or more profiles and they are highlighted on the profile windows. The user can select multiple profiles by selecting the profile with the mouse while the shift or the control button is pressed. The characteristics of the isolated profiles are defined in the data’s display options. If there are multiple data versions being displayed, the user can choose the active data version. There is an option for the user to select all of the profiles in the list. There are several operations that can be performed on the isolated profiles. The user can look at the raw data for a single profile. If multiple profiles are selected, then the first profile’s information is displayed. The selected profiles can be exported to an external file. Refer to Section 4.1.1.3 for exporting data. The user can choose to delete profiles which are only deleted out of memory. When the data version is read from the database again, these profiles will still be present. If the data version is in the Master or MoodsAdmin format, a profile can be edited. Only one profile can be edited at a time. Therefore, when multiple profiles are selected, the first profile is used. The “Edit Profile” opens with two additional graph views, shown in Figure 17, displaying the temperature and salinity profiles for that record. The dialog also has a list showing the depths with the corresponding temperature, salinity, sound speed, conductivity, and density. The user can select a depth from the list and that depth is shown on the graphs. The segment from the shallower depth to the depth selected is highlighted in red and the segment from the depth selected to the next depth is highlighted in blue. The user has the ability to add a new depth providing the depth value, the temperature value, and the salinity value. That depth is then added into the profile. The user can edit an existing depth, providing a new depth, temperature, or salinity value. The user can remove a specific depth from the profile. Changes that are made must be exported. Changes are not saved to the database. 23 NIDAS User’s Manual March 2007 Figure 17. Profile Editing Dialog The user also has the option of flagging profiles by selecting one or more profiles and using the “Flags” button. Flagging is a way for the user to specify which profiles are good, bad, or somewhere in between. With the Master and MoodsAdmin data, ten flags are provided for temperature and ten for salinity. Since a record can just have salinity and no temperature, or temperature and no salinity, there are notifications that tell the user if some of the profiles that have been selected have no temperature or salinity. The current flags for the profile are shown in blue. For the M2K data, there are flags for the temperature, salinity, and sound speed parameters as well as some miscellaneous flags. The current flags are shown to be selected by default. Flags can be saved by one of two ways. The user can use the “Save Flags” menu discussed in Section 4.1.4. The user can also export the data version with the current flags and have them saved to an external file. Exporting is discussed in more detail in Section 4.1.1.3. The available flags are discussed in Appendix G. 4.2.4 Synthetic Profiles The synthetic profile tool provides a way for the user to create some synthetic profiles to be representative of the data version being displayed. The different types of profiles that the user can create are an average, a minimum, a maximum, and six alternatives, as shown in Figure 18. The user can create a “province” which is similar to a polygon representing the area of interest for the synthetic profiles. The “Province” button must be selected as the user uses the left mouse button to place the vertices on the region window and Figure 18. Synthetic Profiles Dialog the middle button to close the province. If the province looks good, then it can be saved, or the user can cancel and try again. Once the province has been saved, a new province can be drawn if needed. 24 NIDAS User’s Manual March 2007 Profiles representing the minimum and maximum data can be drawn for temperature, salinity, sound speed, and density. Although the user can draw a profile for conductivity, conductivity synthetics are ignored and are not exported. The minimum and maximum profiles are independent records for each parameter. For example, there will be a record showing depth and value for temperature, a different record showing depth and value for salinity, and different records for the rest of the parameters. The user selects the minimum or maximum button and uses the left mouse button to place the vertices and the middle button to save the profile. Profiles representing the average profile and six alternate profiles can be drawn. However, these synthetics work differently across the parameters compared to the minimum and maximum profiles. The average or alternate profiles can be created for temperature and/or salinity, or the profiles can be created for either sound speed or density. Again, conductivity is ignored and not exported. If an average profile is drawn for sound speed or density, then a temperature or salinity profile can not be drawn without clearing the average profile. The same applies to the alternates. If an average is Figure 19. Synthetic Average for Temperature and Salinity drawn for temperature or salinity, then a sound speed or density profile can not be drawn without clearing the average profile. The same also applies to the alternates. The user draws the profile with the left mouse button and saves it with the middle button. When an average (or alternate) profile has been drawn for temperature, and the user selects average (or alternate) again for salinity, depth lines are placed on the salinity window, shown in Figure 19, to guide the user to match the placement of the vertices to that of the temperature. Vertices for the salinity are “snapped” to the same depth level as that of the temperature. The same applies when the salinity is drawn first and then the temperature. When the average (or alternate) has been drawn, the profiles for sound speed and density are drawn from calculated values. The temperature and salinity profiles for average (or alternate) are paired together in the same record with the calculated sound speed and density values. 25 NIDAS User’s Manual March 2007 Options are available for the province and the different synthetic profiles. The synthetic profile options dialog provides options for the user to specify what the first depth and last depth will be. The first depth can be forced to be 0, which will take the first vertex for the profile and automatically place it at the 0 depth. The last depth can be set to user specified value, which will add a vertex at that depth when the profile is ended with the middle mouse button. The depth markers can be toggled on and off from the display windows. With the depth on, a point will be placed at each vertex in the profile. Colors, line widths, and line styles for each item can be set. The synthetic dialog has a Overlay tool which simply repaints the synthetic profile back on the graphical windows. Synthetic profiles can be exported to a file and can be imported back into NIDAS. To export the synthetic profiles, the user provides some header information for the synthetics. The date and hour are prefilled will current information unless synthetics were imported into the system. In that case, the header information is prefilled with the imported information. The user has the option to save these synthetic profiles in the user’s synthetic database in addition to the exporting. Once the profiles have been exported, they are cleared from memory. Synthetic profiles can be cleared from memory by selecting the appropriate toggle button and pressing reset. For example, if the user wishes to clear the average profiles, then the average toggle button would be selected when clicking reset. The average profiles for all parameters would be reset. All synthetic profiles are cleared when the user closes the synthetic profile dialog. 4.3 Graphical Windows The graphical windows provide a place where data is drawn and analyzed. These windows include the region window, the temperature window, the salinity window, the sound speed window, the conductivity window, the density window, and the temperature vs. salinity window. The region window provides a top-down view of the region specified in the project area, while the rest shows a 2-D graph of the profile data. Each window can be resized, moved, minimized, or closed. However when resized, the region window will snap to the closest size to have the proper map projection. All of the graph windows are treated alike and have the same characteristics. 4.3.1 Region Window The region window, shown in Figure 20, provides a top-down view of the region specified in the project area and of the data read into memory. The window is shown with a grid of latitude and longitude with a Mercator projection. Data is shown as a point at the location of each profile. Figure 20. Region Window 26 NIDAS User’s Manual March 2007 A pop-up menu can be seen when right-clicking the mouse. There are options for the user to add a river dataset to the map as well as political boundaries. The user can redraw the window which is similar to a repaint (refer to Section 4.1.1.8). However, a redraw will keep polygons and highlighted data shown on the map while a repaint clears them. The “Default SZ” option resets the window to the original area and undoes all zooms (refer to Section 4.2.1). The “Win Options” opens the region window options dialog. The window option dialog is divided into three tabs. The Grid/Graph tab allows the user to set the latitude and longitude tick and step marks. The tick specifies the interval at which a grid line is to be placed. For example, a setting of 2.0 specifies a grid line to be place at every two degrees. The step specifies the interval at which a label is placed by the grid line. A setting of 2 would place a label at every two grid lines. The grid color and the window background color can also be set. The Axes Label tab allows the user to set the x-axis and the y-axis label, label color, font and font size for the window. The Tick Mark tab allows the color, font, and font size for the tick mark labels to be set. The region window can also be saved as an image. The saved image will be representative of what is currently shown in the window. The save dialog allows the user to save an image as a JPEG, GIF, PNG, or a TIFF. 4.3.2 Graph (Profile) Windows The graph windows, shown in Figure 21, display a 2-D graph of the profile data either for temperature, salinity, sound speed, conductivity, or density verses depth. Another graph window is also available to plot temperature verses salinity. A pop-up menu can be seen when right-clicking the mouse. The user can redraw the window which is similar to a repaint (refer to Section 4.1.1.8). However, a redraw will keep polygons and highlighted data shown on the graph while a repaint clears them. The “Default SZ” option resets the window to the original area and undoes all zooms (refer to Section 4.2.1). The “Win Options” opens the profile window options dialog. The window option dialog is divided into three tabs. The Grid/Graph tab allows the user to set the minimum and maximum values as well as the tick and step values for the x-axis and the y-axis. The tick specifies the interval at which a tick mark is to be placed. For example, a setting of 10.0 specifies a tick mark to be place at every ten meters, or ten degrees. The step specifies the interval at which a label is placed by the tick mark. A setting of 2 would place a label at every two tick marks. The user has the option to split the y-axis into two different views. The user specifies at what depth value to split at. That depth is then stretched and placed in the middle of the graph. The top portion of the graph follows the tick and step settings mentioned above. The bottom portion of the graph is identified as the second view. The user can then specify the tick and step settings for the second view. This function allows part of the profile data to be viewed with greater detail. The user 27 NIDAS User’s Manual March 2007 can also distribute these settings across all of the graph windows by cascading the y-axis values. The axis color and the window background color can also be set. The option to allow the user to set the window size (sizes are in pixels) is provided. The Axes Label tab allows the user to set the x-axis and the y-axis label, the unit labels, label color, font and font size for the window. The Tick Mark tab allows the color, font, and font size for the tick mark labels to be set. The graph windows can also be saved as an image. The saved image will be representative of what is currently shown in the window. The save dialog allows the user to save an image as a JPEG, GIF, PNG, or a TIFF. Figure 21. Profile Windows 28 NIDAS User’s Manual March 2007 APPENDIX A Glossary bathymetry/bathy – Measurement of ocean depths. DMM - Data Management Module. NIDAS module that performs data management functions such as creating, deleting, and editing project areas, datasets, and data versions. DRM - Data Analysis Module. NIDAS module responsible for the manipulation and analysis of data within NIDAS. Graphical User Interface (GUI) - NIDAS module responsible for interfacing with the user and controlling the functionality of the NIDAS displays. Julian - The day of the year according to the Julian calendar with January 1 being day 1 and December 31 being day 365 (adjustments are made for leap year). A Julian date does not include a year as part of its simple format. lat - Latitude. LLT - Latitude Longitude and Time. LLT is used to classify data that is identified by the position it was taken (latitude and longitude) and by the time stamp at which it was taken. lon - Longitude. metadata - Information about a dataset, either descriptive or definitive as to quantity, quality, quantity or format. MOODS - Master Oceanographic Observation Data Set. NAVOCEANO - Naval Oceanographic Office. NIDAS - Naval Interactive Data Analysis System. rubberband - The act of dragging the mouse to define an area on the screen. A mouse button is pressed and held while the mouse is maneuvered to a second position on the screen and released. The result creates a box. sal – Salinity referring to the saltiness of the water. sound speed/sndspeed – The characteristic of the water referring to the speed at which sound travels from point A to point B. A-1 NIDAS User’s Manual March 2007 APPENDIX B Installation Procedures Java Runtime Environment (JRE) The JRE is no longer available with the NIDAS installation. The required version of the JRE can be downloaded and installed from http://java.sun.com/javase/downloads/index.jsp. The installation of the JRE will require administrative privileges. NIDAS Installation Windows Platform NIDAS was originally developed for the Windows NT platform. The platform focus has shifted from NT to Win 2K and finally to Win XP. NIDAS continues to be compatible with Win NT and Win 2K. Starting the CD The CD should start when inserted into the CDROM. If not, then it can be started by the following: 1. StartMenu--Programs--Command Prompt 2. E: <enter> - Where E is the drive letter of your CDROM 3. Java\x\bin\javaw.exe -Xmx100m -jar autoInst.jar - Where ‘x’ is the java version required for this NIDAS release. (ex. j2re1.4.2_05) 4. The CD should start. 5. Follow instructions from the installer. Installing vs. Upgrading The NIDAS CD provides the ability to install NIDAS or to upgrade a previous version. When the CD starts, the option to install or to upgrade will be available. Refer to the Upgrading section below. Manual Installation NIDAS can be installed manually by following these steps: <dest> = Destination directory 1. Copy the contents of the NidasV<version #> folder into <dest> B-1 NIDAS User’s Manual March 2007 2. Create a text file in <dest> with the name ‘nidas.properties’ with the following content (Note the <dest> and make changes where needed): # # Properties for Nidas # # # The Directory properties depend on the platform # Examples: # Windows = NIDAS.SW: D:\\Nidas # Windows = NIDAS.DB: D:\\Nidas\\nidas_db # UNIX = NIDAS.SW: /data/NIDAS_SW # UNIX = NIDAS.DB: /data/NIDAS_SW/nidas_db NIDAS.SW: <dest> NIDAS.DB: <dest>\\nidas_db # The Sound Directory is to be specified as a url # Examples: # SOUNDS.URL: /D:/Nidas/sounds/ SOUNDS.URL: /<dest>/sounds/ #Possible Coastlines are: # 20 = wvs_20km_cst.dat.j # 8 = wvs_8km_cst.dat.j # 3 = wvs_3km_cst.dat.j # 1 = wvs_1km_cst.dat.j # 600 = wdb_600m_cst.dat.j # 400 = wvs_400m_cst.dat.j NIDAS.DCoastline: 8 # DataSet Defaults # Defaults for creating new datasets for # Bathy and LLT # DATADIR is used for the default dir for # selecting a datafile to ingest from the # version dialog. # NT = DS.DATADIR: D:\\Nidas # UNIX = DS.DATADIR: /data/NIDAS_SW DS.DATADIR: D:\\Package Nidas\\test DS.CLASS: 1 # LLT Section DS.PLUSMIN: 16 B-2 NIDAS User’s Manual March 2007 DS.PLUS: 0 DS.MINUS: 0 # Boolean values must be 'TRUE' or 'FALSE'. DS.ISLOC: TRUE DS.ISPROF: TRUE DS.ISDPTH: FALSE # Colors are in RGB form (R,G,B) # Example: 255,0,0 is red DS.PMCOL1: 0,255,0 DS.PMCOL2: 0,255,0 DS.PMCOL3: 0,255,0 DS.POLYCOL1: 255,0,0 DS.POLYCOL2: 255,0,0 DS.POLYCOL3: 255,0,0 DS.ISOCOL: 0,0,255 # Bathy Section DS.BATMIN: 0 DS.BATMAX: 100 DS.BATINT: 10 DS.BATCOL: 255,0,0 3. Create shortcuts for Desktop and start-menu where desired: - Name = Nidas - Target = C:\WINNT\System32\javaw.exe -Xmx100m -jar "<dest>\bin\n.jar" - Start in = "<dest>" - Icon = <dest>\images\nidas.ico (Tools) - Name = BinMaster - Target = C:\WINNT\System32\javaw.exe -jar "<dest>\bin\binmaster.jar" - Start in = "<dest>" - Name = FileFacs - Target = C:\WINNT\System32\javaw.exe -jar "<dest>\bin\filefacs.jar" - Start in = "<dest>" Upgrading 1. 2. 3. 4. Download the self extracting executable from www.gri.msstate.edu/research/nidas. Execute the self extracting executable. Unzip to a temp folder. Press the "Unzip" button. B-3 NIDAS User’s Manual March 2007 5. After the files have unziped, "close". 6. Execute UpGrade.jar. If by "double clicking" it does not start, open a command window to that directory and execute by typing "javaw -jar UpGrade.jar". 7. Follow instructions. Creating Shortcuts: ------------------Create shortcuts for Desktop and startmenu where desired: - Name = Nidas - Target = C:\WINNT\System32\javaw.exe -Xmx100m -jar "<dest>\bin\n.jar" - Start in = "<dest>" - Icon = <dest>\images\nidas.ico (Tools) - Name = BinMaster - Target = C:\WINNT\System32\javaw.exe -jar "<dest>\bin\binmaster.jar" - Start in = "<dest>" - Name = FileFacs - Target = C:\WINNT\System32\javaw.exe -jar "<dest>\bin\filefacs.jar" - Start in = "<dest>" B-4 NIDAS User’s Manual March 2007 APPENDIX C NIDAS Properties File The properties file for NIDAS is located in the software directory and is called ‘nidas.properties’. The properties file contains settings that allow NIDAS to run properly as well as some defaults primarily for the DMM. NIDAS.SW – This variable identifies the location of the NIDAS software. An example is provided within the properties file. NIDAS.DB – This variable identifies the location of the NIDAS database. This will normally be within the software directory. SOUNDS.URL – This variable identifies the location of the sound directory. NIDAS provides sounds for error and warning messages. Again, this would normally be within the software directory. NIDAS.DCoastline – This variable sets the default resolution for the coastlines. Possible values are provided in the properties file. DS.DATADIR – This variable sets the default location for the DMM to look for data to ingest. DS.CLASS – This variable sets the default classification value for datasets (refer to Section 3.3.1.1). DS.PLUSMIN – This variable sets the default ‘+/-‘ value for the LLT data type (refer to Section 3.3.1.1). DS.PLUS – This variable sets the default ‘+’ value for the LLT data type (refer to Section 3.3.1.1). DS.MINUS – This variable sets the default ‘-‘ value for the LLT data type (refer to Section 3.3.1.1). DS.ISLOC – This variable sets the default “Is Location” value for the LLT data type (refer to Section 3.3.1.1). DS.ISPROF – This variable sets the default “Is Profile” value for the LLT data type (refer to Section 3.3.1.1). DS.ISDPTH – This variable sets the default “Is Depth” value for the LLT data type (refer to Section 3.3.1.1). C-1 NIDAS User’s Manual March 2007 DS.PMCOL1 – This variable sets the default color for the ‘+/-‘ range for the LLT data type (refer to Section 3.3.1.1). DS.PMCOL2 – This variable sets the default color for the ‘-‘ range for the LLT data type (refer to Section 3.3.1.1). DS.PMCOL3 – This variable sets the default color for the ‘+‘ range for the LLT data type (refer to Section 3.3.1.1). DS.POLYCOL1 – This variable sets the default polygon color for the ‘+/-‘ range for the LLT data type (refer to Section 3.3.1.1). DS.POLYCOL2 – This variable sets the default polygon color for the ‘-‘ range for the LLT data type (refer to Section 3.3.1.1). DS.POLYCOL3 – This variable sets the default polygon color for the ‘+‘ range for the LLT data type (refer to Section 3.3.1.1). DS.ISOCOL – This variable sets the default isolate color for the LLT data type (refer to Section 3.3.1.1). DS.BATMIN – This variable sets the default minimum value for the Bathy data type (refer to Section 3.3.1.2). DS.BATMAX – This variable sets the default maximum value for the Bathy data type (refer to Section 3.3.1.2). DS.BATINT – This variable sets the default interval value for the Bathy data type (refer to Section 3.3.1.2). DS.BATCOL – This variable sets the default color value for the Bathy data type (refer to Section 3.3.1.2). C-2 NIDAS User’s Manual March 2007 APPENDIX D NIDAS Icons - Add a Project Area. - Delete a Project Area. - Project Area Information. - Add a Dataset. - Delete a Dataset. - Dataset Information. - Ingest Data into the Database. - Delete Data from the Database. - Inventory Data. - Analysis Tool - Leaves the DMM and Starts the DAM. - Zoom Tool On/Off. - Polygon Tool On/Off. - Profile Isolation Tool On/Off. - Synthetic Profile Tool On/Off. D-1 NIDAS User’s Manual March 2007 APPENDIX E Input/Output Formats NIDAS uses several file formats for input, output, and internal purposes. File formats that are for internal purposes or have already been covered elsewhere in this document are not described here. This includes, but is not limited to, internal database formats, properties file, and image formats such as “gif”, “png”, and “jpeg”. Table 2 shows a summary of the formats. Format Charter (old/new) Master MoodsAdmin Moods2K CASTAR NetCDF Model Generic Text Export Polygon Information Synthetic I/O Specs input both both both output input output output both File Type binary binary text text text binary text text text Abbreviations are used to represent the type of data used within each format (Table 3). The file formats are either in a text format or a binary format. The syntax of the data types differ between text and binary. Binary Data – The syntax is specified by the abbreviation with a possible number following. The number following specifies the Table 2. Format Summary number of data types needed to make the value. For example, ‘I6’ specifies that the parameter consist of six separate integers as in an array. This example would equal 24 bytes. ‘A6’ would be a string consisting of six characters. If the number following is omitted, then a ‘1’ is implied. Datatype Abbreviation Byte Count Text Data - The syntax is specified by the ASCII A 1 abbreviation with a number following. The Float F 4 number may include a decimal point. The Integer I 4 number following indicates the number of Space X 1 characters, digits, or spaces that is found Table 3. Data type abbreviations within a certain value. For example, ‘I5’ indicates that the integer has five digits. ‘X1’ indicates one space. The number following the abbreviation may contain a decimal point with the first number indicating the total number of digits and the second number indicating the number of those digits that are after the decimal. The decimal itself is considered a digit counted in the total number. “F3.1” specifies a single floating point number with a total of three digits, one of which after the decimal point. This example would be representative of the value “1.0”. E-1 NIDAS User’s Manual March 2007 Input Formats Bathymetry Bathymetry data files are input-only binary files in what is called the Charter format. The Charter format has been revised during NIDAS’ lifetime, therefore to be backward compatible, both Charter formats are available. Table 4 shows the old Charter format with a 28 byte file header before the actual data. Table 5 shows the current Charter format with a 40 byte file header plus a padded area before the actual data. LLT There are several different formats that carry LLT data. The Master (or Master B) format is used for both input and output and is a binary file. Table 6 shows the Master format having a file header as well as a profile header. The actual profile data follows after the profile header. The profile header and profile data is repeated for every profile in the file. The MOODS format exists in an older format (pre-2000) and a newer format (post-2000). The old format, known as MoodsAdmin, shown in Table 7, is a text file and is used for both input and output. The new format, known as Moods2K (Moods2000 or M2K), shown in Table 8, is also a text file and is used for both input and output. Both formats are repeated for every profile in the file. The CASTAR format is an output-only text format. Shown in Table 9, the CASTAR format has three headers followed by the actual data, all of which are repeated for each profile. NIDAS also provides a simple generic text output-only format mainly for a visual view of the data, whether the data is Master data, MoodsAdmin data, or Moods2K data. This format does not feed into another system and may change without notice. This format for Master data and for MoodsAdmin data is the same and the items in the format are those identified in the Master binary format. Table 10 shows this format for the Master data and the MoodsAdmin data. The generic text format for the Moods2K data is slightly different and the items are those identified in the Moods2K format. Table 11 shows this format for the Moods2K data. Polygon Information When polygoned data is exported, the user has the option to export the polygon itself (refer to Section 4.1.1.3). This format is an output-only text file and is shown in Table 12. Synthetic Profiles NIDAS exports synthetic profiles that the user creates (refer to Section 4.2.4). This export file, shown in Table 13, is a text file and is for output and input, as the user can E-2 NIDAS User’s Manual March 2007 import the synthetic profiles through the synthetic dialog. The user can create only a province area, only profiles, or both. If the user exports only a province area, then the resulting file will only consist of five lines that are identified in Table 13 as the fourth, fifth, sixth, seventh, and eighth lines. If profiles are created, then the entire format is repeated for every profile. NetCDF Models NIDAS allows the ingestion of NAVO NetCDF Model data that include temperature and salinity values. This format is in a NetCDF binary format, and the intricate details of the NetCDF format is outside the discussion of this document. Table 4. Bathymetry Old Charter Format - Binary Byte Offset 0 4 8 12 16 20 24 28 Parameter Format Domain The west-most longitude of the grid. (decimal degrees) The east-most longitude of the grid. (decimal degrees) The south most latitude of the grid. (decimal degrees) The north most latitude of the grid. (decimal degrees) The size of a grid cell. (decimal minutes) Number of grid cells in the longitudinal direction. This is the number of columns. Number of grid cells in the latitudinal direction. This is the number of rows. Actual data (columns*rows in row major order) F -180.0 to 180.0 F -180.0 to 180.0 F -90.0 to 90.0 F -90.0 to 90.0 F I I Fn Table 5. Bathymetry New Charter Format - Binary Byte Offset 0 4 8 12 16 Parameter Format Domain The west-most longitude of the grid. (decimal degrees) The east-most longitude of the grid. (decimal degrees) The south-most latitude of the grid. (decimal degrees) The north-most latitude of the grid. (decimal degrees) The size of a grid cell. (decimal minutes) F -180.0 to 180.0 F -180.0 to 180.0 F -90.0 to 90.0 F -90.0 to 90.0 E-3 F NIDAS User’s Manual 20 March 2007 Number of grid cells in the longitudinal direction. This is the number of columns. Number of grid cells in the latitudinal direction. This is the number of rows. I 28 The Endian flag used to determine if the bytes of a computer word need to be swapped. I 32 36 40 The minimum depth recorded in the grid. The maximum depth recorded in the grid. The padding space needed to pad the header. F F n bytes where n = (columns 10 ) * 4 Fn -10 to 36000.0 24 40 + n Actual data (columns*rows in row major bytes of order) padding I 0x03020100 byte swapping necessary 0x00010203 byte swapping not necessary Table 6. LLT Master Format - Binary FILE HEADER Parameter File Type Dataset Description PROFILE HEADER Parameter Consecutive Profile Number Flags Format Acceptable Values A B = Both T and S (T for Temp, S for Sal, and V for SndSpeed not used) Default A60 Format Acceptable Values I 1 to total number of profiles I8 Flag[1] I Temperature Edit Flag Array of 8 flags described below. 0 = Not Yet Examined 1 = Good Profile 2 = Coarse Resolution 3 = Inconsistent 4 = Duplicate (Keep) 5 = Duplicate (Reject) 6 = Suspect 7 = Needs Repair E-4 Default 0 NIDAS User’s Manual March 2007 8 = Wrong Location 9 = Bad Profile Flag[2] I Salinity Edit Flag Flag[3] I Gridded Database used to tag Water Depth 2 Flag[4] I Artificial or Converted Profile Flag[5] Number of Extended Depths to Surface Flag[6] Number of Extended Depths to Bottom Flag[7] Temperature Only ( File Type = B) Flag[8] Salinity Only ( File Type = B) Latitude Longitude Province Flag (Groups profiles into Geographical Provinces) Classification Code Pattern Flag (Used in Water Mass Analysis) Water Mass Flag Unique Profile ID Water Depth at Profile Location in Original 0 = Not Yet Examined 1 = Good Profile 2 = Coarse Resolution 3 = Inconsistent 4 = Duplicate (Keep) 5 = Duplicate (Reject) 6 = Suspect 7 = Needs Repair 8 = Wrong Location 9 = Bad Profile 0 = No Bathy 1 = DBDB5 2=… 0 = True Random (MOODS or other) 1 = Gridded to Random 8 = Artificial (General) 9 = Artificial (NIDAS) 0 I I I I F F I I I 1 = No Temperature Values in Profile (All Temperature Values = -99) 1 = No Salinity Values in Profile (All Temperature Values = -99) -90.0 to 90.0 -180.0 to 180.0 -999 A seven-digit number -999 I I F -999 -99 E-5 NIDAS User’s Manual March 2007 MOODS Header Water Depth at Profile Location from Bathymetry Database Year Month Day Hour Unique ID (Not Used) Source/Instrument Code F I I I F A10 I -99 A four-digit number 1 to 12 1 to 31 0 to 24.99 Six digits: First two digits = instrument Last four digits = source Number of Data Cycles (Depths) in Original Profile Number of Cycles added to Profile when Artificially Extended Extra Variable for Future use Cruise Number Profile Record I I A seven-digit number Parameter Depth Temperature Salinity Format F F F Description Profile Record repeated n times (n = Number of Data Cycles + Number of Added Cycles) I Flag[5] + Flag[6] F Table 7. LLT MoodsAdmin Format - Text Header Line First Line Parameter moods_hdr_key latitude longitude observation_dtg Format I9 F8.2 F8.2 I14 moods_cruise_number moods_enclosure moods_classification project number_of_data_cycles number_of_parameters I7 I3 I7 I4 I6 I4 E-6 Comments Decimal Degrees: -90 to + 90 Decimal Degrees: -180 to + 180 Year(4), Month(2), Day(2), Hour(2), Minute(2), Second(2) NIDAS User’s Manual Second Line Third Line Fourth Line March 2007 instrument_type source_type I5 I5 first_data_depth last_data_depth ocean_floor_depth bottom_depth_dbdb5 profile_over_land questionable_dtg_code all_salinities_zeros all_temperatures_zeros salinity_out_of_fixed_range temp_out_of_fixed_range salinity_spike temperature_spike observation_too_deep profile_in_eez profile_edited load_date last_change_dtg downgrade_date downgrade_code nodc_country_code nodc_institute_code nodc_platform_code originators_station_name cruise_number security_key quality_review_code program_version deelt mlsdt pltd deels mlsds plsd deegt mgsdt pgtd deegs mgsds pgsd deert rpsdt prtd I5 I5 I5 I1 I1 I1 I1 I1 I1 I1 I1 I1 I1 I1 I1X1 A8X1 A8X1 A8X1 I1 A2 A2 A2 A12 A12X1 I3X1 I2 F3.1X1 I1X1 F3.1X1 I3X1 I1X1 F3.1X1 I3X1 I1X1 F3.1X1 I3X1 I1X1 F3.1X1 I3X1 I1X1 F3.1X1 I3X1 E-7 NIDAS User’s Manual March 2007 deers rpsds prsd date_of_quality_review date_of_acceptance salinity_inconsistent salinity_repair salinity_wrong_location salinity_course_resolution salinity_quality_code temperature_inconsistent Fifth Line temperature_repair temperature_wrong_location temperature_course_resolution temperature_quality_code profile_duplicate sound_speed_correction nidas_profile_edited Profile Record observation_depth Repeated water_temperature number_of_dat salinity a_cycles times sound speed I1X1 F3.1X1 I3X1 A8 A8X1 I1X1 I1X1 I1X1 I1X1 I1X1 I1X1 I1X1 I1X1 I1X1 I1X1 I1X1 I1X1 I1X1 F8.2 F8.2 F8.2 F8.2 In every record In every record Included if number_of_parameters = 3 or 4 Included if number_of_parameters = 4 Table 8. LLT Moods2K Format - Text Header Line First Line Second Line Parameter moods_hdr_key latitude longitude observation_dtg Format I8X1 F8.4X1 F9.4X1 I14X1 moods_cruise_number moods_enclosure moods_classification project number_of_parameters instrument_type source_type first_data_depth last_data_depth ocean_floor_depth bottom_depth_source I8X1 I3X1 I7X1 I4X1 I1X1 I4X1 I4 I5X1 I5X1 I5X1 I1X1 E-8 Comments Decimal Degrees: -90 to + 90 Decimal Degrees: -180 to + 180 Year(4), Month(2), Day(2), Hour(2), Minute(2), Second(2) NIDAS User’s Manual Third Line Fourth Line March 2007 profile_over_land questionable_dtg_code all_salinities_zeros all_temperatures_zeros salinity_spike temperature_spike observation_too_deep profile_in_eez duplicate_suspect_code load_date header_last_change_dtg profile_last_change_dtg downgrade_date downgrade_code nodc_country_code nodc_institute_code nodc_platform_code whoi_eez_country_code cooperative_country_code originators_station_name cast_number cast_direction_code cruise_number day_of_year security_key quality_review_code profile_in_tw tw_country_code hsl_number ocl_tsprobe_code program_version depth_exceed_env_levitus_temp mod_levitus_std_dev_temp percent_levitus_temp_disagree depth_exceed_env_levitus_sal mod_levitus_std_dev_sal percent_levitus_sal_disagree depth_exceed_env_navoclim_temp navoclim_std_dev_temp percent_navoclim_temp_disagree depth_exceed_env_navoclim_sal navoclim_std_dev_sal percent_navoclim_sal_disagree date_of_quality_review profile_in_cz E-9 I1X1 I1X1 I1X1 I1X1 I1X1 I1X1 I1X1 I1X1 I1X1 A8X1 A8X1 A8X1 A8X1 I1 A2X1 A2X1 A2X1 I4X1 A2X1 A12X1 I5X1 A1X1 A7X1 I3X1 I3X1 I3X1 I1X1 A4 X3 A7X1 I4 F3.1X1 I1X1 F3.1X1 I3X1 I1X1 F3.1X1 I3X1 I1X1 F3.1X1 I3X1 I1X1 F3.1X1 I3X1 A8X1 I1X1 NIDAS User’s Manual Fifth Line Sixth Line March 2007 profile_in_dc eez_country_code cz_country_code dc_country_code header_edit_history_flag profile_edit_history_flag ctd_serial_number_flag nodc_accession_number ocl_station_number wod98_unique_number depth_precision temperature_precion salinity_precision sound_speed_precision lat_precision lon-precision wmo1770_instrument_code wmo4770_recorder_code call_sign temperature_atypical salinity_atypical sound_speed_atypical wrong_location_code mhk_duplicate_id number_of_data_cycles temperature_method salinity_method nodc_station_qc_code ref_sst ref_sst_instrument digitization_method digitization_interval depth_fix_code temperature_noisy high_vertical_gradient temperature_suspect salinity_noisy salinity_suspect density_inversion temperature_coarse_resolution salinity_coarse_resolution temperature_marked_as_salinity salinity_marked_as_temperature node_temperature_code nodc_salintiy_code E-10 I1X1 A4X1 A4X1 A4X1 I1X1 I1X1 I1 I8X1 I8X1 I8X1 I1X1 I1X1 I1X1 I1 I1 I1X1 I3X1 I3X1 A6X1 I3X1 I3X1 I3X1 I1X1 I8X1 I5 I3X1 I3X1 I1X1 F8.4X1 I2X1 I2X1 I2X1 I1X1 I2X1 I2X1 I2X1 I2X1 I2X1 I2X1 I2X1 I2X1 I2X1 I2X1 I2X1 I2X1 NIDAS User’s Manual Profile Record Repeated number_of_d ata_cycles times Extra Line Header Edit Line Header Edits Repeated number_of_h eader_edits times Profile Edit Line Profile Edits Repeated number_of_p rofile_edits times March 2007 temperature_general_quality salinity_general_quality sound_speed_general_quality edit_flag_program_version observation_depth water_temperature I3X1 I3X1 I3 F3.1 F10.4X1 F8.4(X1) salinity F8.4(X1) sound_speed F10.4 pressure_sn temp1_sn temp2_sn cond1_sn cond2_sn sound_speed1_sn sound_speed2_sn hf number_of_header_edits header_attribute_name old_header_attribute_value header_edit_code header_edit_date person_identifier_h pf number_of_profile_edits depth_fo_change parameter_code old_value profile_edit_code profile_edit_date person_identifier_p A16 A16 A16 A16 A16 A16 A16 A3X1 I5 A30X1 A16X1 I3X1 A8X1 I4 A3X1 I5 F10.4X1 I1X1 F10.4X1 I3X1 A8X1 I4 E-11 In every record In every record. X1 needed if number_of_parameters = 3 or 4 Included if number_of_parameters = 3 or 4. X1 needed if number_of_parameters = 4 Included if number_of_parameters = 4 This extra line exists if the ctd_serial_number_flag = 1 This extra line exists if the header_edit_history_flag = 1 These records exists if the header_edit_history_flag = 1 This extra line exists if the profile_edit_history_flag = 1 These records exists if the profile_edit_history_flag = 1 NIDAS User’s Manual March 2007 Table 9. LLT CASTAR Format - Text Parameter Record 1 latitude longitude year month day hour parm_type Record 2 iClass iClim igreg Record 3 depth_cnt Profile Record depth temperature salinity sound speed Format Comments F6.3X1 F7.3X1 I4X1 I2X1 I2X1 F5.2X1 I1 -90.0 to 90.0 -180.0 to 180.0 1800 … 1 to 12 1 to 31 0.0 to 23.99 2 = Depth, Temperature 3 = Depth, Temperature, Salinity 4 = Depth, Sound Speed 5 = Depth, Temp, Salinity, Sound Speed I1X1 I1X1 I1 1-6 0 0 I3 1 to 500 F12.2 F12.2 F12.2 F12.2 In all records If parm_type = 2,3,5 If parm_type = 3,5 If parm_type = 4,5 Table 10. Generic Text Format for Master and MoodsAdmin Data – Text Header Line Parameter File Header Line File Header Line File Header Line File Header Line First Line (Everything from here down is repeated for every profile in the file) Pretty Header File Type Description Empty Lines Profile Number Latitude Longitude Flag[1] Flag[2] Flag[3] E-12 Skipped Characters Before Value 5 Lines 26 11 4 Lines 8 9 8 10 Format A1 A60 I6 F8.3 F8.3 X1I1 X1I1 X1I1 NIDAS User’s Manual Second Line Third Line March 2007 Flag[4] Flag[5] Flag[6] Flag[7] Flag[8] Province Flag Classification Pattern Flag Mass Flag Profile ID Water Depth (MOODS) Water Depth (Bathy) Month Day Year Hour Extra Variable Original Depths Added Depths Fourth Line Unique ID Source/Instrument Cruise Number Empty Line Empty Line Depth Temperature Profile Record (Repeated Original Salinity Depths + Added Sound Speed Depths times) Conductivity Density Empty Line Empty Line 8 9 8 9 6 6 X1I1 X1I1 X1I1 X1I1 X1I1 I6 I8 I4 I4 I7 F6.1 8 F6.1 8 I2X1 I2X1 I4 F4.1/2 (decimal could one or two places) F8.1 I4 I2 A10 I6 I7 7 10 8 8 8 11 9 1 Line F8.1 F7.1 F7.1 F7.1 F7.1 F7.1 1 Line Table 11. Generic Text Format for Moods2K Data – Text Header Line First Line (all lines are repeated for each profile) Parameter moods_hdr_key latitude longitude year month E-13 Format I8 F9.4 F10.4 I5 I2 NIDAS User’s Manual March 2007 day hour min sec number_of_parameters security_key quality_review_code moods_cruise_number Second Line moods_classification instrument_type source_type first_data_depth last_data_depth Third Line ocean_floor_depth bottom_depth_source depth temperature Profile Record salinity (Repeated for sound speed number_of_data_cycles) conductivity density I2 I2 I2 I2 I2 I4 I4 I9 I8 I5 I5 I5 I6 I6 I2 F10.4 F9.4 F9.4 F11.4 F11.4 F11.4 Table 12. Polygon Information Format – Text Header Line First Line Second Line Third Line Vertex Repeated for every vertex. The first vertex is added as the last vertex to close the polygon. Parameter Header Format A60 Max Longitude Max Latitude Min Longitude Min Latitude Number of Vertices Polygon Type F7.3X1 F6.3X1 F7.3X1 F6.3 I2 A Y Coordinate X Coordinate F10.3 F10.3 E-14 Comments User provided when exported. Identifies where the polygon was made. Region Win = ‘Map’ Profile Win = ‘Profiles’ NIDAS User’s Manual March 2007 Table 13. Synthetic Profiles Format – Text Header Line First Line Parameter Latitude Longitude Year Month Day Hour Hard-Coded Value Profile Type Format F7.2 F7.2 I4X1 I2X1 I2X1 F5.2X3 95X3 I1 Province Number I*X3 Synthetic Type I1X3 Region Code I* Number of Depths I* Province Vertex Cnt Latitude (Vertex 1) Longitude (Vertex 1) Latitude (Vertex 2) Longitude (Vertex 2) Latitude (Vertex 3) Longitude (Vertex 3) Latitude (Vertex 4) Longitude (Vertex 4) Latitude (Vertex 5) Longitude (Vertex 5) Latitude (Vertex 6) I2 F8.2 F8.2 F8.2 F8.2 F8.2 F8.2 F8.2 F8.2 F8.2 F8.2 F8.2 Second Line Third Line Fourth Line Fifth Line (-99 = no vertex) Sixth Line E-15 Comments 1 – Salinity 2 – Temperature 3 – Temp, Sal 4 – Sound Speed 5 – Temp, Sal, Sndspd 6 – Density 7 – Temp, Sal, Sndspd, Density *Number of digits depends on user’s input. 1 – Average 2 – Minimum 3 – Maximum 4 – Alternate *Number of digits depends on user’s input. *Number of digits depends on user’s input. 1 - 20 NIDAS User’s Manual Seventh Line Eighth Line March 2007 Longitude (Vertex 6) Latitude (Vertex 7) Longitude (Vertex 7) Latitude (Vertex 8) Longitude (Vertex 8) Latitude (Vertex 9) Longitude (Vertex 9) Latitude (Vertex 10) Longitude (Vertex 10) Latitude (Vertex 11) Longitude (Vertex 11) Latitude (Vertex 12) Longitude (Vertex 12) Latitude (Vertex 13) Longitude (Vertex 13) Latitude (Vertex 14) Longitude (Vertex 14) Latitude (Vertex 15) Longitude (Vertex 15) Latitude (Vertex 16) Longitude (Vertex 16) Latitude (Vertex 17) Longitude (Vertex 17) Latitude (Vertex 18) Longitude (Vertex 18) Latitude (Vertex 19) Longitude (Vertex 19) Latitude (Vertex 20) Longitude (Vertex 20) Depth Parameter Value Profile Record (Repeated Temperature number of depths) Salinity Sound Speed Density F8.2 F8.2 F8.2 F8.2 F8.2 F8.2 F8.2 F8.2 F8.2 F8.2 F8.2 F8.2 F8.2 F8.2 F8.2 F8.2 F8.2 F8.2 F8.2 F8.2 F8.2 F8.2 F8.2 F8.2 F8.2 F8.2 F8.2 F8.2 F8.2 F10.2 F10.2 F10.2 F10.2 F10.2 F10.2 E-16 Synth Type = 2 or 3 Value = Profile Type Synth Type = 1 or 4 NIDAS User’s Manual March 2007 APPENDIX F User’s Profile NIDAS creates a user profile for each user that stores preferences on many items throughout the application. When starting NIDAS for the first time, a default profile is created. The user has two options within the software to save his application settings to his profile (refer to Section 2.2.4 and Section 4.1.1.9). The list below shows the items within the user’s profile. If the user wishes to start over with a fresh default profile, then delete the user’s profile from the <NIDAS software directory>\Users\Profiles directory. The user’s profile will be named “<username>.prof”. NIDAS will recreate the profile with the default settings the next time the user starts NIDAS. Region Window Settings X Axis Text Y Axis Text Latitude Tick Longitude Tick Latitude Step Longitude Step Marker Font Text Font Background Color Grid Color Marker Color Text Color Coastline Color Coastline Resolution Profile Window Settings Min. X (Temp, Sal,…) Max X Min Y (Depth) Max Y X Axis Text X Axis Unit X Axis Tick X Axis Step Y Axis Text Y Axis Unit Y Axis Tick Y Axis Step Marker Font Text Font Axes Color Background Color Marker Color Text Color Data Settings Data Line Size Data Point Size Polygon Line Size Polygon Point Size Isolated Line Size Isolated Point Size Polygon Settings Edge Color Edge Size Vertex Color Vertex Size Vertex Style Polygon 1 Color Polygon 2 Color Polygon 3 Color Polygon 4 Color Polygon 5 Color Polygon 6 Color Polygon 7 Color Polygon 8 Color F-1 Synthetic Settings Depth On/Off 1st Depth Last Depth Last Depth Value Province Color Province Line Size Average Color Average Line Size Average Line Style Minimum Color Minimum Line Size Minimum Line Style Maximum Color Maximum Line Size Maximum Line Style Alternate 1 Color Alternate 1 Line Size Alternate 1 Line Style Alternate 2 Color Alternate 2 Line Size Alternate 2 Line Style Alternate 3 Color Alternate 3 Line Size Alternate 3 Line Style Alternate 4 Color Alternate 4 Line Size Alternate 4 Line Style Alternate 5 Color NIDAS User’s Manual Synthetic Settings(Cont.) Alternate 5 Line Size Alternate 5 Line Style Alternate 6 Color Alternate 6 Line Size March 2007 Alternate 6 Line Style Print Settings Background Color Page Size X Page Size Y F-2 Text Color Text Font Text Position X Text Position Y NIDAS User’s Manual March 2007 APPENDIX G Profile Flags NIDAS provides the ability for the user to use flags to quality control the LLT data. The user sets the appropriate flags for profiles (refer to Section 4.2.3) which can then be saved within the data version (refer to Section 4.1.4). These flags can also be used to subset the display of data (refer to Section 4.1.4.2), as well as subset the data being exported (refer to Section 4.1.1.3). The Master and MoodsAdmin data has 20 flags that are divided between temperature and salinity profiles. Table 14 shows those flags, along with the defaults for the different functionalities that are available. Table 14. Master and MoodsAdmin Flags Flags Temperature Not Yet Examined Good Profile Coarse Resolution Inconsistent Duplicate (Keep) Duplicate (Reject) Suspect Needs Repair Wrong Location Bad Profile Defaults Display Export X X X X X Flags Salinity Not Yet Examined Good Profile Coarse Resolution Inconsistent Duplicate (Keep) Duplicate (Reject) Suspect Needs Repair Wrong Location Bad Profile X X X X X G-1 Defaults Display Export X X X X X X X X X X NIDAS User’s Manual March 2007 Moods2K data has a complicated set of flags that has been divided into four categories. There are the temperature flags, the salinity flags, the sound speed flags, and a group of miscellaneous flags. Table 15 shows the Moods2K flags along with the defaults for the different functionalities available. Table 15. Moods2K Flags Temperature Flags Atypical Not Examined Typical Slightly Atypical Untypical Very Untypical Untypical – Not Specified 100-999 Coarse Resolution Not Examined Needs No Repair Repaired Needs Repair General Quality Not Examined Good, Needs no Repair Repaired Bad, Fixable Bad, Not Fixable Bad, Not Specified 100-999 (Bad) Marked As Salinity Not Examined Needs No Repair Repaired Defaults Dsply Expt X X X X X X X X X X X X X X X X Needs Repair Noisy Not Examined Salinity Flags Atypical Not Examined Typical Slightly Atypical Untypical Very Untypical Untypical – Not Specified 100-999 Coarse Resolution Not Examined Needs No Repair Repaired Needs Repair General Quality Not Examined Good, Needs no Repair Repaired Bad, Fixable Bad, Not Fixable Bad, Not Specified 100-999 (Bad) Marked As Temperature Not Examined Needs No Repair Repaired Defaults Dsply Expt X X X X X X X X X X X X X Noisy Not Examined G-2 Density Inversion Not Examined Needs No Repair Repaired Needs Repair High Vertical Gradient Not Examined Needs No Repair Repaired Needs Repair NODC Station QC Code 0 1 2 3 4 Defaults Dsply Expt X X X X X X X X X X X X X X 5 6 7 8 9 Profile Over Land X X X X X X Needs Repair X Misc Flags Ocean Over Land Over Land (In Lake/Sea) Beyond Lat/Lon Bounds Wrong Location 0 NIDAS User’s Manual Needs No Repair Repaired Needs Repaired Suspect Not Examined Needs No Repair Repaired Needs Repair Spike In Profile Sound Speed Flags Atypical Not Examined Typical Slightly Atypical Untypical Very Untypical Untypical – Not Specified 100-999 General Quality Not Examined Good, Needs no Repair Repaired Bad, Fixable Bad, Not Fixable Bad, Not Specified 100-999 (Bad) X X X X X X March 2007 Needs No Repair Repaired Needs Repaired Suspect Not Examined Needs No Repair Repaired Needs Repair Spike In Profile Defaults Dsply Expt X X X X X X X X G-3 X X X X X X 1 2 3 4 5 6 7 8 9 Profile in EEZ Profile in DC Profile in TW Profile in CZ CTD Serial No.