1
Mesmet One User Manual
1
Table of contents
1.
Application structure ....................................................................................................................... 4
1.1
Meters ..................................................................................................................................... 6
1.1.1
1.1.1.1
Overview ...................................................................................................................... 6
1.1.1.2
Edit Meter .................................................................................................................... 8
1.1.1.3
Activate meter ............................................................................................................ 13
1.1.1.4
Deactivate Meter ........................................................................................................ 13
1.1.2
1.1.2.1
1.1.3
1.1.3.1
1.1.4
PLC Net........................................................................................................................... 13
Overview .................................................................................................................... 14
Modules ......................................................................................................................... 15
Overview .................................................................................................................... 15
Connections ................................................................................................................... 16
1.1.4.1
Meters-Direct connections-Mobile ............................................................................. 16
1.1.4.2
Meters-Indirect connections ....................................................................................... 18
1.1.4.3
Servers ....................................................................................................................... 19
1.1.5
1.1.5.1
1.2
Meters in system .............................................................................................................. 6
Logical Organizations ...................................................................................................... 20
Overview and Configuration ....................................................................................... 20
Customers.............................................................................................................................. 24
1.2.1
Customers ...................................................................................................................... 24
1.2.2
Change meter................................................................................................................. 25
1.2.3
Import customers ........................................................................................................... 25
1.3
Schedules ............................................................................................................................... 25
1.3.1
1.3.1.1
1.3.2
1.3.2.1
Schedules ....................................................................................................................... 26
Overview and Settings ................................................................................................ 26
Logical Organization Filtering .......................................................................................... 27
Settings ...................................................................................................................... 27
2
1.3.3
1.3.3.1
1.4
Readouts ........................................................................................................................ 29
Settings ...................................................................................................................... 29
Collected data ........................................................................................................................ 30
1.4.1
24h Task List ................................................................................................................... 30
1.4.1.1
Overview .................................................................................................................... 30
1.4.1.2
Cancel unfinished tasks............................................................................................... 31
1.4.1.3
View logs .................................................................................................................... 32
1.4.2
1.4.2.1
1.4.3
Meter Filtering ............................................................................................................... 32
Settings ...................................................................................................................... 32
Pocket PC ....................................................................................................................... 34
1.4.3.1
Import from File ......................................................................................................... 34
1.4.3.2
Import from PPC ......................................................................................................... 35
1.4.4
Communication results ................................................................................................... 36
1.4.4.1
Data Overview and Export .......................................................................................... 36
1.4.4.2
Communication errors ................................................................................................ 38
1.4.4.3
OnDemand Communication........................................................................................ 39
1.4.4.3.1 Create Read OnDemand Command....................................................................... 40
1.4.4.3.2 Create Write OnDemand Command...................................................................... 40
1.4.4.3.3 Track OnDemand Command ................................................................................. 41
2.
Contact .......................................................................................................................................... 42
3
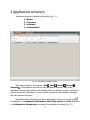
1.Application structure
Application structure is divided in four tabs (fig. 1.1):
1.
2.
3.
4.
Meters
Customers
Schedules
Collected Data
Fig. 1.1 MesmetOne application design
Main menu consist of five buttons: Add , Save , Delete , Refresh ,
Activate . These buttons are used for basic application functions. After initial
application starting, these buttons are disabled (can’t be clicked by mouse), until one of
controls is opened. Depending on control loaded, buttons can be enabled or disabled,
and have different functions.
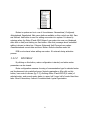
MesmetOne also has drop-down menu, activated by clicking on top left icon .
Its options are: Configuration Parameters, Start/Stop service and Exit. After click
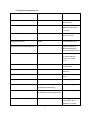
on Configuration Parameters new window for application is shown (fig. 1.2).
4
Configurable parameters are:
Parameter
Default value
Details
numOfRetriesForTask
2
Number of retries for
task execution
OnDemand_Event_Table_Refresh(m)
2
Refresh period for
OnDemand commands,
in minutes
Event_Table_Refresh(m)
2
Refresh period for event
table, in minutes
PauseBetweenRetries
20000
Pause between retries
numOfRetriesForCompletedWithErrors 3
Number of retries of
repeated readings for
data collected with errors
PollRetries
3
How much times tries to
call GPRS module to
leave entry to DNS
server
Archive Time interval(m)
360
Communication log
archive period
PortAccessRetries
5
Number of attempts to
reach port
Task_Table_Time_Window(min)
60
Task table developing
period
Digits_Count
8
Count of digits shown
Log Files Path
c:\Program Files\E-Smart
Systems\MesmetOne\log\
Log files storing path
Archive Path
c:\Program Files\E-Smart
Log files archiving path
Systems\MesmetOne\log\Archive\
AutomaticSystemStarting
True
Is reading service started
automatically when
application is started
5
Option Start service/Stop service (text depends on service status) is used to
manually start or stop communication. Service stopping is used when user wants to
reconfigure system and change the settings that affect remote communication (e.g. to
change way of communication with meter).
By clicking on Exit user leaves application.
Fig. 1.2 Configuration parameters form
1.1 Meters
This part of application is divided in several groups: Meters in system, PLC
Net, Modules, Connections and Logical Organizations.
1.1.1
Meters in system
This group consists of following buttons: Overview, Activate Meter, Edit
Meter, Deactivate Meter. Initially, after starting the application, Overview button is
available, while Activate Meter, Edit Meter and Deactivate Meter are disabled
(can’t be clicked). After click on Overview these buttons become available.
1.1.1.1
Overview
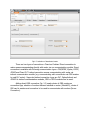
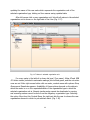
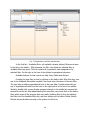
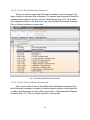
After click on Overview list of all meters in system is shown (fig. 1.3).
6
Fig. 1.3 Overview of all meters in system
For every meter, Meter ID, EDB ID, HDLC Setup, Baud Rate, Module Type,
Status and Valid From (date of meter activation) are shown. First row in this grid is
filter, allowing filtering and displaying only desired meters (e.g. display only active
meters). Filtering is available for every column (Meter ID, EDB ID, HDLC Setup, Baud
Rate, Module Type, Status and Valid From). Filtering can be done with positioning
mouse on first row of column to be filtered. After that, an arrow pointing down is
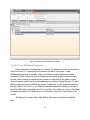
shown in this row, and after click on it, list of values for filtering is shown (fig. 1.4).
Selecting a value from the list and pressing enter shows list of filtered meters in system.
Filter is removed by clicking on button by arrow pointing down
7
and pressing enter.
Fig. 1.4 Meter filtering
Meters in system can be in one of four statuses: Parametrized, Configured,
Activated and Deactivated. Main menu buttons available on this control are Add, Save
and Refresh. Add button is used for adding new meter into system. It is done by
entering values for Meter ID and HDLC Setup of new meter into new row (displayed
after click on Add) and clicking on Save button. After that, message about successful
adding is shown in status bar. Columns Status and Valid From get new values Parametrized and current date and time. Button Refresh refreshes meter list.
EDB is not entered when adding new meter. It’s entered during activation
process.
1.1.1.2
Edit Meter
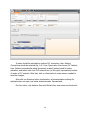
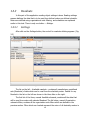
By clicking on this button, meter configuration is started, and active meter
parameters can be viewed.
Meter configuration assumes choosing of communication type for selected meter
and its placement into predefined group (logical organizations. After click on this
button, new control is shown (fig. 1.5), showing Meter ID and EDB ID (if exists) of
selected meter, and current meter status, in upper half. Lower half of control has three
tabs: Direct Connections, Indirect Connections and Logical Organization.
8
Fig.1.5. Activation of deactivated meter
There are two types of connections: Direct and Indirect. Direct connection to
meter means communicating directly with meter via one communication module. Direct
connection is available with following communication types: GSM/GPRS, Zigbee, RS232,
RS485 and Direct PLC. Indirect connection means communicating with meter via
indirect communication module (e.g. communicating with concentrator via GSM modem
to read PLC meter). Supported indirect connection types are PLC, ZigbeeIndirect and
RS485. As indirect communication modules, GSM or GPRS modems can be used.
Adding direct GSM connection (fig. 1.5) needs choice of GSM modem as
connection type, selection of modem instance installed on meter (ModuleID), choice of
SIM card in modem and connection to be used to communicate with modem (Server
Connection).
9
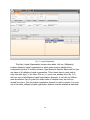
Fig. 1.6: Inserting of indirect PLC connection
If meter should be activated via indirect PLC connection, then Indirect
Connections should be selected (fig. 1.6). From Type combo-box choose PLC Indirect,
from Indirect connection list select (previously created) indirect used for meter
activation, and select node from PLC network tree (on the right) representing location
of meter in PLC network. After that, click on Save button in main menu is needed to
save the changes.
After click on Reset and action confirmation, all communication settings for
selected meter are reset, and meter status becomes Parametrized.
On this control, only buttons Save and Refresh from main menu are functional.
10
Fig. 1.7: Logical Organization
Third tab (Logical Organization) contains two tables. Left one (Obligatory)
contains obligatory logical organizations in which meter must be placed during
configuration process. It contains columns Type Name and Element Name used for type
and name of all obligatory logical organizations. Third column has no name, and its
rows have plus signs (+) as value. Click on (+) opens new, auxiliary form (fig. 1.8.)
with tree view of all obligatory logical organizations elements. A nod with no children
must be selected. Click on green icon keeps value of selected node, and red icon
cancels the choice. This way logical organization element for meter is chosen. For every
row in this table, obligatory logical organization element must be selected as described.
11
Fig. 1.8: Logical organization element selection
Table Other contains non-obligatory logical organizations. This table has columns
Type and Element Name with type and element name of non-obligatory logical
organization. Last two columns have no names, and their rows have values of plus (+)
and minus (-). They are used to add and remove meter from logical organization. Nonobligatory logical organization selections are not required for meter activation. After
click on (+), auxiliary form with tree view of all non-obligatory logical organizations
elements (fig. 1.8) is shown. Handling this form is described in previous paragraph.
Click on minus (-) removes meter from selected non-obligatory logical organization.
Click on Save button ends meter configuration and its status is set to Configured,
and operation status is shown in status line. If all needed parameters (connections and
logical organizations) are not entered, program will warn user that data entered is
incomplete, and configuration will not be saved.
12
1.1.1.3
Activate meter
Once configured, meter is still not included in automatic reading plan. By
selecting meter from the list and clicking on Activate button, meter becomes active, and
therefore, part of automatic reading plan. Meters in status Parametrized cannot be
activated. They do not have communication configuration associated, so they cannot be
remotely accessed, and therefore cannot be considered as active.
1.1.1.4
Deactivate Meter
Click on Deactivate meter button deactivates selected active meter. Consequence
of meter deactivation is removal of meter from active automatic reading plan. This can
be done by selecting the meter from the grid, and clicking on this button. Selected
meter must be in status Activated. After click on Deactivate Meter, warning message
appears. After click on Yes, meter status becomes Deactivated. If No is clicked, nothing
happens. If selected meter already is in status Deactivated, application will notify user
that selected meter is already deactivated.
Deactivation DOES NOT delete meter from system.
1.1.2
PLC Net
This part of application is used for definition of PLC network for meter activation
via indirect PLC network. Only one button exists in this group - Overview.
13
Fig. 1.9 PLC Net
1.1.2.1
Overview
After click on Overview button, form containing grid with list of all defined PLC
networks is displayed (fig. 1.9). For each PLC network, name and concentrator serial
number are shown. New PLC network is entered by clicking on Add button. New row
appears in the list, and after entering name and PLC serial number, network data are
saved by clicking on Save button. Changes on existing PLC networks are made in similar
fashion, by editing data shown in grid and clicking on Save button.
Click on Delete button deletes selected PLC network from the system.
PLC networks defined here can be connected to meters used in PLC
communications via Edit meter.
14
1.1.3
Modules
This part of application is used for adding new module into system, applying
changes on existing modules, deleting, etc. These modules are used in meter
activation.
1.1.3.1
Overview
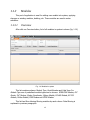
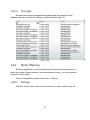
After click on Overview button, list of all modules in system is shown (fig. 1.10).
Fig. 1.10 Modules in system
This list contains columns Module Type, Serial Number and Valid from. For
Module Type one of predefined module types can be chosen: GPRS-GSM Modem, PLC
Router, PLC Modem, Zigbee Coordinator, Zigbee Module, RS 485 Module, RS 232
Module, M-Bus Module, GSM Modem and GPRS Modem.
This list has filter allowing filtering modules by each column. Data filtering is
explained in previous paragraphs.
15
Available buttons from main menu are Add, Save, Delete and Refresh.
New module is added into system by clicking on Add button. After click on Add,
new row is shown in list. Data Module Type and Serial Number must be entered
manually, while Valid from field is filled automatically. Module Type is chosen from
combo-box.
Module can be saved by clicking on Save button. Saved module can be assigned
to meter via Edit Meter.
Module is deleted by click on Delete button. After click on Delete, warning
message is displayed. If Yes is clicked, module is deleted. If module is already assigned
to meter, it cannot be deleted, and appropriate message will be shown in status line.
Click on Refresh button refreshes displayed module list.
1.1.4
Connections
This part of application is used for defining server connections for meter access,
and connections for meters. Meters can be accessed via direct (mobile) or indirect
connection.
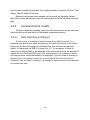
This part has two separate parts - Meters and Servers. Click on arrow pointing
down shows drop-down menu with Direct connections and Indirect connections. In
Direct connections it is possible to choose Mobile (fig. 1.11).
Fig. 1.11 Connections drop-down menu
1.1.4.1
Meters-Direct connections-Mobile
In upper half of this control (fig. 1.12) there is grid containing all connections
and showing their names and statuses (Parametrized, InActive or Active). Lower half
shows parameters of selected connection - Name, Telephone and IP Address.
16
Fig. 1.12 Direct connections
Buttons available from main menu on this form are: Add, Save, Delete and
Refresh.
Click on Add adds new row into upper table (Connection List). It is not possible
to enter data into this row. It’s done via table Connection Parameters, where name and
phone number are entered.
After click on Save, connection data are saved into system. It is not possible to
save two connections with same name (application will report an error to user).
Click on Delete removes selected connection.
Click on Refresh refreshes connection list and parameters.
17
1.1.4.2
Meters-Indirect connections
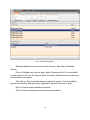
Fig. 1.13 Indirect connections
Upper half of this control (fig. 1.13) contains list of existing indirect connections,
and lower displays available modules, direct and server connections. For each indirect
connection, its module type, name, serial number, direct connection name and server
connection name are shown.
Buttons available from main menu on this form are: Add, Save, Delete, Refresh.
Click on Add adds new row into Indirect Connections table. Only Name is entered
directly into new row, other columns take values from selection from module, direct and
server connection tables. Types of selected server connection and module must be
compatible.
Click on Save saves newly added connection and any other changes into system.
It is not possible to save two connections with same name (application will report an
error to user).
Click on Refresh refreshes connection list and parameters.
18
1.1.4.3
Servers
This control contains two tabs– COM connections and GPRS connections (fig.
1.14).
Fig. 1.14 Server connections
Upper half contains list of existing server connections in system (Connections),
with one column – (Connection Name). Lower half contains grid with parameters of
selected connection.
Buttons available from main menu on this form are: Add, Save, Delete, Refresh.
Click on Add adds new row into Connections table. Connection name is entered
into Connection Name column. In Parameters table all parameters (Com Port, Baud
Rate, Parity, Stop bits, Data bits, Telephone, Computer Name) values should be set to
appropriate values. Some parameters’ values are entered manually, while some have
predefined values in combo-boxes.
Click on Save saves newly created server connection in system. It is not possible
to save two connections with same name (application will report an error to user).
19
Click on Refresh refreshes connection list and parameters.
1.1.5
Logical Organizations
Electricity meters in the system are can be grouped by the types of Organization
Units. Because of that, firstly types of Organization Units are defined, and then, the
units of defined type. These units can be defined in multi level in the parent/child
relationship. Organization units make possible easier searching, grouping and
manipulation on Electricity meters.
1.1.5.1
Overview and Configuration
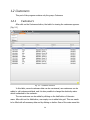
After clicking on Overview and Configuration the form with the list of
organization units appears on the left as a tree (Fig. 1.15)
Fig. 1.15 Organization Units
If there is still no organization types defined, and by that no organization units,
this tree has only one element: Types (not the case with Fig. 1.15). Clicking on this
element with the left mouse button, the right part of this form appears (Fig. 1.16). In
20
this newly opened part of the form there is a table with the name: Type of logical
organization. In the column Name the organization type name is inserted, and value in
the Required column is checked if the organization type is required or not for inserting
electricity meter in the system. Buttons of the main menu (Add, Save, Delete, Refresh)
are available and are used for manipulating Organizational structure.
Fig. 1.16 The table of Organization Types
By clicking on the button Add the new row in the table Type of logical
organization is added. After updating columns of the new row, the newly defined
Organization Type is saved in the system by clicking on the Save button. If the Save
operation is successfully completed, the user is informed in status line of the
application, and this new Organization Type is displayed in the tree (in the level below
Types). If this new Organization Type is required, the color on the tree of this node is
red. The rows in the table Type of logical organization can be deleted by clicking on the
Delete button. Click on Refresh refreshes on-screen data.
Adding new organization units of the specified type is done by selecting
organization type, and then, clicking on the button Add of the main menu. After
21
updating the name of this new node which represents the organization unit of the
selected organization type, clicking on Save causes saving updated data.
After left mouse click on any organization unit, list with all meters in the selected
organization unit is shown on the right side of the form (Fig. 1.17).
Fig. 1.17 Meters in selected organization unit
For every meter in the table it is shown his type (Type name), Meter ID and EDB
ID. Active meters (included in automatic readings) are colored green, and the not active
ones are red. After right mouse button click on meter, context menu with options Move,
Remove and Deactivate appears. Availability of these options depends on the status in
which the meter is or on the required attribute of the organization type in which the
selected organization unit is. Already inactive meter cannot be deactivated or moving
and removing meters cannot be done from the obligatory organization type. Selecting
the option Move from this Context Menu, the right part lets the user to choose the new
organization element in which to put selected meter. (Fig. 1.18)
22
Fig. 1.18 Moving meter 10250381 from one organization unit to another
In these tables obligatory and not obligatory organization units in which the
selected meter can be moved. Handling this control is the same as with the control for
activating meters explained before.
Options Remove and Deactivate are used for removing and deactivating the
selected meter from the table.
Deleting the organization unit is done by selecting the element from the tree,
and then, by clicking on the Delete button from the main menu. If in the selected
organization unit exists some electricity meters, the system will notify the user that the
selected node cannot be deleted because there are meters in it.
23
1.2 Customers
This part of the program contains only the group Customers.
1.2.1
Customers
After click on the Customers button, the table for viewing the customers appears.
(Fig. 2.1)
Fig. 2.1 – Customers overview
In this table, current customers data can be overviewed, new customers can be
added or old customers deleted, and it is also possible to change the electricity meter
which is attached to the customer.
The new customer can be added by clicking on the Add button of the main
menu. After click on the Add button, new empty row is added into grid. This row needs
to be filled with all necessary data and by clicking on button Save of the main menu this
24
changes are saved in the system. If all necessary data is not inserted, the application
will notify the user with the error message.
Deleting of the customer is done by selecting the customer to delete, and
clicking on the Delete button from the main menu.
1.2.2
Change meter
Changing meter is done by selecting the customer whose meter should be
changed, and then, clicking on the button Change meter. After this step, the list of all
available configured electricity meters appears. From this list the user chooses the
meter which he wants to attach to the selected customer instead of the current meter.
Changing of the meter for the customer is allowed only if meter selected as
substitute is in status Configured. Also, it is not possible to do the change if the
customer has no meter attached.
1.2.3
Import customers
Customers’ data can be imported from text file. Text file must be in appropriate
format – with four columns ('EDB', 'Name', 'Address', 'Telephone'), and data separated
with appropriate delimeter character.Delimiter character can be chosen from combo
box. Predefined values are ; , and TAB, but it is possible to enter any delimeter.
Appropriate text file can easily be generated from Microsoft Excel table.
1.3 Schedules
In this part of the application all the parameters that have any kind of
relationship with the automatic reading can be set. First of all, definition of the schedule
by which the system will do the automatic reading of meters, then the collection of
meters to be read by selected schedule, and finally the data to be read from selected
collection of meters.
25
There are three groups in this part of the application: Schedules, Logical
Organization Filtering and Readouts.
1.3.1
Schedules
This group is related with defining schedules in the system. It contains only one
button: Overview and Settings.
1.3.1.1
Overview and Settings
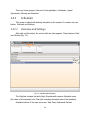
After click on this button, the control with two tabs appears. These tabs are Daily
and Monthly (Fig. 3.1).
Fig. 3.1 Schedule administration
The Daily tab contains the table Daily Schedule with columns Schedule name
(the name of the schedule) and Time (the everyday execution time of the schedule).
Available buttons of the main menu are: Add, Save, Delete and Refresh.
26
Adding the new schedule is done by clicking on the Add button which adds one
new row in the table. After setting the name and the time of execution, click on the
Save button saves this changes in the system. It means that from that moment, every
day in the future, this schedule will try to execute something in the specified time.
Deleting of the schedule is done by selecting the schedule to be deleted, and clicking on
the button Delete. For refreshing the table with the current data in the database, user
must click on the Refresh button.
The Monthly tab contains the same table, but for defining monthly schedules.
This means that the schedule defined on this tab will execute at specified day of month
(the field Day in Month) at midnight.
1.3.2
Logical Organization Filtering
In this part of the application, the filters on organization units representing the
set of meters to be read are defined. This way it is possible to automatically read only
predefined sets of meters instead of all of them.
1.3.2.1
Settings
After click on this button, the control with three lists appears. (Fig. 3.2)
27
Fig. 3.2 Organization units filter administration
In the first list – Available filters - all available, already defined, filters are shown.
In the list in the middle – Filter elements for filter –the details for selected filter in
Available filters are given. This list contains all organization units assigned to the
selected filter. On the right is the tree of the defined organizational structure.
Available buttons for this control are Add, Save, Delete and Refresh.
Creating the new filter is done by clicking on the button Add. After this step, new
row in the Available filters table is added. User must enter the name of the new filter.
The next step is adding organizational units in this new filter. Double mouse click on
any of organizational units from the tree on the right puts it in the list on the middle.
Similarly, double click on any already assigned element in the middle list removes this
element from the list. After administrating this new filter, user must click on the button
Save which saves all the changes that user made. Deleting filter is done by selecting
the filter from the Available filters list, and then clicking on the button Delete. Button
Refresh shows the data currently in the system for this form.
28
1.3.3
Readouts
In this part of the application reading object settings is done. Reading settings
assume defining the data that is to be read from defined meters on defined schedule.
Meters are defined using organizational units filtering, and schedules are explained
earlier in this text. There is only one button – Settings.
1.3.3.1
Settings
After click on the Settings button, the control for readouts defining appears. (Fig.
3.3)
Fig. 3.3 Readouts administration
The list on the left – Available readouts – contains all manufacturer predefined
sets (Readouts) of data which can be read from the electricity meter. Details for any
Readout in the list on the left are shown in the three lists on the right.
The first list of the three, named Available elements, contains all the data that
will be read from meter with selected Readout. The list below, named Organization
elements filters, contains all the organization units filters which are defined in the
previous section. Filter which are checked represent the union of all electricity meters in
29
those filters that will be read with selected Readout. In the last list, named Available
schedules, the user can choose which schedule will be applied to the selected Readout.
Available buttons of the main menu for this control are: Save and Refresh.
The button Save saves all the changes that user made on the selected Readout.
The button Refresh returns the current data from the database for this control.
1.4 Collected data
This part of application enables user to view and export data read from the
meters saved in filter. It consists from few groups: 24h Tasks List, Meter Filtering,
PocketPC and Communication Results.
1.4.1
24h Task List
This part of application enables overview of all tasks from the database, with their
statuses. It has three buttons: Overview, Cancel unfinished tasks and View logs (fig.
4.1).
Fig. 4.1: 24h Task List buttons
1.4.1.1
Overview
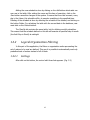
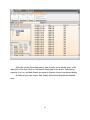
After click on this button, 24h Task List is displayed on the form (fig. 4.2).
30
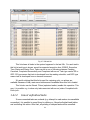
Fig. 4.2 24h task list
This list shows all tasks in the system happened in the last 24h. For each task in
this list its task type is shown, as well as expected execution time, EDB ID, Execution
Time, Status and Status Time. Tasks can be in one of following statuses: Pending,
Canceled, Completed Successfully and Completed with errors. Task type can be SR or
ODC. SR type means that task is developed from the reading schedule, and ODC type
means task is developed from on demand command.
It’s worth noticing that this list is used for reviewing only; no actions are
available. Because of that, main menu buttons aren’t available when this list is loaded.
This list also can be filtered. Filters (explained earlier) enable this operation. This
way, it is possible e.g. to show only tasks executed with errors (status Completed with
Errors) etc.
1.4.1.2
Cancel unfinished tasks
If some unwanted tasks are ordered (e.g. attempt to read meters via unavailable
connection), it is possible to cancel them by clicking on Cancel unfinished tasks button
and confirming the action. After that, all pending or delayed tasks will be cancelled.
31
1.4.1.3
View logs
All system errors and communication problems data are preserved in the
database, and can be viewed by clicking on View logs button (fig 4.3).
Fig. 4.3: Logs
1.4.2
Meter Filtering
This part of application is used to define filters, which consist from meters, for
which user wants to review readouts, see communication errors, or to let on demand
command on this meters.
This part of application contains one button - Settings.
1.4.2.1
Settings
After click on this button, control that consists from 5 parts is shown (fig. 4.4).
32
Fig. 4.4 Device filtering
List from the left side is named Filter editing and consists of columns EDB ID
and Select. It contains meters that define filter. List Avaliable filter consists of all
previously defined and saved filters. Next to this list, there is another list named Meters
in current selection. It consists of meters with their Meter ID and EDB ID, and it’s filled
with meters belonging to selected filter (from the list Avaliable filters). In fourth part,
there is tree view of all defined logical organization. After click on an element from the
tree, in the Meters in current selection list all meters belonging to selected organization
element appear. On the right end side, there is a text box where user can enter meter’s
EDB ID which wants to find. Afterwards, if meter with entered EDB ID exists, it will
appear in the list below, with its Meter ID, EDB ID, Modem ID and Measurement Type.
After double click on row in this table, meter will be added to the Filter Editing list
Meters that user wants to save in new filter, or which are needed to be part of
activated filter, have to be added to the Filter Editing list. This can be done on several
ways. Click on the button Send Devices To Filter Editing sends checked meters from
filter Meters in current selection and after that meters will be moved to the Filter Editing
list. Meters can be removed from the Filter Editing list by checking them and clicking on
the button in the bottom of the form, named Remove Devices.
33
Buttons from the main menu available on this control are: Add, Save, Delete,
Refresh and Activate. After click on Add new row will be added into the list Avaliable
filters. It is obligatory to insert name for new filter.
Click on Save button saves newly created row and all changes. Before clicking
on Save button, it is necessary to move meters to the Filter Editing list. Otherwise,
application will display an error.
After click on the Delete button, filter selected in the Avaliable filters list will be
deleted.
Click on Refresh button refreshes on-screen data.
Click on Activate (from the main menu) activates filter with meters from Filter
Editing list. Other controls (will be described later) depend on filter data.
1.4.3
Pocket PC
This part of application enables communication with Pocket PC device, imports
data that are read with Pocket PC from file stored locally or directly from Pocket PC.
It consists of two parts: Import from file and Import from PPC.
Fig. 4.5 Import data from PPC
1.4.3.1
Import from File
After click on this button, file browsing window appears. After selecting file stored
on the local computer with the data from Pocket PC copied from PocketPC to computer,
new control will be displayed (fig. 4.6).
34
Fig. 4.6 Import data from file
In the top part of the form, there is list named Read Log that consists of four
columns: Activation, Meter ID, Time Stamp and Error ID. In the middle part of this
control there is Write log grid with columns Activation, Meter ID, Time Stamp and Error
ID. Last, bottom part of form consists of only one list named Error Log and consists of
columns: ID Error, Time Stamp, Class ID, Meter ID and Error.
Buttons from the main menu available on this control are Save and Refresh.
After click on Save, data shown in this list is saved. Button Refresh refreshes on-screen
data.
1.4.3.2
Import from PPC
Before clicking on this button, active connection to Pocket PC is needed.
After click on Import from PPC, new control, which consists of two parts, is
shown. On the top of the form there is list named Read Log consists of four columns:
Activation, Meter ID, Time Stamp and Error ID. In the middle of this control there is list
Write log with columns Activation, Meter ID, Time Stamp and Error ID. Last, bottom
35
part of control consists of list named Error Log that consists of columns: ID Error, Time
Stamp, Class ID, Meter ID and Error.
Buttons from the main menu available on this control are Save and Refresh.
After click on Save, data shown in this list is saved. Button Refresh refreshes on-screen
data.
1.4.4
Communication results
This part of application enables overview of all communication results, data read,
communication errors and results of OnDemand commands execution.
1.4.4.1
Data Overview and Export
On this control, it is needed to insert time period into fields From and To, to
determine time window from which user wants to view data. On left side of this control
there is list of meters belonging to the activated filter (filter activation is described
earlier). For each meter its EDB ID is shown (fig. 4.7). It is necessary to check all
meters whose data is meant to be displayed. In the bottom left list there are identifiers of
objects with their OBIS and EDIS code, from selected meter. It is necessary to select
only objects whose values are wanted to be displayed. If only one meter is checked in
the top left list, it is possible to check one or more objects from the bottom list for
overview. If only one object is checked, it is possible to check more than one meter and
to compare their data.
36
Fig. 4.7 Collected data
After click on the Show Data button, data is shown in the tabular view, in the
main part of the form. Click on Print button sends data to the printer. Data can be
exported in .xls or .xml data format and saved to location chosen from browse dialog.
All buttons from main menu: Add, Delete, Refresh and Activate are disabled
here.
37
1.4.4.2
Communication errors
This control is used for displaying errors that happened in communication.
Boundaries of time period have to be inserted into fields From and To, to determine time
window from which user wants to view errors in communication (fig. 4.8). Click on Show
button displays all errors happened in pre-selected time interval. These errors are
displayed in the main list. For each error it is shown it’s EDB ID, Execution Time and
Error. This list can be filtered.
Communication errors are shown only for meters that belong to the activated
filter.
Fig. 4.8 Communication errors
All buttons from main menu: Add, Delete, Refresh and Activate are disabled
here.
38
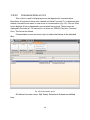
1.4.4.3
OnDemand Communication
This control consists of three parts: Create Read OnDemand Command, Create
Write OnDemand Command and Track OnDemand Command (fig. 4.9). It depends of
data from activated filter and shows only logical names available in selected meters.
Fig. 4.9 OnDemand commands
39
1.4.4.3.1 Create Read OnDemand Command
This part is used to create Read OnDemand command. List of belonging to the
types of meters in activated filter is displayed. On demand read command is created by
checking desired objects in the list, and click SendCommand (Fig. 4.10). ID of newly
sent command is shown in the field next to the Last Generated OnDemand Command.
Click on Refresh refreshes on-screen data.
Fig. 4.10 Sending Read OnDemand command
1.4.4.3.2 Create Write OnDemand Command
This control consists of lists of all available Write OnDemand commands. New
write OnDemand command is created by checking desired objects in the list and click
on button SendCommand, and its id will be shown text to Last Generated OnDemand
Command (Fig 4.11). Click on Refresh refreshes on-screen data.
40
Fig. 4.11 Sending Write OnDemand command
1.4.4.3.3 Track OnDemand Command
Every OnDemand command can be tracked. It is needed to insert time period into
fields From and To, to determine time window from which user wants to track
OnDemand commands. Thereafter, click on the button next to combo-box named
Command ID fills combo-box with all OnDemand commands created in selected time
interval. After choosing a command from combo-box and click on the button next to
Track Command, tasks from this command appear in the list Tracked Devices. For each
task its status and meter’s EDB ID are shown. Double click on task shows its details on
the right side of the control. If it is Write OnDemand command its details are shown in
list Write OnDemand commands, and if it is read then her results are shown in list Read
OnDemand command. If a task had errors in execution, they are in the bottom of the
control.
All buttons from main menu: Add, Delete, Refresh and Activate are disabled
here.
41
2.Contact
Company address is
E-Smart Systems d.o.o.
Blagoja Parovića 19
11030 Beograd
For any other question about MESMET system, please use:
[email protected]
Our company web site is
www.e-smartsys.com
42