1
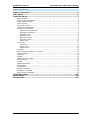
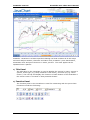
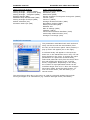
ProSticks Java Chart
User Manual
ProSticks.com Limited
Web: www.prosticks.com.hk
Email: [email protected]
Tel: 2866 8635 Fax: 2866 2888
ProSticks.com Ltd.
ProSticks Java Chart User Manual
Table of Contents
Table of Contents ....................................................................................2
Title Panel ...............................................................................................3
Function Panel ........................................................................................3
Symbol Input ....................................................................................... 4
Time Duration Selection ......................................................................... 4
Chart Type Selection.............................................................................. 4
Value Cursor ........................................................................................ 5
Technical Studies .................................................................................. 5
Technical Para meters ............................................................................. 6
Support & Resistance............................................................................. 7
Fibonacci Retracement ...................................................................... 7
Fibonacci Projection .......................................................................... 8
Fibonacci Arc ................................................................................... 8
Fibonacci Fans ................................................................................. 9
Fibonacci Zones ............................................................................... 9
Fibonacci Ruler................................................................................10
Gann Lines .....................................................................................10
Line Tools ...........................................................................................11
Draw Line ......................................................................................11
Trend Line......................................................................................12
Parallel Line....................................................................................12
Text Box.............................................................................................13
Chart Compare (Rebase in same) ............................................................13
Inverse Chart ......................................................................................14
Log Scale ............................................................................................14
Detach ...............................................................................................15
Next & Previous Page ............................................................................15
Export to Gif ........................................................................................15
E-mail ................................................................................................16
Data Adjustment ..................................................................................16
Distribution .........................................................................................17
Divergence..........................................................................................17
What-If-Analysis ..................................................................................18
ProSticks vs Candle ..............................................................................18
Save Custom Settings ...........................................................................18
Technical Panel.....................................................................................19
Chart Panel............................................................................................19
Price Panel ............................................................................................19
2
ProSticks.com Ltd.
ProSticks Java Chart User Manual
ProSticks’ JavaChart is a feature packed charting tool that includes all of the major
tec hnical analysis studies, Fibonacci and Gann tools, ProSticks’ price distributions,
annotation tools and print functions to name just few. The main applet can be
separated into 5 panels:
1) Title Panel
The title panel in the JavaChart is used to display the security’s name, security’s
symbol, chart type (e.g. Daily ProSticks-Time Chart), and tool-tip (e.g. Value
Cursor). The tool-tip will display the functions of each button in the JavaChart if
the mouse cursor is focused on that particular button.
2) Function Panel
The function panel in the JavaChart is used for interacting with the price chart.
Functions include the following:
3
ProSticks.com Ltd.
ProSticks Java Chart User Manual
Symbol Input
First, select the exchange of the security you want to view the
chart of and then type in the symbol in the symbol box (e.g. 5) and
press ENTER.
The drop-down button on the right of the symbol box brings down
a list of the recently viewed securities. Instead of typing in the security symbol again
in the symbol box that one has already viewed, one can simply click on the symbol
on the list to view the security’s chart again.
Time Duration Selection
The Java Chart can display either a daily, weekly, or monthly
chart. A daily chart presents the open, high, low, and close
for each day’s trading. A weekly chart takes the open of the
first trading day of the week (e.g. Monday) and the close of
the last trading day of the week (e.g. Friday) to calculate
each bar. For a monthly chart, the open of the first trading
day of the month (e.g. 1s t) and the close of the last trading
day of the month (e.g. 31s t) are used to calculate each bar.
The JavaChart has 6 different time durations. One can view a year-to-date, 1 month,
3 months, 6 months, 1 year, or greater than 1 year chart. The width of each bar will
decrease as the duration increases.
Chart Type Selection
There are 10 different chart types to choose from in the
JavaChart. They include the following:
- ProSticks-By-Time: this chart displays the ProSticks
proprietary data (Modal Point, Modal Count, Active Range)
calculated with the ProSticks-By-Time method.
- ProSticks-By-Volume: this chart displayes the ProSticks
proprietary data (Modal Point, Modal Count, Active Range)
calculated with the ProSticks-By-Volume method.
- Candlesticks: the traditional Japanese Candlestick chart
displaying the open, high, low, and close.
- Bar: the traditional Bar chart displaying the open, high, low, and close.
- Line: a line chart displaying and connected by the close.
- Bar and Modal-By-Time: the traditional Bar chart displaying the open, high, low,
and close along with the ProSticks-By-Time Modal Point.
- Bar and Modal-By-Volume: the traditional Bar chart displaying the open, high,
low, and close along with the ProSticks-By-Volume Modal Point.
- Modal Line-By-Time: a line chart displaying and connected by the ProSticks-ByTime Modal Point.
- Modal Line-By-Volume: a line chart displaying and connected by the ProSticksBy-Volume Modal Point.
- Area: a filled line chart displaying and connected by the close.
For an in-depth explanation and discussion on the ProSticks-By-Time and ProSticksBy-Volume theories, please visit our Education section.
4
ProSticks.com Ltd.
ProSticks Java Chart User Manual
Value Cursor
The first button on the function panel
is the Value Cursor. Once pressed, a
cross-haired cursor that spans the
entire chart will be displayed. The
vertical price axis on the right will
always display the price (green
highlighted box) of the center-point of
the cursor. The price will move as the
cursor moves.
Technical Studies
The second button (from the
left) on the function panel,
when pressed, brings down
the list of technical studies
currently available in the Java
Chart.
The first set of technical
studies in the drop-down
menu is the upper studies,
which overlay onto the price
chart. A maximum of 3 upper
studies can be overlaid onto
the chart at any one time
(shown above). A checkmark
will appear on the left of the
technical study chosen. To
cancel a study, simply select it
again and it will be unchecked
and erased from the chart. For
reference upper technical
calculations are displayed in
the technical panel on the
upper-left corner of the chart.
The middle set in the menu is the lower studies, which append to the bottom of the
price chart, thus shrinking the height of the price chart. A maximum of 3 lower
studies can be added to the chart at any one time (shown above). A checkmark will
appear on the left of the technical study chosen. To cancel a study, simply select it
again and it will be unchecked and erased from the chart, or the close button (x) on
the right of the lower study can be used to erase the technical from the chart.
The last set is the input parameter used to calculate each technical study. Historically,
technical analysts have used the last price for their calculations. The JavaChart
provides the user with the option of four different input parameters: last, high, low,
and Modal Point. The Modal Point (By-Time or By-Volume) will depend on the chart
type that is chosen. The user can thus compare and see which input parameter is
best suited for one's analysis.
5
ProSticks.com Ltd.
Upper Technical Studies:
Moving Average – Simple (SMA)
Moving Average – Exponential (EMA)
Moving Average – Weighted (WMA)
Bollinger Bands (BOL)
Parabolic Stop-and-Reversal (SAR)
Moving Average Envelope (MAE)
Keltner Channels (KC)
Ic himoku Kinko Hyo (IKH)
ProSticks Java Chart User Manual
Lower Technical Studies:
Relative Strength Index (RSI)
Stochastic (STC)
Momentum (MTM)
Moving Average Convergence Divergence (MACD)
Volume (VOL)
Volume+ (VOLP)
Average Directional Index (ADX)
On Balance Volume (OBV)
Money Flow Index (MFI)
Williams %R
Rate of Change (ROC)
Volatility (VOLA)
Volume Accumulation Oscillator (VAO)
Commodity Channel Index (CCI)
Average True Range (ATR)
Technical Parameters
The parameters associated with each technical
study can be set with the third button (from
the left) on the function panel. Once pressed, a
pop up menu will appear (as on the right).
A technical study will appear in the top dropdown box in the Parameters menu only if it has
been plotted on the chart. To change the input
parameters of a particular technical study,
select that particular study from the drop-down
box and modify the values in the 5 values
boxes, if applicable. Depending on the study,
the number of input parameters that can be
modified ranges from 0 to 5. Once the changes
have been made, press the Apply button. To
exit out of this menu, click the close (x) or
Cancel button.
The second drop-down box in the menu is used for technical studies that include
moving averages in its calculations (e.g. Relative Strength Index, Stochastic).
6
ProSticks.com Ltd.
ProSticks Java Chart User Manual
Support & Resistance
The fourth button (from the left) on
the function panel, a graph, is used to
bring up a list of support and
resistance tools.
The Fibonacci Numbers 0.382, 0.500,
0.618, 1.00, 1.618, etc. are used by
many in the market to identify support
and resistance levels. The ProSticks
JavaChart provides the following
functions utilizing the Fibonacci
numbers:
Fibonacci Retracement
The Fibonacci Retracement
function takes two input
points to draw the potential
support/resistance levels. First,
click on a high point or low
point on the chart to set the
first point of the Fibonacci
Retracement function. Then as
the cursor is dragged to
another point on the chart,
blue horizontal lines,
signalling key Fibonacci
Retracement levels (i.e. 0.00,
0.382, 0.500, 0.618, 1.00,
and 1.618), will appear and
move as the cursor is moved.
Once the second point, or
level, is found, click on the chart once more to finalize the coordinates of the two
points. The blue horizontal support and resistance lines will then preserve their
positions and one can then continue on with the analysis.
For reference, the Fibonacci support and resistance price levels are displayed on the
blue horizontal lines as well as in the technical panel on the upper-left corner of the
chart.
The parameters for the Fibonacci Retracement function can be modified in the
Parameters menu.
To clear the analysis, simply uncheck it or select Clear Fibon./Gann in the drop-down
menu. The last function will clear all support and resistance tools from the chart.
7
ProSticks.com Ltd.
Fibonacci Projection
ProSticks Java Chart User Manual
The Fibonacci Projection
function projects the
Fibonacci Retracement
levels of one retracement
onto any other point in
time. The function takes
three input points to draw
the projected rise or fall of
the price. First, click on a
high (low) point on the
chart to set the first point
of the Fibonacci Projection
function. Next, find a
second point, this time a
low (high) and click on the
chart once more. Then as
the cursor is dragged to
another point on the chart,
the projection point, purple horizontal lines, signalling key Fibonacci Retracement
levels (i.e. 0.618, 1.0, and 1.618), will appear and move as the cursor is moved.
Once the projection point is found, click on the chart once more to finalize the
coordinates of the three points. The purple horizontal support and resistance lines will
then preserve their positions and one can then continue on with the analysis.
The parameters for the Fibonacci Projection function can be modified in the
Parameters menu.
To clear the analysis, simply uncheck it or select Clear Fibon./Gann in the drop-down
menu. The last function will clear all support and resistance tools from the chart.
Fibonacci Arc
The Fibonacci Arcs are centered
around the first point and spaced
at intervals of 38.2%, 50.0%,
and 61.8% of the distance
between the two points chosen.
The function thus takes two input
points to draw the support and
resistance levels projected by the
arcs. First, click on a high (low)
point on the chart to set the first
point of the Fibonacci Arcs
function. Then as the cursor is
dragged to another point on the
chart, green arc lines, signalling
key Fibonacci Retracement levels
(i.e. 0.382, 0.500, and 0.618),
will appear and move as the cursor is moved. Find a second point, this time a low
(high), and click on the chart once more. The green support and resistance arc lines
will then preserve their positions and one can then continue on with the analysis.
The parameters for the Fibonacci Arcs function can be mo dified in the Parameters
menu.
To clear the analysis, simply uncheck it or select Clear Fibon./Gann in the drop-down
menu. The last function will clear all support and resistance tools from the chart.
8
ProSticks.com Ltd.
ProSticks Java Chart User Manual
Fibonacci Fans
The Fibonacci Fans draws
an invisible vertical line
starting from the end point
back to the level of the
starting position. This line
is then divided up into the
Fibonacci ratios. This
function takes two input
points to draw the support
and resistance levels
projected by the fans. First,
click on a high (low) point
on the chart to set the first
point of the Fibonacci Fans
function. Then as the
cursor is dragged to
another point on the chart,
blue fan lines, signalling
key Fibonacci Retracement levels (i.e. 0.382, 0.500, and 0.618), will appear and
move as the cursor is moved. Find a second point, this time a low (high), and click on
the chart once more. The blue support and resistance fan lines will then preserve
their positions and one can then continue on with the analysis.
The parameters for the Fibonacci Fans function can be modified in the Parameters
menu.
To clear the analysis, simply uncheck it or select Clear Fibon./Gann in the drop-down
menu. The last function will clear all support and resistance tools from the chart.
Fibonacci Zones
Fibonacci Time Zones are
a series of vertical lines
that act as significant time
periods where there may
be strong resistance or
support and a reversal of
the prevailing trend may
be in store. The lines are
spaced at the Fibonacci
intervals of 1, 2, 3, 5, 8,
13, 21, 34, etc. The
uniqueness of these
Fibonacci numbers comes
from the fact that the
current number in
question is the sum of the
previous two.
In the JavaChart, only one input point is needed and that determines the starting
point (i.e. 1). Once the user clicks on the chart at the starting point, the time zones
(lines) will be calculated and displayed.
To clear the analysis, simply uncheck it or select Clear Fibon./Gann in the drop-down
menu. The last function will clear all support and resistance tools from the chart.
9
ProSticks.com Ltd.
ProSticks Java Chart User Manual
Fibonacci Ruler
The Fibonacci Ruler is used
to observe possible turning
points for the current
trend or correction. It also
indicates
possible
time
movements
from
two
marked points on a chart.
A start point and end point
are necessary to draw the
Fibonacci Ruler on the
JavaChart. First, find a
start point and click on the
chart. The starting point is
generally
an
important
high or low. Then as the
mouse moves on the chart,
the Fibonacci Ruler will
appear. Red vertical lines
will mark the Fibonacci Ruler lines. The lines are based on the distance between the
start and end points. The Fibonacci Ruler uses 0.382, 0.500, 0.618, 1.272 and 1.618
as possible ruler settings. Find an end point and click on the chart once more. The
Fibonacci Ruler will be preserved and one can then continue on with the analysis.
To clear the analysis, simply uncheck it or select Clear Fibon./Gann in the drop-down
menu. The last function will clear all support and resistance tools from the chart.
Gann Lines
Gann Angles are drawn
between an important high
and low, or vice versa at
various angles. Considered
the most important, by
Gann, is the 45-degree
angle. The 1 x 1 trend line
indicates a bull market if
prices are above the trend
line or a bear market if
below. If this trend line is
broken, it signifies a major
reversal is in store.
Moreover, if one angle is
penetrated, expect prices
to find support or
resistance at the next
angle. There are nine
angles that Gann identified:
1
1
1
1
1
2
3
x8
x4
x3
x2
x1
x1
x1
=
=
=
=
=
=
=
82.50
75.00
71.25
63.75
45.00
26.25
18.75
degrees
degrees
degrees
degrees
degrees
degrees
degrees
10
ProSticks.com Ltd.
4 x 1 = 15.00 degrees
8 x 1 = 7.500 degrees
ProSticks Java Chart User Manual
Note that in order for the 1 x 8, 1 x 4, 1 x 3, etc. to match the actual Gann angles on
the chart, the x- and y-axes must be equally calibrated (i.e. one unit on the x-axis
must be the same distance as one unit on the y-axis).
To use the function, first select an important high or low point and click once on the
chart. Then create a trend line (45-degree angle line) and click once more on the
chart. The Gann lines would be set and one can continue on with the analysis.
For an in-depth explanation and discussion on the Fibonacci numbers and the Gann
theories, please visit our Education section.
Line Tools
The fifth button (from the left) on
the function panel, with a diagonal
line, is used to bring up a list of line
drawing functions. They include the
following:
Draw Line
The Draw Line function is
used to draw a line on
the chart anywhere the
user chooses. This
function is useful for
drawing custom trend
lines and support and
resistance levels to
facilitate the analysis.
To use the function, first
find a starting point.
Click on the chart once.
Then drag the mouse to
the end point. A line will
appear and will follow
wherever the mouse
cursor moves to. Once
the end point is confirmed, click on the chart once again and the line will be drawn.
To erase the line, select the Clear Last Line function in the drop-down menu. To clear
all of the lines, simply choose the Clear All Lines function in the drop-down menu.
11
ProSticks.com Ltd.
ProSticks Java Chart User Manual
Trend Line
The Trend Line function
is similar to the Draw
Line function. This
function is useful for
drawing custom trend
lines and support and
resistance levels to
facilitate the analysis.
To use the function, first
find a starting point.
Click on the chart once.
Then drag the mouse to
the end point. A line will
appear and will follow
wherever the mouse
cursor moves to. Once
the end point is
confirmed, click on the chart once again and the line will be drawn and extended to
the price axis. The most current price (of the trend line) would also be displayed on
the price axis highlighted in green.
To erase the line, select the Clear Last Line function in the drop-down menu. To clear
all of the lines, simply choose the Clear All Lines function in the drop-down menu.
Parallel Line
The Parallel Line function
is similar to the Draw
Line function. This
function is useful for
drawing price channels
and support and
resistance levels to
facilitate the analysis.
To use the function, first
find a starting point.
Click on the chart once.
Then drag the mouse to
the end point. A line will
appear and will follow
wherever the mouse
cursor moves to. Once
the end point is
confirmed, click on the chart once again and the line will be drawn. At this point,
another line, parallel to the one drawn, and of equal length, will appear. Drag the line
to a desired position on the chart. Then click on the chart once more for the line to be
set.
To erase the line, select the Clear Last Line function in the drop-down menu. To clear
all of the lines, simply choose the Clear All Lines function in the drop-down menu.
12
ProSticks.com Ltd.
ProSticks Java Chart User Manual
Text Box
The middle button (sixth
from the left) on the
function panel is used to
write text messages on
the chart. Select the
Draw Textbox option and
then click on the chart
where the message is to
be written. A textbox will
then appear. Place the
mouse cursor inside this
textbox and click once.
Now type your message.
Once finished, press
ENTER. The textbox will
disappear and the
message will be written
on the chart in blue.
To erase the previous written message, select Clear Last Text from the drop-down
menu. To erase all text on the chart, select Clear All Text from the drop-down menu.
Chart Compare (Rebase in same)
The seventh
button of the
function panel
is used to
compare the
performance
of the current
security with
another
security.
Once the
function has
been selected,
a new window
(Chart
Compare) will
appear, as
above. The
Reference
Date is the
date to start
to comparison (i.e. both performing 0% return). The format is dd/mm/yyyy. Select
the security to compare by entering the exchange and symbol in the Exch and Code
fields, respectively. Click on the Apply button to begin the comparison. The
performance of both securities will be displayed on the top-left corner of the price
chart. The figures will change accordingly to the specific date the mouse cursor is on.
Figures used for comparison is the closing price.
To revert back to the normal price chart, click on the Cancel button in the Chart
Compare window.
13
ProSticks.com Ltd.
ProSticks Java Chart User Manual
Inverse Chart
The eighth function
(from the left) on the
function panel is used to
invert the vertical axis.
Some traders prefer to
study a chart that slopes
upward, which they find
easier for identifying
trends and patterns.
Click on the Invert
function once to invert
the chart. To revert back
to the original, click on
the button once more.
Log Scale
The ninth button (from the
left) on the function panel
is used for changing the
scale of the price chart
from an absolute scale to a
logarithmic scale. A
logarithmic scale
emphasizes the percentage
change between prices. For
example, on a logarithmic
scale, a change from 1 to 2
would have the same
vertical distance as a
change from 10 to 20. In
absolute form, the vertical
distance would be ten times
greater for the latter. To change to the logarithmic scale, click on the Logarithmic
Scale function button once. To revert back to the absolute scale, click on button once
more.
14
ProSticks.com Ltd.
ProSticks Java Chart User Manual
Detach
The tenth button (from the left) on the function panel is the Detach Function. A new
window will be created when the user clicks on this button as the chart can now be
maximized. To attach the chart back to the original browser, either click on the
detach button once more or close (x) the window.
Next & Previous Page
The last button (right arrow) on the function panel is used to scroll to the next page
of functions in the JavaChart.
The next page of the function panel has six buttons in total and the first one (left
arrow) is used to scroll back to the first page of functions in the JavaChart.
Export to Gif
The second button on the second page of the function panel is used to copy the price
chart with all of the performed analyses, drawn trend lines, and text messages to an
image in .gif format. The image will be outputted to a new window.
15
ProSticks.com Ltd.
ProSticks Java Chart User Manual
E-mail
The third button
on the second
page of the
function panel is
an email function
one can use to
send the price
chart with all of
the performed
analyses, drawn
trend lines, and
text messages to
anyone for
reference. Click on
the Send Now
button to send the
email. The email
box will disappear
once the email
has been sent.
Data Adjustment
The fourth button on the second page of the function panel is the Data Adjustment
function. It is used to show stocks price adjustment due to ex-dividend. To show to
the Data adjustment, click on the Data Adjustment function once. To revert back to
the non-adjustment chart, click on the button once more.
16
ProSticks.com Ltd.
ProSticks Java Chart User Manual
Distribution
The fifth button on the second page of the function panel, a histogram, is used to
display the price distribution for any one period. This function is only available with
the ProSticks-By-Time and ProSticks-By-Volume chart types.
For a ProSticks-By-Time
chart, the price distribution
will be calculated with the
ProSticks-By-Time method.
Conversely, the price
distribution will be calculated
with the ProSticks-ByVolume method if the chart
type is ProSticks-By-Volume.
For a detailed explanation
and discussion of the
distribution concept, please
visit our Education section.
To use this function, the
distribution button has to be selected. Once selected, choose a bar to display the
distribution for and click on the body once. A new pop-up window will appear (as
above) with the price distribution.
Simply press the close (x) button to close the distribution window.
Divergence
The sixth
button on the
second page of
the function
panel is used to
identify the
stocks with
divergence.
The divergence
is one of the
most powerful
and widely
believed
concepts in
technical
analysis. It is a
key concept
behind many
indicator
buy/sell signals.
There are two
types of divergences: positive and negative. In general, a positive divergence occurs
when the indictor advances and the underlying security price declines (below). A
negative divergence occurs when an indicator declines while the price advances.
First, add the RSI and Stochastic indicators onto the chart, then click the Divergence
button. Once the function has been selected, the divergence lines will display onto
the price chart and the indicator. To clear the line, simply click the Divergence
button once more.
17
ProSticks.com Ltd.
ProSticks Java Chart User Manual
What-If-Analysis
The seventh button on
the second page of the
function panel is the
What-If Analysis function.
It is used to help one
forecast how the
technical indicators will
react to a change in price,
which the user inputs.
Up to five periods ahead
can be forecasted.
First, select the What-If
Analysis button. A new
window will appear
(What-if Analysis), as
above. Input your own
values or simply input
one value into any field and the rest will be randomly calculated. Once all of the
figures have been inputted or calculated, click on the Apply button to c onfirm the
values. A new bar will appear, as above. The technical studies will also take these
new values to calculate the forecasted period. To exit this function, either click on the
Cancel button or close (x) the new window.
ProSticks vs Candle
The second last button on
the second page of the
function panel is used to
compare the candlestick
charting patterns with
ProSticks. Once selected,
a new window will appear
with the latest charting
pattern. Candlesticks will
be shown for ProSticks
charts and vice-versa.
One can thus confirm
candlestick signals with
ProSticks' theories
without having to
continuously change
chart types. To exit this
function, simply close (x) the new window.
Save Custom Settings
This function allows for saving the custom settings (i.e. Technical Indicator and
Parameter Setting) in the java chart. Setting will be retrieved automatically next
time the system is used.
18
ProSticks.com Ltd.
ProSticks Java Chart User Manual
3) Technical Panel
The technical panel is for outputting upper technical calculation values and
Fibonacci calc ulation values. The values will change to the date the mouse cursor
is focused on and will change as the cursor moves.
4) Chart Panel
The chart panel displays the price chart and any technical study (upper or lower)
the user selects. Upper technical studies overlay the price chart while lower
technical studies will append to the bottom of the chart. The chart will decrease in
size as a result. Up to 3 upper technical studies and 3 lower technical studies can
be performed at any one time.
5) Price Panel
The price panel displays the price values, along with ProSticks proprietary
information. The panel will display price values corresponding to the position of
the mouse cursor (i.e. date in time). The price values will change accordingly as
the mouse cursor moves within the chart panel.
The price panel includes the following functions:
The first two buttons on the left are zoom functions performed on the chart. The
left button zooms out, expanding the chart, while the right button zooms in,
contracting the chart.
The last two buttons are to shift the chart either left or right. The left button
shifts the chart left and back in time, while the right button shifts right and
forward in time.
19