1
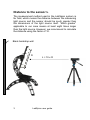
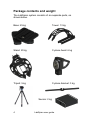
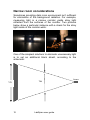
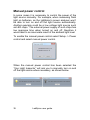
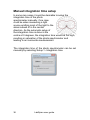
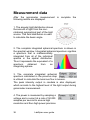
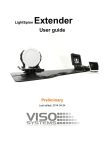
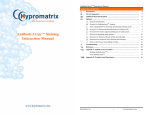
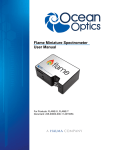
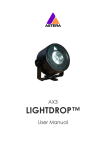
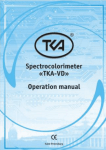
LabSpion Patent pending User guide Last edited: 09 September 2015 Dimensions 122cm 150cm Maximum lamp length 80cm 162,5cm 8cm C-plane base height 9,5cm LabSpion base height 65cm 45cm 190cm © 2007 Viso Systems ApS, Denmark All rights reserved. No part of this manual may be reproduced, in any form or by any means, without permission in writing from Viso Systems ApS, Denmark. Information subject to change without notice. Viso Systems ApS and all affiliated companies disclaim liability for any injury, damage, direct or indirect loss, consequential or economic loss or any other loss occasioned by the use of, inability to use or reliance on the information contained in this manual. Distance to the sensor L The measurement method used in the LabSpion system is far field, which means the distance between the measuring light source and the sensor should be much greater than the dimensions of the light source itself. “Much greater” applicable to our case means at least eight times larger than the light source. However, we recommend to calculate the distance using the factor of 10. Black backdrop wall D L = 10 x D 3 LabSpion user guide Package contents and weight The LabSpion system consists of six separate parts, as shown below. Base: 25 kg Tower: 13 kg Stand: 20 kg C-plane head: 6 kg Tripod: 5 kg C-plane bracket: 3 kg Sensor: 2 kg 4 LabSpion user guide Package dimensions and their weight Shipping packages Shipping dimensions Weight 1. Stand + Sensor + Cables 101 x 58 x 57 cm 30 kg 2. Tower + C-plane Gonio + Bracket + Tripod 3. Base 118 x 32 x 42 cm 28 kg 55 x 55 x 32 cm 28 kg Total shipping weight: 86 kg. The shipment is done in a total of three packages. 5 LabSpion user guide Contents Introduction ........................................................................ 9 About the LabSpion ........................................................ 9 System content .............................................................. 9 About this document..................................................... 10 Installation ....................................................................... 11 Measurement room ...................................................... 11 Narrow room considerations ......................................... 11 Software installation ..................................................... 14 Connecting power ........................................................ 15 Connecting USB ........................................................... 16 Connecting LabSensor ................................................. 17 Connecting the C-plane goniometer ............................. 18 Connecting a lamp power ............................................. 19 Connecting diagram ..................................................... 20 Making measurements ..................................................... 21 Alignment of the sensor ................................................ 21 Alignment of the lamp ................................................... 22 Adjustment of the lamp holder arm ............................... 24 Mounting of fixtures with a static base .......................... 27 Photometric parameters and corrections. ..................... 28 Radio waves precautions ............................................. 30 Quality selection ........................................................... 31 Fully automatic ............................................................. 32 6 LabSpion user guide Manual power control ................................................... 35 Manual integration time setup....................................... 36 Independently running spectrometer ............................ 37 Measurement data ........................................................... 38 Power details ................................................................ 41 CRI details.................................................................... 43 Spherical limit ............................................................... 46 Attaching pictures ......................................................... 47 Saving measurement ................................................... 48 Exporting to IES/LDT .................................................... 49 Exporting to PDF .......................................................... 50 Exporting to PNG ......................................................... 50 Exporting to CSV .......................................................... 52 Emailing measurement ................................................. 53 Specifications................................................................... 54 7 LabSpion user guide Safety Information Warning! This product is not for household use. Read this manual before installing and operating the controller, follow the safety warnings listed below, and study all the cautions in the manual. Preventing electric shocks Make sure grounded. the power supply is always Use a source of AC power that complies with the local building and electrical codes, that has both overload and ground-fault protection. If the controller or the power supply are in any way damaged, defective, wet, or show signs of overheating, disconnect the power supply from the AC power and contact Viso Service for assistance. Do not install or use the device outdoors. Do not spray with or immerse in water or any other liquid. Do not remove any covers or attempt to repair the controller or the power supply. Refer any service to Viso. Disposing of this product Viso products are supplied in compliance with Directive 2002/96/EC of the European Parliament and of the Council of the European Union on WEEE (Waste Electrical and Electronic Equipment), as amended by Directive 2003/108/EC, where applicable. Help preserve the environment! Ensure that this product is recycled at the end of its lifetime. Your supplier can give details of local arrangements for the disposal of Viso products. 8 LabSpion user guide Introduction About the LabSpion The LabSpion is a revolutionary new far field goniometer system with a spectrometer sensor that makes it possible to measure all photometric measurements quickly and efficiently. The Light Inspector software enables to quickly measure, save and export the newly obtained data. System content C-Plane goniometer with lamp bracket LabSpion base with integrated gonio-drivers and a power analyser LabSensor with a spectrometer sensor and an integrated laser to measure the distance to the LabSpion. Tripod for LabSensor. 3 point base table for LabSpion base The LabSpion package contains the following items: LabSpion goniometer base C-plane goniometer with a lamp bracket 3 points base table LabSensor Tripod for the LabSensor Light Inspector USB stick (Windows) 5 m IEC power cord 9 LabSpion user guide 5 m USB cable 20m RJ45 cat 5 for connection between LabSpion and LabSensor About this document These guidelines describe the installation process of the LabSpion controller followed by the typical measurements of various light sources. 10 LabSpion user guide Installation Measurement room To get the most accurate results it is important to consider the measurement room as well. The LabSpion system is used in a dark room or in an open environment. When using in an open environment the backside behind the goniometer must be of a black non-reflective surface as shown below. Open environment (top view) h Goniometer Sensor w L Recommended black back wall size Lamp size L=Senor distance w=h=(width and height) 0,25m 2,5m 1.75m 0,50m 5m 3,5m 1,00m 11 10m user guide LabSpion 7m Narrow room considerations Sometimes providing dark room environment isn’t sufficient for elimination of the background radiation. For example, measuring light in a narrow corridor yields stray light reflected from the surfaces of the corridor. Two pictures below show a particular instance with a check for the stray light inside of the corridor walls: Stray light One of the simplest solutions to eliminate unnecessary light is to set an additional black shield, according to the schematic: Sensor 1m 1.5 12 LabSpion user guide The opening size has a very simple consideration behind it. Since the maximum diameter of the measured light source is 1.5 m, the aperture at a half-way distance is then 75 cm. The averaging of it yields a 1 m aperture. The practicalities of cutting out such an aperture along with the final result are shown below: 13 LabSpion user guide Software installation Before you can start using the LabSpion, the “Viso Light Inspector” software must be installed. It is supported on all windows platforms. Use the following link to download the latest version: http://www.lightdataserver.com/software/Viso%20Systems/Ligh tInspector.htm Please make sure the LabSpion is not connected to the computer during software installation. Run the msi file and follow the installation instruction. USB drivers are automatically installed. Your measurements are not lost when installing newer versions or uninstalling. All measurements will always remain in your document folder. 14 LabSpion user guide Connecting power The LabSpion comes with a standard IEC power-in connector and with a standard euro power cable, but any power cable can be used as the Labspion supports any outlet voltage from 90-260VAC. The power-in connector supplies power both to the goniometer motor and to the power analyser and then subsequently to the measuring light source. It means that the power is identical to the one of the measuring light source. AC power supply cable plug Warning: Risk of an electric shock! Plug installation shall be performed by a qualified electrician. A grounding-type (earthed) power plug that fits the local power outlet must be used. You can acquire an IEC power cable with a suitable grounding-type plug from most of consumer electronics stores. When installing the plug connect pins as follows: Yellow and green wire to grounding (earth) Blue wire to neutral Brown wire to live 15 LabSpion user guide Connecting USB The LabSpion is connected to the computer using a USB connector type B. A 2m USB cable type A to B is included with the LabSpion, however any USB cable supporting USB2.0 can be used. The USB provides communication and power to the LabSpion’s main board processor, power analyser and photo spectrometer, meaning that the photo spectrometer can be used only with the connected USB. Start the “Viso Light Inspector” software after having connected the USB; the connection to the Labspion will be established automatically. A successful connection is shown with a green “Connected” icon in the upper right corner of the “Viso Light Inspector” software. You can connect and disconnect the USB without restarting the “Viso Light Inspector” software, as the connection is always established automatically as soon as the USB connector is plugged in and vice versa. 16 LabSpion user guide Connecting LabSensor The LabSpion is connected to the LabSensor with a RJ45 cable, which is supporting the transfer of data and power between the two parts. Warning Do not connect the LabSensor to the C-plane motor connector, this could damage the LabSensor. 17 LabSpion user guide Connecting the C-plane goniometer The C-plane goniometer is connected to the LabSpion base through a RJ45 cable. The LabSpion will automatically detect the C-plane goniometer. Warning Do not connect the C-plane motor to the LabSensor connector, this could damage the LabSpion. 18 LabSpion user guide Connecting a lamp power The LabSpion has a built-in power analyser and a power switch. The power switch is used to switch off the lamp before every measurement, so that the values of the ambient light are obtained and subsequently subtracted from final measurements. The maximum current supported by the lamp is 3A, which is 660W at 220VAC and 330 at 110VAC. AC power supply cable plug Warning: Risk of electric shock! Plug installation shall be performed by a qualified electrician. A grounding-type (earthed) power plug that fits the local power outlet must be used. You can acquire an IEC power cable with a suitable grounding-type plug from most of consumer electronics stores. When installing the plug connect pins as follows: yellow and green wire to grounding (earth) blue wire to neutral brown wire to live 19 LabSpion user guide Connecting diagram Below there is a connection diagram showing the different connections in order to make the system operational. Lamp Power Mains In 20 LabSpion user guide Making measurements Alignment of the sensor Before making any measurements it is important to place the sensor at the correct distance and to align it accordingly. The LabSpion is a far field goniometer system, which means that the distance between the sensor and the lamp is determined by a lamp size. The recommended distance between the sensor and the goniometer is 10 times larger than the lamp length/diameter. The distance can be easily configured using the built-in laser in the LabSensor. IMPORTANT!! The distance should be measured to the centre of rotation of the LabSpion goniometer, use the centre stick as the laser target. 21 LabSpion user guide Use ”Alignment stick” Laser Distance >= lamp length x10 (minimum x8) Centre of rotation Alignment of the lamp Aligning the sample lamp is key in ensuring precise measurements. Specific tools designed to align the lamp relative to the centre of rotation, namely centre alignment bracket and an aligning laser box, are included with the LabSpion system. First place the centre alignment bracket in the middle of the rotating opening. It is designed in such a way that it will always sit in the middle of the opening. Then place the laser box on the base of the LabSpion and make sure it is centred relative to the centre bracket as shown in the pictures below. alignment bracket 22 centred laser box LabSpion user guide The laser box will shoot two perpendicular beams upwards, which form a crossing. That is the exact centre of rotation – so the measuring lamp has to be aligned accordingly. It is important to notice that sometimes it can be a little tricky figuring out the centre of the lamp. For example, in the picture above the centre of the lamp is the plane of the LED chip – the rest is just metalic housing. Another example is in the picture below: a flat LED panel, the laser beam is just on the brink of it. turned on laser 23 LabSpion user guide Adjustment of the lamp holder arm There can be cases when a measuring lamp is very spacious, for instance, a high bay lamp. The large horizontal dimensions of the lamp will make it impossible to align the lamp with the centre of rotation. Therefore the default geometry of the LabSpion has to be modified. Consider the following two pictures: Default setup Extended setup Centre Centre The figure to the left is the default configuration of the LabSpion, whereas the right drawing shows the modified version of the LabSpion’s geometry. The arm with the lamp holder frame is tilted backwards leaving more room for horizontally expansive lighting fixtures. To tilt the arm backwards you need to replace two long screws: the one on top of the arm, which is holding the head, and the other one connecting the arm with the base. There are two placements for the screws: a default position 24 LabSpion user guide is shown in the picture below, to the left. The second position is shown in the same picture to the right. Default setting Adjusted setting . An example of a high bay lamp placement is presented below: Default setup Centre 25 LabSpion user guide Extended setup Centre Another example of measuring light from a street lighting fixture, where the weight of the lamp is unevenly distributed. The centre mass point of such a lamp is not coinciding with the central alignment of the LabSpion. To balance the central position of such a lighting fixture, a counter weight is used. Look at the picture below. Counter weight 26 LabSpion user guide Mounting of fixtures with a static base It is convenient to keep the base of the LabSpion still when mounting various light sources for measurement. Therefore the newest version of the system comes with a magnetic lock. It is located on the back side, right in the middle of the base of the LabSpion, as shown on pictures below: Once you push the lock, you fixate the base in stillness. An animated message appears on screen of the Light Inspector software, bringing your attention to the fact that the base is locked (see pictures below). Now you can easily mount and align the fixtures. In order to proceed further with measurements, make sure to release the base lock. 27 LabSpion user guide Photometric parameters and corrections. To calculate the correct lighting outputs for further visualisation, it is necessary to insert the dimensions of the measured lighting fixtures (bulbs, spots and panels) in the table as shown in the figures. The table is found under Edit > Photometric-> Dimensions. This feature enables the data files to reflect the luminous and physical dimensions for an accurate 3D visualisation in lighting software. The photometric adjustments introduced in the relevant compartment of the same table are useful when measuring light sources with asymmetric or tilted intensity distribution curves; for example, outdoor or automotive lighting fixtures can yield slight tilts, which are corrected by the software, as shown in the relevant picture. 28 LabSpion user guide “Correct angle” adjusts the off-centred intensity distribution relative to the 0 ̊ axis, so that it becomes symmetric. “Correct 0 ̊ intensity” equates the intensities at the 0 ̊ axis for all of the c-planes during a measurement, as sometimes the intensity values for different c-planes can vary due to goniometer misalignment. “Correct asymmetry” modifies the profile of the distribution to be vertically symmetric. Such a symmetry is required for further calculation of UGR (unified glare rating) in an LDT editor. However, this modification should not be applied for light sources with off-centred beams, like street lighting systems. “Auto shift C-plane” allows the software to automatically choose and display the C-plane with the highest value of the intensity distribution in candela. This option is useful when the data files are opened in Dialux or Relux. “Override” option can be used to modify the flux in lumen, so that the exported pdf report shows the desired value in accordance with the customer’s desires (for instance, 110 lm in the report versus 109 lm from the measurement). It is important to keep in mind that the new flux value also affects the calculated intensity in candela. However, in the original data file the measured values will always be displayed in parenthesis above the overridden numbers. 29 LabSpion user guide At present, it is challenging to measure a lighting fixture, which emits light in 4π (all directions), as the goniometer structure can block some light. However, to overcome this difficulty the front and back of the lighting fixture are measured separately. The two intensity distributions are then merged together presenting an overview of a fully-spherical illumination. Thus, the “insert measurement” button will open a dialogue for the additional data file, and then the two curves will be combined. Radio waves precautions It is recommended not to have a receiver or a transmitter of radio waves in the vicinity of a working Labspion. Thus it is advisable to keep your smartphones and other electronic devices away from the system as they can interfere with the spectrometer and perturb the final results. 30 LabSpion user guide Quality selection It is possible to manually select the measurement quality beforehand in Setup -> Measurement quality. The “Viso Light Inspector” uses the low resolution by default. Yet, there are three levels of complexity: low, medium and high. Each quality level increases the number of measurements made during the goniometer operation, it also increases the photo spectrometer integration time whilst lowering the noise level of the photo spectrometer measurements. Increasing the quality results in substantial measuring time extension. 31 LabSpion user guide Fully automatic The “Viso Light Inspector” software makes fully automatic measurements by default. It adjusts the photo spectrometer to the background light environment by firstly turning off the light source and secondly measuring the background light level, which is subsequently subtracted from the following measurements. Therefore the measurements can be done even in a lit room. The adjustment of the exposure time of the photo spectrometer (also known as the integration time) is also done automatically. A measurement is simply started by clicking on the play icon. Then the integration time is set automatically. The ambient light level is automatically measured by turning off the light source. The light source is then rotated at 180 degrees to prepare for measurement. The power is then measured and stored. 32 LabSpion user guide The complete 360 degrees angular light field is then measured and the beam angle is calculated. Light sources with narrow beam angles can have insufficient number of measurements in order to generate an accurate result. In such a case the “Viso Light Inspector” software will ask you automatically, whether you would like to have a more detailed scan of the beam section. The increase in measurement quality after a detailed rescan of the narrow beam section can be seen below. Before a detailed auto re-scan 33 LabSpion user guide After a detailed auto re-scan Upon completion the main characteristics are calculated and displayed: the total luminous flux in lumen, the colour rendering index CRI, the efficiency in lumen/watt, the peak light intensity in candela, the power and power factor. Further details about the measurement data can be found in the chapter “Measurement data”. 34 LabSpion user guide Manual power control In some cases it is necessary to control the power of the light source manually. For example, when measuring flash light on batteries, as the LabSpion’s power analyser won’t be able to turn on and off the light source automatically. Another example could be a low voltage light source such as LED chips. The external power supply of such chips has low response time when turned on and off, therefore it would lead to an inaccurate result of the ambient light level. To enable the manual power control select Setup -> Power control and select manual power control. When the manual power control has been selected the “Viso Light Inspector” will ask you to manually turn on and off the light source when necessary, as shown below. 35 LabSpion user guide Manual integration time setup In some rare cases it could be desirable to setup the integration time of the photo spectrometer manually. One case could be when measuring a light source emitting most of the light to the sides instead of in the central direction. As the automatic setup of the integration time is done in the centre at 0 degrees, the integration time would be too high, resulting in saturation of the photo spectrometer and leading to an inaccurate measurement. The integration time of the photo spectrometer can be set manually by selecting Setup -> Integration time. 36 LabSpion user guide Independently running spectrometer The photo spectrometer can also be used to run independently to test different light sources that might be too large for a complete goniometer measurement or to have a real-time update on how the light source behaves over time. To start the photo spectrometer independent operation click on the spectrum scan icon. During the independent run mode the light intensity output in candela, CRI, and colour temperature are being continuously updated. The integration time can be changed during the free run scan, as explained in the previous chapter to ensure a correct resolution. NOTE: After changing the photo spectrometer integration time the spectrum should be “Calibrated to ambient light”. 37 LabSpion user guide Measurement data After the goniometer measurement is complete the following results are displayed. 1. The angular light distribution shows the amount of light from the nonrotational symmetrical part of the light source. This field distribution is used to calculate the beam angle. 2. The complete integrated spherical spectrum is shown in the spectral window. Integrated spherical spectrum signifies a spectrum that is mathematically integrated from all of the individual spectra in the spatial distribution. Thus it represents the equivalent of a spectrum obtained from an integrating sphere. 3. The complete integrated spherical spectrum calculated in the previous step is utilised to calculate the luminous flux in lumens. The peak intensity output in candela is also displayed, which accords to the highest level of the light output during goniometer measurement. 4. The power is measured by sampling a voltage and a current at a rate of 50.000 samples per second to ensure high resolution and thus high power precision. 38 LabSpion user guide The power factor (PF) indicates the quality of power consumption, where 1.0 being the best (it is generally achieved with a pure resistive load such as a tungsten lamp) and 0.0 being the worst. For a satisfactory level, the PF value should be located between 0.5 – 1.0. You can refer to the quality chapter in order to figure out the power standards for different countries and regions. 5. The efficiency in lumens per watt is calculated by dividing the luminous flux in lumens to the power consumption. The result is displayed in the efficiency bar with a corresponding colour, where 100 lumen/watt it shown as the outmost green. The standard maximum value of 100% efficiency is 683 lumen/watt. 6. The CRI is calculated using the standard 8 reflectance colours in order to figure out the ability of the light source to transmit colours, thus indicating the quality of the radiated light. 0 being the worst quality and 100 being the best quality equal to that of the Sun. The CRI can only be used for white light. If the CRI is not indicated that means that either the radiated light does not meet the criteria for white light or that light levels are too low to be measured. 7. The photometric colour temperature indicates the colour of the white light and is displayed in kelvin. Where 6000K is considered as cold and 2500K as warm. The Kelvin scale was initially derived from the temperature of the tungsten filament. Therefore the high temperature of the filament is considered 39 LabSpion user guide as cold light and vice versa. If the colour temperature is not displayed, it means that either the radiated light does not meet the criteria for white light or that light levels are too low to be measured. 8. At a closer look, the radiated colour is shown with x and y coordinates in the CIE1931 diagram. The diagram illustrates all visible to the human eye colours. It is based on an experiment conducted in 1931 with a number of participants aiming at figuring out the eye’s perception of colour. The black line in diagram is called the black body curve. It illustrates all colours that are defined as white colours from warm to cold. The point corresponding to the measured colour is shown with a black cross. It can be used to check the whiteness of a colour, by checking how close it is to the black body curve: the closer it is to the black body curve the more accurate is the white colour. 40 LabSpion user guide Power details A detailed voltage and current data can be viewed by clicking on the scope button or selecting View->Power details. The realtime data of the voltage and current is shown in the power details window: the green line illustrates voltage (it should have a sinus curve). The upper part of the sinus curve can sometimes have a flat top, which is explained by the power grid distortions. The current is presented with a red line, it is displaying how the current is consumed by the light source. The power factor is an indication of how well the current is consumed through a voltage period. The power factor is calculated according to the following principle: the value of the actually consumed power is divided by the product of the voltage and the current. PF = Power / (Voltage x Current) = 5,2 / (238,6 x 0,035) = 5,2 / 8,35 = 0,62. When the transformation of the current by the light source is not efficient, the source will consume more current than necessary. When the current is not consumed by the light source efficiently, the cabling during installation should be adjusted accordingly. The excess current will result in power loss due to cables’ heating, etc. A general rule is the following: a 10W light source with a PF 0.5 must be connected to an installation capable of supplying 20W. The corresponding formula reads installation W = Power/PF. 41 LabSpion user guide Example 1 Shows a standard 60W tungsten bulb with an ideal PF of 1.0 and a current curve that is identical to the voltage. Example 2 Shows a LED bulb that has a passive capacitor power supply, which results in a high phase shift between current and voltage, thus resulting in a very low power factor of 0.19. Example 3 Shows a LED bulb of a medium quality switch-mode driver with a high capacity peak load, thus a medium quality power factor of 0.62. Example 4 Shows a LED bulb having a switchmode driver with a particularly bad filtering. It results in a high noise level of the current. Therefore this level of noise would probably not be able to pass the EMC noise level requirements. 42 LabSpion user guide CRI details The CRI defines the quality of white light, it is also known as the Colour Rendering Index or Ra. The value of CRI shows how much the spectrum of a light source resembles that of the Sun, thus the ability of the light source to reproduce the colours of an object as if it were illuminated by the Sun. The CRI is calculated with the help of the standard test colours, which examine the chromatic adaptation of light. The standard set consists of 15 test colours, but only the first 8 of them (known as R1-R8) are used to calculated the CRI, whereas the remaining R9-R15 are typically not used. However, sometimes LED lights do not have a red light component (which is considered in the R9 measurement), that is why it is becoming more common to include the R9 measurement as well. R9-R15 values can be view in the CRI details window, which is opened by clicking on the CRI bar or selecting View->CRI details. According to the colours table above, we can see that the red light of R9 is rather low compared to the rest of the 43 LabSpion user guide values. In some cases R9 can even be negative due to particularly low levels of the red light. 44 LabSpion user guide Example 1 Shows a standard tungsten lamp. Its continuous spectrum has the closest resemblance to the Sun, therefore the CRI values are the highest. Example 2 Shows a Philips LED bulb with a low red R9 value. Example 3 Shows a standard LED bulb with a negative red R9 value due to the lack of red light in the spectrum. Example 4 Shows a LED bulb with an additional red colour boost, so that the LED’s R9 value is increased. 45 LabSpion user guide Spherical limit Spherical limit allows the user to constrain the area of the luminous flux integration. It is also known as measuring luminous flux in a Φ cone. Luminous flux measurement is generally done in a full sphere of 360°. The new EU regulations (EU No 1194/2012), however, require the measurement of the directional lamps in a 90° or 120° cone, meaning that light illuminated only inside of that cone is considered for the calculation of the efficient luminous flux. The spherical limitation can be set by clicking Edit -> Spherical limit. Spherical limitation does not need to be set before a measurement, although it can be set afterwards, also for the previously made full-on 360° measurements. Below is an example of the differences in the flux at 90° cone, where 57 lm is considered as a waste outside the 90° cone. 46 LabSpion user guide Attaching pictures You can easily attach pictures to your measurements via dragging and dropping them towards the area of the picture frame. It is also possible to use a webcam to snap pictures of the measured light sources for quick references. To use the webcam click on the picture frame to open a picture editor. Afterwards click on the start webcam button for the webcam to start and add as many pictures as you like. The first picture in the picture editor will be used as the primary one, which accompanying the measurement by default. Pictures can be moved or deleted by right clicking on each pictures. 47 LabSpion user guide Saving measurement Fill in and store all the necessary information about each measurement in the appropriate section, as shown in the picture. To save the measurement simply click on the save icon or select File -> Save as. Measurements are stored in the Measurement library in an alphabetic order. Measurements are physically stored in “My documents\Viso Systems\Light Inspector\” as .fixture files. The folder can also be opened through selecting File -> Open measure folder. When some files are added or removed, it is then necessary to restart the program, so the library can be updated. 48 LabSpion user guide Exporting to IES/LDT It is possible to export the measurements to IES or LDT formats to be further used in Dialux or other 3D lighting design software. To export to IES simply select File -> Export -> IES or LDT. 49 LabSpion user guide Exporting to PDF All measurements can be exported directly to a PDF document. Firstly select the measurement and then click File -> Export -> PDF. It is also possible to implement your own logo in the PDF, and export to different languages like English, German and Chinese. A typical export procedure is shown below. Select language 50 Click and add logo LabSpion user guide Exporting to PNG All measurements can be exported to a PNG picture file to be used in reports, sales and marketing materials. To export pick a measurement in your measurement library and then select File -> Export -> PNG (Image). A typical export is shown below. 51 LabSpion user guide Exporting to CSV Measurements can be exported to a CSV tab separated file, so that the measurement data can be imported into Excel or other calculation software for further manipulation. To export to CVS click File -> Export -> CSV (Tab separated) The contents of the CVS file can be seen below: Product name Demo 1 Date and time 30. juli 2012 09:03:52 Item number Efficiency 64 CRI 60 CCT 3166 Lumens 257,9 Peak cd 353,75 Power 4,01 PF 0,56 CIE x 0,427 CIE y 0,403 Angle Candela -179,55 0,46 -178,65 0,43 -177,66 0,48 -176,67 0,47 Etc… 52 LabSpion user guide Emailing measurement The “Viso Light Inspector” software is capable of directly emailing measurements by clicking on the email icon. 53 LabSpion user guide Specifications Measurement method .................................................... Far Field Physical dimensions Shipping dimensions (L x W x H) ...... (See shipping dimensions) Shipping weight ...................................................................69 Kg Dimensions (L x W x H) .................................... (See dimensions) Weight .................................................................................63 Kg Sensor distance ........................................................ 50m to 0.5m ....................................................................Sensor distance >= lamp length x10 Sensor distance setup ............. Laser range finder (build into sensor) Lamp diameter range ................ 0 – 1,5m at 2 axis (1 axis up to 6m) Lamp maximum weight ........................................................25Kg Electrical Power supply input ............................... 90 to 260 VAC, 50/60 Hz Power consumption ............................................ 60W (Idle 15 W) USB current consumption ................................................200 mA Power analyser voltage range ............ 30VAC-400VAC <+/- 0.2V Power analyser current range .................0A-3A (Avg: +/- 0.1mA) Power analyser power range .......... 0W-300W (Avg: +/- 0.001W) Power analyser sample rate ......................... 70.000 samples/sec Photometric Flux, lumen @ 10m .............................. 1 – 3,000,000 +/- 4.00% Flux, lumen @ 20m ............................ 1 – 12,000,000 +/- 4.00% Flux, lumen @ 40m ............................ 1 – 48,000,000 +/- 4.00% Intensity, candela @ 10m ................ 0.07 – 1,000,000 <+/- 2,5% 54 LabSpion user guide Intensity, candela @ 20m ................ 0.07 – 4,000,000 <+/- 2,5% Intensity, candela @ 40m .............. 0.07 – 16,000,000 <+/- 2,5% Colour temperature ............................. 1.000K-10.000K <+/- 35K Colour rendering index .......................................... 0-100 <+/- 0,7 Angular resolution LOW MODE .......................... 3.6 degree step ................................................... (About 20 sec measurement time per C-plane) Angular resolution HIGH MODE............................. 1 degree step ..................................................... (About 1 min measurement time per C-plane) Spectrometer type ........................... Ibsen Photonics FREEDOM ............................................... Custom viso (high sensitive transmission grating) Spectrometer range .............................. 360-830nm (1024 pixels) Spectrometer detector ......................................... SONY ILX511B Calibration ........................ Fully calibrated plug and play solution Re-calibration ................................. Every 1 year (Maximum 2 years) Control and interface Control interface ..............................................................USB 2.0 Control connector .............................................................. USB-B Connections AC power in (power supply) .......................................... IEC 3-pin AC power out lamp .............................................Universal socket Light source adaptors ................................ E27, E14, B22, GU10 PC ...................................................................................... USB B Approvals Power supply ................................ cUL/UL, CE, CCC, TUV, FCC Power analyzer - LabSensor ................................................... CE Ordering information LabSpion ............................................................. P/N LABSP001 55 LabSpion user guide