1
FIRE ALERT SYSTEM USING SHAPE AND COLOR
ANALYSIS THROUGH IMAGE PROCESSING VIA
MOBILE APPLICATION
By
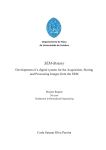
Divina A. Chua
Carla Louie H. Leandicho
Leo Angelo C. Magtibay
Jerome T. Ortiz
A Thesis Report Submitted to the School of Electrical Engineering,
Electronics Engineering, and Computer Engineering in Partial Fulfillment
of the Requirements for the Degree
Bachelor of Science in Computer Engineering
Mapua Institute of Technology
March 2013
i
ii
ACKNOWLEDGEMENT
The designers would like to thank the following people for their effort in
making this thesis possible.
First of all, the designers would like to thank God for the knowledge and
wisdom and the strength to be able to finish this thesis.
To Engr. Analyn N. Yumang for providing guidance in developing the program
as well as in making the documentation for this thesis.
To our beloved panellists, Engr. Dionis Padilla, Engr. Joshua B. Cuesta and
Engr. Jose B. Lazaro Jr. for assistance in improving this paper.
To Engr. Voltaire De Leon and Engr. Ayra Panganiban for the time and
guidance extended to the researchers.
iii
TABLE OF CONTENTS
TITLE PAGE
i
APPROVAL SHEET
ii
ACKNOWLEDGEMENT
iii
TABLE OF CONTENTS
vi
LIST OF TABLES
vi
LIST OF FIGURES
vii
ABSTRACT
viii
CHAPTER 1: INTRODUCTION
1
CHAPTER 2: REVIEW OF RELATED LITERATURES AND RELATED STUDIES
5
Android Applications
IP Camera
Related Studies
Image Processing-based Fire Detection System
A New Image Based Real Time Flame Detection Method
An Early Fire Detection Method Based on Image Processing
Flame Detection Method in Video Using Covariance Descriptors
Fast and Efficient Method for Fire Detection Using Image Processing
Implementation of Object Tracking and Motion Sensors
CHAPTER 3: FIRE ALERT SYSTEM USING SHAPE AND COLOR ANALYSIS
THROUGH IMAGE PROCESSING VIA MOBILE APPLICATION
Abstract
Introduction
Methodology
Hardware Development
Conceptual Framework
Block Diagram
Procedural Steps in Conducting the Study
Software Development
Shape and Color Analysis Algorithm
Color Analysis Algoritm
Testing and Statistical Treatment
CHAPTER 4: CONCLUSION
6
10
12
12
13
13
14
14
16
18
18
19
23
23
23
24
25
27
29
31
33
42
iv
CHAPTER 5: RECOMMENDATION
44
APPENDICES
45
Appendix A. Operation’s Manual
Appendix B. Pictures of Prototype
Appendix C. Program Listing
46
49
52
v
LIST OF TABLES
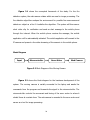
Table 3.1 Performance and Evaluations
33
Table 3.2 Graph of Performance and Evaluations
34
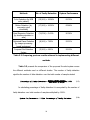
Table 3.3 Comparing previous results achieved in implementing
Different methods
35
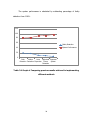
Table 3.4 Graph of Comparing previous results achieved in implementing
Different methods
36
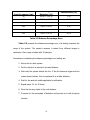
Table 3.5 Distance Percentage Error
37
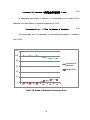
Table 3.6 Graph of Distance Percentage Error
38
Table 3.7 Response of Mobile Application
39
vi
LIST OF FIGURES
Fig 2.1 Architecture of the Android System
6
Fig 2.2 xFace Porting Layer
9
Fig 2.3 Block Diagram of IP Camera
11
Fig 2.4 Block Diagram Implementation of Object Tracking and Motion
Sensor for Home and Office Based WIFI Monitoring System
17
Fig 3.1 Conceptual Framework
23
Fig 3.2 Block Diagram of Moving Camera
24
Fig 3.3 Procedural Steps in Conducting the Study
25
Fig 3.4 Android Mobile Application Algorithm
27
Fig 3.5 Shape and Color Analysis Algorithm
29
Fig 3.6 Color Analysis Algorithm
31
vii
ABSTRACT
Fire is a common safety problem both in the industry and household
environments. This paper presents the research and implementation of a fire
detector through covariance matrix image processing and alarm device with mobile
phone application. The concept of covariance is used together with Shape analysis
algorithm and color analysis algorithm. The device can detect fire by its color
knowing that there is an enrolment made for color on our web server. A mobile
phone application is created to serve as the receiving end of the device’s alarm. A
moving camera is also utilized for live video streaming of a certain area. The device
will detect if there is a fire in a given area, and then an alarm will be sent to the
user’s Android mobile phone. From the mobile phone application the user will be
able to view the happenings in the area and will have an option to call the fire
station.
Keywords: image processing, fire, web server, android, mobile application
viii
Chapter 1
INTRODUCTION
Recently, terrible disasters such as tsunami, flood, avalanche, fire, and
explosion have caused many casualties and damages to property. Therefore,
efficient detection for early alarming systems has to be used and has been an
important research area in the last few years. Researches on the automatic fire
detection, in particular has been widely studied. Sensor-based fire detection is being
used due to its characteristics of low cost and simple set-up. However, these devices
do not work until the material comes in contact with the sensor and awareness of
the additional information such as fire scale or location. Today, image processing
has brought impact to the technology. One of the common applications is facial
recognition used on a laptop for security purposes. Alert systems such as fire and
other safety devices are possible to be combined with image processing technology.
Image processing usually refers to digital image processing. Computer graphics and
computer visions are very much related to image processing. As people move
forward to technology, this study will provide data on the use of home alert systems
as communication through mobile application and image processing technology. The
mobile application development for fire alert system allows the user/s to be
informed when a fire happens/occurs inside their house. There are fire detection
systems that use smoke sensors which require a certain concentration of the smoke
before it can detect fire but can lead to false detection such as a cigarette smoke.
The common problem where fire starts at home is caused primarily by homeowners
1
being careless when it comes to dealing with potential hazardous situations. Another
cause usually deals with electricity where people forget to unplugged electric
appliances. The problem in the existing studies is accuracy in terms of time on when
will the device detect the flame.
The system that will be created is very helpful for the safety of everyone. If
the system will be installed in houses, the families’ safety will be at hand and if the
system will be installed in establishments the owners ensured customers’ safety.
Nowadays, the Earth’s average temperature increases due to the effect of
greenhouse gases which is why fire and floods happen unexpectedly. In 2012 during
the summer time here in the Philippines, temperature reaches 36 degree celsius and
strong typhoons enter the Philippines’ area of responsibility. Because of fire and
flood huge damages happen and worst, people die. In fact, these circumstances can
be minimized if people will be alarmed and can call for help immediately. The
system that will be created will lessen these huge damages, at the same time will
alert the owner immediately if the IP (Internet Protocol) camera saw an occurrence
of fire or smoke.
There are a lot of studies regarding image processing, it varies from
article to article, some are used for security purposes such as facial recognition
for electronic camera devices and some are used in signal processing such as
noise removal and filters. In this study, the researchers will be using image
2
processing with covariance algorithms for fire detection systems. A web camera
will be used for capturing the video data needed for the system to interpret a fire
and an IP camera that will serve as the receiving end of the system . It will also allow
the user to view the live video from the mobile application.
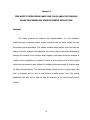
This study aims to develop an algorithm for fire detection using shape and color
analysis. The specific objectives of this research are as follow:
a. To create a mobile application that would alert and automatically inform the
user if there is a fire detected.
b. To develop fire detection system using image processing.
c. To develop a more accurate algorithm that is early fire detection.
The study impacts on the safety of the people as well as contribute greatly in
the safety field through the convenience of an alert system with the use of a
mobile application. The research and the proposed algorithm are suited to the
advancement of technology where people nowadays are seeking portability of
things. The portability of the device will be evident in such a way that the user
will be alerted from the mobile phone theoretically anywhere, provided that the
mobile phone is powered on. The mobile application can be used instantly
once
the
web
server distinguish that the captured image of fire transmit a
signal. Lastly, this research will contribute in the future studies of wireless
technology which is now one of the most widely used technology in transferring
3
data or information.
The research also focuses on house monitoring of fire through image
processing. It alerts the user if there is a fire occurring in the said location. The
study covers the use of co-variance based on fire color detection and shape
analysis to determine a fire through image processing. A web camera is used by the
system to grab the video frames that are subject to be analyzed by the algorithm.
The system will capture a video clip once it detects a fire and stores it in its
memory. This will then send a signal to the android phone to automatically activate
the mobile application for viewing and connect to the IP camera to display the
activity in that location. The mobile application must be installed in the mobile
phone that comes within the system which is the only one capable of
communicating to the IP camera. The range of the camera is only limited to what it
can see and the system cannot take action in stopping the unexpected
emergencies.
4
Chapter 2
REVIEW OF RELATED LITERATURE
One of the most fast paced technology is mobile phones from Motorola
Dynatac 8000x, the first portable cellular phone which can be used to call and save
30 phone numbers, to 2G (GSM and CDMAone). Cellular phones allow more calls to
be packed into the same amount of radio bandwidth where one benefits to lower
emission on the health an individual/user. The 2 nd generation networks provide
easier communication that previous analog network on voice, SMS and MMS. Moving
into the 3rd and 4th generations (from EDGE/EVDO to HSPA/Wi-max and later on
almost all wireless carriers are moving to LTE), mobile phones improved be led by
iPhone, Android Phones, and Windows Mobile. With 3G and later on LTE, users will
not be restricted on using voice and SMS only but more usage of data to connect on
the internet with lightning speed and much richer experience for users as they can
go to social networking sites and online messaging with ease. Nowadays, so many
mobile applications are created to monitor unexpected emergencies. There were
created because in today’s generation almost everyone has their own mobile phone
which can be easily accessed.
5
Android Applications
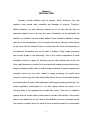
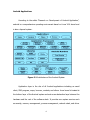
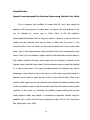
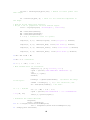
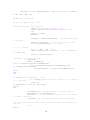
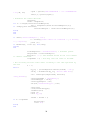
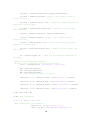
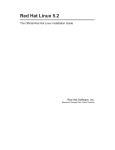
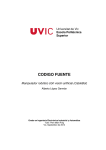
According to the article “Research on Development of Android Application”,
android is a comprehensive operating environment based on Linux V2.6 kernel and
is also a layered system.
Figure 2.1 Architecture of the Android System
Application layer is the site of all Android applications including an email
client, SMS program, maps, browser, contacts, and others. Linux kernel is located at
the bottom layer of the Android system and acts as an abstraction layer between the
hardware and the rest of the software stack. It provides core system services such
as security, memory management, process management, network stack, and driver
6
model. A core feature of Android is that one application can use component element
that belongs to another application. In order to achieve such functions, Android
system must launch the application while any part of the application is asked and
instantiated Java objects being asked. Unlike most operating system, there is no
single point that the system can enter in an Android application. Instead, each
component is a different point through which the system can enter an application
and instantiate component object independently, (Jianye Liu and Jiankun Yu; 2011).
According to the article “Context-aware User Interface Framework for Mobile
Applications”, mobile devices today are very heterogeneous, using different
platforms and featuring a multitude of different display resolutions. Therefore, it is
often necessary to adapt an application to multiple devices at development time
taking into account the different display and input capabilities and developing
different implementations for different devices. The number of available platform
configurations, such as Java Platform, Micro Edition (Java ME, also referred as
J2ME) CDC or CLDC further increases the number of different implementation
needed for a portable application. It is known that a user interface should be able to
adapt to the current situation of the user to better suit its needs and desires, thus
improves usability. The XML User Interface Language (XUL) is an XML-based markup language for the description of user interfaces. It is mainly used by Mozilla
Foundation in their products like the Firefox browser or Thunderbird mail client, but
is increasingly popular in the area of web applications. XUL is used by several other
7
projects for mobile devices to specify user interfaces and transforms the XUL to
device specific HTML or WAP pages. In this paper the researchers will introduce a
framework which enables easy creation of applications for different mobile devices
and foster a GUI which reacts to context changes without having the need for any
application logic supporting it. It proposes an extension to XUL to enable the easy
creation of applications which adapt themselves to different devices and user
context. The Java platform was chosen since it is available for most mobile phones
and PDAs, (Thomas Butter, Markus Aleksy, Philipp Bostan, and Martin Schader;
2007).
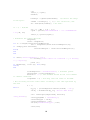
Based on the article, “Porting mobile web application engine to the Android
platform”, Android is released as an open-source mobile phone operating system is
a Linux-based platform; it consists of the operating system, middleware, and user
interface and application software. xFace is a cross-platform web application engine
for mobile internet. It uses HTML, CSS, and JavaScript and other Web technologies
to develop lightweight mobile applications. Mobile applications which are developed
by using the technology of xFace, can run on different operating systems without
any modification, such as windows Mobile, BREW, Symbian and other mobile phone
platforms. The application framework provides java class library for Android
applications. The libraries layer is developed by C/C++ language where those
libraries are packaged by Application Framework section. The bottom section is the
Linux Kernel which is developed by c language, it provides the core system services,
8
such as security, memory management, file system management, process
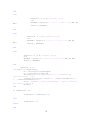
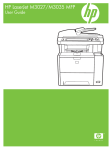
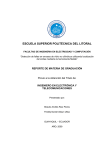
management, network group, Driver Model, etc. xFace is composed of xFace engine
and platform adaptation layer (also known as porting layer), xFace engine is mainly
responsible for page layout, script analysis, logic and other functions, the porting
layer is mainly responsible for abstracting the operating system -related functions
into the system-independent in order to make xFace run of different platform. xFace
is developed by C/C++, but the Android application is developed by Java language
which allows us to have to use JNI (Java Native Interface) which is provided by
JAVA to allow JAVA and the C/C++ interface to call each other, (Yonghong Wu,
Jianchao Luo, Lei Luo; 2010).
Figure 2.2 xFace Porting Layer
9
IP Camera
An Internet protocol camera or IP camera is a type of digital video camera
commonly employed for surveillance which unlike analog closed circuit television
(CCTV) cameras can send and receive data via computer network and the internet.
Although most cameras that do this are webcams, the term “IP Camera” is usually
applied only to those used for surveillance.
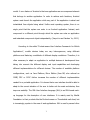
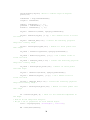
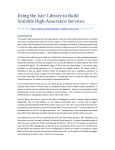
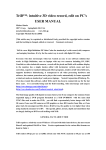
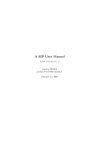
Based on the article, “Cost Effective IP Camera for Video Surveillance”, IP
cameras are the key devices for video surveillance system. The IP camera can
compress and deliver live video clips to the Internet without using a PC so that
people can remotely browse and watch the protected area activities. Hence, the
performance of the IP surveillance cameras is generally evaluated at encoding
speed, video resolution, video frame bitrates and distortion, power dissipation, etc.
Among these characteristics, the video resolution, the compression ratio and the
frame rate are the most important to the users of the video surveillance systems
because these features are highly related to the image quality and the network
bandwidth. MJPEG and MPEG4 Visual are the common standards used for image
compression, (Ming-Jiang Yang, Jo Yew Tham, Dajun Wu, Kwong, Huang Goh;
2009).
10
Figure 2.3 Block Diagram of IP Camera
11
Related Studies
Image Processing-based Fire Detection System using Statistic Color Model
Fire is necessary and profitable to human kind life, but it also causes the
damage to life and property in certain cases. In general, the early presence of fire
can
be detected
by
smoke,
gas or
flame.
Most of the fire detection
system/equipment detects the fire based on sensors. However, a sensor cannot be
reliable and fast because there can be times of delay with the sensor. If the
threshold value is low, the sensor can have high sensitivity but it can produce false
alarm. And, it also requires that a certain threshold value must be assigned to each
sensor. Most of the fire detection system used the heuristic fixed threshold values in
their specific methods. However, input images may be changed, in general, so the
heuristic fixed threshold values used in the fire detection systems might be modified
on a case-to-case basis. The image processing-based fire detection has various
advantages. Light travels at very high speed, so the image processing-based fire
detection can be quick to catch the spot of fire on time without delay. Thus, it can
monitor wider space than the conventional sensor-based fire detection system. Most
of the fire detection system used the heuristic fixed threshold values in their specific
methods. In this paper, an automatic fire detection system without the heuristic
fixed threshold values was studied. It presented an automatic method using the
statistical color model and the binary background mask, (Bo-Ho Cho, Jong-Wook
Bae, Sung-Hwan Jung; 2008).
12
A New Image-Based Real-Time Flame Detection Method Using Color
Analysis
This paper presents a new image-based real-time flame detection method.
The fire flame features based on the HIS color model are extracted by analyzing 70
flame images. Then, based on these flame features, regions with fire-like colors are
roughly separated from an image. Besides segmenting fire flame regions,
background objects with similar fire colors or caused by color shift resulted from the
reflection of fire flames are also separated from the image. To get rid of these
spurious fire-like regions, the image difference method and the invented color
masking technique are applied. Finally, a simple method is devised to estimate the
burning degree of fire flames so that users could be informed with a proper warning
alarm.
An Early Fire-Detection Method Based on Image Processing
The paper presents an early fire detection method based on video processing.
The basic idea of the fire detection is to adopt an RGB (red, green, blue) model
based chromatic and disorder measurement for extracting fire pixels and smoke
pixels. The decision function of fire pixel is mainly deduced by the intensity and
saturation of R component. In addition to using chromatics, dynamic features are
adopted to distinguish other fire aliases. These fire dynamics include sudden
13
movements of flames, changeable shapes, growing rate, and oscillation (or
vibrations) in the infrared response. For improving the reliability of detection, it
utilizes both the disorder characteristic of flames and the growth of fire pixels to
check if it is a real fire. Since the shape of flames changes with time due to air
flowing, the size of the fire's area in an image also changes; the flame always has a
growth feature. The disorder of fires can be measured with the pixel quantity of
flame difference between two consecutive images.
Flame Detection Method in Video Using Covariance Descriptors
This paper presents a video fire detection system which uses a spatiotemporal co-variance matrix of video data. The system divides the video into spatiotemporal blocks and computes co-variance features extracted from these blocks to
detect fire. Feature vectors taking advantage of both the spatial and the temporal
characteristics of flame colored regions are classified using an SVM classifier which is
trained and tested using video data containing flames and flame colored objects. Covariance method is ideally suited for flame detection because flames exhibit random
behavior and it is observed that the underlying random process can be considered
as a wide-sense stationary process in a flame region in video. The method uses
temporal co-variance information in the decision process. Most fire detection
methods use color, spatial and temporal information separately, but this method
uses temporal extended co-variance matrices representing all the information
14
together. The method works well when the fire is clearly visible and in close range
such that the flicker and irregular nature of flames are observable.
Fast and Efficient Method for Fire Detection Using Image Processing
This paper presents a computer vision-based fire detection algorithm. In
general, a computer vision-based fire detection system employs three major stages:
fire pixel classification, moving object segmentation, and analysis of the candidate
regions. This analysis is usually based on two figures: the shape of the region and
the temporal changes of the region. The fire detection performance depends
critically on the effectiveness of the fire pixel classifier which generates seed areas
than the rest of the system will exercise. The fire detection algorithm consists of two
main parts: fire color modeling and motion detection. The algorithm can be used in
parallel with conventional fire detection systems to reduce false alarms. It can also
be deployed as a stand-alone system to detect fire by using video frames acquired
through a video acquisition device. It is assumed that the image acquisition device
produces its output in RGB format. The algorithm consists of three main stages: fire
pixel detection using color information, detecting moving pixels, and analyzing
dynamics of moving fire pixels in consecutive frames.
15
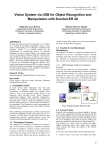
Implementation of Object Tracking and Motion Sensors for Home and
Office Based WIFI Monitoring System
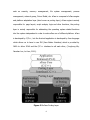
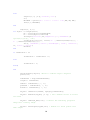
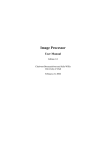
According to the design, “Implementation of Object Tracking and Motion
Sensors for Home and Office Based WIFI Monitoring System”, the designers used an
Arduino as a microcontroller for the IP camera's motion. The microcontroller
manages the data from the sensor and switches to properly move the camera. The
designers changed the medium of data transmission that makes the system portable
and allowing for remote viewing anywhere with an internet connection. The servo
motor is the one responsible for generating the movement of the IP camera to
automate its viewing perspective. The camera can scan the area pivoting from left
to right and vice-versa. The camera can also be manually operated by the user
using two push buttons to direct the camera to the left or to the right. The use of
sensors instead of multiple cameras have made it possible to monitor a large area
while minimizing the use of cameras.
16
input
sensor
Arduino
servo
camera
snapshot
email
Figure 2.4 Block Diagram Implementation of Object Tracking and Motion Sensors
for Home and Office Based WIFI Monitoring System
17
Chapter 3
FIRE ALERT SYSTEM USING SHAPE AND COLOR ANALYSIS THROUGH
IMAGE PROCESSING VIA ANDROID MOBILE APPLICATION
Abstract
The study presents the research and implementation of a fire detection
system through covariance matrix image processing and an alarm system through
the mobile phone application. The system extracts image frames from the video for
shape and color analysis and segments the moving regions by image differencing
through the concept of co-variance used together with shape and color analysis. A
mobile phone application is created to serve as the receiving end of the system
which moving camera is also utilized for analysing the environment of a certain area
for flame colored objects. The device will detect if there is a fire in a given area, and
then a message will be sent to the Android mobile phone. From the mobile
application the user will be able to view the scenario in the area through the IP
camera.
18
Introduction
Recently, terrible disasters such as tsunami, flood, avalanche, fire, and
explosion have caused many casualties and damages to property. Therefore,
efficient detection for early alarming systems has to be used and has been an
important research area in the last few years. Researches on the automatic fire
detection, in particular has been widely studied. Sensor-based fire detection is being
used due to its characteristics of low cost and simple set-up. However, these devices
do not work until the material comes in contact with the sensor and awareness of
the additional information such as fire scale or location. Today, image processing
has brought impact to the technology. One of the common applications is facial
recognition used on a laptop for security purposes. Alert systems such as fire and
other safety devices are possible to be combined with image processing technology.
Image processing usually refers to digital image processing. Computer graphics and
computer visions are very much related to image processing. As people move
forward to technology, this study will provide data on the use of home alert systems
as communication through mobile application and image processing technology. The
mobile application development for fire alert system allows the user/s to be
informed when a fire happens/occurs inside their house. There are fire detection
systems that use smoke sensors which require a certain concentration of the smoke
before it can detect fire but can lead to false detection such as a cigarette smoke.
The common problem where fire starts at home is caused primarily by homeowners
19
being careless when it comes to dealing with potential hazardous situations. Another
cause usually deals with electricity where people forget to unplugged electric
appliances. The problem in the existing studies is accuracy in terms of time on when
will the device detect the flame.
The system that will be created is very helpful for the safety of everyone. If
the system will be installed in houses, the families’ safety will be at hand and if the
system will be installed in establishments the owners ensured customers’ safety.
Nowadays, the Earth’s average temperature increases due to the effect of
greenhouse gases which is why fire and floods happen unexpectedly. In 2012 during
the summer time here in the Philippines, temperature reaches 36 degree celsius and
strong typhoons enter the Philippines’ area of responsibility. Because of fire and
flood huge damages happen and worst, people die. In fact, these circumstances can
be minimized if people will be alarmed and can call for help immediately. The
system that will be created will lessen these huge damages, at the same time will
alert the owner immediately if the IP (Internet Protocol) camera saw an occurrence
of fire or smoke.
There are a lot of studies regarding image processing, it varies from
article to article, some are used for security purposes such as facial recognition
for electronic camera devices and some are used in signal processing such as
noise removal and filters. In this study, the researchers will be using image
20
processing with covariance algorithms for fire detection systems. A web camera
will be used for capturing the video data needed for the system to interpret a fire
and an IP camera that will serve as the receiving end of the system . It will also allow
the user to view the live video from the mobile application.
This study aims to develop an algorithm for fire detection using shape and
color analysis. The specific objectives of this research are as follow:
a. To create a mobile application that would alert and automatically inform the
user if there is a fire detected.
b. To develop fire detection system using image processing.
c. To develop a more accurate algorithm that is early fire detection.
The study impacts on the safety of the people as well as contribute greatly
in the safety field through the convenience of an alert system with the use of a
mobile application. The research and the proposed algorithm are suited to the
advancement of technology where people nowadays are seeking portability of
things. The portability of the device will be evident in such a way that the user
will be alerted from the mobile phone theoretically anywhere, provided that the
mobile phone is powered on. The mobile application can be used instantly
once
the
web
server distinguish that the captured image of fire transmit a
signal. Lastly, this research will contribute in the future studies of wireless
technology which is now one of the most widely used technology in transferring
21
data or information.
The research also focuses on house monitoring of fire through image
processing. It alerts the user if there is a fire occurring in the said location. The
study covers the use of co-variance based on fire color detection and shape
analysis to determine a fire through image processing. A web camera is used by the
system to grab the video frames that are subject to be analyzed by the algorithm.
The system will capture a video clip once it detects a fire and stores it in its
memory. This will then send a signal to the android phone to automatically activate
the mobile application for viewing and connect to the IP camera to display the
activity in that location. The mobile application must be installed in the mobile
phone that comes within the system which is the only one capable of
communicating to the IP camera. The range of the camera is only limited to what it
can see and the system cannot take action in stopping the unexpected
emergencies.
22
Methodology
Hardware Development
This section provides an overview of the steps that the designers undertook
in the hardware development of this research. Hardware development includes the
flow of data through the components, block diagrams and schematic diagram of the
research as well as components used in the research.
The designers researched and gathered information about previous system as
basis for circuit design. They also researched components that can fit into the
system to make it more cost effective without affecting the output. From the
information gathered, the designers selected components to be used in the
research.
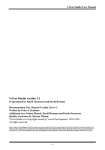
Conceptual Framework
Fire Detection System
Web
Camera
Fire Detection
Algorithm
Save
Video
Internet
Mobile Phone Application
Mobile
Phone
Android
Mobile
Application
IP Camera
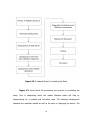
Figure 3.1 Conceptual Framework
23
Live Video
Streaming
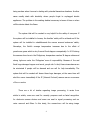
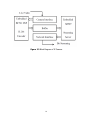
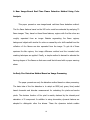
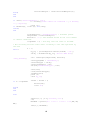
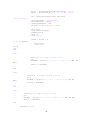
Figure 3.1 shows the conceptual framework of the study. For the fire
detection system, the web camera rotates within an area for image processing. The
fire detection algorithm analyzes the environment for possible fire occurrences and
detects an object as a fire if it satisfies the algorithm. The system will then save a
short video clip for verification and send an alert message to the mobile phone
through the internet. When the mobile phone receives the message, the mobile
application will be automatically activated. The mobile application will connect to the
IP camera and present a live video streaming of the scenario in the mobile phone.
Block Diagram
Input
Microcontroller
Servo Motor
Web Camera
Figure 3.2 Block Diagram of the Moving Camera
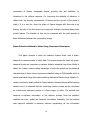
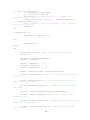
Figure 3.2 shows the block diagram for the hardware development of the
system. The moving camera is serially connected to the laptop and awaits the
commands from the program and transmits the signal to the microcontroller. The
microcontroller controls the movement and timing of the servo motor to where it
should focus at a certain time. The web camera is mounted to the servo motor and
serves as a tool for image processing.
24
Figure 3.3 Procedural Steps in Conducting the Study
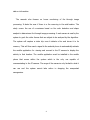
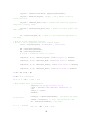
Figure 3.3 shows about the procedures one must do in conducting the
study. First is researching about the related literature which will help by
brainstorming for a possible and innovative topic. The hardware development
discusses the materials needed as well as the steps in designing the devi ce. The
25
development of the Fire Color Detection Algorithm and Mobile Application will fall
under the category of software development. In the software development, the
researchers determine what platform must be used and also the coding algorithms
that will satisfy the software components of the system.
26
Software Development
The mobile application can be programmed using C/C++, since the Android
mobile platform’s middleware is written in Java and C/C++. The figure below
discusses the process flow of the mobile application. The mobile application initially
runs as a background application on the mobile phone.
START
Is the
Application
ON?
NO
END
YES
Is there
Fire
Detected?
YES
Connect to IP
Camera
NO
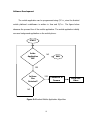
Figure 3.4 Android Mobile Application Algorithm
27
Show Live
Video
Figure 3.4 discusses the android mobile application algorithm, once the
system detects a fire it will send a message that will be connected to the mobile
phone. The mobile application connected to the IP camera will begin the live video
streaming of the area covered.
28
START
Extract image frames from video
Segment moving regions by
image differencing
Color Analysis
Shape Analysis
Fire
Detected
?
END
Send Fire Alarm
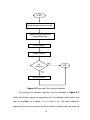
Figure 3.5 Shape and Color Analysis Algorithm
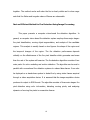
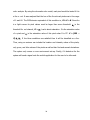
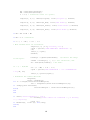
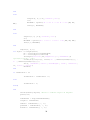
The proposed fire detection algorithm can be concluded in Figure 3.5.
Firstly, the moving regions are segmented from the captured image frames, thus
used as candidates for checking if it is a fire or not. The shape created by
segmenting these moving regions would be verified by testing each pixel using the
29
color analysis. By using the chromatic color model, each pixel would be tested if it is
a fire or not. It was analyzed that the hue of the fire colored pixels was in the range
of 0 and 60. The RGB domain equivalent of this condition is, R ≥ G > B. Since fire
is a light source its pixel values must be larger than some threshold.
threshold for red channel, R >
of a pixel and
R)
is the
. Last is about saturation. S is the saturation value
is the saturation value of this pixel when R is RT. S > (255 −
. If the three conditions are satisfied then it will be classified as a fire.
Thus, using co-variance can include the location and intensity values of the pixels,
red, green, and blue values of the pixels as well as their first and second derivatives.
The system only covers a room environment set-up. Finally, if it detects a fire the
system will send a signal onto the mobile application for the user to be informed.
30
START
R≥G>B
R>
S > (255 −
R)
END
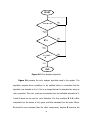
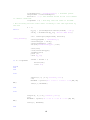
Figure 3.6 Color Analysis Algorithm
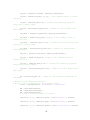
Figure 3.6 presents the color analysis algorithm used in the system. The
algorithm presents three conditions to be satisfied before it concludes that the
algorithm has detected a fire. A fire is an image that can be described by using its
color properties. This color pixel can be extracted into the individual elements as R,
G and B which can be used for color detection. The first condition R ≥ G > B is
computed from the means of red, green, and blue extracted from the video. Where
R should be more stressed than the other components, because R becomes the
31
dominating color channel in an RGB images of flames. R >
condition for R to be over some pre-determined threshold
is the second
. However, lighting
conditions may adversely affect the saturation values of flames resulting in similar R,
G and B values which may cause non-flame pixels to be considered as flame
colored. Therefore, saturation values of the pixels should also be over some
threshold value. In the third condition, S > (255 − R)
of saturation when the value of R channel is
, where
is the value
. If all of the three conditions are
satisfied for a pixel, then that pixel is considered as a fire colored pixel. The values
of both
and
are typically 0.5 and 0.11, respectively.
32
Testing and Statistical Treatment
Material Used
Correct Detection (%)
False Detection (%)
Paper
100%
0%
Rubber
97.6%
2.4%
Plastic
98.5%
1.5%
Wood
100%
0%
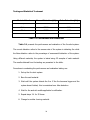
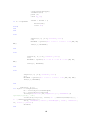
Table 3.1 Performance and Evaluations
Table 3.1 presents the performance and evaluation of the fire alert system.
The correct detection refers to the success rate of the system in detecting fire while
the false detection refers to the percentage of unsuccessful detection of the system.
Using different materials, the system is tested using 25 samples of each material.
The results obtained from the testing are presented in the table.
Procedures in conducting the performance and evaluation testing are:
1. Set-up the fire alert system.
2. Burn the said material.
3. Wait until the system detects the fire. If the fire becomes bigger and the
system doesn’t detect, this is considered as a false detection.
4. Wait for the android mobile application’s notification.
5. Repeat steps 2-4 for 25 times.
6. Change to another burning material.
33
7. Compute for the percentage of correct detection and false detection with
the given formula.
(3.1)
This formula is used in calculating systems correct detection. Correct
detection is calculated by the number of correctly detected samples over the
number of total number of samples.
(3.2)
The number of false detection is computed by subtracting correct detection
from 100%.
120
100
80
Correct Detection
60
False Detection
40
20
0
Paper
Rubber
Plastic
Wood
Table 3.2 Graph of Performance and Evaluations
34
Methods
No. of Faulty Detection
System Performance
Color Detection (by RGB
color pattern)
(19/104) = 18.26%
81.74%
Motion Detection (by
comparing pixel
coordinate)
(17/104) = 16.34%
83.66%
Area Dispersion Detection
(by checking deviation in
area)
(10/104) = 9.61%
90.36%
Optimized Flame Detection
(by images processing
based techniques)
(8/104) = 7.69%
92.31%
Proposed Fire Detection
System
(5/104) = 4.81%
95.19%
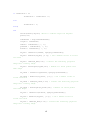
Table 3.3 Comparing previous results achieved in implementing different
methods
Table 3.3 presents the comparison of the proposed fire alert system versus
the different methods used on different studies. The number of faulty detection
signifies the number of false detection over the total number of samples tested.
(3.3)
In calculating percentage of faulty detection it is computed by the number of
faulty detection over total number of samples multiplied by 100%.
(3.4)
35
The system performance is calculated by subtracting percentage of faulty
detection from 100%.
120
100
80
60
Faulty Detection
System Performance
40
20
0
Color
Motion
Area
Optimized Proposed
Detection Detection Dispersion Flame
System
Detection
Table 3.4 Graph of Comparing previous results achieved in implementing
different methods
36
Distance of the fire
from the camera (cm)
50
Percentage of
Detection (%)
20/20 = 100 %
Percent Error (%)
100
20/20 = 100 %
0%
150
20/20 = 100 %
0%
200
19/20 = 95 %
5%
250
18/20 = 90 %
10 %
300
18/20 = 90 %
10 %
0%
Table 3.5 Distance Percentage Error
Table 3.5 presents the distance percentage error; this testing measures the
range of the system. The system’s accuracy is tested from different ranges in
centimeter. Each range is tested with 20 samples.
Procedures in conducting the distance percentage error testing are:
1. Set-up the fire alert system.
2. Put the object to be burned in the said distance.
3. Wait until the system detects the fire. If the fire becomes bigger and the
system doesn’t detect, this is considered it as a false detection.
4. Wait for the android mobile application’s notification.
5. Repeat steps 2-4 for 20 times.
6. Move the burning object to the next distance.
7. Compute for the percentage of detection and percent error with the given
formula.
37
(3.5)
In calculating percentage of detection it is computed by the number of fire
detected over total number of samples multiplied by 100%.
(3.6)
The percentage error is calculated by subtracting percentage of detection
from 100%.
120
100
80
Percentage of
Detection
60
Percent Error
40
20
0
50
100
150
200
250
300
Table 3.6 Graph of Distance Percentage Error
38
1
Android Mobile
Application Alerted
Yes
2
Yes
15s
3
Yes
20s
4
Yes
16s
5
Yes
18s
6
Yes
19s
7
Yes
21s
8
Yes
17s
9
Yes
18s
10
Yes
19s
Trial
Seconds
18s
Table 3.7 Response of Android Mobile Application
Table 3.7 shows the accuracy of the android mobile application as seen
where the application detects the entire alert trial from trial 1 up to trial 10. But it
differs in time it takes to alert the android mobile application. The two major factors
affecting the speed are the network provider and the speed of the mobile phone to
receive SMS. Even the time it will take to view the live streaming video will depend
on these two major factors. This means that the accuracy of the application doesn’t
rely on how the designers created the android mobile application. Result of speed
varies depending on those two factors.
Procedures in conducting the response of android mobile application testing are:
1. Set-up the fire alert system.
2. Burn paper (or any material).
39
3. Wait for the system to detect fire.
4. If the system detects a fire, start the stop watch.
5. Stop the stop watch when the notification pops out in the android phone.
6. Record the result time.
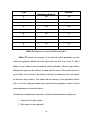
Fire Detected
Burning Paper
Burning Rubber
Burning Plastic
Burning Wood
40
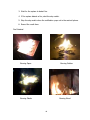
No Fire Detected
Lighter
Cigarette
Gas Stove Burner
41
Chapter 4
CONCLUSION
The study Fire alert system based on shape and color analysis through
image processing via A ndroid mobile application focuses on implementing a fire
alert system that will defect early fire occurrence and alert users through the mobile.
By performing trials of tests, the researchers can say that the system is able to
detect fire with the range of 5 seconds to 20 seconds from the start of the flame.
The time of detection may vary depending on the quality of the camera. The system
created an android mobile application that will automatically inform the user if there
is a fire detected. Time interval from fire detection to fire alert android mobile
application depends on the network provider. With the use of image processing the
researchers created a system that can detect fire on its early stage. By integrating
image processing using MATLAB application on the camera with the help of shape
and color analysis, this has been proven that the system is more accurate compared
to other research studies and other fire or smoke detectors. With the use of the
created algorithm the system can detect or distinguish the difference between a fire
and an object that has the same shade color of a fire. The only thing where one can
get false alarms is when the background color is the same as the color of the fire.
Based from the results gathered, there are factors that play an important role in
getting the output. First is the distance of the camera from the fire, and second is
the camera on how it can detect the fire quickly. The web camera is responsible for
42
image processing which is through the use of MATLAB programming. The web
camera’s range is 10m or 30ft but is limited to the system design to 5m or 15ft
because of the low quality of the web camera and to make the system more
accurate. When the researchers are developing the system it was found out that the
web camera couldn’t save video clip while the user is viewing the scenario that is
why the researchers use two (2) cameras. The web camera is used in image
processing and saved video clip while the IP camera is used in viewing the scenario.
As the researchers finish the system all of the objectives successfully met. They are
able to create a android mobile application that will automatically inform and alert
the user. The application will automatically receive an SMS alert message when the
system send a “Fire” or “fire” text message the application will convert this text
message to open the fire alert android mobile application and the user can view
what is happening in the scenario. The live streaming speed depends on the service
provider. The researchers are able to develop a fire detection system using image
processing and creat an algorithm for fire detection using shape and color analysis.
With the algorithm created a fire detection system is more accurate than the past
researches and systems developed.
43
Chapter 5
RECOMMENDATION
Based from the limitations of the fire alert system and the results gathered,
the system can be further improved by the following recommendations. First is
increasing the fire detection accuracy of the image processing program to
distinguish between the background color of the room and fire color, if both are of
the same color, thus eliminating the remaining false alarm of the system. Second
recommendation is increasing the camera’s range to suit bigger rooms which also
increases the fire detection accuracy.
Also to further improve the system’s capability in fire detection, future works can be
integrated to the temperature sensor that can detect room temperature. This can
help the user in assessing the severity of the situation. For the android mobile
application, the option to record the live video stream can be added because this
can help the authorities in conducting investigations on the cause of fire.
44
APPENDICES
45
APPENDIX A
Operation’s Manual
System Requirements
These are the requirements necessary to operate the device. It should be a
laptop or a computer with the following features:
1. Windows XP Service Pack 3 or newer versions
2. Intel Pentium 4 or higher
3. 512 MB RAM (minimum), 1 GB RAM (recommended)
4. At least 625 MB Hard Disk space
5. Graphics 16-, 24-, or 32-bit OpenGL capable graphics adapter
6. USB Port
7. Internet Connection
Installation Procedure
1. Install the MATLAB Software in the PC or laptop.
2. Install the application in the android phone.
3. Connect the device to a USB port of a laptop or PC.
4. Connect the camera to the device.
46
5. Mount the camera on a solid level surface.
6. Connect the device to its power source.
7. Configure the router and the IP address of the camera.
User’s Manual
PC or Laptop
1. Run the MATLAB software installed in the PC or laptop.
2. Connect to the internet.
3. Run the program in MATLAB.
Android Phone
1. Connect to the internet.
2. Run application in phone.
Troubleshooting Guides and Procedures
1. No video is shown in the output of program.
1.1
Check the connection of the device to the PC.
1.2
Make sure the device is connected to its power source.
1.3
Adjust the position of the camera.
47
2. Unable to receive alert on the android phone.
2.1
Check if the application is running in background on the phone.
If not restart the application.
2.2
Make sure you have internet connection on your phone.
3. Video feedback from the camera cannot be seen in the android phone.
3.1
Check if the camera is on and is connected to the router.
3.2
Make sure you have internet connection in your phone.
3.3
Check if the IP address of the camera is correct.
Error Definitions
1. No internet connection.
2. Too much process on the computer.
3. Human error.
48
APPENDIX B
Pictures of Prototype
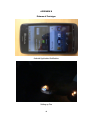
Android Application Notification
Setting up Fire
49
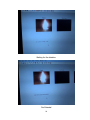
Waiting for fire detection
Fire Detected
50
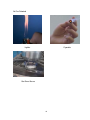
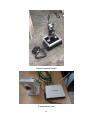
Image Processing Camera
IP camera and router
51
APPENDIX C
Program Listing
function FireAlertSystem()
clc % Clear command window.
clear all% Get rid of variables from prior run of this m-file.
disp('Program Start'); % Message sent to command window.
workspace; % Show panel with all variables.
delete(instrfindall); % Find visible and hidden instrument objects.
imaqreset; % Disconnect and delete all image acquisition objects
% imaqreset deletes any image acquisition objects that exist in memory and
unloads all adaptors loaded by the toolbox.
% As a result, the image acquisition hardware is reset.
% imaqreset is the image acquisition command that returns MATLAB to the
known state of having no image acquisition objects
% and no loaded image acquisition adaptors.
% You can use imaqreset to force the toolbox to search for new hardware
that might have been installed while MATLAB was running.
% Note that imaqreset should not be called from any of the callbacks of a
videoinput object, such as the StartFcn or FramesAcquiredFcn.
set(gcf, 'Position', get(0, 'ScreenSize'));
set(gcf, 'name', 'Fire Alert System Using Shape and Color Analysis Through
Image Processing via Mobile Application','numbertitle','off');
videoDevReader = imaq.VideoDevice('winvideo', 1, 'YUY2_320x240');
set(videoDevReader,'ReturnedColorSpace','rgb');
subplot(2, 4, [5 8],'Visible','off');
capsT = sprintf('INITIALIZATION COMPLETE!');
cla;
text(0,1, capsT);
drawnow;
while 1 == 1
while 1 == 1
fwrite(arduino,angle1); %Write to arduino angle 0 degrees.
pause(0.02)
videoFrame = step(videoDevReader);
origVid = videoFrame;
redVid = videoFrame(:, :, 1);
greenVid = videoFrame(:, :, 2);
blueVid = videoFrame(:, :, 3);
ex_Red = imsubtract(redVid, rgb2gray(videoFrame));
52
ex_Red = medfilt2(ex_Red, [3 3]); % Use a median filter to filter
out noise
ex_Red = im2bw(ex_Red,0.18); % Convert the resulting grayscale
image into a binary image.
ex_Red = bwareaopen(ex_Red,300); % Remove all those pixels less
than 300px
ex_Green = imsubtract(greenVid, rgb2gray(videoFrame));
ex_Green = medfilt2(ex_Green, [3 3]); % Use a median filter to
filter out noise
ex_Green = im2bw(ex_Green,0.18); % Convert the resulting grayscale
image into a binary image.
ex_Green = bwareaopen(ex_Green,300); % Remove all those pixels
less than 300px
ex_Blue = imsubtract(blueVid, rgb2gray(videoFrame));
ex_Blue = medfilt2(ex_Blue, [3 3]); % Use a median filter to
filter out noise
ex_Blue = im2bw(ex_Blue,0.18); % Convert the resulting grayscale
image into a binary image.
ex_Blue = bwareaopen(ex_Blue,300); % Remove all those pixels less
than 300px
bw = bwlabel(ex_Red, 8); % Label all the connected components in
the image.
% Here we do the image blob analysis.
% We get a set of properties for each labeled region.
stats = regionprops(bw, 'BoundingBox', 'Centroid');
MR = mean(mean(redVid));
MG = mean(mean(greenVid));
MB = mean(mean(blueVid));
S = 0.3; % Saturation value of a pixel;
subplot(2, 4, 1); imshow(origVid); title('Original'); drawnow;
subplot(2, 4, 2); imshow(ex_Red); title('Red Frame'); drawnow;
subplot(2, 4, 3); imshow(ex_Green); title('Green Frame'); drawnow;
subplot(2, 4, 4); imshow(ex_Blue); title('Blue Frame'); drawnow;
53
if MR > MG && MG > MB
if MR > 0.5 % Threshold
if S > ( 1 - MR ) * 0.11 / 0.5
% Must examine here for saturation.
subplot(2, 4, [5 8],'Visible','off');
capsT = sprintf('FIRE DETECTED! PROCESSING..');
cla;
text(0,1, capsT);
drawnow;
hsvImage = rgb2hsv(videoFrame);
%# Convert the image
to HSV space.
satRed = hsvImage(:, :, 1); % Get saturation, red.
SR = mean(mean(satRed)); % Get mean.
%S > (1 - R)ST/RT
ST = (1 - MR) * 0.11 / 0.5;
capsT = sprintf('RED SATURATION = %.2f \nSATURATION:
%.2f',SR, ST);
text(0,0, sprintf(capsT));
% Determine the camera deviceID.
imaqreset;
infom = imaqhwinfo;
for k = 1:length(infom.InstalledAdaptors)
info = imaqhwinfo(infom.InstalledAdaptors{k});
if ~isempty(info.DeviceIDs)
Installedadaptor = infom.InstalledAdaptors{k};
break;
end
end
if ~exist('Installedadaptor', 'var')
h = warndlg('Video camera not connected !','!! Warning
!!', 'replace');
pause (5);
if ishandle(h), close (h); end; beep;
return;
end
filenameprefix = 'FireAlertVideo'; % Filename prefix.
adaptorname = Installedadaptor;
deviceid = '1'; % The maximum should be the total number
of cameras connected.
loopnumber = 0; % How many time the video is divided.
% The following sections takes video according to the time specified by
the user
k = 1;
while 1
my_log = [filenameprefix num2str(refnum) '.avi'];
aviobj = VideoWriter(my_log, 'Motion JPEG AVI');
54
vid = videoinput(adaptorname, deviceid,
'YUY2_320x240');
vid.LoggingMode = 'disk&memory';
vid.DiskLogger = aviobj;
vid.TriggerRepeat = Inf;
set(vid,'FramesPerTrigger', 1500)
start(vid);
close(vid.DiskLogger);
flushdata(vid)
pause (6)
clear my_log;
refnum = refnum + 1;
if k > loopnumber
delete(vid);
clear vid;
break;
end
end
else
subplot(2, 4, [5 8],'Visible','off');
cla;
MeanRGB = sprintf('R = %.2f G = %.2f B = %.2f',MR, MG,
MB);
text(0,1, MeanRGB);
end
else
subplot(2, 4, [5 8],'Visible','off');
cla;
MeanRGB = sprintf('R = %.2f G = %.2f B = %.2f',MR, MG,
MB);
text(0,1, MeanRGB);
end
else
subplot(2, 4, [5 8],'Visible','off');
cla;
MeanRGB = sprintf('R = %.2f G = %.2f B = %.2f',MR, MG, MB);
text(0,1, MeanRGB);
end
subplot(2, 4, 1);
for object = 1:length(stats)
bb = stats(object).BoundingBox;
55
bc = stats(object).Centroid;
rectangle('Position',bb,'EdgeColor','r','LineWidth',2)
%plot(bc(1),bc(2), '-m+')
a=text(bc(1)+15,bc(2), strcat('X: ', num2str(round(bc(1))), '
Y: ', num2str(round(bc(2)))));
set(a, 'FontName', 'Arial', 'FontWeight', 'bold', 'FontSize',
12, 'Color', 'yellow');
drawnow;
end
if frameCounts < 20
frameCounts = frameCounts + 1;
else
frameCounts = 0;
break;
end
fwrite(arduino,angle2); %Write to arduino angle 45 degrees.
pause(0.02)
videoFrame = step(videoDevReader);
origVid = videoFrame;
redVid = videoFrame(:, :, 1);
greenVid = videoFrame(:, :, 2);
blueVid = videoFrame(:, :, 3);
ex_Red = imsubtract(redVid, rgb2gray(videoFrame));
ex_Red = medfilt2(ex_Red, [3 3]); % Use a median filter to filter
out noise
ex_Red = im2bw(ex_Red,0.18); % Convert the resulting grayscale
image into a binary image.
ex_Red = bwareaopen(ex_Red,300); % Remove all those pixels less
than 300px
ex_Green = imsubtract(greenVid, rgb2gray(videoFrame));
ex_Green = medfilt2(ex_Green, [3 3]); % Use a median filter to
filter out noise
ex_Green = im2bw(ex_Green,0.18); % Convert the resulting grayscale
image into a binary image.
ex_Green = bwareaopen(ex_Green,300); % Remove all those pixels
less than 300px
56
ex_Blue = imsubtract(blueVid, rgb2gray(videoFrame));
ex_Blue = medfilt2(ex_Blue, [3 3]); % Use a median filter to
filter out noise
ex_Blue = im2bw(ex_Blue,0.18); % Convert the resulting grayscale
image into a binary image.
ex_Blue = bwareaopen(ex_Blue,300); % Remove all those pixels less
than 300px
bw = bwlabel(ex_Red, 8); % Label all the connected components in
the image.
% Here we do the image blob analysis.
% We get a set of properties for each labeled region.
stats = regionprops(bw, 'BoundingBox', 'Centroid');
MR = mean(mean(redVid));
MG = mean(mean(greenVid));
MB = mean(mean(blueVid));
S = 0.3; % Saturation value of a pixel;
subplot(2, 4, 1); imshow(origVid); title('Original'); drawnow;
subplot(2, 4, 2); imshow(ex_Red); title('Red Frame'); drawnow;
subplot(2, 4, 3); imshow(ex_Green); title('Green Frame'); drawnow;
subplot(2, 4, 4); imshow(ex_Blue); title('Blue Frame'); drawnow;
if MR > MG && MG > MB
if MR > 0.5 % Threshold
if S > ( 1 - MR ) * 0.11 / 0.5
% Must examine here for saturation.
subplot(2, 4, [5 8],'Visible','off');
capsT = sprintf('FIRE DETECTED! PROCESSING..');
cla;
text(0,1, capsT);
drawnow;
hsvImage = rgb2hsv(videoFrame);
%# Convert the image
to HSV space.
satRed = hsvImage(:, :, 1); % Get saturation, red.
SR = mean(mean(satRed)); % Get mean.
%S > (1 - R)ST/RT
ST = (1 - MR) * 0.11 / 0.5;
57
capsT = sprintf('RED SATURATION = %.2f \nSATURATION:
%.2f',SR, ST);
text(0,0, sprintf(capsT));
% Determine the camera deviceID.
imaqreset;
infom = imaqhwinfo;
for k = 1:length(infom.InstalledAdaptors)
info = imaqhwinfo(infom.InstalledAdaptors{k});
if ~isempty(info.DeviceIDs)
Installedadaptor = infom.InstalledAdaptors{k};
break;
end
end
if ~exist('Installedadaptor', 'var')
h = warndlg('Video camera not connected !','!! Warning
!!', 'replace');
pause (5);
if ishandle(h), close (h); end; beep;
return;
end
filenameprefix = 'FireAlertVideo'; % Filename prefix.
adaptorname = Installedadaptor;
deviceid = '1'; % The maximum should be the total number
of cameras connected.
loopnumber = 0; % How many time the video is divided.
% The following sections takes video according to the time specified by
the user
k = 1;
while 1
my_log = [filenameprefix num2str(refnum) '.avi'];
aviobj = VideoWriter(my_log, 'Motion JPEG AVI');
vid = videoinput(adaptorname, deviceid,
'YUY2_320x240');
vid.LoggingMode = 'disk&memory';
vid.DiskLogger = aviobj;
vid.TriggerRepeat = Inf;
set(vid,'FramesPerTrigger', 1500)
start(vid);
close(vid.DiskLogger);
flushdata(vid)
pause (6)
clear my_log;
refnum = refnum + 1;
if k > loopnumber
delete(vid);
clear vid;
break;
end
58
end
else
subplot(2, 4, [5 8],'Visible','off');
cla;
MeanRGB = sprintf('R = %.2f G = %.2f B = %.2f',MR, MG,
MB);
text(0,1, MeanRGB);
end
else
subplot(2, 4, [5 8],'Visible','off');
cla;
MeanRGB = sprintf('R = %.2f G = %.2f B = %.2f',MR, MG,
MB);
text(0,1, MeanRGB);
end
else
subplot(2, 4, [5 8],'Visible','off');
cla;
MeanRGB = sprintf('R = %.2f G = %.2f B = %.2f',MR, MG, MB);
text(0,1, MeanRGB);
end
subplot(2, 4, 1);
for object = 1:length(stats)
bb = stats(object).BoundingBox;
bc = stats(object).Centroid;
rectangle('Position',bb,'EdgeColor','r','LineWidth',2)
%plot(bc(1),bc(2), '-m+')
a=text(bc(1)+15,bc(2), strcat('X: ', num2str(round(bc(1))), '
Y: ', num2str(round(bc(2)))));
set(a, 'FontName', 'Arial', 'FontWeight', 'bold', 'FontSize',
12, 'Color', 'yellow');
drawnow;
end
if frameCounts < 20
frameCounts = frameCounts + 1;
else
frameCounts = 0;
break;
end
59
fwrite(arduino,angle3); %Write to arduino angle 90 degrees.
pause(0.02)
videoFrame = step(videoDevReader);
origVid = videoFrame;
redVid = videoFrame(:, :, 1);
greenVid = videoFrame(:, :, 2);
blueVid = videoFrame(:, :, 3);
ex_Red = imsubtract(redVid, rgb2gray(videoFrame));
ex_Red = medfilt2(ex_Red, [3 3]); % Use a median filter to filter
out noise
ex_Red = im2bw(ex_Red,0.18); % Convert the resulting grayscale
image into a binary image.
ex_Red = bwareaopen(ex_Red,300); % Remove all those pixels less
than 300px
ex_Green = imsubtract(greenVid, rgb2gray(videoFrame));
ex_Green = medfilt2(ex_Green, [3 3]); % Use a median filter to
filter out noise
ex_Green = im2bw(ex_Green,0.18); % Convert the resulting grayscale
image into a binary image.
ex_Green = bwareaopen(ex_Green,300); % Remove all those pixels
less than 300px
ex_Blue = imsubtract(blueVid, rgb2gray(videoFrame));
ex_Blue = medfilt2(ex_Blue, [3 3]); % Use a median filter to
filter out noise
ex_Blue = im2bw(ex_Blue,0.18); % Convert the resulting grayscale
image into a binary image.
ex_Blue = bwareaopen(ex_Blue,300); % Remove all those pixels less
than 300px
bw = bwlabel(ex_Red, 8); % Label all the connected components in
the image.
% Here we do the image blob analysis.
% We get a set of properties for each labeled region.
stats = regionprops(bw, 'BoundingBox', 'Centroid');
MR = mean(mean(redVid));
60
MG = mean(mean(greenVid));
MB = mean(mean(blueVid));
S = 0.3; % Saturation value of a pixel;
subplot(2, 4, 1); imshow(origVid); title('Original'); drawnow;
subplot(2, 4, 2); imshow(ex_Red); title('Red Frame'); drawnow;
subplot(2, 4, 3); imshow(ex_Green); title('Green Frame'); drawnow;
subplot(2, 4, 4); imshow(ex_Blue); title('Blue Frame'); drawnow;
if MR > MG && MG > MB
if MR > 0.5 % Threshold
if S > ( 1 - MR ) * 0.11 / 0.5
% Must examine here for saturation.
subplot(2, 4, [5 8],'Visible','off');
capsT = sprintf('FIRE DETECTED! PROCESSING..');
cla;
text(0,1, capsT);
drawnow;
hsvImage = rgb2hsv(videoFrame);
%# Convert the image
to HSV space.
satRed = hsvImage(:, :, 1); % Get saturation, red.
SR = mean(mean(satRed)); % Get mean.
%S > (1 - R)ST/RT
ST = (1 - MR) * 0.11 / 0.5;
capsT = sprintf('RED SATURATION = %.2f \nSATURATION:
%.2f',SR, ST);
text(0,0, sprintf(capsT));
% Determine the camera deviceID.
imaqreset;
infom = imaqhwinfo;
for k = 1:length(infom.InstalledAdaptors)
info = imaqhwinfo(infom.InstalledAdaptors{k});
if ~isempty(info.DeviceIDs)
Installedadaptor = infom.InstalledAdaptors{k};
break;
end
end
if ~exist('Installedadaptor', 'var')
h = warndlg('Video camera not connected !','!! Warning
!!', 'replace');
pause (5);
if ishandle(h), close (h); end; beep;
return;
end
61
filenameprefix = 'FireAlertVideo'; % Filename prefix.
adaptorname = Installedadaptor;
deviceid = '1'; % The maximum should be the total number
of cameras connected.
loopnumber = 0; % How many time the video is divided.
% The following sections takes video according to the time specified by
the user
k = 1;
while 1
my_log = [filenameprefix num2str(refnum) '.avi'];
aviobj = VideoWriter(my_log, 'Motion JPEG AVI');
vid = videoinput(adaptorname, deviceid,
'YUY2_320x240');
vid.LoggingMode = 'disk&memory';
vid.DiskLogger = aviobj;
vid.TriggerRepeat = Inf;
set(vid,'FramesPerTrigger', 1500)
start(vid);
close(vid.DiskLogger);
flushdata(vid)
pause (6)
clear my_log;
refnum = refnum + 1;
if k > loopnumber
delete(vid);
clear vid;
break;
end
end
else
subplot(2, 4, [5 8],'Visible','off');
cla;
MeanRGB = sprintf('R = %.2f G = %.2f B = %.2f',MR, MG,
MB);
text(0,1, MeanRGB);
end
else
subplot(2, 4, [5 8],'Visible','off');
cla;
MeanRGB = sprintf('R = %.2f G = %.2f B = %.2f',MR, MG,
MB);
text(0,1, MeanRGB);
end
62
else
subplot(2, 4, [5 8],'Visible','off');
cla;
MeanRGB = sprintf('R = %.2f G = %.2f B = %.2f',MR, MG, MB);
text(0,1, MeanRGB);
end
subplot(2, 4, 1);
for object = 1:length(stats)
bb = stats(object).BoundingBox;
bc = stats(object).Centroid;
rectangle('Position',bb,'EdgeColor','r','LineWidth',2)
%plot(bc(1),bc(2), '-m+')
a=text(bc(1)+15,bc(2), strcat('X: ', num2str(round(bc(1))), '
Y: ', num2str(round(bc(2)))));
set(a, 'FontName', 'Arial', 'FontWeight', 'bold', 'FontSize',
12, 'Color', 'yellow');
drawnow;
end
if frameCounts < 20
frameCounts = frameCounts + 1;
else
frameCounts = 0;
break;
end
fwrite(arduino,angle4); %Write to arduino angle 135 degrees.
pause(0.02)
videoFrame = step(videoDevReader);
origVid = videoFrame;
redVid = videoFrame(:, :, 1);
greenVid = videoFrame(:, :, 2);
blueVid = videoFrame(:, :, 3);
ex_Red = imsubtract(redVid, rgb2gray(videoFrame));
ex_Red = medfilt2(ex_Red, [3 3]); % Use a median filter to filter
out noise
ex_Red = im2bw(ex_Red,0.18); % Convert the resulting grayscale
image into a binary image.
ex_Red = bwareaopen(ex_Red,300); % Remove all those pixels less
than 300px
63
ex_Green = imsubtract(greenVid, rgb2gray(videoFrame));
ex_Green = medfilt2(ex_Green, [3 3]); % Use a median filter to
filter out noise
ex_Green = im2bw(ex_Green,0.18); % Convert the resulting grayscale
image into a binary image.
ex_Green = bwareaopen(ex_Green,300); % Remove all those pixels
less than 300px
ex_Blue = imsubtract(blueVid, rgb2gray(videoFrame));
ex_Blue = medfilt2(ex_Blue, [3 3]); % Use a median filter to
filter out noise
ex_Blue = im2bw(ex_Blue,0.18); % Convert the resulting grayscale
image into a binary image.
ex_Blue = bwareaopen(ex_Blue,300); % Remove all those pixels less
than 300px
bw = bwlabel(ex_Red, 8); % Label all the connected components in
the image.
% Here we do the image blob analysis.
% We get a set of properties for each labeled region.
stats = regionprops(bw, 'BoundingBox', 'Centroid');
MR = mean(mean(redVid));
MG = mean(mean(greenVid));
MB = mean(mean(blueVid));
S = 0.3; % Saturation value of a pixel;
subplot(2, 4, 1); imshow(origVid); title('Original'); drawnow;
subplot(2, 4, 2); imshow(ex_Red); title('Red Frame'); drawnow;
subplot(2, 4, 3); imshow(ex_Green); title('Green Frame'); drawnow;
subplot(2, 4, 4); imshow(ex_Blue); title('Blue Frame'); drawnow;
if MR > MG && MG > MB
if MR > 0.5 % Threshold
if S > ( 1 - MR ) * 0.11 / 0.5
% Must examine here for saturation.
subplot(2, 4, [5 8],'Visible','off');
capsT = sprintf('FIRE DETECTED! PROCESSING..');
64
cla;
text(0,1, capsT);
drawnow;
hsvImage = rgb2hsv(videoFrame);
%# Convert the image
to HSV space.
satRed = hsvImage(:, :, 1); % Get saturation, red.
SR = mean(mean(satRed)); % Get mean.
%S > (1 - R)ST/RT
ST = (1 - MR) * 0.11 / 0.5;
capsT = sprintf('RED SATURATION = %.2f \nSATURATION:
%.2f',SR, ST);
text(0,0, sprintf(capsT));
% Determine the camera deviceID.
imaqreset;
infom = imaqhwinfo;
for k = 1:length(infom.InstalledAdaptors)
info = imaqhwinfo(infom.InstalledAdaptors{k});
if ~isempty(info.DeviceIDs)
Installedadaptor = infom.InstalledAdaptors{k};
break;
end
end
if ~exist('Installedadaptor', 'var')
h = warndlg('Video camera not connected !','!! Warning
!!', 'replace');
pause (5);
if ishandle(h), close (h); end; beep;
return;
end
filenameprefix = 'FireAlertVideo'; % Filename prefix.
adaptorname = Installedadaptor;
deviceid = '1'; % The maximum should be the total number
of cameras connected.
loopnumber = 0; % How many time the video is divided.
% The following sections takes video according to the time specified by
the user
k = 1;
while 1
my_log = [filenameprefix num2str(refnum) '.avi'];
aviobj = VideoWriter(my_log, 'Motion JPEG AVI');
vid = videoinput(adaptorname, deviceid,
'YUY2_320x240');
vid.LoggingMode = 'disk&memory';
vid.DiskLogger = aviobj;
vid.TriggerRepeat = Inf;
set(vid,'FramesPerTrigger', 1500)
start(vid);
65
close(vid.DiskLogger);
flushdata(vid)
pause (6)
clear my_log;
refnum = refnum + 1;
if k > loopnumber
delete(vid);
clear vid;
break;
end
end
else
subplot(2, 4, [5 8],'Visible','off');
cla;
MeanRGB = sprintf('R = %.2f G = %.2f B = %.2f',MR, MG,
MB);
text(0,1, MeanRGB);
end
else
subplot(2, 4, [5 8],'Visible','off');
cla;
MeanRGB = sprintf('R = %.2f G = %.2f B = %.2f',MR, MG,
MB);
text(0,1, MeanRGB);
end
else
subplot(2, 4, [5 8],'Visible','off');
cla;
MeanRGB = sprintf('R = %.2f G = %.2f B = %.2f',MR, MG, MB);
text(0,1, MeanRGB);
end
subplot(2, 4, 1);
for object = 1:length(stats)
bb = stats(object).BoundingBox;
bc = stats(object).Centroid;
rectangle('Position',bb,'EdgeColor','r','LineWidth',2)
%plot(bc(1),bc(2), '-m+')
a=text(bc(1)+15,bc(2), strcat('X: ', num2str(round(bc(1))), '
Y: ', num2str(round(bc(2)))));
set(a, 'FontName', 'Arial', 'FontWeight', 'bold', 'FontSize',
12, 'Color', 'yellow');
drawnow;
end
66
if frameCounts < 20
frameCounts = frameCounts + 1;
else
frameCounts = 0;
break;
end
fwrite(arduino,angle5); %Write to arduino angle 180 degrees.
pause(0.02)
videoFrame = step(videoDevReader);
origVid = videoFrame;
redVid = videoFrame(:, :, 1);
greenVid = videoFrame(:, :, 2);
blueVid = videoFrame(:, :, 3);
ex_Red = imsubtract(redVid, rgb2gray(videoFrame));
ex_Red = medfilt2(ex_Red, [3 3]); % Use a median filter to filter
out noise
ex_Red = im2bw(ex_Red,0.18); % Convert the resulting grayscale
image into a binary image.
ex_Red = bwareaopen(ex_Red,300); % Remove all those pixels less
than 300px
ex_Green = imsubtract(greenVid, rgb2gray(videoFrame));
ex_Green = medfilt2(ex_Green, [3 3]); % Use a median filter to
filter out noise
ex_Green = im2bw(ex_Green,0.18); % Convert the resulting grayscale
image into a binary image.
ex_Green = bwareaopen(ex_Green,300); % Remove all those pixels
less than 300px
ex_Blue = imsubtract(blueVid, rgb2gray(videoFrame));
ex_Blue = medfilt2(ex_Blue, [3 3]); % Use a median filter to
filter out noise
ex_Blue = im2bw(ex_Blue,0.18); % Convert the resulting grayscale
image into a binary image.
67
ex_Blue = bwareaopen(ex_Blue,300); % Remove all those pixels less
than 300px
bw = bwlabel(ex_Red, 8); % Label all the connected components in
the image.
% Here we do the image blob analysis.
% We get a set of properties for each labeled region.
stats = regionprops(bw, 'BoundingBox', 'Centroid');
MR = mean(mean(redVid));
MG = mean(mean(greenVid));
MB = mean(mean(blueVid));
S = 0.3; % Saturation value of a pixel;
subplot(2, 4, 1); imshow(origVid); title('Original'); drawnow;
subplot(2, 4, 2); imshow(ex_Red); title('Red Frame'); drawnow;
subplot(2, 4, 3); imshow(ex_Green); title('Green Frame'); drawnow;
subplot(2, 4, 4); imshow(ex_Blue); title('Blue Frame'); drawnow;
if MR > MG && MG > MB
if MR > 0.5 % Threshold
if S > ( 1 - MR ) * 0.11 / 0.5
% Must examine here for saturation.
subplot(2, 4, [5 8],'Visible','off');
capsT = sprintf('FIRE DETECTED! PROCESSING..');
cla;
text(0,1, capsT);
drawnow;
hsvImage = rgb2hsv(videoFrame);
%# Convert the image
to HSV space.
satRed = hsvImage(:, :, 1); % Get saturation, red.
SR = mean(mean(satRed)); % Get mean.
%S > (1 - R)ST/RT
ST = (1 - MR) * 0.11 / 0.5;
capsT = sprintf('RED SATURATION = %.2f \nSATURATION:
%.2f',SR, ST);
text(0,0, sprintf(capsT));
% Determine the camera deviceID.
imaqreset;
infom = imaqhwinfo;
for k = 1:length(infom.InstalledAdaptors)
info = imaqhwinfo(infom.InstalledAdaptors{k});
if ~isempty(info.DeviceIDs)
68
Installedadaptor = infom.InstalledAdaptors{k};
break;
end
end
if ~exist('Installedadaptor', 'var')
h = warndlg('Video camera not connected !','!! Warning
!!', 'replace');
pause (5);
if ishandle(h), close (h); end; beep;
return;
end
filenameprefix = 'FireAlertVideo'; % Filename prefix.
adaptorname = Installedadaptor;
deviceid = '1'; % The maximum should be the total number
of cameras connected.
loopnumber = 0; % How many time the video is divided.
% The following sections takes video according to the time specified by
the user
k = 1;
while 1
my_log = [filenameprefix num2str(refnum) '.avi'];
aviobj = VideoWriter(my_log, 'Motion JPEG AVI');
vid = videoinput(adaptorname, deviceid,
'YUY2_320x240');
vid.LoggingMode = 'disk&memory';
vid.DiskLogger = aviobj;
vid.TriggerRepeat = Inf;
set(vid,'FramesPerTrigger', 1500)
start(vid);
close(vid.DiskLogger);
flushdata(vid)
pause (6)
clear my_log;
refnum = refnum + 1;
if k > loopnumber
delete(vid);
clear vid;
break;
end
end
else
subplot(2, 4, [5 8],'Visible','off');
cla;
MeanRGB = sprintf('R = %.2f G = %.2f B = %.2f',MR, MG,
MB);
text(0,1, MeanRGB);
69
end
else
subplot(2, 4, [5 8],'Visible','off');
cla;
MeanRGB = sprintf('R = %.2f G = %.2f B = %.2f',MR, MG,
MB);
text(0,1, MeanRGB);
end
else
subplot(2, 4, [5 8],'Visible','off');
cla;
MeanRGB = sprintf('R = %.2f G = %.2f B = %.2f',MR, MG, MB);
text(0,1, MeanRGB);
end
subplot(2, 4, 1);
for object = 1:length(stats)
bb = stats(object).BoundingBox;
bc = stats(object).Centroid;
rectangle('Position',bb,'EdgeColor','r','LineWidth',2)
%plot(bc(1),bc(2), '-m+')
a=text(bc(1)+15,bc(2), strcat('X: ', num2str(round(bc(1))), '
Y: ', num2str(round(bc(2)))));
set(a, 'FontName', 'Arial', 'FontWeight', 'bold', 'FontSize',
12, 'Color', 'yellow');
drawnow;
end
if frameCounts < 20
frameCounts = frameCounts + 1;
else
frameCounts = 0;
break;
end
fwrite(arduino,angle4); %Write to arduino angle 135 degrees.
pause(0.02)
videoFrame = step(videoDevReader);
origVid = videoFrame;
redVid = videoFrame(:, :, 1);
greenVid = videoFrame(:, :, 2);
blueVid = videoFrame(:, :, 3);
70
ex_Red = imsubtract(redVid, rgb2gray(videoFrame));
ex_Red = medfilt2(ex_Red, [3 3]); % Use a median filter to filter
out noise
ex_Red = im2bw(ex_Red,0.18); % Convert the resulting grayscale
image into a binary image.
ex_Red = bwareaopen(ex_Red,300); % Remove all those pixels less
than 300px
ex_Green = imsubtract(greenVid, rgb2gray(videoFrame));
ex_Green = medfilt2(ex_Green, [3 3]); % Use a median filter to
filter out noise
ex_Green = im2bw(ex_Green,0.18); % Convert the resulting grayscale
image into a binary image.
ex_Green = bwareaopen(ex_Green,300); % Remove all those pixels
less than 300px
ex_Blue = imsubtract(blueVid, rgb2gray(videoFrame));
ex_Blue = medfilt2(ex_Blue, [3 3]); % Use a median filter to
filter out noise
ex_Blue = im2bw(ex_Blue,0.18); % Convert the resulting grayscale
image into a binary image.
ex_Blue = bwareaopen(ex_Blue,300); % Remove all those pixels less
than 300px
bw = bwlabel(ex_Red, 8); % Label all the connected components in
the image.
% Here we do the image blob analysis.
% We get a set of properties for each labeled region.
stats = regionprops(bw, 'BoundingBox', 'Centroid');
MR = mean(mean(redVid));
MG = mean(mean(greenVid));
MB = mean(mean(blueVid));
S = 0.3; % Saturation value of a pixel;
subplot(2, 4, 1); imshow(origVid); title('Original'); drawnow;
subplot(2, 4, 2); imshow(ex_Red); title('Red Frame'); drawnow;
subplot(2, 4, 3); imshow(ex_Green); title('Green Frame'); drawnow;
71
subplot(2, 4, 4); imshow(ex_Blue); title('Blue Frame'); drawnow;
if MR > MG && MG > MB
if MR > 0.5 % Threshold
if S > ( 1 - MR ) * 0.11 / 0.5
% Must examine here for saturation.
subplot(2, 4, [5 8],'Visible','off');
capsT = sprintf('FIRE DETECTED! PROCESSING..');
cla;
text(0,1, capsT);
drawnow;
hsvImage = rgb2hsv(videoFrame);
%# Convert the image
to HSV space.
satRed = hsvImage(:, :, 1); % Get saturation, red.
SR = mean(mean(satRed)); % Get mean.
%S > (1 - R)ST/RT
ST = (1 - MR) * 0.11 / 0.5;
capsT = sprintf('RED SATURATION = %.2f \nSATURATION:
%.2f',SR, ST);
text(0,0, sprintf(capsT));
% Determine the camera deviceID.
imaqreset;
infom = imaqhwinfo;
for k = 1:length(infom.InstalledAdaptors)
info = imaqhwinfo(infom.InstalledAdaptors{k});
if ~isempty(info.DeviceIDs)
Installedadaptor = infom.InstalledAdaptors{k};
break;
end
end
if ~exist('Installedadaptor', 'var')
h = warndlg('Video camera not connected !','!! Warning
!!', 'replace');
pause (5);
if ishandle(h), close (h); end; beep;
return;
end
filenameprefix = 'FireAlertVideo'; % Filename prefix.
adaptorname = Installedadaptor;
deviceid = '1'; % The maximum should be the total number
of cameras connected.
loopnumber = 0; % How many time the video is divided.
% The following sections takes video according to the time specified by
the user
k = 1;
while 1
72
my_log = [filenameprefix num2str(refnum) '.avi'];
aviobj = VideoWriter(my_log, 'Motion JPEG AVI');
vid = videoinput(adaptorname, deviceid,
'YUY2_320x240');
vid.LoggingMode = 'disk&memory';
vid.DiskLogger = aviobj;
vid.TriggerRepeat = Inf;
set(vid,'FramesPerTrigger', 1500)
start(vid);
close(vid.DiskLogger);
flushdata(vid)
pause (6)
clear my_log;
refnum = refnum + 1;
if k > loopnumber
delete(vid);
clear vid;
break;
end
end
else
subplot(2, 4, [5 8],'Visible','off');
cla;
MeanRGB = sprintf('R = %.2f G = %.2f B = %.2f',MR, MG,
MB);
text(0,1, MeanRGB);
end
else
subplot(2, 4, [5 8],'Visible','off');
cla;
MeanRGB = sprintf('R = %.2f G = %.2f B = %.2f',MR, MG,
MB);
text(0,1, MeanRGB);
end
else
subplot(2, 4, [5 8],'Visible','off');
cla;
MeanRGB = sprintf('R = %.2f G = %.2f B = %.2f',MR, MG, MB);
text(0,1, MeanRGB);
end
subplot(2, 4, 1);
73
for object = 1:length(stats)
bb = stats(object).BoundingBox;
bc = stats(object).Centroid;
rectangle('Position',bb,'EdgeColor','r','LineWidth',2)
%plot(bc(1),bc(2), '-m+')
a=text(bc(1)+15,bc(2), strcat('X: ', num2str(round(bc(1))), '
Y: ', num2str(round(bc(2)))));
set(a, 'FontName', 'Arial', 'FontWeight', 'bold', 'FontSize',
12, 'Color', 'yellow');
drawnow;
end
if frameCounts < 20
frameCounts = frameCounts + 1;
else
frameCounts = 0;
break;
end
fwrite(arduino,angle3); %Write to arduino angle 90 degrees.
pause(0.02)
videoFrame = step(videoDevReader);
origVid = videoFrame;
redVid = videoFrame(:, :, 1);
greenVid = videoFrame(:, :, 2);
blueVid = videoFrame(:, :, 3);
ex_Red = imsubtract(redVid, rgb2gray(videoFrame));
ex_Red = medfilt2(ex_Red, [3 3]); % Use a median filter to filter
out noise
ex_Red = im2bw(ex_Red,0.18); % Convert the resulting grayscale
image into a binary image.
ex_Red = bwareaopen(ex_Red,300); % Remove all those pixels less
than 300px
ex_Green = imsubtract(greenVid, rgb2gray(videoFrame));
ex_Green = medfilt2(ex_Green, [3 3]); % Use a median filter to
filter out noise
ex_Green = im2bw(ex_Green,0.18); % Convert the resulting grayscale
image into a binary image.
ex_Green = bwareaopen(ex_Green,300); % Remove all those pixels
less than 300px
74
ex_Blue = imsubtract(blueVid, rgb2gray(videoFrame));
ex_Blue = medfilt2(ex_Blue, [3 3]); % Use a median filter to
filter out noise
ex_Blue = im2bw(ex_Blue,0.18); % Convert the resulting grayscale
image into a binary image.
ex_Blue = bwareaopen(ex_Blue,300); % Remove all those pixels less
than 300px
bw = bwlabel(ex_Red, 8); % Label all the connected components in
the image.
% Here we do the image blob analysis.
% We get a set of properties for each labeled region.
stats = regionprops(bw, 'BoundingBox', 'Centroid');
MR = mean(mean(redVid));
MG = mean(mean(greenVid));
MB = mean(mean(blueVid));
S = 0.3; % Saturation value of a pixel;
subplot(2, 4, 1); imshow(origVid); title('Original'); drawnow;
subplot(2, 4, 2); imshow(ex_Red); title('Red Frame'); drawnow;
subplot(2, 4, 3); imshow(ex_Green); title('Green Frame'); drawnow;
subplot(2, 4, 4); imshow(ex_Blue); title('Blue Frame'); drawnow;
if MR > MG && MG > MB
if MR > 0.5 % Threshold
if S > ( 1 - MR ) * 0.11 / 0.5
% Must examine here for saturation.
subplot(2, 4, [5 8],'Visible','off');
capsT = sprintf('FIRE DETECTED! PROCESSING..');
cla;
text(0,1, capsT);
drawnow;
hsvImage = rgb2hsv(videoFrame);
%# Convert the image
to HSV space.
satRed = hsvImage(:, :, 1); % Get saturation, red.
SR = mean(mean(satRed)); % Get mean.
%S > (1 - R)ST/RT
ST = (1 - MR) * 0.11 / 0.5;
75
capsT = sprintf('RED SATURATION = %.2f \nSATURATION:
%.2f',SR, ST);
text(0,0, sprintf(capsT));
% Determine the camera deviceID.
imaqreset;
infom = imaqhwinfo;
for k = 1:length(infom.InstalledAdaptors)
info = imaqhwinfo(infom.InstalledAdaptors{k});
if ~isempty(info.DeviceIDs)
Installedadaptor = infom.InstalledAdaptors{k};
break;
end
end
if ~exist('Installedadaptor', 'var')
h = warndlg('Video camera not connected !','!! Warning
!!', 'replace');
pause (5);
if ishandle(h), close (h); end; beep;
return;
end
filenameprefix = 'FireAlertVideo'; % Filename prefix.
adaptorname = Installedadaptor;
deviceid = '1'; % The maximum should be the total number
of cameras connected.
loopnumber = 0; % How many time the video is divided.
% The following sections takes video according to the time specified by
the user
k = 1;
while 1
my_log = [filenameprefix num2str(refnum) '.avi'];
aviobj = VideoWriter(my_log, 'Motion JPEG AVI');
vid = videoinput(adaptorname, deviceid,
'YUY2_320x240');
vid.LoggingMode = 'disk&memory';
vid.DiskLogger = aviobj;
vid.TriggerRepeat = Inf;
set(vid,'FramesPerTrigger', 1500)
start(vid);
close(vid.DiskLogger);
flushdata(vid)
pause (6)
clear my_log;
refnum = refnum + 1;
if k > loopnumber
delete(vid);
clear vid;
break;
end
76
end
else
subplot(2, 4, [5 8],'Visible','off');
cla;
MeanRGB = sprintf('R = %.2f G = %.2f B = %.2f',MR, MG,
MB);
text(0,1, MeanRGB);
end
else
subplot(2, 4, [5 8],'Visible','off');
cla;
MeanRGB = sprintf('R = %.2f G = %.2f B = %.2f',MR, MG,
MB);
text(0,1, MeanRGB);
end
else
subplot(2, 4, [5 8],'Visible','off');
cla;
MeanRGB = sprintf('R = %.2f G = %.2f B = %.2f',MR, MG, MB);
text(0,1, MeanRGB);
end
subplot(2, 4, 1);
for object = 1:length(stats)
bb = stats(object).BoundingBox;
bc = stats(object).Centroid;
rectangle('Position',bb,'EdgeColor','r','LineWidth',2)
%plot(bc(1),bc(2), '-m+')
a=text(bc(1)+15,bc(2), strcat('X: ', num2str(round(bc(1))), '
Y: ', num2str(round(bc(2)))));
set(a, 'FontName', 'Arial', 'FontWeight', 'bold', 'FontSize',
12, 'Color', 'yellow');
drawnow;
end
if frameCounts < 20
frameCounts = frameCounts + 1;
else
frameCounts = 0;
break;
end
77
fwrite(arduino,angle2); %Write to arduino angle 45 degrees.
pause(0.02)
videoFrame = step(videoDevReader);
origVid = videoFrame;
redVid = videoFrame(:, :, 1);
greenVid = videoFrame(:, :, 2);
blueVid = videoFrame(:, :, 3);
ex_Red = imsubtract(redVid, rgb2gray(videoFrame));
ex_Red = medfilt2(ex_Red, [3 3]); % Use a median filter to filter
out noise
ex_Red = im2bw(ex_Red,0.18); % Convert the resulting grayscale
image into a binary image.
ex_Red = bwareaopen(ex_Red,300); % Remove all those pixels less
than 300px
ex_Green = imsubtract(greenVid, rgb2gray(videoFrame));
ex_Green = medfilt2(ex_Green, [3 3]); % Use a median filter to
filter out noise
ex_Green = im2bw(ex_Green,0.18); % Convert the resulting grayscale
image into a binary image.
ex_Green = bwareaopen(ex_Green,300); % Remove all those pixels
less than 300px
ex_Blue = imsubtract(blueVid, rgb2gray(videoFrame));
ex_Blue = medfilt2(ex_Blue, [3 3]); % Use a median filter to
filter out noise
ex_Blue = im2bw(ex_Blue,0.18); % Convert the resulting grayscale
image into a binary image.
ex_Blue = bwareaopen(ex_Blue,300); % Remove all those pixels less
than 300px
bw = bwlabel(ex_Red, 8); % Label all the connected components in
the image.
% Here we do the image blob analysis.
% We get a set of properties for each labeled region.
stats = regionprops(bw, 'BoundingBox', 'Centroid');
MR = mean(mean(redVid));
78
MG = mean(mean(greenVid));
MB = mean(mean(blueVid));
S = 0.3; % Saturation value of a pixel;
subplot(2, 4, 1); imshow(origVid); title('Original'); drawnow;
subplot(2, 4, 2); imshow(ex_Red); title('Red Frame'); drawnow;
subplot(2, 4, 3); imshow(ex_Green); title('Green Frame'); drawnow;
subplot(2, 4, 4); imshow(ex_Blue); title('Blue Frame'); drawnow;
if MR > MG && MG > MB
if MR > 0.5 % Threshold
if S > ( 1 - MR ) * 0.11 / 0.5
% Must examine here for saturation.
subplot(2, 4, [5 8],'Visible','off');
capsT = sprintf('FIRE DETECTED! PROCESSING..');
cla;
text(0,1, capsT);
drawnow;
hsvImage = rgb2hsv(videoFrame);
%# Convert the image
to HSV space.
satRed = hsvImage(:, :, 1); % Get saturation, red.
SR = mean(mean(satRed)); % Get mean.
%S > (1 - R)ST/RT
ST = (1 - MR) * 0.11 / 0.5;
capsT = sprintf('RED SATURATION = %.2f \nSATURATION:
%.2f',SR, ST);
text(0,0, sprintf(capsT));
% Determine the camera deviceID.
imaqreset;
infom = imaqhwinfo;
for k = 1:length(infom.InstalledAdaptors)
info = imaqhwinfo(infom.InstalledAdaptors{k});
if ~isempty(info.DeviceIDs)
Installedadaptor = infom.InstalledAdaptors{k};
break;
end
end
if ~exist('Installedadaptor', 'var')
h = warndlg('Video camera not connected !','!! Warning
!!', 'replace');
pause (5);
if ishandle(h), close (h); end; beep;
return;
end
79
filenameprefix = 'FireAlertVideo'; % Filename prefix.
adaptorname = Installedadaptor;
deviceid = '1'; % The maximum should be the total number
of cameras connected.
loopnumber = 0; % How many time the video is divided.
% The following sections takes video according to the time specified by
the user
k = 1;
while 1
my_log = [filenameprefix num2str(refnum) '.avi'];
aviobj = VideoWriter(my_log, 'Motion JPEG AVI');
vid = videoinput(adaptorname, deviceid,
'YUY2_320x240');
vid.LoggingMode = 'disk&memory';
vid.DiskLogger = aviobj;
vid.TriggerRepeat = Inf;
set(vid,'FramesPerTrigger', 1500)
start(vid);
close(vid.DiskLogger);
flushdata(vid)
pause (6)
clear my_log;
refnum = refnum + 1;
if k > loopnumber
delete(vid);
clear vid;
break;
end
end
else
subplot(2, 4, [5 8],'Visible','off');
cla;
MeanRGB = sprintf('R = %.2f G = %.2f B = %.2f',MR, MG,
MB);
text(0,1, MeanRGB);
end
else
subplot(2, 4, [5 8],'Visible','off');
cla;
MeanRGB = sprintf('R = %.2f G = %.2f B = %.2f',MR, MG,
MB);
text(0,1, MeanRGB);
end
80
else
subplot(2, 4, [5 8],'Visible','off');
cla;
MeanRGB = sprintf('R = %.2f G = %.2f B = %.2f',MR, MG, MB);
text(0,1, MeanRGB);
end
subplot(2, 4, 1);
for object = 1:length(stats)
bb = stats(object).BoundingBox;
bc = stats(object).Centroid;
rectangle('Position',bb,'EdgeColor','r','LineWidth',2)
%plot(bc(1),bc(2), '-m+')
a=text(bc(1)+15,bc(2), strcat('X: ', num2str(round(bc(1))), '
Y: ', num2str(round(bc(2)))));
set(a, 'FontName', 'Arial', 'FontWeight', 'bold', 'FontSize',
12, 'Color', 'yellow');
drawnow;
end
if frameCounts < 20
frameCounts = frameCounts + 1;
else
frameCounts = 0;
break;
end
fwrite(arduino,angle1); %Write to arduino angle 0 degrees.
pause(0.02)
videoFrame = step(videoDevReader);
origVid = videoFrame;
redVid = videoFrame(:, :, 1);
greenVid = videoFrame(:, :, 2);
blueVid = videoFrame(:, :, 3);
ex_Red = imsubtract(redVid, rgb2gray(videoFrame));
ex_Red = medfilt2(ex_Red, [3 3]); % Use a median filter to filter
out noise
ex_Red = im2bw(ex_Red,0.18); % Convert the resulting grayscale
image into a binary image.
ex_Red = bwareaopen(ex_Red,300); % Remove all those pixels less
than 300px
81
ex_Green = imsubtract(greenVid, rgb2gray(videoFrame));
ex_Green = medfilt2(ex_Green, [3 3]); % Use a median filter to
filter out noise
ex_Green = im2bw(ex_Green,0.18); % Convert the resulting grayscale
image into a binary image.
ex_Green = bwareaopen(ex_Green,300); % Remove all those pixels
less than 300px
ex_Blue = imsubtract(blueVid, rgb2gray(videoFrame));
ex_Blue = medfilt2(ex_Blue, [3 3]); % Use a median filter to
filter out noise
ex_Blue = im2bw(ex_Blue,0.18); % Convert the resulting grayscale
image into a binary image.
ex_Blue = bwareaopen(ex_Blue,300); % Remove all those pixels less
than 300px
bw = bwlabel(ex_Red, 8); % Label all the connected components in
the image.
% Here we do the image blob analysis.
% We get a set of properties for each labeled region.
stats = regionprops(bw, 'BoundingBox', 'Centroid');
MR = mean(mean(redVid));
MG = mean(mean(greenVid));
MB = mean(mean(blueVid));
S = 0.3; % Saturation value of a pixel;
subplot(2, 4, 1); imshow(origVid); title('Original'); drawnow;
subplot(2, 4, 2); imshow(ex_Red); title('Red Frame'); drawnow;
subplot(2, 4, 3); imshow(ex_Green); title('Green Frame'); drawnow;
subplot(2, 4, 4); imshow(ex_Blue); title('Blue Frame'); drawnow;
if MR > MG && MG > MB
if MR > 0.5 % Threshold
if S > ( 1 - MR ) * 0.11 / 0.5
% Must examine here for saturation.
subplot(2, 4, [5 8],'Visible','off');
capsT = sprintf('FIRE DETECTED! PROCESSING..');
82
cla;
text(0,1, capsT);
drawnow;
hsvImage = rgb2hsv(videoFrame);
%# Convert the image
to HSV space.
satRed = hsvImage(:, :, 1); % Get saturation, red.
SR = mean(mean(satRed)); % Get mean.
%S > (1 - R)ST/RT
ST = (1 - MR) * 0.11 / 0.5;
capsT = sprintf('RED SATURATION = %.2f \nSATURATION:
%.2f',SR, ST);
text(0,0, sprintf(capsT));
% Determine the camera deviceID.
imaqreset;
infom = imaqhwinfo;
for k = 1:length(infom.InstalledAdaptors)
info = imaqhwinfo(infom.InstalledAdaptors{k});
if ~isempty(info.DeviceIDs)
Installedadaptor = infom.InstalledAdaptors{k};
break;
end
end
if ~exist('Installedadaptor', 'var')
h = warndlg('Video camera not connected !','!! Warning
!!', 'replace');
pause (5);
if ishandle(h), close (h); end; beep;
return;
end
filenameprefix = 'FireAlertVideo'; % Filename prefix.
adaptorname = Installedadaptor;
deviceid = '1'; % The maximum should be the total number
of cameras connected.
loopnumber = 0; % How many time the video is divided.
% The following sections takes video according to the time specified by
the user
k = 1;
while 1
my_log = [filenameprefix num2str(refnum) '.avi'];
aviobj = VideoWriter(my_log, 'Motion JPEG AVI');
vid = videoinput(adaptorname, deviceid,
'YUY2_320x240');
vid.LoggingMode = 'disk&memory';
vid.DiskLogger = aviobj;
vid.TriggerRepeat = Inf;
set(vid,'FramesPerTrigger', 1500)
start(vid);
83
close(vid.DiskLogger);
flushdata(vid)
pause (6)
clear my_log;
refnum = refnum + 1;
if k > loopnumber
delete(vid);
clear vid;
break;
end
end
else
subplot(2, 4, [5 8],'Visible','off');
cla;
MeanRGB = sprintf('R = %.2f G = %.2f B = %.2f',MR, MG,
MB);
text(0,1, MeanRGB);
end
else
subplot(2, 4, [5 8],'Visible','off');
cla;
MeanRGB = sprintf('R = %.2f G = %.2f B = %.2f',MR, MG,
MB);
text(0,1, MeanRGB);
end
else
subplot(2, 4, [5 8],'Visible','off');
cla;
MeanRGB = sprintf('R = %.2f G = %.2f B = %.2f',MR, MG, MB);
text(0,1, MeanRGB);
end
subplot(2, 4, 1);
for object = 1:length(stats)
bb = stats(object).BoundingBox;
bc = stats(object).Centroid;
rectangle('Position',bb,'EdgeColor','r','LineWidth',2)
%plot(bc(1),bc(2), '-m+')
a=text(bc(1)+15,bc(2), strcat('X: ', num2str(round(bc(1))), '
Y: ', num2str(round(bc(2)))));
set(a, 'FontName', 'Arial', 'FontWeight', 'bold', 'FontSize',
12, 'Color', 'yellow');
drawnow;
end
84
if frameCounts < 20
frameCounts = frameCounts + 1;
else
frameCounts = 0;
break;
end
end
end
disp('Program End.') % Message sent to command window.
return
85