1
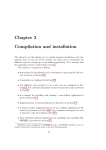
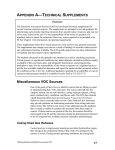
Blast2GO PRO Plug-in
User Manual
CLC bio Genomics Workbench
and Main Workbench
Version 1.0.2, May 2013
BioBam Bioinformatics S.L.
Valencia, Spain
Contents
Introduction
1
Quick-Start
2
Blast2GO PRO Plug-in Manual
1
Blast2GO PRO Plug-in . . . . . . . . . . . . . .
1.1
Blast2GO PRO Plug-in Toolbox functions
1.2
The Blast2GO sequence Table . . . . . .
1.3
Blast2GO Sequence Table Side Panel . . .
2
BLAST . . . . . . . . . . . . . . . . . . . . . . .
3
Mapping . . . . . . . . . . . . . . . . . . . . . . .
4
Annotation . . . . . . . . . . . . . . . . . . . . .
5
InterProScan . . . . . . . . . . . . . . . . . . . .
6
GO-Slim . . . . . . . . . . . . . . . . . . . . . . .
7
Manage Projects . . . . . . . . . . . . . . . . . .
8
Miscellaneous . . . . . . . . . . . . . . . . . . . .
9
Analysis . . . . . . . . . . . . . . . . . . . . . . .
9.1
Create Combined Graphs . . . . . . . . .
9.2
Create Pie Chart . . . . . . . . . . . . . .
9.3
Statistics . . . . . . . . . . . . . . . . . .
10 Enrichment Analysis - Fisher’s Exact Test . . . .
10.1 Run a Fisher’s Exact Test . . . . . . . . .
10.2 Parameter . . . . . . . . . . . . . . . . . .
10.3 Results . . . . . . . . . . . . . . . . . . .
10.4 Reduce to most specific terms . . . . . . .
.
.
.
.
.
.
.
.
.
.
.
.
.
.
.
.
.
.
.
.
.
.
.
.
.
.
.
.
.
.
.
.
.
.
.
.
.
.
.
.
.
.
.
.
.
.
.
.
.
.
.
.
.
.
.
.
.
.
.
.
.
.
.
.
.
.
.
.
.
.
.
.
.
.
.
.
.
.
.
.
.
.
.
.
.
.
.
.
.
.
.
.
.
.
.
.
.
.
.
.
.
.
.
.
.
.
.
.
.
.
.
.
.
.
.
.
.
.
.
.
.
.
.
.
.
.
.
.
.
.
.
.
.
.
.
.
.
.
.
.
.
.
.
.
.
.
.
.
.
.
.
.
.
.
.
.
.
.
.
.
.
.
.
.
.
.
.
.
.
.
.
.
.
.
.
.
.
.
.
.
.
.
.
.
.
.
.
.
.
.
.
.
.
.
.
.
.
.
.
.
.
.
.
.
.
.
.
.
.
.
.
.
.
.
.
.
.
.
.
.
.
.
.
.
.
.
.
.
.
.
.
.
.
.
.
.
.
.
.
.
.
.
.
.
.
.
.
.
.
.
.
.
.
.
.
.
.
.
.
.
.
.
.
.
.
.
.
.
.
.
.
.
.
.
.
.
.
.
.
.
.
.
.
.
.
.
.
.
.
.
.
.
.
.
.
.
.
.
.
.
.
.
.
.
.
.
.
.
.
.
.
.
.
.
.
.
.
.
.
.
.
.
.
.
.
.
.
.
.
.
.
.
.
.
.
.
.
.
.
.
.
.
.
.
.
.
.
.
.
.
.
.
.
.
.
.
.
.
.
.
4
4
4
4
4
5
5
7
7
8
8
8
9
9
10
10
15
15
15
16
16
A Blast2GO Workflow
17
Please Cite
20
Copyright 2013 - BioBam Bioinformatics S.L.
Introduction
Support: [email protected]
Website: http://www.blast2go.com
Blast2GO [Conesa et al., 2005] is a methodology for the functional annotation and analysis of
gene or protein sequences. The method uses local sequence alignments (BLAST) to find similar
sequences (potential homologs) for one or several input sequences. The program extracts all GO
terms associated to each of the obtained hits and returns an evaluated GO annotation for the
query sequence(s). Enzyme codes are obtained by mapping from equivalent GOs while InterPro motifs can directly be queried at the InterProScan web service. A basic annotation process
with Blast2GO consists of 3 steps: blasting, mapping and annotation. These steps will be described in this manual including further explanations and information on additional functions.
[Götz et al., 2008]
Figure 1.1: Main Sequence Table of the Blast2GO PRO Plugin
Copyright 2013 - BioBam Bioinformatics S.L.
1
Quick-Start
This section gives a quick survey on a typical Blast2GO usage. Detailed descriptions of the
different steps and possibilities of this plugin are given in the remaining sections of this manual.
1. Load data:
To start an annotation proccess load a Fasta sequence file:
Menu →Import →Standard Import →File Type: Blast2GO Blast Result / Fasta File
You can also add an example dataset to your Navigation Area from: Edit →Preferences
→Gerneral →Blast2GO →Create Blast2GO Example Dataset
This dataset contains 10 sequences as plain sequences.
2. Blast your sequences:
Please see: BLAST at NCBI in the workbench Help
Note: If we already have a set of blasted sequences we can use the Import function from
the main menu to create a new Blast2GO project. I we want to add Blast results in XML
format to an already existing project we will have to use the function File →Import Blast
Result XML from the main menu.
3. Convert Blast to Blast2GO Project:
Go to Toolbox →Manage Project →Convert Data to Blast2GO Project to convert your
Blast results into a Blast2GO Project.
4. Perform Gene Ontoloy Mapping:
Go to Toolbox →Mapping →Mapping to start the mapping. Mapped sequences will turn
green. Once Mapping is completed visualize your results at Mapping →Mapping Statistics.
5. Annotation:
Go to Toolbox →Annotation →Annotation to run the annotation step. Leave the default
parameters for the annotation rule as well as the Evicence Codes. Annotated sequences
will turn blue.
6. Generate Statistic Charts:
Once the annotation process is finished we can generate all the different statistics charts
from: Toolbox →Miscellaneous →Statistics
7. Modify Annotations:
To modify the annotations click on one of the sequences form the Blast2GO sequence table
with the left mouse button and select Change Annotation and Description.
To change the extent of annotations we can add implicit terms via Annex (Toolbox →Miscellaneous
→Run Annex )
To reduce the amount of functional information and to summarize the functional content
of a dataset run a GO-Slim reduction(Toolbox →GO-Slim →GO-Slim).
8. InterProScan:
To complement the Blast-based annotations with domain-based annotations run an InterProScan Search. Go to Toolbox →InterProScan. This step is recommended to improve
the annotation outcome. Once InterProScan results are retrieved use Merge InterProScan
to add the GO terms obtained through motifs/domains to the current/existing annotations.
Note: If we already have a set of InterProScan results in XML format we can add them to
the existing Blast2GO project from the main menu: File →Import InterProScan XMLs.
Copyright 2013 - BioBam Bioinformatics S.L.
2
9. Export Results:
Once the annotation process has concluded several options exist to export the results via
the Workbench Export function.
• annot-file: The annot file is the standard format to export GO annotations. It is a
tab-separated text file, each row contains one GO term.
• dat-file: The standard Blast2GO project file. This file can also be opened with the
standalone Blast2GO application.
• Sequence Table: A tab-separated text file containing all the information given in the
Blast2GO sequence table.
• GAF 2.0: A tab-separated text file of the funtional information in the Gene Ontology
annotation file format. The content of this format can also be viewed within the
Workbench via the Create Annotation Table function from the toolbox.
Figure 2.1: The work-flow from the example data shows a similar scenario as described above.
The work-flow accepts as input a Blast2GO project generated from via a Blast XML file import
or a Multi-Blast CLC Object. It proceeds than with mapping, annotation, InterporScan, merges
the annotations obtained through Blast and Domain searches and generates several charts on
the way. The Blast2GO Project is saved after each step.
Copyright 2013 - BioBam Bioinformatics S.L.
3
Blast2GO PRO Plug-in Manual
1
Blast2GO PRO Plug-in
1.1
Blast2GO PRO Plug-in Toolbox functions
• BLAST: Contains functions for performing BLAST searches and resetting results.
• Gene Ontology Mapping of Blast results: This function fetches GO terms associated to hit
sequences obtained by BLAST.
• Functional Annotation: Includes different functions to obtain and modulate GO, computing
GoSlim view, Enzyme Code annotation with KEGG maps and InterPro annotation.
• InterProScan Domain Searches
• GO-Slim Reduction
• Analysis: This tab hosts different options for the analysis of the available functional annotation. Includes graphical exploration through the Combined Graph Display and performing
statistical analysis of GO distributions for groups of sequences
• Combined Graphs: This tab offers different descriptive statistics charts for the results
of BLAST, mapping and annotation.
• Pie Charts: This tab offers different descriptive statistics charts for the results of
BLAST, mapping and annotation.
• Statistics Charts: This tab offers different descriptive statistics charts for the results
of BLAST, mapping and annotation.
• Various data import and export formats
1.2
The Blast2GO sequence Table
• Colors: Different colors indicate the status of each sequence.
• Context menu: Several options available for a single sequences are available via the rightclick context menu.
Figure 3.1: Different colour codes indicating the status of the sequences
1.3
Blast2GO Sequence Table Side Panel
• Show: Allows to change the visualization of several columns of the sequence table. It
is possible to switch between GO IDs or GO names, show or hide the GO categories of
each GO term, show InterproScan Accession or the corresponding GO IDs, choose between
Enzyme codes or names. ¡br¿The option allows to show only selected sequences which can
be helpful in combination with the select-functions (see below).
Copyright 2013 - BioBam Bioinformatics S.L.
4
• Selection: Allows to select, un-select, invert and delete a given selection.
• Select by State: Allows to make a selections based on the sequence status (colours).
• Select by: Allows to select sequences based on their name, function (GO terms or IDs),
description, enzyme code or InterPro ID. The selection-type, exact search (whole word
(important for IDs) has to match) and case sensitivity can be chosen. A search criteria can
be provided via a search field . Alternatively a list of sequence names or GO functions can
be loaded via a text file. Finally we have to decide if the search result has do be added
or removed form the actual selection (select or un-select the sequences which match the
criteria). The search can be started by clicking the apply button.
2
BLAST
Import Blast
Import Blast via the general Workbench import function. Please go to: Menu →Import →Standard
Import and select the file type Blast2GO Project via Blast XML result (.xml)
For further instructions please see: Import using the import dialog in the CLC bio Workbench Help.
3
Mapping
Mapping is the process of retrieving GO terms associated to the hits obtained after a BLAST
search. To run mapping, select one or various data-sets, which contain blasted sequences and
execute the mapping function. When a BLAST result is successfully mapped to one or several
GO terms, these will come up at the GOs column of the Main Sequence Table. Assigned GOs to
hits can be reviewed in the BLAST Results Browser. Successfully mapped sequences will turn
green.
R performs different mapping steps to link all BLAST hits to the functional information
Blast2GO
R uses different public resources provided
stored in the Gene Ontology database. Therefore Blast2GO
by the NCBI, PIR and GO to link the different protein IDs (names, symbols, GIs, UniProts, etc.)
to the information stored in the Gene Ontology database - the GO database contains several million
functionally annotated gene products for hundreds of different species. All annotations are associated
to and Evidence Code which provides information about the quality of this functional assignment.
1. BLAST result accessions are used to retrieve gene names or Symbols making use of two mapping
files provided by NCBI. Identified gene names are than searched in the species specific entries of
the GO database.
2. BLAST result GI identifiers are used to retrieve UniProt IDs making use of a mapping file from
PIR including PSD, UniProt, Swiss-Prot, TrEMBL, RefSeq, GenPept and PDB.
3. BLAST result accessions are searched directly in the GO database.
Statistics
Three evaluation charts are available to summarize the mapping results. The ”DB resources of mapping”
chart shows from which database annotations has been obtained and the Evidence Code distribution for
hits and sequences indicated how EC associate in the obtained GO pool. Note that in most cases IEA
(electronic annotation) are overwhelmed in the mapping results. However, the contribution of this (and
other) type of annotation to the finally assigned annotations to the query set can be modulated at the
annotation step.
Reset Mapping
Removes already obtained results for a given dataset.
Copyright 2013 - BioBam Bioinformatics S.L.
5
(a) Toolbox area
(b) Sequence editor side-panel
Figure 3.2: User Interface: The Blast2GO Toolbox and the Main Sequence Side-Panel
Copyright 2013 - BioBam Bioinformatics S.L.
6
4
Annotation
This is the process of selecting GO terms from the GO pool obtained by the Mapping step and assigning
them to the query sequences. GO annotation is carried out by applying an annotation rule (AR) on
the found ontology terms. The rule seeks to find the most specific annotations with a certain level of
reliability. This process is adjustable in specificity and stringency. For each candidate GO an annotation
score (AS) is computed. The AS is composed of two additive terms.
The first, direct term (DT), represents the highest hit similarity of this GO weighted by a factor corresponding to its EC.
The second term (AT) of the AS provides the possibility of abstraction. This is defined as annotation
to a parent node when several child nodes are present in the GO candidate collection. This term multiplies the number of total GOs unified at the node by a user defined GO weight factor that controls the
possibility and strength of abstraction. When GO weight is set to 0, no abstraction is done.
Finally, the AR selects the lowest term per branch that lies over a user defined threshold. DT, AT and
the AR terms are defined as given in Figure 1.
To better understand how the annotation score works, the following reasoning can be done:
When EC-weight is set to 1 for all ECs (no EC influence) and GO-weight equals zero (no abstraction),
then the annotation score equals the maximum similarity value of the hits that have that GO term and
the sequence will be annotated with that GO term if that score is above the given threshold provided.
The situation when EC-weights are lower than 1 means that higher similarities are required to reach
the threshold. If the GO-weight is different to 0 this means that the possibility is enabled that a parent
node will reach the threshold while its various children nodes would not.
The annotation rule provides a general framework for annotation. The actual way annotation occurs
depends on how the different parameters at the AS are set.
1. E-Value Hit Filter. This value can be understood as a pre-filter: only GO terms obtained from
hits with a greater e-value than given will be used for annotation and/or shown in a generated
graph (default=1.0E-6).
2. Annotation Cut-Off (threshold).The annotation rule selects the lowest term per branch that lies
over this threshold (default=55).
3. GO-Weight. This is the weight given to the contribution of mapped children terms to the annotation of a parent term (default=5).
4. Hsp-Hit Coverage CutOff. Sets the minimum needed coverage between a Hit and his HSP. For
example a value of 80 would mean that the aligned HSP must cover at least 80% of the longitude
of its Hit. Only annotations from Hit fulfilling this criterion will be considered for annotation
transference.
5. EC-Weight. Note that in case influence by evidence codes is not wanted, you can set them all at
1. Alternatively, when you want to exclude GO annotations of a certain EC (for example IEAs),
you can set this EC weight at 0.
Successful annotation for each query sequence will result in a color change for that sequence from lightgreen to blue at the Main Sequence Table, and only the annotated GOs will remain in the GO IDs
column. An overview of the extent and intensity of the annotation can be obtained from the Annotation
Distribution Chart, which shows the number of sequences annotated at different amounts of GO-terms.
Reset Annotation
Removes already obtained results for a given data-set.
5
InterProScan
R allows to retrieve domain/motif information
The functionality of InterPro annotations in Blast2GO
in a sequence-wise manner. The processed sequence have to contain a valid sequence string, which is
not the case when they were just imported through a blast-result-file. IPRscan results can be viewed
through the Single Sequence Menu.
Merge InterProScan
In this step the obtained GO terms have to be transferred to the sequences and merged with already
existent GO terms.
Copyright 2013 - BioBam Bioinformatics S.L.
7
Reset InterProScan
Removes already obtained results for a given dataset.
6
GO-Slim
GO-Slim is a reduced version of the Gene Ontology that contains a selected number of relevant GO
terms. The GO-Slim algorithm generates a GO-Slim mapping for the available annotations and permits
in this way the projection of certain specific terms into more generic ones i.e. GO-Slim summarizes a set
of GO annotations from e.g. a whole-genome microarray analysis to a simpler, more general functional
R supports
schema. Different GO-Slims are available which are adapted to specific organisms. Blast2GO
the following GO-Slim mappings: General, Plant, PIR, Yeast, GOA (GO-Association), TAIR, Candida
and Pombe.
GO-Slim is often used before a GO Combined Graph is generated. GoSlim performs a graph pruning
based on a manually defined subset of more general GO terms in order to summarize the information
in a graph. The result is that a DAG of thousands of nodes can be “summarized” or slimmed to a few
dozen key terms, which makes the graph navigable and easy to interpret. However, the GoSlim method
has several characteristics that are not always appropriate. The manually defined subsets are context
dependent (e.g different definitions for different species), the level/degree of abstraction is static, and
information at more specific levels is blurred.
7
Manage Projects
Combine External Datasets
R project with another .dat or .annot
This function allows to combine an already existing Blast2GO
file. In the case of .dat files, only those sequences will be added to the existing data-set which sequence
names do not already exist . In case of the .annot file, annotation information will be added and merged
i.e. if a sequence with a given sequence name already exists in the data-set, the new annotations will be
added to this sequences and a validation check is performed (see section 8).
Combine Blast2GO Projects
This function allows to combine Blast2GO Projects which are already imported into the workbench.
Convert Data to Blast2GO Project
R project.
This function allows to convert various CLC bio data-types to a Blast2GO
Supported CLC bio data-types are:
• Nucleotide Sequence(s)
• Protein Sequence(s)
• BLAST-Result
8
Miscellaneous
Blast Description Annotation
R is to assign functional labels in form of GO-terms to nucleotide or
The primary goal of Blast2GO
protein sequences. However, not only functional labels but also a meaningful description for novel
sequences is desired. A common approach is to directly transfer the ”Best-BLAST-hit description to the
novel sequence. It is frequent that best-hit descriptions are of low-informative text such as ”unknown”,
”putative” or ”hypothetical” while descriptions of other Blast hits of the same sequence do contain
R .
informative keywords. For this reason, a text-mining functionality has been included in Blast2GO
It analyses a set of sequence descriptions of a given BLAST result. The feature is called the BLAST
Description Annotator (BDA). Depending on the frequency of occurrence and the information content,
the most suitable description is selected out of the collection of words. In this way, this simple approach
avoids sequence descriptions like for example ”hypothetical”, ”putative” or ”unknown protein” in the
case that a more informative and representative description is available. These descriptions are only of
exploratory nature and do not have the same weight of evidence as the functional labels.
Copyright 2013 - BioBam Bioinformatics S.L.
8
Validate Annotation
This function validates the annotation result and removes redundant GOs from the dataset. It assures
that only the most specific annotations for a given sequence are saved. In this way this function prevents
that two or more GO terms lying on the same GO branch are assigned to the same sequence. The Gene
Ontology ”true path rule” assures that all the terms lying on the branch or route from a term up to
the root (top-level) must always be true for a given gene product. Therefore, any term is considered as
redundant and is removed if a child term coexists for the same sequence.
R applies this method automatically always
This function can be run independently, however Blast2GO
after a modification is made to an existing annotation, such as merging GO terms from InterProScan
search, after Annex augmentation or upon manual curation.
Remove 1. Level Annotations
This function removes for each sequence the three main (root or top-level) GO terms (molecular function,
biological process and cellular component), if present since they do not provide any relevant information.
Create Annotation Table
This function allows to create an CLC-bio Annotation Table containing the Gene Ontology terms genR .
erated with Blast2GO
ANNEX
Annex (Myhre et al., 2006), developed by the Norwegian University of Science and Technology, is
essentially a set of relationships between the three GO categories. Basically, this approach uses univocal relationships between GO terms from the different GO Categories to add implicit annotation.
Annex consists of over 6000 manually reviewed relations between molecular function terms ”involved
in” biological processes and molecular function terms ”acting in” cellular components. Annex-based GO
term augmentation can be run on any annotation loaded in Bast2GO. Generally, between 10% and 15%
extra annotation is achieved and around 30% of GO term confirmations are obtained through the Annex
data-set. For more details visit the Annex Project at:
The Annex dataset connects molecular functions with terms from the biological process and cellular
component GO categories.
Create Blast2GO Example Dataset
This functions allows to add several small example data-set to the Navigation Area in the Workbench.
Each file contains just 10 sequences which allows to easily explore the different possibilities of the plugin.
9
9.1
Analysis
Create Combined Graphs
Visualization is a helpful component in the process of interpreting results from high-throughput experiments, and can be indispensable when working with large data-sets. Within the GO, the “natural”
visualization format is the Direct Acyclic Graph of a group of annotated sequences. In the DAG, each
node represents a GO term. Arcs represent the relationships between the biological concepts. A problem when visualising GO functional information of genomic data-sets is that these graphs can become
extremely large and difficult to navigate when the number of represented sequences is high.
Combined Graphs
R is the ability to display the annotation result of one or several
One of the functions of Blast2GO
R these graphs are called “Combined Graphs”.
sequences in the same GO graph. Within Blast2GO
The function generates joined GO DAGs to create overviews of the functional context of groups of
annotations and sequences. Combined Graph nodes are highlighted through a colour scale proportional
to their number of sequences annotated to a given term. This confluence score (from now on denoted
“node-Score”) takes into account the number of sequences converging at one GO term and at the same
time penalizes by the distance to the term where each sequence was actually annotated. Assigned
sequences and scores can be displayed at the terms level.
Copyright 2013 - BioBam Bioinformatics S.L.
9
Node Score
The node score is calculated for each GO term in the DAG and takes into account the topology of the
ontology and the number of sequences belonging (i.e. annotated) to a given node (i.e. GO term). The
score is the sum of sequences directly or indirectly associated to a given GO term weighted by the distance
of the term to the term of “direct annotation” i.e. the GO term the sequence is originally annotated
to. This weighting is achieved by multiplying the sequence number by a factor α [0,∞] to the power of
the distance between the term and the term of direct annotation (see Equation 3.1 for a mathematical
expression. In this way, the node score is accumulative and the information of lower-level GO-terms
is considered, but the influence of more distant information (i.e. annotations) is suppressed/decreased
depending on the value of α. This compensates for the drawback of the earlier described method of
simply counting the number of different sequences assigned to each GO-term. The α parameter allows
this behaviour to be further adjusted. A value of zero means no propagation of information and can be
increased by rising α.
X
score(g) =
gp(ga ) · αdist(g,ga )
(3.1)
ga ∈desc(g)
where:
• desc(g) represents all the descendant terms for a given GO term g
• dist(g,ga ) is the number of edges between the GO term g and the GO term ga
• g is an element of the GO where GO is the overall set of all GO terms
• gp(g) is the number of gene products assigned to a given GO term g
Graph Term Filtering
Combined graphs can become extremely large and difficult to navigate when the number of visualized
sequences is high. Additionally, the relevant information in these cases is frequently concentrated in a
relatively small subset of terms. We have introduced graph-pruning functions to simplify DAG structures
to display only the most relevant information. In the case of the Combined Graph function, a cutoff on
the number of sequences or the node-score value can be set to filter out GO terms. In this case the size
of a graph is reduced without loosing the important information (i.e hiding tip and intermediate low
informative nodes).
This approach of graph-filtering and trimming is based on a combination of different scoring schemes.
On the one hand, graph filtering can be based on the number of sequences assigned to each node, and
on the other hand, a graph can be “thinned out” by removing intermediate nodes that are below a given
cutoff. The latter approach allows a certain level of details to be maintained while drastically reducing
the size of the graph by removing “unimportant” intermediate graph elements. In this way, any large
GO graph can be reduced by abundance and information content instead of simply “cutting through”
the Gene Ontology at a certain hierarchical level or by the use of GoSlim definitions.
In Figure 3.3, the molecular functions of 1000 sequences are visualized in 3 different ways. The first
graph is unfiltered, the second graph shows the functional information after having applied a GoSlim
reduction. The third graph is filtered and thinned according to the number of sequences belonging to
each GO-term and the node-score. All GO terms with less than 10 sequences were removed (tip nodes)
and all the nodes with a node-score smaller than 12 applying an α of 0.4 were removed (intermediate
nodes). This strategy allows the removal of terms that are less significant to a particular data-set while
at the same time it maintains frequently present terms at lower levels of specificity.
9.2
Create Pie Chart
R offers pie charts as summary representations of annotation results. Single GO level pie
Blast2GO
charts as well as multi-level pie function is provided. In the latter only the lowest GO terms per branch
that fulfil a user-specified annotation weight criteria, i.e. sequence abundance or node-scores are shown.
In this way, the GO DAG can be “cut” locally at different levels to provide an optimal view of the
dataset’s most relevant terms.
9.3
Statistics
The Statistics wizard allows to select and generate all available charts in one run.
Statistical charts are available to provide direct feedback about data composition. Charts such as mean
sequence length, involved species distribution, BLAST e-value distribution or the standard deviation
of GO level annotation distribution, allow the visualisation of intermediate and final result summaries.
These charts are especially helpful to validate the results of each analysis step and to re-adjust or
Copyright 2013 - BioBam Bioinformatics S.L.
10
(a) Unfiltered Graph
molecular_function
NodeScore:576.59
is a
nutrient reservoir
activity
NodeScore:4.00
is a
is a
molecular transducer
activity
NodeScore:5.40
translation regulator
activity
NodeScore:6.60
signal transducer
activity
NodeScore:9.00
is a
transcription regulator
activity
NodeScore:21.00
is a
antioxidant activity
NodeScore:16.00
is a
is a
receptor activity
NodeScore:5.00
is a
translation factor
activity, nucleic
acid binding
NodeScore:11.00
is a
is a
nucleic acid
binding
NodeScore:97.80
ion binding
NodeScore:7.20
is a
is a
RNA binding
NodeScore:37.00
is a
is a
lipid binding
NodeScore:14.00
is a
is a
is a
is a
is a
is a
is a
is a
chromatin binding
NodeScore:5.00
is a
cytoskeletal protein
binding
NodeScore:1.80
is a
passive transmembrane
transporter activity
NodeScore:1.30
is a
calcium ion binding
NodeScore:20.00
is a
transmembrane
transporter activity
NodeScore:1.30
nucleotide binding
NodeScore:131.00
is a
receptor binding
NodeScore:1.00
is a
hydrolase activity
NodeScore:121.88
is a
is a
hydrolase activity,
acting on ester
bonds
NodeScore:4.08
is a
is a
substrate specific
channel activity
NodeScore:3.60
is a
is a
ion channel
activity
NodeScore:6.00
is a
is a
transferase activity,
transferring
phosphorus-containing
groups
NodeScore:22.32
peptidase activity
NodeScore:27.00
is a
hydrolase activity,
acting on acid
anhydrides, in
phosphorus-containing
anhydrides
NodeScore:0.65
phosphotransferase
activity, alcohol
group as acceptor
NodeScore:19.20
is a
phosphatase activity
NodeScore:3.00
is a
is a
is a
is a
is a
transferase activity
NodeScore:88.39
hydrolase activity,
acting on acid
anhydrides
NodeScore:0.39
phosphoric ester
hydrolase activity
NodeScore:1.80
nuclease activity
NodeScore:5.00
ion transmembrane
transporter activity
NodeScore:3.60
is a
is a
substrate-specific
transporter activity
NodeScore:1.30
substrate-specific
transmembrane
transporter activity
NodeScore:2.16
channel activity
NodeScore:2.16
structural molecule
activity
NodeScore:70.00
is a
is a
is a
actin binding
NodeScore:3.00
enzyme regulator
activity
NodeScore:26.00
catalytic activity
NodeScore:323.16
is a
protein binding
NodeScore:111.68
is a
metal ion binding
NodeScore:12.00
is a
electron carrier
activity
NodeScore:28.00
transporter activity
NodeScore:64.78
is a
is a
cation binding
NodeScore:12.00
transcription factor
activity
NodeScore:20.00
is a
protein tag
NodeScore:1.00
is a
carbohydrate binding
NodeScore:15.00
is a
DNA binding
NodeScore:65.00
is a
binding
NodeScore:411.01
is a
pyrophosphatase
activity
NodeScore:1.08
is a
kinase activity
NodeScore:37.20
is a
protein kinase
activity
NodeScore:32.00
is a
phosphoprotein
phosphatase activity
NodeScore:5.00
nucleoside-triphosphatase activity
NodeScore:1.80
is a
motor activity
NodeScore:3.00
GOSLIM GRAPH
(b) Filtered Graph 1
molecular_function
NodeScore:118.26
is a
is a
binding
NodeScore:119.16
is a
is a
nucleic acid
binding
NodeScore:66.64
ion binding
NodeScore:28.16
is a
cation binding
NodeScore:31.00
is a
is a
is a
iron ion binding
NodeScore:47.00
RNA binding
NodeScore:33.76
is a
transition metal
ion binding
NodeScore:48.80
is a
nucleotide binding
NodeScore:18.95
is a
metal ion binding
NodeScore:67.40
is ais a
calcium ion binding
NodeScore:20.00
copper ion binding
NodeScore:14.00
is a
magnesium ion
binding
NodeScore:21.00
is a
is a
is a
3 terms
1 term
GTP binding
NodeScore:22.00
1 term
transcription regulator
activity
NodeScore:14.16
is a
coenzyme binding
NodeScore:13.60
protein binding
NodeScore:88.67
1 term
is a
adenyl nucleotide
binding
NodeScore:16.40
DNA binding
NodeScore:54.12
is a
is a
is a
transferase activity
NodeScore:21.19
is a
unfolded protein
binding
NodeScore:16.00
1 term
adenyl ribonucleotide
binding
NodeScore:32.00
phosphotransferase
activity, alcohol
group as acceptor
NodeScore:17.63
is a
transcription factor
activity
NodeScore:20.00
is a
is a
1 term
nucleoside-triphosphatase activity
NodeScore:14.95
3 terms
electron carrier
activity
NodeScore:27.40
endopeptidase inhibitor
activity
NodeScore:14.00
is a
structural constituent
of ribosome
NodeScore:56.00
oxidoreductase activity
NodeScore:53.68
3 terms
is a
transporter activity
NodeScore:23.27
1 term
peroxidase activity
NodeScore:14.80
is a
protein kinase
activity
NodeScore:41.47
is a
protein tyrosine
kinase activity
NodeScore:13.00
ATP binding
NodeScore:79.00
is a
hydrolase activity
NodeScore:25.08
1 term
kinase activity
NodeScore:24.40
is a
is a
zinc ion binding
NodeScore:41.00
is a
structural molecule
activity
NodeScore:34.40
catalytic activity
NodeScore:71.59
1 term
purine ribonucleotide
binding
NodeScore:16.32
1 term
is a
is a
protein
serine/threonine kinase
activity
NodeScore:20.28
is a
heme binding
NodeScore:22.00
FILTERED AND THINNED GRAPH
(c) filtered Graph 2
Figure 3.3: The molecular functions of 1000 sequences visualized in 3 different ways: The first
graph is unfiltered, the second graph shows the functional information after having applied
a GoSlim reduction and the third graph is filtered and thinned according to the number of
sequences belonging to each GO-term and the node-score. All GO terms with less than 10
sequences (tip nodes) and all intermediate terms with a node-score smaller than 12 (with α=0.4)
were removed.
Copyright 2013 - BioBam Bioinformatics S.L.
11
determine the parameters of subsequent processing. In this interactive manner the annotation process
can be adjusted to specific data-set and user requirements.
List of all available quantitative/statistical charts in Blast2GO
• BLAST
• E-value distribution:
This chart plots the distribution of E-values for all selected BLAST hits. It is useful to
evaluate the success of the alignment for a given sequence database and help to adjust the
Evalue cutoff in the annotation step.
• Sequence similarity distribution:
This chart displays the distribution of all calculated sequence similarities (percentages), shows
the overall performance of the alignments and helps to adjust the annotation score in the
annotation step.
• Species distribution:
This chart gives a listing of the different species to which most sequences were aligned during
the BLAST step.
• Top-Blast Species distribution:
This chart gives the species distribution of the Top-BLAST HITs.
• HSP/HIT coverage:
This chart shows a distribution of percentages. The percentages represent the coverage
between the HSPs and its corresponding HITs. This chart helps to get an understanding of
the effect of this annotation parameter.
• Mapping
• Evidence Code distribution:
This chart shows the distribution of GO evidence codes for the functional terms obtained during the mapping step. It gives an idea about how many annotations derive from automatic/
computational annotations or manually curated ones.
• DB-source of mapping:
This chart gives the distribution of the number of annotations (GO-terms) retrieved from
the different source databases like e.g. UniProt, PDB, TAIR etc.
• Annotation
• Annotation progress/success:
This chart shows the annotation status of the data-set i.e. how many sequences have or have
not a BLAST result, how many sequences obtained a GO mapping and how many sequences
could be annotated successfully or stayed without annotations.
• Annotation distribution:
This chart informs about the number of GO terms assigned per sequence.
• GO term distribution:
A chart for each GO category shows the most frequent GO terms within a dataset without
taking into account the GO hierarchy. GO level distribution:
This chart shows the distribution of GO levels for each GO category. This chart helps to
analyse whether a set of annotations is more general (low GO levels) or more specific (higher
GO levels).
• Sequence length distribution:
This chart shows the correlation between length of the sequences and the number of assigned
annotations.
• InterProScan Statistics:
This chart shows the effect of adding the GO-terms retrieved though the InterProScan results.
• Annex This chart shows the performance of the Annex annotation augmentation step. It shows
the number of GO terms which were confirmed, replaced or removed through this method.
Copyright 2013 - BioBam Bioinformatics S.L.
12
(a)
(b)
(c)
(d)
(e)
(f)
(g)
(h)
Figure 3.4: A collection of different Blast2GO Charts
Copyright 2013 - BioBam Bioinformatics S.L.
13
(a)
(b)
(c)
Figure 3.5: A collection of different Blast2GO Charts
Figure 3.6: Different types of charts open next to each other in the workbench
Copyright 2013 - BioBam Bioinformatics S.L.
14
10
Enrichment Analysis - Fisher’s Exact Test
Blast2GO offers the possibility of direct statistical analysis on gene function information. A common
analysis is the statistical assessment of GO term enrichment in a group of interesting genes when compared to a reference group i.e. to asses the functional differences between two sets of functional annotations (e.g. GO function of two groups of genes). This anaylsis is typically performed by a Fisher’s Exact
Test in combination with a robust False Discovery Rate (FDR) correction for multiple testing. Fisher’s
exact test is a statistical significance test used in the analysis of contingency tables. Although in practice
it is employed when sample sizes are small, it is valid for all sample sizes. It is named after its inventor,
R. A. Fisher. The false discovery rate (FDR) control is a statistical method used in multiple hypothesis
testing to correct for multiple comparisons. In a list of statistically significant findings FDR is used
to control the expected proportion of incorrectly rejected null hypotheses (”false discoveries”). Here a
Benjamini–Hochberg correction is used. The result is a list of statistically significant Gene Ontology
terms ranked by their adjusted p-values. Results can be viewed in several different ways like tabular
format, directly visualized on the Gene Ontology Grapf or as a bar chart, always colouring statistically
significant terms in red (over-represented) and green (under-represented).
10.1
Run a Fisher’s Exact Test
To perform the test we need to have a Blast2GO Project (or various) which contains the functional
information of all seuquenes/genes to be included in the statistical test. In a second and third step we
will select subsets of the first selection. The the second step the test-set is selected. This can be done
by choosing a Blast2GO Project already loaded in the workbench or via a text file which contains the
coresponding sequence names of gene-ids of the test set (one each line). In the third step we can than
define a reference set. This step is optional and if no reference is selected the dataset in the first step
minus the sub-set selected in the seconf step is choosen as a background or refenrece dataset.
The calculation of the p-values for all functions can take several minutes, depending on the size of the
dataset and network connection speed. Once the This table lists the adjusted p-values of the Fisher’s
Exact Test for each GO term.
10.2
Parameter
• Step 1: Select one or more Blast2GO Projects
Select one or more Blast2GO Projects which together contains the functional information of all
sequences/genes included in the statistical test.
• Step 2: Select one or more Test-Sets from the navigation area
The selected datasets will be combined to one. Please note that the given IDs have to match the
sequence names of the Blast2GO Project selected in the first step. It is allowed to select Blast2GO
Projects or sequence/gene ID lists in plain text format. In the case of the plain text format, please
make sure to have only one ID per line. An example can be found in the Blast2GO example
datasets.
• Step3: Select one or more Reference-Sets from the navigation area
This is optional and the whole set selected in the first step will be used otherwise. The selected
datasets will be combined to one. Please note that the given IDs have to match the sequence
names of the Blast2GO Project selected in the first step. It is allowed to select Blast2GO Projects
or sequence/gene ID lists in plain text format. In the case of the plain text format, please make
sure to have only one ID per line. An example can be found in the Blast2GO example datasets.
¡/li¿
• Step 4: Configure Fisher’s Exact Test Parameters
• Two Tailed
In statistical significance testing, a one-tailed test or two-tailed test are alternative ways of
computing the statistical significance of a data set in terms of a test statistic, depending
on whether only one direction is considered extreme (and unlikely) or both directions are
considered extreme. This translates to over- and under-represented Gene Ontology functions
in the test-set compared to a reference set. A two tailed test means therefore to test for overand under-representation at the same time. Note: The correction for multiple testing (FDR)
is higher in a two tailed test and therefore it is less likely to detect significant results since
the number of performed test is doubled.
• Remove Double IDs
This options allows you to automatically remove all sequences/gene-ids which are present in
the test-set and in the reference set at the same time. By default double/common IDs are
only removed from the reference set.
Copyright 2013 - BioBam Bioinformatics S.L.
15
10.3
Results
Table
Blast2GO offers several options to view the results of an Enrichment Analysis. The table format shows
a list of all the terms which add been included in the analyse. With the side-panel we can filter the
results and can only visualize e.g. statistically significant results with a FDR p-value smaller than 0.05.
Graph
The same results can also be visualized in form of a Enriched GO Graph. The Enriched Graph shows
the Gene Ontology graph of the significant terms with a node-coloring which is proportional to the
significance value (p-value). This type of graphical representations helps to understand the biological
context of the functional differences and to find pseudo-redundancies in the parent-child relationships
of significant GO term. A node filter value can be set for the p-value or adjusted FDR p-value. In this
way intermediate GO terms are not shown in the graph which reduced the overall size of the graph and
graphs can be thinned out deleting these terms. A node filter value determines the p-value for the lowest
nodes to be included in the graph. GO-Terms with a value higher than the given filter are not shown.
To perform an Enriched GO Graph a Fisher’s Exact Test result is necessary.
Bar Chart
An Enrichment Bar Chart shows for each significant GO term the amount (percentage) of sequences
annotated with this term. The Y-axis shows significantly enriched GO terms and the X-axis gives the
relative frequency of each term. Red bars correspond to the sequences of the test-set and blue bars
correspond to the reference or background dataset (e.g. a whole genome). To perform an Enrichment
Bar Chart a Fisher’s Exact Test result is necessary.
10.4
Reduce to most specific terms
This function allows to reduce the size of the result-set of over-represented GO terms; useful in case of
a very large list of enriched GO terms. In many cases, reported enriched functions have a parent-child
relationship and therefore these terms represent the same functional concept but at different levels of
specificity. In case of large result sets it can be convenient to filter the results by removing parent terms
of already existing, statistically significant, child GO terms. In this way only a reduced list of the most
specific information is reported.
Figure 3.7: Different types of Fisher’s Exact Test results
Copyright 2013 - BioBam Bioinformatics S.L.
16
A Blast2GO Workflow
R plugin functions are workflowable and the corresponding input and output formats
All major Blast2GO
are described in table 4.1. This allows us to create an annotation pipeline with only a few mouse-clicks.
Let’s say we have a set of sequences that contain blast results which we want to map and annotate. Afterwards we also want to create some statistics to get an idea if the result is satisfactory or not. One way
to achieve this is by executing the mentioned algorithms and functions one by one. The just described
way of proceeding has one big disadvantage, the different steps have to be started all separately one after
another. This can be undesirable if we have a very big data-set and want to analyze our data-set, e.g.
over the weekend. Another scenario would be to re-run the same steps several times but with different
parameters (e.g. being more or less restrictive in the annotation part). The workflow tool allows us to
automate at least parts of this process.
In the following section it is described how to create a simple annotation pipeline using the workflow
functionality of the Workbench. Please keep in mind that the described steps to create a workflows in
general are the same for any kind of workflow and are therefore also described in the ClC bio Workbench
R plugin has several characteristics that are important to know and
manual. However the Blast2GO
which will be described here.
1. First of all we need to create a new workflow.
Go to: Workflows →New Workflow. . .
2. Now we can add the desired functions with right-click →Add Element →Blast2GO.
We add Convert Data to Blast2GO Project, Mapping, Annotation, Mapping Statistics and Statistics.
3. The selected functions now appear in the workflow area, we can arrange them to graphically form
the pipeline shown in figure 4.1.
4. Now we connect all the available outputs with the logical proceeding inputs. Apart from that all
functions that create a result that you want to save to disk, have to be connected to a so-called
workflow output. To achieve this, we right-click on the desired functions outputs and select Use
as Workflow Output. We must not forget to connect the workflow input to the Convert Data to
Blast2GO Project, which will be our entrance point of the pipeline.
5. The next step would be to configure a few parameters (Configurable functions are indicated by a
little notepad symbol). To set the parameters of a function, we double-click on it to show a wizard
similar to the ordinary one. We can activate the Data Distribution chart in both statistic steps.
With this we can examine the success-rate of the mapping step, while the annotation step is still
running.
6. After configuring the functions as desired, we save the workflow to be able to execute it.
It is important to understand that a Blast2GO Project has no attribute which indicates the status of
a project (e.g. project is mapped or annotated). The workbench is therefore not able to verify if the
processed project is annotated, mapped or has only blast results. Therefore when ever we need to choose
input data or connect algorithms in the workflow we have to verify this ourselves and check that all steps
are connected in the right order. Figure 4.2 shows such a case, where the mapping is placed behind the
annotation. Running this workflow will result in a mapped project without annotations. This is because
the annotation step needs the information from the mapping. However we will not receive any error
messages or similar, because of the above mentioned reason.
Copyright 2013 - BioBam Bioinformatics S.L.
17
Figure 4.1: Example of a correctly configured complete annotation workflow.
Figure 4.2: Example of a wrongly configured workflow.
Copyright 2013 - BioBam Bioinformatics S.L.
18
Table 4.1: Detailed list of workflowable plugin features.
ID
1
2
3
4
5
6
7
8
9
10
Feature
Convert
Data
Blast2GO Project
Mapping
Annotation
GO-Slim
InterProScan
to
Merge InterProScan
Run ANNEX
Statistics
Create Combined Graph
Create Pie Chart
Possible Input
Sequence Data, Multi
Blast
Blast2GO Project (1)
Blast2GO Project (2)
Blast2GO Project (3)
Blast2GO Project (with
Sequence Data)
Blast2GO Project (5)
Blast2GO Project (3)
Blast2GO Project
Blast2GO Project (3, 6, 7)
Blast2GO
Combined
Graph (9)
Copyright 2013 - BioBam Bioinformatics S.L.
Output
Blast2GO Project
Blast2GO
Blast2GO
Blast2GO
Blast2GO
Project
Project
Project
Project
Blast2GO
Blast2GO
Blast2GO
Blast2GO
Blast2GO
Project
Project
Project
Combined Graph
Pie Chart
19
Please Cite
• A. Conesa, S. Götz, J. M. Garcia-Gomez, J. Terol, M. Talon and M. Robles. ”Blast2GO:
a universal tool for annotation, visualization and analysis in functional genomics
research”, Bioinformatics, Vol. 21, September, 2005, pp. 3674-3676.
• A. Conesa and S. Götz. ”Blast2GO: A Comprehensive Suite for Functional Analysis in
Plant Genomics”, International Journal of Plant Genomics, Vol. 2008. 2008, pp. 1-13.
• S. Götz et al. ”High-throughput functional annotation and data mining with the
Blast2GO suite”, Nucleic Acids Research, Vol. 36, June, 2008, pp. 3420-3435.
• S. Götz et al. ”B2G-FAR, a species centered GO annotation repository”, Bioinformatics,
Vol. 27 (7), 2011, pp. 919-924.
Copyright 2013 - BioBam Bioinformatics S.L.
20
Bibliography
[Conesa et al., 2005] Conesa, A., Götz, S., Garcı́a-Gómez, J. M., Terol, J., Talón, M., and Robles, M.
(2005). Blast2go: a universal tool for annotation, visualization and analysis in functional genomics
research. Bioinformatics, 21(18):3674–3676.
[Götz et al., 2008] Götz, S., Garcia-Gomez, J. M., Terol, J., Williams, T. D., Nagaraj, S. H., Nueda,
M. J., Robles, M., Talon, M., Dopazo, J., and Conesa, A. (2008). High-throughput functional annotation and data mining with the blast2go suite. Nucl. Acids Res., pages gkn176+.
Copyright 2013 - BioBam Bioinformatics S.L.
21