1
ISO 9001
INSTRUMENTATION FOR SOUND & VIBRATION
MEASUREMENTS AND ANALYSIS
ZETOM-CERT
G7
SOUND & VIBRATION ANALYSER
(draft version)
USER’S MANUAL
SVANTEK Sp. z o.o.
WARSAW, August 2007
G7 USER MANUAL
_
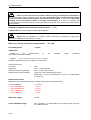
Notice: This user’s manual presents the software revision named 6.03 / 6.03.03
(cf. the description of the UNIT LABEL position of the DISPLAY list). The succeeding software revisions
(marked with the bigger numbers) can slightly change the view of some displays presented in the text
of the manual.
G7 USER MANUAL
CONTENTS
1
2
3
4
5
INTRODUCTION
1-1
1.1 G7 as Sound Level Meter & Analyser
1-1
1.2 G7 as Vibration Meter & Analyser
1-2
1.3 General features of G7
1-2
1.4 Accessories included
1-2
1.5 Accessories available
1-2
1.6 Software options available
1-3
1.7 Current list of G7 options and accessories
1-3
MANUAL CONTROL OF THE INSTRUMENT
2-1
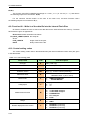
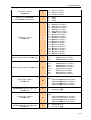
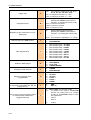
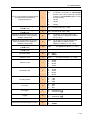
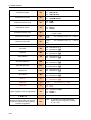
2.1 Control push-buttons on the front panel
2-1
2.2 Input and output sockets of the instrument
2-6
SETTING THE INSTRUMENT
3-1
3.1 Basis of the instrument’s control
3-1
3.2 Powering of the instrument
3-22
3.3 Initial setup of the instrument
3-24
3.4 Selection of the working mode- MODE
3-27
3.5 Activation of optional functions
3-27
3.6 Memory organisation
3-28
FUNCTIONS OF THE INSTRUMENT – FUNCTION
4-1
4.1 Selecting the mode of the instrument – MODE
4-1
4.2 Measurement functions of the instrument - MEASUREMENT FUNCTION
4-1
4.3 Instrument’s calibration - CALIBRATION
4-2
4.3.1 The calibration BY SENSITIVITY in the case of acoustic signal
4-3
4.3.2 Calibration BY SENSITIVITY in the case of vibration signal
4-4
4.3.3 The calibration BY MEASUREMENT in the case of acoustic signal
4-5
4.3.4 The calibration BY MEASUREMENT in the case of vibration signal
4-7
4.3.5 History of the calibration - LAST CALIBRATION
4-8
4.3.6 Automatic reading of a vibration transducer parameters – TEDS
4-9
MEASUREMENT PARAMETERS SETTING - INPUT
5-1
5.1 Selection of measurement parameters - MEASUREMENT SETUP
5-2
5.1.1 Setting time delay before the start of measurements - START DELAY
5-2
5.1.2 Setting the integration period - INTEGR. PERIOD
5-2
5.1.3 Setting the number of repetition of measurement cycles - REP. CYCLE
5-4
5.1.4 Logger functionality switching On / Off - LOGGER
5-5
5.1.5 Setting time period between two writings to the logger’s file - LOGGER STEP
5-5
5.1.6 Logger file name edition - LOGGER NAME
5-6
5.2 Measurement range setting - MEASUREMENT RANGE
5-7
5.3 Setting parameters in a profile - PROFILE x
5-8
i
G7 USER MANUAL
5.3.1 Weighting filter selection in a profile - FILTER
_
5-9
5.3.2 RMS detector selection - DETECTOR
5-10
5.3.3 PEAK result selection for saving in a logger’s file - LOGGER PEAK
5-10
5.3.4 MAX result selection for saving in a logger’s file - LOGGER MAX
5-11
5.3.5 P–P result selection for saving in a logger’s file - LOGGER P-P
5-12
5.3.6 MIN result selection for saving in a logger’s file - LOGGER MIN
5-12
5.3.7 RMS result selection for saving in a logger’s file - LOGGER RMS
5-12
5.4 Triggering mode and parameters selection - TRIGGER SETUP
5-13
5.4.1 Trigger parameters setting - MEASURE TRIGGER
5-13
5.4.2 Trigger parameters in logger setting - LOGGER TRIGGER
5-16
5.4.3 Trigger parameters for recorder setting - RECORDER TRIGGER
5-21
5.5 Selection of dose meter parameters - DOSIMETER SETUP
5-23
5.5.1 Setting criterion sound level - CRITERION LEVEL
5-23
5.5.2 Setting criterion sound level - THRESHOLD LEVEL
5-24
5.5.3 Setting criterion sound level - EXCHANGE RATE
5-24
5.6 Selection of FFT analysis parameters - FFT
5-25
5.6.1 The averaging of spectra in the FFT analysis - AVERAGING
5-25
5.6.2 Selecting the weighting filter during the FFT analysis - FILTER
5-25
5.6.3 Selecting the analysis band of the signal - BAND
5-25
5.6.4 Selecting the time window for the FFT analysis - WINDOW
5-26
5.6.5 Selecting the number of the lines of FFT analysis - LINES
5-26
5.6.6 Enabling the FFT spectra time history logging - LOGGER
5-27
5.7 Selection of 1/1 octave and 1/3 octave spectrum parameters - SPECTRUM
5-27
5.7.1 Selecting the weighting filter during 1/1 OCTAVE or 1/3 OCTAVE analysis - FILTER5-27
5.7.2 Selecting the band during the 1/1 OCTAVE or 1/3 OCTAVE analysis - BAND
5-28
5.7.3 Activation of logger for 1/1 OCTAVE or 1/3 OCTAVE analysis results - LOGGER 5-28
6
DATA AVAILABLE ON THE DISPLAY - DISPLAY
6-1
6.1 Selection of the modes of measurement results presentation - DISPLAY MODES
6-1
6.1.1 Switching on/off spectrum view - SPECTRUM
6.1.2 Switching on/off three profiles view - 3 PROFILES
6-9
6.1.3 Setting on/off statistics view in SM - STATISTICS
6-11
6.1.4 Setting on/off logger view - LOGGER
6-13
6.1.5 Setting on/off the view of the file description - FILE INFO
6-13
6.2 Setting the parameters of the graphical modes - DISPLAY SETUP
6-14
6.2.1 Setting the scale of the presentation and the display’s grid - DISPLAY SCALE
6-14
6.2.2 Selection of the Spectrum Type in VM - SPECTRUM TYPE
6-17
6.2.3 Setting the parameters of the logger files presentation - SPECTRUM VIEW
6-17
6.2.4 Selection of the Weighting Filters - TOTAL VALUES
6-19
6.2.5 Setting the parameters of the logger files presentation - LOGGER VIEW
6-20
6.3 Selection of the logger’s file to the display presentation - LOGGER VIEW
6-21
6.4 Setting the parameters of the display - SCREEN SETUP
6-24
6.4.1 Setting the contrast of the display - CONTRAST
6-24
6.4.2 Automatic switch off of the backlight - BACKLIGHT TIMEOUT
6-25
6.5 Checking the state of the internal battery - BATTERY
ii
6-8
6-25
G7 USER MANUAL
6.6 Checking specification of the instrument - UNIT LABEL
7
SAVING THE MEASUREMENT RESULTS - FILE
7-1
7.1 Saving files in the instrument’s memory - SAVE and SAVE NEXT
7-3
7.2 Controlling the data storing in the instrument’s memory - SAVE OPTIONS
7-9
7.2.1 Saving data starting from the same address - RAM FILE
7-10
7.2.2 Replacement of the existing files by the new ones - REPLACE
7-10
7.2.3 Controlling the measurement statistics savings - SAVE STATISTICS
7-11
7.2.4 Controlling the measurement results savings - AUTO SAVE
7-12
7.2.5 Direct access to the SAVE / SAVE NEXT function - DIRECT SAVE
7-15
7.2.6 Saving maximum values in the spectrum - SAVE MAX SPECT.
7-16
7.2.7 Saving the lowest values in the spectrum - SAVE MIN SPECT.
7-16
7.3 Loading the files with the measurement results - LOAD
7-17
7.4 Removing a file with the measurement results from memory - DELETE
7-19
7.4.1 Deleting files with the main results - RESULT FILES
7-20
7.4.2 Deleting logger files - LOGGER FILES
7-22
7.4.3 Deleting files with setup settings - SETUP FILES
7-24
7.5 Removing all files with measurement results from memory - DELETE ALL
7-26
7.5.1 Deleting all result files - RESULT FILES
7-26
7.5.2 Deleting all logger files - LOGGER FILES
7-27
7.5.3 Deleting all setup files - SETUP FILES
7-28
7.6 Merging file space - DEFRAGMENTATION
8
6-25
7-29
7.6.1 Merging result and setup files memory - FILES DEFRAGMENTATION
7-30
7.6.2 Merging logger files memory - LOGGER DEFRAGMENT.
7-31
7.7 Checking the contents of the memory - CATALOGUE
7-33
7.8 Checking the free space in the memory - FREE SPACE
7-34
7.9 Saving setup files in the instrument’s memory - SAVE SETUP
7-35
7.10 Loading the files with the setup settings - LOAD SETUP
7-39
7.11 Connecting the external USB memory stick- DIRECTORY
7-40
7.12 Copying files to the external USB memory stick- COPY FILES TO USB
7-41
7.13 Moving files to the USB memory stick- MOVE FILES TO USB
7-42
REPORTS PRINTING - REPORT
8-1
8.1 Edition of the user’s text to be added to the reports - TITLE
8-3
8.2 Printing of the measurement results - PRINT RESULTS
8-4
8.3 Printing of the statistics of sound measurement results - PRINT STATISTICS
8-8
8.4 Printing of the measurement results from the selected file - PRINT FILE
8-12
8.5 Printing of the logger results - PRINT LOGGER
8-17
8.6 Printing of the coefficients of the user filters - PRINT USER FILTERS
8-17
8.7 Printing of the file’s catalogue - PRINT CATALOGUE
8-19
8.8 Selection of the printing options - OPTIONS
8-21
8.9 Selection of the format of the print out - FORMAT
8-21
8.10 Controlling the paper ejection after print out - EJECT P.
8-22
iii
G7 USER MANUAL
9
SETUP MENU - SETUP
9-1
9.1 Setting the language of the user interface - LANGUAGE
9-2
9.2 Return to the factory settings - CLEAR SETUP
9-4
9.3 Compensation filter selection- COMPENSATION FILTER
9-5
9.4 Day time limits selection - DAY TIME LIMITS
9-6
9.5 Exposure time setting - EXPOSURE TIME
9-7
9.6 Setting parameters of the Ext. I/O port - EXTERNAL I/O SETUP
9-7
9.6.1 Mode selection of the Ext. I/O port - MODE
9-8
9.6.2 Digital output function selection of the I/O socket - FUNCTION
9-9
9.6.3 Polarisation selection of the digital output signal - POLARISATION
9-9
9.6.4 Active level selection of the digital output signal - ACTIVE LEVEL
9-9
9.6.5 Source signal selection for the alarm pulse generation - SOURCE
9-10
9.6.6 Alarm level selection on the digital output of I/O - ALARM LEVEL
9-10
9.7 Activation of human vibration filters - HUMAN VIB. FILT.
9-11
9.8 Selection of the current IEPE supply - IEPE CURRENT
9-11
9.9 Reference signal in vibration measurements - REFERENCE LEVELS
9-12
9.9.1 Setting the reference level of the acceleration signal - ACC
9-12
9.9.2 Setting the reference level of the velocity signal - VEL
9-12
9.9.3 Setting the reference level of the displacement signal - DIL
9-13
9.10 Parameters of remote communication - REMOTE COMMUNICATION
9-13
9.10.1 Selecting the type of remote communication - TYPE
9-14
9.10.2 Setting the packet size of the remote communication - PACKET
9-14
9.11 Detector’s type selection in the LEQ calculations - RMS INTEGRATION
9-14
9.12 Setting the parameters of the serial interface - RS232
9-15
9.12.1 Setting the transmission speed of the serial interface - BAUD RATE
9-15
9.12.2 Setting time limit for the performance of serial interface operation - TIME OUT
9-16
9.13 Programming the instrument’s internal Real Time Clock - RTC
9-16
9.14 The RT 60 averaging function - RT60 AVERAGING
9-17
9.14.1 The RT 60 averaging - AVERAGING
9-17
9.14.2 Resetting the averaging process - AVERAGING CLEAR
9-18
9.14.3 RT 60 averaging number - AVERAGING NO.
9-18
9.15 Setting the auxiliary parameters of RT 60 mode - RT60 OPTIONS
9-18
9.15.1 Setting the sound pressure level decay curve averaging - SMOOTHING
9-18
9.15.2 Setting the margin value of background noise level - NOISE MAR.
9-19
9.16 Selection of RT60 results parameters - RT60 RESULTS
9-19
9.17 Selection of few push-buttons mode - SHIFT MODE
9-20
9.17.1 <SHIFT> / <ALT> push-button working mode selection - SHIFT
9-20
9.17.2 <START / STOP> push-button working mode selection - ST/SP
9-21
9.17.3 Setting ten statistical levels - STATISTICAL LEVELS
9-21
9.18 Programming the instrument’s internal timer - TIMER
iv
_
9-22
9.18.1 Selecting the mode of the timer function - MODE
9-22
9.18.2 Setting day of the instrument’s switch on - START DAY
9-23
9.18.3 Setting hour of the instrument’s switch on - START HOUR
9-23
G7 USER MANUAL
9.18.4 Selecting the start hours for four irregular automatic measurements - TIMEx
9-24
9.18.5 Selecting the period between two consecutive measurements - REPETITION
9-24
9.18.6 Description of the exemplary timer function execution
9-24
9.19 Selection the USB–HOST port functionality - USB–HOST PORT
9-25
9.20 Setting the coefficients of the user filters - USER FILTERS
9-28
9.20.1 Setting filter coefficients for octave analysis - SPECTRUM BASED FILTERS
A.
B.
9.21 Selection of the vibration units - VIBRATION UNITS
9-31
9.22 Warnings selection - WARNINGS
9-32
9.22.1 Saving the measurement results in a file - RESULTS NOT SAVED
9-32
9.22.2 Checking free space on the USB disk - USB DISK FREE SP.
9-32
9.22.3 Minimum USB disk memory free space setting - MIN FREE SPACE
9-33
REMOTE CONTROL
A-1
A.1. Input / Output transmission types
A-1
A.2. Function #1 – Input / Output of the control setting codes
A-1
A.3. Function #2 – Measurement results read-out in the level meter or dose meter modes
A-4
A.4. Function #3 – Read-out of the measurement results in 1/1 OCTAVE or 1/3 OCTAVE
mode
A-6
A.5. Function #4 – Read-out of the data file from the internal Flash-Disc
A-7
A.6. Function #5 – Statistical analysis results read-out
A-8
A.7. Function #6 – Remote setting of the user filters
A-9
A.8. Function #7 – Special control functions
A-10
A.9. Function #9 – Write-in of the data file into the internal Flash-Disc
A-16
A.10. Control setting codes
A-16
DATA FILE STRUCTURES
B-1
B.1. Structure of the G7 file
B-1
B.2. Structure of the file containing results from logger’s file
B.2.1 The contents of the files in the logger
C.
9-28
B-21
B-22
B.3. Structure of the file with the results from the SLM mode
B-23
B.4. Structure of the file with the results from the VLM mode
B-24
B.5. Structure of the file with the results from the DOSE METER mode
B-24
B.6. Structure of the file with 1/1 OCTAVE analysis results
B-24
B.7. Structure of the file with 1/3 OCTAVE analysis results
B-25
B.8. Structure of the file with the FFT analysis results
B-25
B.9. Structure of the file containing RT60 functions results
B-26
B.10.
Structure of the SETUP file
B-26
B.11.
DATE and TIME
B-26
DATA SPECIFICATIONS
C-1
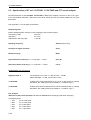
C.1. Specification of G7 as sound level meter
C-1
C.2. Specification of G7 as 1/1 OCTAVE, 1/3 OCTAVE and FFT sound analyser
C-26
C.3. Specification of G7 as vibration level meter
C-28
v
G7 USER MANUAL
C4. Miscellaneous specification of G7
D.
vi
_
C-32
DEFINITIONS AND FILTER CHARACTERISTICS
D-1
D.1 Definitions and formulae
D-1
D.1.1 Basic symbols and notation
D-1
D.1.2 Definitions of the quantities measured in sound modes
D-2
D.1.3 Definitions of the results measured in dosimeter mode
D-6
D.1.4 Definitions of the quantities measured in vibration modes
D-8
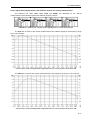
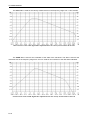
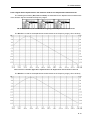
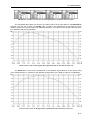
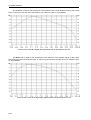
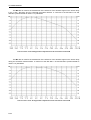
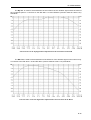
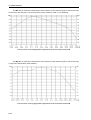
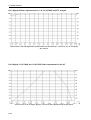
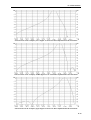
D.2 Frequency characteristics of the implemented digital filters
D-9
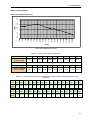
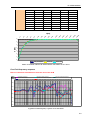
D.2.1 Digital weighting filters implemented in sound modes
D-9
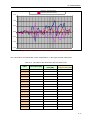
D.2.2 Digital weighting filters implemented in vibration modes
D-14
D.2.3 Digital HP filter implemented in 1/1 & 1/3 OCTAVE and FFT analysis
D-28
D.2.4 Digital 1/1 OCTAVE and 1/3 OCTAVE filters implemented in the G7
D-28
G7 USER MANUAL
LIST OF FIGURES
Control push-buttons of the G7 instrument ................................................................................................................2-1
Display with the “MARKERS” (after pressing <ALT> and <SHIFT> together).......................................................2-5
Displays with the activated markers ...........................................................................................................................2-5
Time history plot with the indication of the active markers .......................................................................................2-5
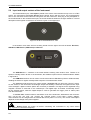
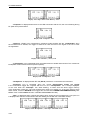
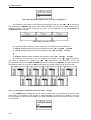
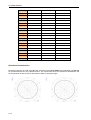
Top cover of the G7 instrument in 1:1 scale ..............................................................................................................2-6
Bottom cover of the G7 instrument in 1:1 scale .........................................................................................................2-6
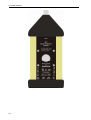
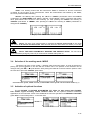
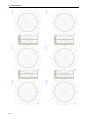
Front panel of the G7 instrument in 1:1 scale ............................................................................................................2-7
Rear panel of the G7 instrument in 1:1 scale..............................................................................................................2-8
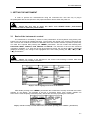
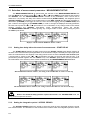
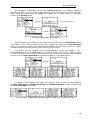
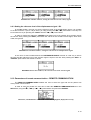
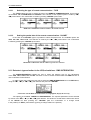
Displays with the highlighted elements of the main list .............................................................................................3-1
Display with the recently accessed menu items (after double pressing of the <MENU> push-button)......................3-1
Displays with the main list (a) and the elements of the INPUT list (b) ......................................................................3-2
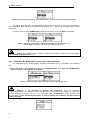
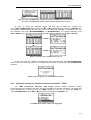
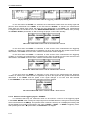
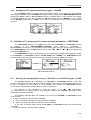
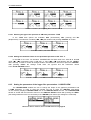
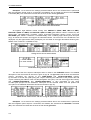
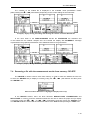
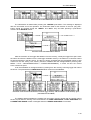
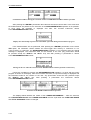
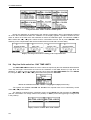
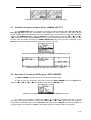
MEASUREMENT SETUP window opened (path: MENU / INPUT / MEASUREMENT SETUP) ........................3-2
MEASUREMENT SETUP window; the INTEGR. PERIOD position accessible.....................................................3-2
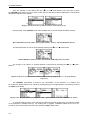
Displays with the accessed INTEGR. PERIOD position after pressing the <
> or <
> push-buttons,
respectively .....................................................................................................................................................3-2
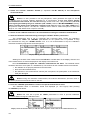
Displays after three consecutive pressing of the <ESC> push-button from the MEASUR. SETUP sub-list .............3-2
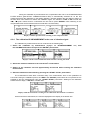
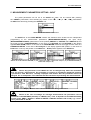
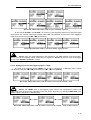
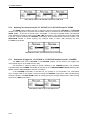
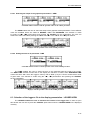
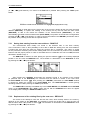
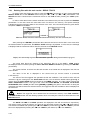
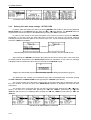
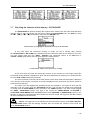
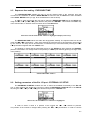
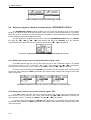
Displays during and after the accessing the FREE SPACE window (path: MENU / FILE / FREE SPACE) ............3-3
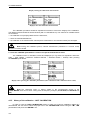
Displays during the edition of the text, which has to be printed as a header in the measurement reports (path:
MENU / REPORT / TITLE)...........................................................................................................................3-3
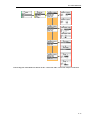
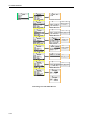
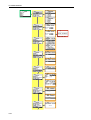
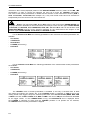
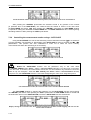
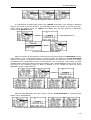
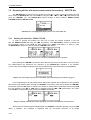
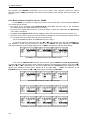
Control diagram of the FUNCTION list ....................................................................................................................3-4
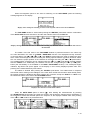
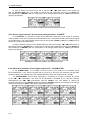
Control diagram of the INPUT list in the 1/1 OCTAVE and 1/3 OCTAVE mode ....................................................3-7
Control diagram of the INPUT list in the DOSE METER mode ...............................................................................3-7
Control diagram of the INPUT list in the FFT mode .................................................................................................3-7
Control diagram of the INPUT list in the LEVEL METER mode .............................................................................3-8
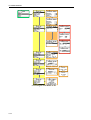
Control diagram of the DISPLAY SETUP list in 1/1 OCTAVE and 1/3 OCTAVE analysis of sound ...................3-10
Control diagram of the DISPLAY SETUP list in 1/1 OCTAVE and 1/3 OCTAVE analysis of vibration ..............3-11
Control diagram of the DISPLAY list......................................................................................................................3-12
Control diagram of the FILE list ..............................................................................................................................3-15
Control diagram of the REPORT list .......................................................................................................................3-16
Control diagram of the SETUP list in the RT60 mode.............................................................................................3-19
Control diagram of the SETUP list in sound mode ..................................................................................................3-22
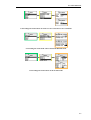
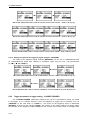
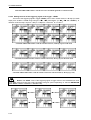
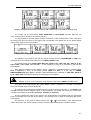
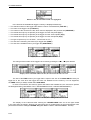
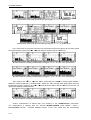
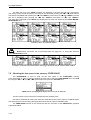
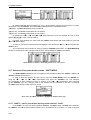
BATTERY windows with different sources powering the instrument: SA 15 external DC power adapter (a),
SA 17A external battery pack (b), internal batteries (c) and USB power (d)................................................3-22
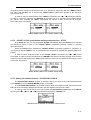
Displays with “Battery” icon (a) and in the BATTERY window (path: MENU / DISPLAY / BATTERY) (b)......3-23
Display with LOW BATTERY message..................................................................................................................3-23
Displays with the “Computer” icon (a) and in the BATTERY window (b) .............................................................3-23
SCREEN SETUP windows; BACKLIGHT TIMEOUT activation .........................................................................3-23
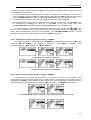
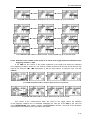
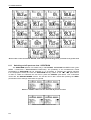
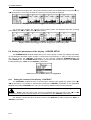
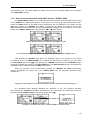
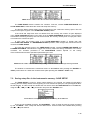
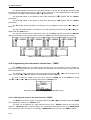
Displays after switching on the instrument in sound (b) or vibration mode (c)........................................................3-24
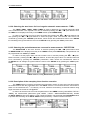
Displays in one profile (a) and 3 PROFILES display mode (b) with the SLM measurement results .......................3-24
Displays in one profile (a) and 3 PROFILES display mode (b) with the VLM measurement results ......................3-24
Displays in 3 PROFILES display mode with the measurements results, which are from LEVEL METER mode
(continuous lines) (b) and with the results, which are not from the LEVEL METER (dotted lines).............3-25
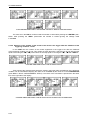
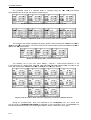
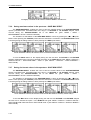
Display with all available icons................................................................................................................................3-25
Display with “Paper sheet” and “Battery” icons ......................................................................................................3-26
Display with “Computer” icon .................................................................................................................................3-26
Display with “Antenna” (“Tree”) icon .....................................................................................................................3-26
Display with “Loudspeaker” icon.............................................................................................................................3-26
Displays with “Headphone”, “Envelope” and “Bell” icons......................................................................................3-26
Displays with “Timer” and “Arrows” icons .............................................................................................................3-27
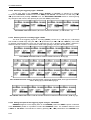
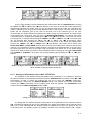
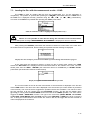
FUNCTION list opened, MODE selected (a) and MODE sub-list opened with all available modes b), (c)............3-27
Displays with FUNCTION list opened in SM, MEASUREMENT FUNCTION selected (a) and
MEASUR. FUNCTION sub-list opened with all available options (b), (c), (d), (e), (f) and (g) ..................3-28
Displays during the entering of the access code to a function ..................................................................................3-28
Display after the unsuccessful verification of the access code .................................................................................3-28
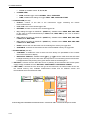
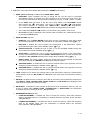
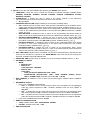
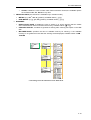
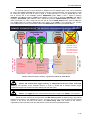
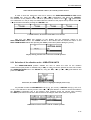
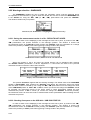
Scheme of the instrument’s memory organisation without the USB–HOST............................................................3-29
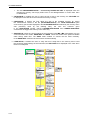
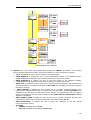
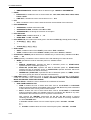
Scheme of the instrument’s memory organisation with the USB–HOST and memory stick connected...................3-30
vii
G7 USER MANUAL
_
Displays with the main list; the FUNCTION text selected (a) and the FUNCTION list opened; the MODE
selected (b) the MEASUREMENT FUNCTION selected (c) and the CALIBRATION selected (d) ............ 4-1
FUNCTION list opened; MODE selected (a) and MEASUR. FUNCTION sub-list opened with vibration
meter mode selected (b) and sound meter mode selected (c).......................................................................... 4-1
MEASUREMENT FUNCTION windows opened in SM (a), in VM (b) and the activation of the optional
function (c) ..................................................................................................................................................... 4-2
Displays with the main list; the FUNCTION text selected (a), the FUNCTION list opened, the
CALIBRATION text selected (b)................................................................................................................... 4-2
Displays with the selected calibration mode and after entering this mode................................................................. 4-3
Displays with the SENSITIVITY positions (path: MENU / FUNCTION / CALIBRATION / BY SENSITIVITY)
not accessible.................................................................................................................................................. 4-3
Displays during setting the sensitivity higher than 50.0 mV / Pa (a) and after pressing the <ENTER> pushbutton with the calibration factor calculated (b) ............................................................................................. 4-3
Displays during setting the sensitivity lower than 50.0 mV / Pa with the calculated calibration factor .................... 4-4
Displays with the lowest possible sensitivity and the highest calibration factor (a) and the highest sensitivity
and the lowest calibration factor (b) ............................................................................................................... 4-4
Displays with the selected calibration mode and after entering this mode................................................................. 4-4
Displays with the SENSITIVITY positions (path: MENU / FUNCTION / CALIBRATION / BY
SENSITIVITY) not accessible ......................................................................................................................... 4-5
Displays during setting the sensitivity higher than 10.0 mV / ms-2 (a) and after pressing the <ENTER> pushbutton with the calibration factor calculated (b) ............................................................................................. 4-5
Displays during setting the sensitivity lower than 10.0 mV / ms-2 (a) and after pressing the <ENTER> pushbutton with the calibration factor calculated (b) ............................................................................................. 4-5
Displays with the lowest possible sensitivity and the highest calibration factor (a) and the highest sensitivity
and the lowest calibration factor (b) ............................................................................................................... 4-5
Displays during the calibration measurement ............................................................................................................ 4-6
Displays after the measurements (a) and after the acceptance of the value of the calibration factor (b).................... 4-6
Displays with the question about switching on the compesation filter....................................................................... 4-7
Displays with the selected calibration mode and after entering this mode................................................................. 4-7
Displays while the instrument is waiting for the calibration measurement to commence .......................................... 4-7
Displays during the calibration measurements........................................................................................................... 4-8
Displays after the calibration measurements.............................................................................................................. 4-8
Displays after pressing the <ENTER> push-button (after calculation of the calibration factor value) ...................... 4-8
Displays in the CALIBRATION window; the LAST CALIBRATION text selected (a) the LAST
CALIBRATION window opened with ten calibration records (b) ................................................................. 4-9
Displays with the LAST CALIBRATION records .................................................................................................... 4-9
Display with the empty LAST CALIBRATION window .......................................................................................... 4-9
CALIBRATION window; TEDS text highlighted..................................................................................................... 4-9
TEDS window opened; NO DATA AVAILABLE message ................................................................................... 4-10
Main list with the INPUT text selected...................................................................................................................... 5-1
INPUT list in the LEVEL METER (a), in 1/1 OCTAVE and 1/3 OCTAVE analyser (b), in DOSE METER
(c), and in FFT analyser (d) ............................................................................................................................ 5-1
Displays with not active sub-lists of INPUT list during measurement....................................................................... 5-1
Displays with the MEASUREMENT SETUP window.............................................................................................. 5-2
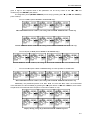
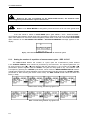
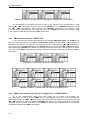
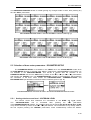
MEASUREMENT SETUP windows; the setting of the START DELAY with 1-second step.................................. 5-2
MEASUREMENT SETUP windows; the setting of the START DELAY with 10-seconds step .............................. 5-2
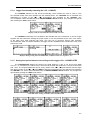
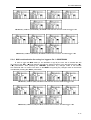
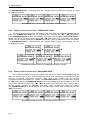
MEASUREMENT SETUP windows; the setting of the INTEGR. PERIOD with 1-second step.............................. 5-3
MEASUREMENT SETUP windows; the setting of the INTEGR. PERIOD with 10-seconds step .......................... 5-3
MEASUREMENT SETUP windows; the setting of the INTEGR. PERIOD with 1 and 10-minutes step................. 5-3
MEASUREMENT SETUP windows; the setting of the INTEGR. PERIOD with 10-hours step.............................. 5-3
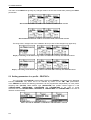
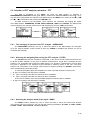
Displays during setting the predefined INTEGR. PERIOD sequence ....................................................................... 5-3
Dsplay, when the INT.PERIOD is too short for AUTO SAVE option ...................................................................... 5-4
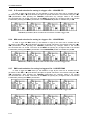
REP. CYCLE setting with the step equal to one........................................................................................................ 5-4
REP. CYCLE setting with the step equal to 20.......................................................................................................... 5-4
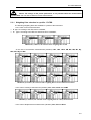
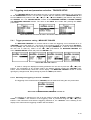
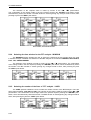
Displays with the LOGGER deactivated and activated ............................................................................................. 5-5
Displays during setting the LOGGER STEP; available values in a sequence 1, 2, 5................................................. 5-5
LOGGER STEP setting; available values in milliseconds......................................................................................... 5-5
LOGGER STEP setting; available values from 500 milliseconds to 1 hour .............................................................. 5-6
LOGGER NAME edition in MEASUREMENT SETUP .......................................................................................... 5-6
viii
G7 USER MANUAL
Displays during the attempt of overwriting the existing file.......................................................................................5-6
Relations between INTEGR. PERIOD and LOGGER STEP ....................................................................................5-7
INPUT list with the MEASUREMENT RANGE selected.........................................................................................5-7
MEASUREMENT RANGE windows in sound mode; the RANGE selection...........................................................5-8
MEASUREMENT RANGE windows in vibration mode, the RANGE selection ......................................................5-8
Displays with change of the default range values in sound mode caused by the calibration factor............................5-8
Displays with change of the default range values in vibration mode caused by the calibration factor .......................5-8
INPUT list with the PROFILE 1, PROFILE 2 and PROFILE 3 selected ..................................................................5-8
PROFILE(x) windows; the selection of the weighting filter in SM............................................................................5-9
PROFILE(1) windows; the selection of the weighting filter in acceleration measurements.......................................5-9
PROFILE(1) windows; the selection of the weighting filter in velocity measurements .............................................5-9
PROFILE(1) windows; the selection of the weighting filter in displacement measurements ...................................5-10
PROFILE(x) windows (SM); the selection of the RMS detector .............................................................................5-10
PROFILE(1) windows (vibration mode); the selection of the RMS detector...........................................................5-10
PROFILE(x) windows (sound mode); the PEAK result to be not saved or saved in a logger’s file.........................5-11
PROFILE(x) windows (vibration); the PEAK result to be not saved or saved in a logger’s file .............................5-11
PROFILE(x) windows (SM); the MAX result to be not saved or saved in a logger’s file .......................................5-11
PROFILE(x) windows (VM); the MAX result to be not saved or saved in a logger’s file.......................................5-11
PROFILE(x) windows; the P-P result to be not saved or saved in a logger’s file ....................................................5-12
PROFILE(x) windows; the MIN result to be not saved or saved in a logger’s file ..................................................5-12
PROFILE(x) window (SM); the RMS result to be not saved or saved in a logger’s file..........................................5-12
PROFILE(x) windows (VM); the RMS result to be not saved or saved in a logger’s file .......................................5-12
TRIGGER SETUP selected in the INPUT list and the TRIGGER SETUP window ...............................................5-13
MEASURE TRIGGER windows .............................................................................................................................5-13
MEASURE TRIGGER window; TRIGGER switched off .......................................................................................5-13
Displays during the measurements while the triggering condition is not fulfilled....................................................5-14
MEASURE TRIGGER windows with the SLOPE modes selected .........................................................................5-14
MEASURE TRIGGER windows with the LEVEL modes selected .........................................................................5-14
MEASURE TRIGGER window with the GRAD + mode selected ..........................................................................5-14
MEASURE TRIGGER windows with not active SOURCE signal line ...................................................................5-15
MEASURE TRIGGER windows with the SOURCE signal selection......................................................................5-15
MEASURE TRIGGER windows with the LEVEL selection in the SLOPE + mode ...............................................5-15
MEASURE TRIGGER windows with the LEVEL selection in the SLOPE – mode (10 dB step down).................5-15
MEASURE TRIGGER windows with the LEVEL selection in the LEVEL + mode (1 dB step up) .......................5-16
MEASURE TRIGGER windows with the LEVEL selection in the LEVEL – mode (1 dB step up) .......................5-16
MEASURE TRIGGER windows with the LEVEL selection in the GRAD + mode (1 dB step down)....................5-16
MEASURE TRIGGER windows with the GRADIENT selection (1 dB/ms and 10 dB/ms step up) .......................5-16
MEASURE TRIGGER windows with the GRADIENT selection (10 dB/ms up and 1 dB/ms down).....................5-16
LOGGER SETUP windows in sound mode.............................................................................................................5-17
LOGGER SETUP windows in vibration mode ........................................................................................................5-17
LOGGER TRIGGER windows with the not active SOURCE signal line in sound mode........................................5-17
LOGGER TRIGGER windows with the not active SOURCE signal line in vibration mode ...................................5-18
LOGGER TRIGGER windows with the LEVEL selection (1 dB step up) in sound mode ......................................5-18
LOGGER TRIGGER windows with the LEVEL selection (1 dB step up) in vibration mode .................................5-18
LOGGER TRIGGER windows with the LEVEL selection in vibration mode (1 dB step up, cont.) .......................5-18
LOGGER TRIGGER windows with the LEVEL selection (10 dB step up) in sound mode ....................................5-19
LOGGER TRIGGER windows with the LEVEL selection (10 dB step up) in vibration mode ...............................5-19
LOGGER TRIGGER windows with the PRE selection in sound mode...................................................................5-19
LOGGER TRIGGER windows with the PRE selection in vibration mode ..............................................................5-19
LOGGER TRIGGER windows with the PRE selection for different LOGGER STEPS .........................................5-20
LOGGER TRIGGER windows with the POST selection.........................................................................................5-20
LOGGER TRIGGER windows with the POST selection for different LOGGER STEPS.......................................5-20
LOGGER TRIGGER windows with the POST selection for different LOGGER STEPS in vibration mode..........5-21
TRIGGER SETUP window; the RECORDER TRIGGER text highlighted ............................................................5-21
RECORDER TRIGGER windows; the TRIGGER selection...................................................................................5-21
RECORDER TRIGGER windows; the source selection for SLOPE + (a) and SLOPE – (b) ..................................5-22
RECORDER TRIGGER windows with the LEVEL selection (1 dB step up) .........................................................5-22
RECORDER TRIGGER windows with the LEVEL selection in vibration mode, level expressed in linear
units, 1 dB step up (a) and 10 dB step up (b)................................................................................................5-22
ix
G7 USER MANUAL
_
RECORDER TRIGGER windows with the LEVEL selection in sound and vibration mode (10 dB step up)......... 5-22
RECORDER TRIGGER windows with the GRADIENT selection (1 dB step up) ................................................. 5-23
RECORDER TRIGGER windows with the GRADIENT selection (10 dB step up) ............................................... 5-23
DOSIMETER SETUP selected in the INPUT list and the DOSIMETER SETUP window.................................... 5-23
DOSIMETER SETUP windows; the CRITERION LEVEL selection .................................................................... 5-24
DOSIMETER SETUP windows; the THRESHOLD LEVEL selection .................................................................. 5-24
DOSIMETER SETUP windows; the EXCHANGE RATE selection ...................................................................... 5-24
FFT selected in the INPUT list and the FFT window opened in sound mode (a) and in vibration mode (b) .......... 5-25
FFT window; the FILTER selection in sound mode ................................................................................................ 5-25
FFT window; the BAND selection .......................................................................................................................... 5-26
FFT sublist; the WINDOW selection ...................................................................................................................... 5-26
FFT window; the LINES selection .......................................................................................................................... 5-26
FFT window; the LOGGER activation .................................................................................................................... 5-27
SPECTRUM selected in the INPUT list and the SPECTRUM window opened in sound mode (a) and in
vibration mode (b) ........................................................................................................................................ 5-27
SPECTRUM window; the FILTER selection in sound mode.................................................................................. 5-28
SPECTRUM window; the BAND selection in sound mode .................................................................................... 5-28
SPECTRUM window; the LOGGER selection........................................................................................................ 5-28
Display in the main list; the DISPLAY text highlighted (displayed inversely).......................................................... 6-1
Display with the DISPLAY list.................................................................................................................................. 6-1
DISPLAY MODES windows in SM.......................................................................................................................... 6-2
DISPLAY MODES windows in VM ......................................................................................................................... 6-2
Display in the LOGGER mode when there is nothing in the logger to be displayed (after setting LOGGER as
active) ............................................................................................................................................................. 6-3
Measurement results in SM, made with linear integration, presented in one profile mode........................................ 6-3
Measurement results in VM presented in one profile mode....................................................................................... 6-4
Measurement results, made with exponential integration in SM, presented in one profile mode .............................. 6-4
Measurement results, made with exponential integration in SM, saved in the file named MAR11, presented in
one profile mode............................................................................................................................................. 6-4
Displays with the statistics made with linear integration presented in one profile mode ........................................... 6-5
Displays with the statistics made with exponential integration presented in one profile mode.................................. 6-5
Measurement results in SM and unknown profile presented with the biggest fonts in one profile mode .................. 6-6
Measurement results in VM and unknow profile presented with the biggest fonts in one profile mode.................... 6-6
Displays during the measurement performed in SOUND LEVEL METER mode with the active LOGGER
(an envelope icon) .......................................................................................................................................... 6-6
Displays during the measurement performed in VM with the active LOGGER (an envelope icon).......................... 6-7
Displays after stopping the measurements with the name of the logger’s file the data are saved .............................. 6-7
Measurement results from DOSE METER, made with exponential integration, presented in one profile mode....... 6-8
DISPLAY MODES windows in SM; SPECTRUM position accesible ..................................................................... 6-8
DISPLAY MODES windows in VM ......................................................................................................................... 6-8
Displays in SPECTRUM mode for 1/1 OCTAVE (a), 1/3 OCTAVE (b) and FFT (c) ............................................. 6-9
Setting on and off the accessibility of three profiles presentation mode .................................................................... 6-9
Measurement results in 3 PROFILES mode .............................................................................................................. 6-9
Results in 3 PROFILES mode (SM); selection of the result in a profile.................................................................. 6-10
Results in 3 PROFILES mode (VM); selection of the result in a profile ................................................................. 6-10
Results in 3 PROFILES mode; selection of the profile............................................................................................ 6-10
Displays with the statistics made with linear integration presented in 3 PROFILES mode ..................................... 6-10
Displays during the measurement performed in SM with the active LOGGER....................................................... 6-11
Displays during the measurement performed in LEVEL METER mode with the active LOGGER (the first
three) and after saving the results (the last one)............................................................................................ 6-11
Setting on (a) and off (b) the accessibility of statistics presentation mode .............................................................. 6-11
Results presented in the statistics presentation mode............................................................................................... 6-12
Instrument’s default Lxx levels presented in the graphical form ............................................................................. 6-12
Results presented in both statistic presentation modes ............................................................................................ 6-12
Results presented in both statistic presentation modes during the measurements .................................................... 6-12
Setting on and off the accessibility of LOGGER presentation mode ....................................................................... 6-13
Exemplary displays with the measurement results saved in the logger .................................................................... 6-13
Setting on and off the file description presentation mode........................................................................................ 6-13
Exemplary contents of the FILE INFO window ...................................................................................................... 6-13
x
G7 USER MANUAL
DISPLAY list with the DISPLAY SETUP selected.................................................................................................6-14
DISPLAY SETUP windows in SLM (a), in VLM (b) in FFT (SM) (c) and in 1/1 and 1/3 OCTAVE (VM) (d) ....6-14
Displays with the possible options of the vibration SCALE ....................................................................................6-14
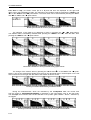
Measurement results (VM) presented in linear (a) and logarithmic (b) scale...........................................................6-15
Displays with the possible values of the DYNAMIC parameter ..............................................................................6-15
Displays with the results stored in the logger presented with different DYNAMIC parameter................................6-15
DISPLAY SCALE windows; the X–ZOOM selection.............................................................................................6-15
Displays in 1/1 OCTAVE SPECTRUM 3x, 4x, and 5x X–ZOOM .........................................................................6-15
Displays in 1/3 OCTAVE SPECTRUM 2x, 3x, 4x, and 5x X–ZOOM ...................................................................6-16
Displays in FFT SPECTRUM 1x, 2x, 3x, 4x, and 5x X–ZOOM.............................................................................6-16
Displays with the grid switched on and off ..............................................................................................................6-16
Displays with the grid switched on and off ..............................................................................................................6-16
Displays with the autoscale switched on and off ......................................................................................................6-17
DISPLAY SETUP window; the SPECTRUM TYPE text highlighted ....................................................................6-17
SPECTRUM TYPE windows with the available values ..........................................................................................6-17
DISPLAY SETUP window; the SPECTRUM VIEW text highlighted ....................................................................6-18
SPECTRUM VIEW windows; the VIEW selection.................................................................................................6-18
SPECTRUM VIEW windows; the TYPE selection .................................................................................................6-18
SPECTRUM VIEW windows, the MAX selection..................................................................................................6-18
SPECTRUM VIEW windows; the MIN selection ...................................................................................................6-19
DISPLAY SETUP window; the TOTAL VALUES text highlighted.......................................................................6-19
TOTAL VALUES windows; the weighting filters selection in SM .........................................................................6-19
TOTAL VALUES windows in VM; the TOTALx selected.....................................................................................6-19
TOTAL x windows; the weighting filters selection in VM ......................................................................................6-20
TOTALx windows; the TYPE selection ..................................................................................................................6-20
TOTALx windows; CALIBRATION FACTOR setting ..........................................................................................6-20
DISPLAY SETUP windows, the LOGGER VIEW text highlighted .......................................................................6-20
LOGGER VIEW windows with the possible values of the VIEW parameter..........................................................6-21
Displays with the possible values of the VIEW parameter.......................................................................................6-21
LOGGER VIEW windows with the possible values of the TIME parameter ..........................................................6-21
Displays with the possible values of the TIME parameter .......................................................................................6-21
DISPLAY list; the LOGGER VIEW text highlighted..............................................................................................6-22
Displays in the LOGGER VIEW sub-list.................................................................................................................6-22
Displays in the LOGGER VIEW sub-list; the selection of the file to be seen..........................................................6-22
Displays in the LOGGER VIEW sub-list; the scrolling of the file to be seen..........................................................6-22
Display in the LOGGER VIEW sub-list in the case when the files do not exist ......................................................6-23
Displays with the selected logger’s file; the change of the cursor position ..............................................................6-23
Displays with the selected logger’s file; the scrolling to the right ............................................................................6-23
Displays with the selected logger’s file; the scrolling to the left ..............................................................................6-23
Displays with the selected logger’s file; the change of the axis relation ..................................................................6-23
Displays with the selected logger’s file; the change of the profile ...........................................................................6-24
Displays with the selected logger’s file; the change of the result from a profile ......................................................6-24
DISPLAY list; the SCREEN SETUP text highlighted.............................................................................................6-24
SCREEN SETUP windows; the change of the contrast ...........................................................................................6-25
SCREEN SETUP windows; the BACKLIGHT TIMEOUT active (a), and not active (b).......................................6-25
DISPLAY window with BATTERY text highlighted ..............................................................................................6-25
BATTERY windows for different sources powering the instrument .......................................................................6-25
DISPLAY list; the UNIT LABEL text highlighted ..................................................................................................6-26
UNIT LABEL windows opened and after scrolling with the <>, <> push-buttons ..........................................6-26
Main list; the FILE text highlighted (displayed inversely) .........................................................................................7-2
FILE list of the instrument .........................................................................................................................................7-3
SAVE window in the FILE list...................................................................................................................................7-3
Display during the process of setting the character in the edited name ......................................................................7-3
Display during the selection of the character’s position to be edited .........................................................................7-4
Display during the selection of the character .............................................................................................................7-4
FILE NAME edition after pressing the <SHIFT> and <
> push-buttons .................................................................7-4
FILE NAME edition after pressing the <SHIFT> and <
> push-buttons .................................................................7-4
Displays during the attempt of overwriting the existing file, changing the name and saving data .............................7-5
Displays in the simplified edition of the file name and the execution of the saving operation...................................7-5
xi
G7 USER MANUAL
_
Displays in the simplified edition of the file name, saving and the “saturation” of that operation............................. 7-5
Displays after the attempt to perform unavailable saving operation and the return to the SAVE NEXT .................. 7-5
Display after the SAVE operation when there were no results for storing................................................................. 7-6
View of all displays during and after the execution of the SAVE operation.............................................................. 7-6
Displays after the attempt to overwrite a file if the REPLACE is not active ............................................................. 7-6
Settings and the FILE INFO after the performed measurements ............................................................................... 7-7
FREE SPACE window before and after saving the @EXAMP1 file......................................................................... 7-7
Settings and the FILE INFO after the performed measurements ............................................................................... 7-7
FREE SPACE window before and after saving the @EXAMP2 file......................................................................... 7-7
Settings before the execution of the measurements.................................................................................................... 7-8
Settings for the current measurements ....................................................................................................................... 7-8
FILE INFO during and after the measurements ......................................................................................................... 7-8
FREE SPACE window before and after saving the @EXAMP3 and &LOG100 files .............................................. 7-8
Settings before the execution of the measurements.................................................................................................... 7-9
Settings and the FILE INFO during and after the measurements............................................................................... 7-9
FREE SPACE window before and after saving the @EXAMP4 and &LOG100 files .............................................. 7-9
FILE list with the SAVE OPTIONS text highlighted (displayed inversely) ............................................................ 7-10
SAVE OPTIONS sub-list; the selection of the RAM FILE ..................................................................................... 7-10
SAVE OPTIONS sub-list; the selection of the REPLACE...................................................................................... 7-11
SAVE OPTIONS window without RAM FILE position; the selection of the REPLACE....................................... 7-11
Displays during the file saving when the REPLACE is switched off and on ........................................................... 7-11
SAVE OPTIONS sub-list; the selection of the SAVE STATISTICS...................................................................... 7-11
SAVE OPTIONS window without RAM FILE position; the selection of the SAVE STATISTICS....................... 7-12
SAVE OPTIONS sub-list; the selection of the AUTO SAVE ................................................................................. 7-12
SAVE OPTIONS sub-list; the selection of the AUTO SAVE in DOSE METER ................................................... 7-12
Displays during the execution of the AUTO SAVE switching on; the FILE NAME skipping and return to the
SAVE OPTION sub-list ............................................................................................................................... 7-12
Display after attempt of switching on AUTO SAVE option with too short INT. PERIOD ..................................... 7-13
Displays during the execution of the AUTO SAVE switching on; the FILE NAME confirmation and return to
the FILE list.................................................................................................................................................. 7-13
Displays after the incorrect file name edition .......................................................................................................... 7-13
Measurement results (SM) presented after pressing the <
> or <
> push-buttons............................................... 7-14
Measurement results (VM) presented after pressing the <
> or <
> push-buttons .............................................. 7-14
Results saved from a profile presented after pressing the <
> or <
> and <ALT> push-buttons ......................... 7-14
Results saved from a profile presented after pressing the <
> or <
> and <ALT> push-buttons ......................... 7-14
Results saved from a profile presented after pressing the <
> or <
> and <ALT> push-buttons ......................... 7-14
SAVE OPTIONS sub-list; the selection of the DIRECT SAVE.............................................................................. 7-15
SAVE OPTIONS window without RAM FILE position; the selection of the DIRECT SAVE............................... 7-15
Display after the attempt to perform an unavailable operation during measurement in progress............................. 7-15
Exemplary executions of the software with the DIRECT SAVE not active ............................................................ 7-15
Exemplary executions of the software with the DIRECT SAVE active................................................................... 7-16
SAVE OPTIONS sub-list; the selection of the SAVE MAX SPECT. in SM (a) and in VM (b)............................. 7-16
SAVE OPTIONS sub-list; the selection of the SAVE MIN SPECT. in SM (a) and in VM (b) .............................. 7-16
FILE list with the LOAD text highlighted (displayed inversely) ............................................................................. 7-17
Display after the attempt to perform an unavailable operation during measurement in progress............................. 7-17
Display during the execution of the LOAD operation ............................................................................................. 7-17
Exemplary contents of the LOAD window .............................................................................................................. 7-18
Exemplary result files associated with the same logger file (&LOG2) .................................................................... 7-18
Display during the execution of the loading function .............................................................................................. 7-18
Displays after the execution of the LOAD operation............................................................................................... 7-18
Exemplary displays during the loading and checking the contents of a DOSE METER file ................................... 7-19
Exemplary displays during the loading and checking the contents of a LEVEL METER file................................. 7-19
FILE list with the DELETE text highlighted (displayed inversely) ......................................................................... 7-19
RESULT FILES selected to be deleted and the flash memory does not contain any file ........................................ 7-20
Display after the attempt to perform an unavailable operation during measurement in progress............................. 7-20
Selection of the RESULT FILES to be deleted ....................................................................................................... 7-21
Execution of the RESULT FILES deletion.............................................................................................................. 7-21
Execution of the @EXAMP4 file deletion and the influence of this process on the memory space........................ 7-21
Execution of the @EXAMP5 file deletion and the influence of this process on the memory space........................ 7-21
xii
G7 USER MANUAL
LOGGER FILES selected to be deleted and the memory does not contain any file ................................................7-22
Display after the attempt to perform an unavailable operation during measurement in progress.............................7-22
Selection of the LOGGER FILES to be deleted.......................................................................................................7-23
Execution of the LOGGER FILES deletion .............................................................................................................7-23
Execution of the &LOG107 file deletion from the logger memory and its influence on the memory space
(LOGGER AVAILABLE) ............................................................................................................................7-23
Execution of the &LOG113 file deletion and the influence of this process on the memory space...........................7-24
SETUP FILES selected to be deleted and the instrument’s memory does not contain any file................................7-24
Display after the attempt to perform an unavailable operation during measurement in progress.............................7-24
Selection of the SETUP FILES to be deleted...........................................................................................................7-24
Execution of the RESULT FILES deletion ..............................................................................................................7-25
Execution of the @SET3 file deletion and its influence on the memory space ........................................................7-25
Execution of the @SET8 file deletion and the influence of this process on the memory space ...............................7-25
DELETE ALL text highlighted (displayed inversely) in the FILE list.....................................................................7-26
RESULT FILES selected to the execution of the DELETE ALL operation ............................................................7-26
Display after the attempt to perform an unavailable operation during measurement in progress.............................7-26
Displays with the confirmation window during the execution of the DELETE ALL operation...............................7-26
Execution of the DELETE ALL operation in the case of RESULT FILES selection ..............................................7-27
LOGGER FILES selected to the execution of the DELETE ALL operation ...........................................................7-27
Display after the attempt to perform an unavailable operation during measurement in progress.............................7-27
Displays with the confirmation window during the execution of the DELETE ALL operation...............................7-27
Execution of the DELETE ALL operation in the case of LOGGER FILES selected ..............................................7-28
SETUP FILES selected to the execution of the DELETE ALL operation ...............................................................7-28
Display after the attempt to perform an unavailable operation during measurement in progress.............................7-28
Displays with the confirmation window during the execution of the DELETE ALL operation...............................7-28
Execution of the DELETE ALL operation in the case of SETUP FILES selection .................................................7-29
Execution of the DELETE ALL operation for all type files simultaneously............................................................7-29
DEFRAGMENTATION text highlighted (displayed inversely) in the FILE list .....................................................7-29
FILES DEFRAGMENT. selected to the execution of the DEFRAGMENTATION operation ...............................7-30
Confirmation windows during the execution of the FILES DEFRAGMENTATION operation..............................7-30
Display after the attempt to perform an unavailable operation during measurement in progress.............................7-30
Message in the case when the execution of the DEFRAGMENTATION operation is unnecessary ........................7-31
Execution of the DEFRAGMENTATION operation...............................................................................................7-31
Result of the FILES DEFRAGMENTATION operation .........................................................................................7-31
LOGGER DEFRAGMENT. selected to the execution of the DEFRAGMENTATION operation..........................7-31
Confirmation windows during the execution of the LOGGER DEFRAGMENTATION operation ........................7-32
Display after the attempt to perform an unavailable operation during measurement in progress.............................7-32
Message in the case when the execution of the DEFRAGMENTATION operation is unnecessary ........................7-32
Execution of the DEFRAGMENTATION operation...............................................................................................7-32
Result of the LOGGER DEFRAGMENTATION operation....................................................................................7-33
CATALOGUE text highlighted (displayed inversely) in the FILE list ....................................................................7-33
CATALOGUE window when the memory is empty ................................................................................................7-33
Contents of the CATALOGUE window...................................................................................................................7-34
Exemplary result files associated with the same logger file &LOG2 in the CATALOGUE window.......................7-34
FREE SPACE text highlighted (displayed inversely) in the FILE list .....................................................................7-34
FREE SPACE window after the execution of the DELETE ALL operation............................................................7-35
FREE SPACE window with the number depending on the measurements and operations performed.....................7-35
SAVE SETUP text highlighted (displayed inversely) in the FILE list.....................................................................7-35
SAVE SETUP window in the FILE list ...................................................................................................................7-36
Display during the process of setting the character in the edited name ....................................................................7-36
Display during the selection of the character’s position to be edited .......................................................................7-36
Display during the selection of the character ...........................................................................................................7-36
Displays in the FILE NAME edition after pressing the <SHIFT> and <
> push-buttons ......................................7-37
Displays in the FILE NAME edition after pressing the <SHIFT> and <
> push-buttons ......................................7-37
Displays during the attempt of overwriting the existing file, changing the name and saving data ...........................7-37
Displays in the simplified edition of the setup file name and saving operation execution .......................................7-37
Displays in the simplified edition of the file name, saving and the “saturation” of that operation ...........................7-38
Displays after the attempt to perform unavailable saving operation; the return to the SAVE SETUP.....................7-38
View of all displays during and after the execution of the SAVE operation ............................................................7-38
xiii
G7 USER MANUAL
_
Displays after the attempt to overwrite a file if the REPLACE is active ................................................................. 7-39
FILE list with the LOAD SETUP text highlighted (displayed inversely) ................................................................ 7-39
Display after the attempt to perform an unavailable operation during measurement in progress............................. 7-39
Display during the execution of the LOAD SETUP operation ................................................................................ 7-39
Exemplary contents of the LOAD SETUP window................................................................................................. 7-40
Displays after the execution of the LOAD SETUP operation.................................................................................. 7-40
FILE list with the DIRECTORY text selected (a) and the DIRECTORY window opened (b) ............................... 7-40
FILE list, the DIRECTORY window....................................................................................................................... 7-41
FILE list with the COPY FILES TO USB text selected (a) and the COPY FILES window opened (b).................. 7-41
RESULT FILES selection to the execution of the COPY FILES TO USB operation (a); the RESULT,
LOGGER and SETUP files selected to the execution of the COPY FILES TO USB operation (b) ............ 7-41
Display after the attempt to perform an unavailable operation during measurement in progress............................. 7-42
Display after the execution of COPY FILES TO USB operation (a) and when the file exists already (b) .............. 7-42
FILE list with the MOVE FILES TO USB text selected (a) and the MOVE FILES window opened (b) ............... 7-42
RESULT FILES selection to the execution of the MOVE FILES TO USB operation (a) the RESULT,
LOGGER and SETUP files selected to the execution of the MOVE FILES TO USB operation (b) ........... 7-42
Display after the attempt to perform an unavailable operation during measurement in progress............................. 7-43
Display after the execution of MOVE FILES TO USB operation (a) and when the file already exists in the
USB memory (b) .......................................................................................................................................... 7-43
Display in the main list; the REPORT text highlighted (displayed inversely) ........................................................... 8-1
SETUP list with the USB–HOST PORT selected and this window with the activated RS232 ................................. 8-1
SETUP list with the RS232 selected and the exemplary contents of this window..................................................... 8-1
REPORT windows in SM (SOUND METER) mode ................................................................................................ 8-2
REPORT windows in the vibration mode.................................................................................................................. 8-2
REPORT windows with the TITLE selected in SM (a) and VM (b) ......................................................................... 8-3
Displays in the text edition of the report’s header ..................................................................................................... 8-3
Displays with all available characters ........................................................................................................................ 8-3
Displays with all available characters (cont.)............................................................................................................. 8-4
REPORT windows with the PRINT RESULTS selected in SM (a) and VM (b)....................................................... 8-4
Display after the attempt to perform an unavailable operation during measurement in progress............................... 8-4
Display in the REPORT list; the execution of the PRINT RESULTS....................................................................... 8-4
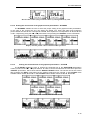
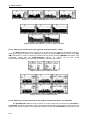
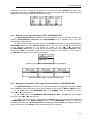
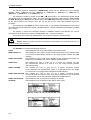
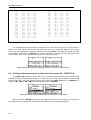
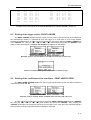
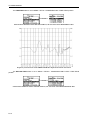
Example of the printed results - A5 format................................................................................................................ 8-5
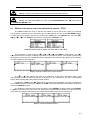
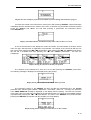
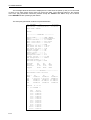
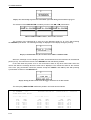
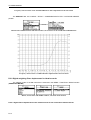
Example of the printed results from the SOUND METER mode (LEVEL METER) - A4 format............................ 8-6
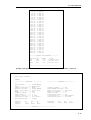
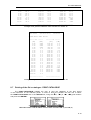
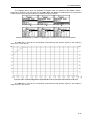
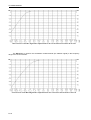
Example of the printed results from the VIBRATION METER mode (1/3 OCTAVE) - A4 format......................... 8-7
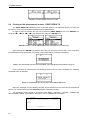
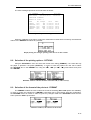
Displays with the confirmation request of the paper ejection .................................................................................... 8-7
Displays during the results printing when there is no transfer (a) and no data (b) ..................................................... 8-8
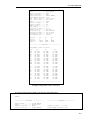
REPORT window with the PRINT STATISTICS selected ....................................................................................... 8-8
Display after the attempt to perform an unavailable operation during measurement in progress............................... 8-8
Display in the REPORT list; the execution of the PRINT STATISTICS.................................................................. 8-8
Displays with the confirmation request of the paper ejection .................................................................................... 8-9
Example of the printed statistics from the SOUND LEVEL METER mode - format A5........................................ 8-11
Example of the printed statistics from the SOUND METER mode (DOSE METER) - format A4......................... 8-12
Displays during the statistics printing when there is no transfer (a) and no data (b)................................................ 8-12
REPORT windows with the PRINT FILE selected in SM (a) and VM (b) ............................................................. 8-12
Display after the attempt to perform an unavailable operation during measurement in progress............................. 8-13
Display in the REPORT list; the PRINT FILE position when no files were saved.................................................. 8-13
Displays during the selection of the file to be printed.............................................................................................. 8-13
Display during the execution of the PRINT FILE operation ................................................................................... 8-13
Display during the file sending out when there is no data transfer........................................................................... 8-13
Example of the printed file from the VIBRATION METER mode (1/3 OCTAVE) - format A5............................ 8-15
Example of the printed file from the SOUND METER mode (LEVEL METER) - format A4 ............................... 8-17
REPORT windows with the PRINT LOGGER selected in SM (a) and VM (b)...................................................... 8-17
PRINT LOGGER window opened - Function not available message...................................................................... 8-17
REPORT windows with the PRINT USER FILTERS selected in SM and in VM .................................................. 8-17
Display after the attempt to perform an unavailable operation during measurement in progress............................. 8-18
PRINT USER FILTERS windows; the user filter selection .................................................................................... 8-18
Display in the REPORT list; the execution of the PRINT USER FILTERS ........................................................... 8-18
Display during the file transfer from the logger when there is no data transfer ....................................................... 8-18
Example of the printed coefficients of the user filter S1- format A4 ....................................................................... 8-19
xiv
G7 USER MANUAL
Example of the printed coefficients of the user filter S2 - format A5.......................................................................8-19
REPORT windows with the PRINT CATALOGUE selected in SM (a) and VM (b) ..............................................8-19
Display after the attempt to perform an unavailable operation during measurement in progress.............................8-20
Display in the REPORT list; the execution of the PRINT CATALOGUE ..............................................................8-20
Displays with the confirmation request of the paper ejection...................................................................................8-20
Example of the printed catalogue - format A4 .........................................................................................................8-20
Example of the printed catalogue - format A5 .........................................................................................................8-21
Display during the catalogue printing when there is no data transfer.......................................................................8-21
REPORT windows with the OPTION selected in SM (a) and in VM (b) ................................................................8-21
OPTIONS windows; the selection of the format ......................................................................................................8-21
OPTIONS windows; the selection of the paper ejection ..........................................................................................8-22
Displays with the request for the confirmation of the paper ejection .......................................................................8-22
Display after a printing when there is not possible to eject a paper .........................................................................8-22
Display in the main list; the SETUP text highlighted (displayed inversely)...............................................................9-1
SETUP list in the SM.................................................................................................................................................9-2
SETUP list in the VM ................................................................................................................................................9-2
SETUP list; the LANGUAGE text highlighted (displayed inversely)........................................................................9-3
Displays with the English version of the user interface..............................................................................................9-3
Displays with the Italian version of the user interface................................................................................................9-3
Displays with the Polish version of the user interface................................................................................................9-3
Displays with the Hungarian version of the user interface .........................................................................................9-3
Displays with the Flemish version of the user interface .............................................................................................9-3
Displays with the French version of the user interface...............................................................................................9-3
Displays with the Spanish version of the user interface .............................................................................................9-4
Displays with the German version of the user interface .............................................................................................9-4
Displays with the Turkish version of the user interface..............................................................................................9-4
Displays during the entering of the access code to the Russian version of the user interface ....................................9-4
Displays with the Russian version of the user interface available only on some markets ..........................................9-4
SETUP list; the CLEAR SETUP text highlighted (displayed inversely) ...................................................................9-4
Displays with the request for the confirmation for the CLEAR SETUP execution....................................................9-5
Displays during and after the execution of the CLEAR SETUP function ..................................................................9-5
SETUP list; the COMPENSATION FILTER text highlighted (displayed inversely) ................................................9-5
Compensation filter window with all available options..............................................................................................9-6
Displays with the question about switching on the compesation filter .......................................................................9-6
SETUP list with the DAY TIME LIMITS text highlighted (displayed inversely) .....................................................9-6
Displays with the available DAY TIME LIMITS ......................................................................................................9-6
SETUP list with the EXPOSURE TIME text highlighted (displayed inversely) .......................................................9-7
EXPOSURE TIME windows .....................................................................................................................................9-7
SETUP list, the EXTERNAL I/O SETUP text highlighted .......................................................................................9-7
EXTERNAL I/O SETUP windows; the MODE selection .........................................................................................9-8
EXTERNAL I/O SETUP windows; D/A selection ....................................................................................................9-8
EXTERNAL I/O SETUP windows; the source selection for D/A option ..................................................................9-8
MEASURE TRIGGER windows; the TRIGGER selection .......................................................................................9-9
EXTERNAL I/O SETUP windows; the FUNCTION selection .................................................................................9-9
EXTERNAL I/O SETUP windows; the POLARISATION selection ........................................................................9-9
EXTERNAL I/O SETUP windows; the ACTIVE LEVEL selection .......................................................................9-10
EXTERNAL I/O SETUP windows; the SOURCE selection ...................................................................................9-10
EXTERNAL I/O SETUP windows; the ALARM LEVEL setting ...........................................................................9-11
SETUP list, the HUMAN VIB. FILT. text highlighted (displayed inversely) .........................................................9-11
Displays during the entering of the access code to a function ..................................................................................9-11
SETUP list, the IEPE CURRENT text highlighted (displayed inversely)................................................................9-11
IEPE CURRENT windows; the IEPE supply selection............................................................................................9-12
SETUP list, the REFERENCE LEVELS text highlighted (displayed inversely) .....................................................9-12
REFERENCE LEVELS windows; the reference level setting of acceleration signal ..............................................9-12
REFERENCE LEVEL windows; setting the reference level of velocity signal .......................................................9-13
REFERENCE LEVELS windows; setting the reference level of displacement signal.............................................9-13
REFERENCE LEVELS windows; the reference level of the acoustic signal ..........................................................9-13
SETUP list, the REMOTE COMMUNICATION text highlighted (displayed inversely)........................................9-13
REMOTE COMMUNICATION windows; the TYPE selection .............................................................................9-14
xv
G7 USER MANUAL
_
REMOTE COMMUNICATION windows; packet size selection ........................................................................... 9-14
SETUP list with the RMS INTEGRATION text highlighted (displayed inversely) ................................................ 9-14
Displays and with the available options of the RMS INTEGRATION.................................................................... 9-15
SETUP list, the RS232 text highlighted (displayed inversely) ................................................................................ 9-15
RS232 windows; the possible settings of the BAUD RATE.................................................................................... 9-16
RS232 window; the setting of the TIME OUT with 1-second step.......................................................................... 9-16
RS232 window; the setting of the TIME OUT with 10-seconds step ...................................................................... 9-16
SETUP list, the RTC text highlighted (displayed inversely) ................................................................................... 9-16
RTC windows with the different parameters to be set ............................................................................................. 9-17
SETUP list, the RT60 AVERAGING text highlighted (displayed inversely).......................................................... 9-17
RT60 AVERAGING window; the AVERAGING activation .................................................................................. 9-17
RT60 AVERAGING window; the AVERAGING CLEAR selection...................................................................... 9-18
RT60 AVERAGING window; the change of AVERAGING NO. after measurement (position is not
accessible) .................................................................................................................................................... 9-18
RT60 selected in the SETUP list and the RT60 OPTIONS window opened........................................................... 9-18
RT60 OPTIONS window; the SMOOTHING selection with the step equal to 1 .................................................... 9-19
RT60 OPTIONS window; the SMOOTHING selection with the step equal to 5 .................................................... 9-19
RT60 OPTIONS window; the NOISE MAR. selection with 0.1dB step ................................................................. 9-19
RT60 OPTIONS window; the NOISE MAR. selection with 1dB step .................................................................... 9-19
RT60 RESULTS selected in the SETUP list and the RT60 RESULTS window opened ........................................ 9-20
RT60 RESULTS window, unmarking option in 1/3 octave band ............................................................................ 9-20
SETUP list, the SHIFT MODE text highlighted (displayed inversely) ................................................................... 9-20
SHIFT MODE windows; the available SHIFT settings ........................................................................................... 9-21
SHIFT MODE windows; the available ST/SP settings............................................................................................ 9-21
SETUP list, the STATISTICAL LEVELS sub-list selected .................................................................................... 9-21
Displays in the STATISTICAL LEVELS sub-list ................................................................................................... 9-22
SETUP list, the TIMER text highlighted (displayed inversely)............................................................................... 9-22
TIMER windows; the mode selection...................................................................................................................... 9-23
TIMER windows; setting day of the instrument’s switch on ................................................................................... 9-23
TIMER windows; setting hour and minute of the instrument’s switch on ............................................................... 9-24
TIMER windows; setting REPETITION parameter ................................................................................................ 9-24
Exemplary settings made for the desired execution of the TIMER function ........................................................... 9-25
Counting down during the warming up of the instrument after switching it on ....................................................... 9-25
Displays during the executing of the TIMER function ............................................................................................ 9-25
SETUP list, the USB–HOST PORT text highlighted (displayed inversely) ............................................................ 9-25
Displays in the USB–HOST PORT ......................................................................................................................... 9-26
Displays during the entering of the access code to SRT RECORDING, WAVE RECORDING or
EVENT RECORDING................................................................................................................................. 9-26
Displays with the different USB disk warnings ....................................................................................................... 9-27
Contents of the DIRECTORY window.................................................................................................................... 9-27
Displays during the IrDA interface connection........................................................................................................ 9-28
SETUP list, the USER FILTERS text highlighted (displayed inversely) ................................................................ 9-28
USER FILTERS windows, SPECTRUM BASED FILTERS selected .................................................................... 9-29
SPECTRUM BASED FILTERS window, the VIEW text highlighted .................................................................... 9-29
VIEW windows, the filter selection ......................................................................................................................... 9-29
S1 filter windows ..................................................................................................................................................... 9-29
SPECTRUM BASED FILTERS window, the EDIT text highlighted ..................................................................... 9-30
EDIT windows, the filter selection .......................................................................................................................... 9-30
S1 filter windows; the coefficient selection ............................................................................................................. 9-30
SPECTRUM BASED FILTER window; the CLEAR position selected.................................................................. 9-31
CLEAR windows, the selection of the filters to be cleared...................................................................................... 9-31
Displays during and after the execution of CLEAR operation................................................................................. 9-31
SETUP list, the VIBRATION UNITS text highlighted (displayed inversely)......................................................... 9-31
VIBRATION UNITS windows with the available positions ................................................................................... 9-31
SETUP list, the WARNINGS text highlighted (displayed inversely) ...................................................................... 9-32
WARNINGS windows; RESULTS NOT SAVED selected .................................................................................... 9-32
Displays with LAST RESULTS NOT SAVE warning ............................................................................................ 9-32
WARNINGS windows; USB DISK FREE SP. selected.......................................................................................... 9-33
WARNINGS windows; MIN FREE SPACE selection............................................................................................ 9-33
xvi
G7 USER MANUAL
Display with USB DISK FREE SPACE warning.....................................................................................................9-33
Effect of mechanical vibration perpendicular to the plane of microphone diaphragm .............................................. C-6
Effect of mechanical vibration parallel to the plane of microphone diaphragm........................................................ C-6
SA 22 Free Field Characteristics............................................................................................................................... C-7
Diffuse field filter implemented in G7 instrument..................................................................................................... C-8
Effect of extension cable for the measurements with Z filter for Uin=1VRMS ............................................................ C-9
Typical free field frequency response of G7 instrument ........................................................................................... C-9
Typical case effect of G7 instrument and compensation filters characteristics ....................................................... C-11
G7 directional response with ACO 7052H and SV 12L for given frequencies ....................................................... C-18
Total directional characteristics of G7 with ACO 7052H microphone and SV 12L preamplifier........................... C-19
TNC connector (external view)............................................................................................................................... C-32
Power supply connector 5.5 / 2.1 mm (external view) ............................................................................................ C-33
RCA Jack - “Cinch” (external view) ....................................................................................................................... C-33
USB socket (external view)..................................................................................................................................... C-35
USB socket (external view)..................................................................................................................................... C-35
Results shown in the first presentation mode of statistical levels .............................................................................. D-6
Results shown in the second presentation mode; the selection of the statistical level ............................................... D-6
Results shown in both presentation modes of statistical levels; the change of the mode........................................... D-6
MENU, FUNCTION and MODE windows; sound mode selection.......................................................................... D-9
INPUT and PROFILE (x) windows; weighting filter selection................................................................................. D-9
Full band frequency characteristics of the Z filter implemented in the instrument.................................................... D-9
Low band frequency characteristics of the Z filter implemented in the instrument................................................. D-10
Frequency characteristics of the A filter implemented in the instrument ................................................................ D-10
Frequency characteristics of the C filter implemented in the instrument................................................................. D-11
SETUP and COMPENSATION FILTER windows; the activation of the FREE FIELD filter.............................. D-12
Frequency characteristics of the FREE FIELD filter implemented in the instrument ............................................. D-12
SETUP and COMPENSATION FILTER windows; the activation of the DIFFUSE FIELD filter ....................... D-12
Frequency characteristics of the DIFFUSE FIELD filter implemented in the instrument ....................................... D-13
SETUP and COMPENSATION FILTER windows; the activation of the OUTDOOR ENVIRONMENTAL
filter ............................................................................................................................................................. D-13
Frequency characteristics of the ENVIRONMENTAL filter implemented in the instrument ................................. D-14
SETUP and COMPENSATION FILTER windows; the activation of the OUTDOOR AIRPORT filter ............... D-14
Frequency characteristics of AIRPORT filter implemented in the instrument ........................................................ D-14
MENU, FUNCTION and MODE windows; vibration mode selection ................................................................... D-14
INPUT and PROFILE (x) windows; weighting filter selection in acceleration measurements ............................... D-15
Characteristics of the HP1 digital filter implemented for the acceleration measurements in the VM ..................... D-15
Characteristics of the HP3 digital filter implemented for the acceleration measurements in the VM ..................... D-16
Characteristics of the HP10 digital filter implemented for the acceleration measurements in the VM ................... D-16
PROFILE(1) windows; the selection of the weighting filter in velocity measurements .......................................... D-17
Characteristics of the Vel1 digital filter implemented for the velocity measurements in the VM ........................... D-17
Characteristics of the Vel3 digital filter implemented for the velocity measurements in the VM ........................... D-17
Characteristics of the Vel10 digital filter implemented for the velocity measurements in the VM ......................... D-18
Characteristics of the VelMF digital filter implemented for the velocity measurements in the VM ....................... D-18
PROFILE(1) windows; the selection of the weighting filter in displacement measurements .................................. D-19
Characteristics of the Dil1 digital filter implemented for the displacement measurements in the VM.................... D-19
Characteristics of the Dil3 digital filter implemented for the displacement measurements in the VM.................... D-20
Characteristics of the Dil10 digital filter implemented for the displacement measurements in the VM.................. D-20
SETUP and ENTER CODE windows; the activation of human vibration option ................................................... D-20
SETUP windows after the successful activation of human vibration option ........................................................... D-20
PROFILE(1) windows; the selection of old weighting filters in human vibration option ....................................... D-21
Characteristics of the W-Bxy digital filter implemented in the instrument in the VM ............................................ D-21
Characteristics of the W-Bz digital filter implemented in the instrument in the VM .............................................. D-21
Characteristics of the H-A digital filter implemented in the instrument in the VM................................................. D-22
Characteristics of the W-Bc digital filter implemented in the instrument in the VM .............................................. D-22
PROFILE(1) windows; the selection of new weighting filters in human vibration option ...................................... D-23
Characteristics of the Wk digital filter implemented in the instrument in the HVM ............................................... D-23
Characteristics of the Wd digital filter implemented in the instrument in the HVM ............................................... D-24
Characteristics of the Wc digital filter implemented in the instrument in the HVM ............................................... D-24
Characteristics of the Wj digital filter implemented in the instrument in the HVM................................................ D-25
xvii
G7 USER MANUAL
_
Characteristics of the Wm digital filter implemented in the instrument in the HVM.............................................. D-25
Characteristics of the Wh digital filter implemented in the instrument in the HVM............................................... D-26
Characteristics of the Wg digital filter implemented in the instrument in the HVM............................................... D-26
Characteristics of the Wb digital filter implemented in the instrument in the HVM............................................... D-27
PROFILE(1) window; the selection of the KB filter .............................................................................................. D-27
Characteristics of the KB digital filter implemented in the instrument in the VM.................................................. D-27
Characteristics of the HP digital filter implemented in the instrument in 1/1 OCTAVE, 1/3 OCTAVE and
FFT analysis ................................................................................................................................................ D-28
Characteristics of the exemplary digital 1/1 OCTAVE filter implemented in the instrument................................. D-28
Characteristics of the exemplary lower digital 1/3 OCTAVE filter implemented in the instrument....................... D-29
Characteristics of the exemplary middle digital 1/3 OCTAVE filter implemented in the instrument..................... D-29
Characteristics of the exemplary upper digital 1/3 OCTAVE filter implemented in the instrument....................... D-29
xviii
G7 USER MANUAL
1 INTRODUCTION
The G7 is digital, Type 1 sound & vibration level meter along with analyser. The instrument
is intended to general acoustic and vibration measurements, environmental monitoring, occupational
health and safety monitoring.
Three acoustic or vibration profiles allow parallel measurements with independently defined filters
and RMS detector time constants. Each profile provides significant number of results (like Leq, LMax,
LMin, LPeak, Spl, SEL in the case of sound measurements or RMS, PEAK, VDV, MTVV in the case
of vibration measurements). Advanced time history logging for each profile provides complete information
about measured signal in non-volatile 32 MB internal memory or external USB Memory Stick and can be
easy downloaded to any PC using the USB interface and SvanPC+ software.
All required weighting filters (e.g.: A, C, Wk, Wc, Wh) including the latest ISO 2631-1&2 standard
are available with this instrument. The RMQ detector enables direct measurement of the Vibration Dose
Value (VDV).
Using computational power of its digital signal processor the G7 instrument can, simultaneously
to the meter mode, perform real time 1/1 OCTAVE or 1/3 OCTAVE analysis including statistical
calculations, acoustic dose measurements, FFT analysis and Reverberation Time measurements.
The time history logging of 1/1 OCTAVE, 1/3 OCTAVE and FFT analysis is provided. The time domain
signal recording on the external USB memory stick is also available as an option.
Fast USB 1.1 interface (12 MHz) creates real time link for the PC "front-end" application
of the G7 instrument. The HOST USB functionality is also available. The USB HOST controller installed in
the instrument enables the user to connect to this meter the USB memory sticks, USB hard disks, USB
printers etc. A PC using the optional interfaces (RS 232 or IrDA) can also remotely control
the instrument. The measurement results can be downloaded to PC using all mentioned above interfaces.
The instrument is powered from four AA standard or rechargeable batteries (i.e. NiMH - separate charger
is required). The powering of the instrument from the External DC power source or the USB interface is
also provided. Robust and lightweight design accomplishes the exceptional features of this new
generation instrument.
1.1 G7 as Sound Level Meter & Analyser
•
noise measurements (SPL, LEQ, SEL, Lden, Ltm3, Ltm5 and statistics) with Type 1
IEC 61672:2002 accuracy in the frequency range 10 Hz ÷ 20 kHz with ACO 7052H microphone
•
parallel IMPULSE, FAST and SLOW detectors for the measurements with A, C or Z filters
•
two measurement ranges 24 dB RMS(A) ÷ 118 dB PEAK (LOW)
and 44 dB RMS(A) ÷ 141 dB PEAK (HIGH)
•
1/1 OCTAVE and 1/3 OCTAVE real time analysis (optional) - 15 filters with centre frequencies
1 Hz ÷16 kHz, Type 1 – IEC 1260 and 45 filters with centre frequencies 0.8 Hz ÷ 20 kHz, Type 1 –
IEC 1260
•
RT 60 mesurements (option)
•
FFT real time analysis - 1920 lines in up to 22.4 kHz band (option)
•
DOSE METER measurements
1-1
G7 USER MANUAL
_
1.2 G7 as Vibration Meter & Analyser
•
General vibration measurements (acceleration, velocity and displacement) and optionally HVM
meeting ISO 8041:2005 and ISO 10816-1 standards in the frequency range depends on the
parameters of the attached accelerometer, i.e. with DYTRAN 3185D general purpose transducer
is equal to 2 Hz ÷ 20 kHz
•
parallel RMS, VDV, MTVV (or MAX), PEAK, PEAK–PEAK measurements
•
Z, HP1, HP3, HP10, KB, Wk, Wd, Wc, Wj, Wm, Wh, Wg, Wb weighting filters
•
1/1 OCTAVE and 1/3 OCTAVE real time analysis (optional) - 15 filters with centre frequencies
1 Hz ÷16 kHz, Type 1 – IEC 1260 and 45 filters with centre frequencies 0.8 Hz ÷ 20 kHz, Type 1 –
IEC 1260
•
optional FFT spectra calculation (1920 lines in real time up to 22.4 kHz with Hanning, rectangle,
flat top or Kaiser-Bessel window and linear averaging) parallel to the VLM operation
1.3 General features of G7
•
Advanced Data Logger including spectra's logging on the USB Memory Stick providing almost
unlimited logging capacity
•
Time domain signal recording (option)
•
Advanced trigger and alarm functions
•
USB 1.1 Host & Client interface (real time PC "front end" application supported)
•
RS 232 and IrDA interfaces (options)
•
Integration time programmable up to 24 h
•
Power supply by four AA rechargeable or standard batteries
•
Hand held, light weight and robust case
•
Easy in use
1.4 Accessories included
• 7052H - prepolarised (polarisation 0 V) ½” microphone with nominal sensitivity 22 mV/Pa
• SV 12L - microphone preamplifier
• SC 16 - USB 1.1 cable
• SC 09A - AC output (Lemo 1 to BNC) cable
• four AA batteries
• SvanPC+ for windows 2000/XP software
1.5 Accessories available
• SA 17A - external battery pack
• SA 22 - windscreen
1-2
G7 USER MANUAL
• SC 26 - extension (3 m) cable TNC (plug) to TNC (socket)
• SV 25 - dosimeter microphone with integrated preamplifier and cable
• SA 43 - carrying case for instrument and accessories
• SA 45 - carrying case for instrument and accessories (waterproof)
• SA 46 - carrying belt-bag for instrument (leather)
• SA 47 - carrying bag for instrument and accessories (fabric material)
• SV 55 - RS 232 option for the instrument
• SV 56 - IrDA interface option
1.6 Software options available
• G7 - Type 1 Sound & Vibration Analyser including 1/1 octave analyser
• G7_2 - 1/3 octave analysis option for the G7
• G7_4 - FFT analysis option for the G7
• G7_5 - RT60 option for G7
• G7_9 - Human Vibration filters option
• G7_10 - Dosimeter option for the G7 (without SV 25 microphone)
• G7_15 - Time domain signal recording (to the USB Flash Disk: *.srt or *.wav format)
Notice: The software options can be purchased in any time as only the introduction
of the special code is required for their activation.
1.7 Current list of G7 options and accessories
The current list of G7 options and accessories are presented below:
G7
Type 1 Sound & Vibration Analyser including 1/1 octave analyser
G7_2
1/3 octave analysis option for the G7
G7_4
FFT analysis option for the G7
G7_5
RT60 option for G7
G7_9
Human Vibration filters option
G7_10
Dosimeter option for the G7 (without SV 25 microphone)
G7_15
Time domain signal recording (to the USB Flash Disk: *.srt or *.wav format)
SV 55
RS232 interface option
SV 56
IrDA interface option
SA 22
Windscreen for 1/2" microphone
1-3
G7 USER MANUAL
SA 43
Carrying case for instrument and accessories
SA 45
Carrying case for instrument and accessories (waterproof)
SA 46
Carrying belt-bag for instrument (leather)
SA 47
Carrying bag for instrument and accessories (fabric material)
_
G7 - accessories included:
7052H prepolarised microphone, SV 12L preamplifier, SC 16 cable, SC 09A cable,
SA 22 windscreen, SvanPC for Windows 2000/XP software
1-4
G7 USER MANUAL
2 MANUAL CONTROL OF THE INSTRUMENT
The control of the instrument is developed in the fully conversational way. The user can operate
the instrument by selecting the proper position from the MENU list. Thanks to that, the number
of the control push-buttons of the instrument is reduced to nine.
2.1
Control push-buttons on the front panel
On the front panel of the instrument, there are located the following control push-buttons:
1. <ENTER>, (<MENU>), [<SAVE>],
2. <ESC>, (<CAL>), [<PAUSE>],
3. <SHIFT>, [Markers]
4. <ALT>, [Markers]
5. <
>,
6. <
>,
7. <
>,
8. <
>,
9. <START / STOP>.
The name given in (...) brackets denotes the second push-button function which is available
after pressing it in conjunction (or in sequence) with the <SHIFT> push-button. For the first two pushbuttons the name given in square brackets […] denotes also the third push-button function which
is available after pressing it in conjunction (or in sequence) with the <ALT> push-button.
Control push-buttons of the G7 instrument
<SHIFT>
The second function of a push-button (written in red colour on a push-button) can be used when
the <SHIFT> push-button is pressed. This push-button can be used in two different ways:
•
as SHIFT in the keyboard (e.g. while typing the filename); both <SHIFT> and the second pushbutton must be pressed in parallel;
•
as 2nd Fun; this push-button can be pressed and released before pressing the second one or
pressed in parallel (while operating in “2nd Fun” mode, see the following notice) with
the second push-button.
2-1
G7 USER MANUAL
_
The <SHIFT> push-button pressed in conjunction with the <ALT> one enables the user to enter
the Markers on the plots during the measurement.
Notice: The operation of this push-button can be set as the “Shift” mode or the “2nd Fun.”
mode in the SHIFT position (path: MENU / SETUP /SHIFT MODE / SHIFT) - see description
of the SETUP list.
<ALT>
This push-button enables one to choose the third push-button function in case of [<SAVE>] and
[<PAUSE>] push-buttons. In order to select the third function the user must press the <ALT> and
the second push-button simultaneously.
The <ALT> push-button pressed together with the <SHIFT> one enables the user to enter
the Markers on the plots during the measurement.
Notice: The simultaneous pressing of the <ALT> and <START / STOP> push-buttons
switches the instrument on and off.
<START / STOP>
This push-button enables one to start the measurement process, when the instrument is not
measuring or to stop it, when the instrument is in course of the measurement. It is also possible to set
such mode of this push-button, in which in order to start or stop the measurements the user has to press
it simultaneously with the <SHIFT> one.
Notice: The change of the <START / STOP> push-button mode
in the SHIFT MODE window of the SETUP list (see description of the SETUP list).
is
performed
<ENTER>
This push-button enables one to enter the selected operation mode or to confirm the control
options. Some additional functions of this push-button will be described in the following chapters
of this manual.
(<MENU>)
This push-button (pressed together with the <SHIFT> one) enables the user to enter the main list
containing six sub-lists: FUNCTION, INPUT, DISPLAY, FILE, REPORT and SETUP. Each
of the mentioned above sub-lists consists of the sub-lists, elements and data windows. These main sublists will be described in details in the following chapters of the manual. Double pressed <MENU> pushbutton enters the list containing eight last opened sub-lists. It often speeds up the control of the instrument
as the user has the faster access to the frequently used sub-lists.
2-2
G7 USER MANUAL
[<SAVE>]
This push-button (pressed together with the <ALT> one) enables the user to save measurement
results as a file in the internal instrument’s memory or on the USB memory stick. There are two available
functions: SAVE NEXT - save a file with the name increased by one (e.g. 02JAN0, 02JAN1, 02JAN3) and
SAVE - save a file with the edited name.
<ESC>
This push-button closes the control lists, sub-lists or windows. It acts in opposite to the <ENTER>
push-button. When the window is closed pressing the <ESC> push-button, any changes made in it
are ignored in almost all cases.
([CAL])
This push-button (pressed together with the <SHIFT> one) enters the CALIBRATION sub-list
in which the user can enter one of the available sub-lists (BY SENSITIVITY, BY MEASUREMENT,
LAST CALIBRATION and TEDS).
[<PAUSE>]
This push-button enables one to break the measurement process temporarily. The subsequent
pressing of the <PAUSE> push-button deletes the measurement results from the last one second.
The indicator of the measurement time is counted down after each pressing and the measurement result
from the previous second appears on the display. Up to fifteen last seconds of the measurement
can be cancelled in this way.
<
>, <
>
These push-buttons enable one, in particular, to:
• select the options in an active position in the "horizontal direction" (e.g. filter Z, A or C, Integration
period: 1s, 2s, 3s, … etc.)
• select the measurement result to be displayed (e.g. PEAK, MAX, MIN, etc.) in one profile and
3 PROFILES modes of result’s presentation)
• control the cursor in LOGGER and STATISTICS modes of result’s presentation
• select the position of the character in the text edition (i.e. in the FILE NAME menu)
• switch on/ off the BACKLIGHT of the display (<
> + <
> pressed together)
• activate markers 2 and 3
(<
>, <
>)
The <
>, <
>) push-buttons pressed in conjunction (or in sequence) with the <SHIFT> enable
one, in particular, to:
• speed up the changing of the numerical values of the parameters (i.e. the step is increased
from 1 to 10 in the setting of START DELAY - path: MENU / INPUT / MEASUREMENT SETUP /
START DELAY)
• insert or delete a character in the text edition modes
2-3
G7 USER MANUAL
_
• change the statistical class (the number displayed after the letter L) in one profile and 3 PROFILES
modes of result’s presentation
Some other possible reactions of the instrument on the pressing of these push-buttons
will be described in details in the following chapters.
<
>, <
>
The <
>, <
> push-buttons enable one, in particular, to:
• change the mode of result’s presentation
• select the proper character from the list in the text edition mode
• switch the active sub-list in a list
• programme the Real Time Clock (RTC) and TIMER
• activate markers 1 and 4
Some other possible reactions of the instrument on the pressing of these push-buttons
will be described in details in the following chapters.
(<
>, <
>)
The <
>, <
> push-buttons pressed in conjunction (or in sequence) with the <SHIFT> enable one,
in particular, to:
• change the relation between the Y-axis and X-axis of all plots presented on the screen
• switch the profiles in one profile and STATISTICS modes of result’s presentation
• switch the active profile in 3 PROFILES mode of result’s presentation
Some other possible reactions of the instrument on the pressing of these push-buttons
will be described in details in the following chapters.
[Markers]
The Markers enable the user to mark special events, which occurred during the performed
measurements (i.e. the airplane flight, the dog’s barking, the train’s drive etc.). The logger has to be
switched on (path: MENU / INPUT / MEASUREMENT SETUP / LOGGER On) in order to activate
the markers and one or more logger options (LOGGER PEAK, LOGGER MAX, LOGGER MIN,
LOGGER RMS for sound measurements or LOGGER PEAK, LOGGER P–P, LOGGER MAX,
LOGGER RMS for vibration measurements) in profiles have to be chosen (path: MENU / INPUT /
PROFILE x). In order to enter the marker the user must press <SHIFT> and <ALT> push-buttons
simultaneously during the measurement. The ENTER MARKER window opens and there are four
available marker numbers. To choose marker number 1 the user must press <
> push button (number 2
- <
>, number - 3 <
> and number 4 - <
>).
The ENTER MARKER window closes automatically and chosen marker is activated (after pressing
<SHIFT> + <ALT> again active marker number will be highlighted). In order to switch off the marker,
the user has to open the ENTER MARKER window and press this push-button, which refers to the marker
to be switched off.
The current state of the markers is indicated in the logger’s file (cf. App. B for details) and can be
used to show them using dedicated presentation software.
2-4
G7 USER MANUAL
Display with the “MARKERS” (after pressing <ALT> and <SHIFT> together)
Displays with the activated markers
The exemplary presentation of the markers on the time history plot is shown below (to view a plot
with markers the user has to transfer data to the proper software).
80
70
60
50
Leq
Marker 1
40
Marker 2
Marker 3
30
Marker 4
20
13:30:00 13:30:09 13:30:17 13:30:26 13:30:35 13:30:43 13:30:52
Time history plot with the indication of the active markers
2-5
G7 USER MANUAL
2.2
_
Input and output sockets of the instrument
The measurement input, called Input is placed in the centre of the instrument’s top cover. It is TNC
socket. The microphone preamplifier SV 12L has the proper plug in with the screw. The accelerometers
have to be connected to the instrument using also the TNC connector. After plug in the preamplifier or
the accelerometer to the measurement input, the screw should be twisted to the light resistance. The full
description of the signals connected to the sockets is given in the Appendix C.
Top cover of the G7 instrument in 1:1 scale
In the bottom cover there are four sockets, placed from the right to the left as follows: Ext. Pow.,
USB Host, USB Device (USB Client) and Ext. I/O.
Bottom cover of the G7 instrument in 1:1 scale
The USB Device 1.1 interface is the serial interface working with 12 MHz clock. Thanks to its
speed, it is widely used in all PC. In the instrument, the standard 4-pins socket is used described in details
in Appendix C.
The USB Host interface can be used to connect the external USB Memory Stick or USB hard disk,
enabling the device to register virtually infinite sequence of measurement results.
The additional multi purpose input / output socket, called Ext. I/O, is a RCA Jack (“Cinch”) socket.
On this socket, in the case when the Analogue Output functionality is selected, the signal from the input
of the analogue / digital converter (before the correction) is available. This signal can be registered using
magnetic recorder or observed on the oscilloscope. The Digital Input as another functionality serves
as the external trigger, while the Digital Output is used to generate the trigger pulse or alarm pulse
from the instrument.
To the Ext. Pow. socket located on the bottom cover of the instrument, dedicated for the connector
type 5.5 / 2.1 mm, the user can connect the external power (110 V / 220 V mains) adapter.
The instrument can be charged from the external DC source (from 6 V to 15 V). The current consumption
depends on the voltage of the power supplier.
Notice: Switch the power off before connecting the instrument to any other device
(e.g. a printer or a Personal Computer).
2-6
G7 USER MANUAL
Front panel of the G7 instrument in 1:1 scale
2-7
G7 USER MANUAL
_
Rear panel of the G7 instrument in 1:1 scale
2-8
G7 USER MANUAL
3 SETTING THE INSTRUMENT
In order to perform the measurements using the instrument the user has only to plug-in
the preamplifier with the microphone or the proper transducer and to switch the power on.
Notice: The user has to press the <ALT> and <START / STOP> push-buttons
in parallel in order to switch the power On/Off.
3.1 Basis of the instrument’s control
The instrument is controlled by means of nine push-buttons of the keyboard. Using these pushbuttons one can access all available functions. The functions are placed in the system of lists and sublists. The main list contains the headers of six lists, which also contain sub-lists or positions (elements).
The main list is opened after pressing the <MENU> push-button. This list contains the following lists:
FUNCTION, INPUT, DISPLAY, FILE, REPORT and SETUP. The elements of each list are described
in details in Chapters 4 ÷ 9. Only one list can be accessed at a time, the one which name is highlighted
(displayed inversely). The change of the highlighted line is done after pressing the <
>, <
> (or <
>,
<
>) push-buttons.
Notice: The number of the attempts for the access code entering is limited. After three
unsuccessful essays, the possibility is blocked.
Displays with the highlighted elements of the main list
After double pressing of the <MENU> push-button the scrolled list of recently accessed menu items
appears on the display. The example of this list is presented below. Such solution enables one
to access the most frequently used lists quickly, without the necessity of passing the whole path.
Display with the recently accessed menu items (after double pressing of the <MENU> push-button)
3-1
G7 USER MANUAL
_
After the selection of the desired list (the <
> or <
> push-buttons), the user has to press
the <ENTER> push-button in order to enter it. After this new sub-lists, positions (elements) or various data
specification appear on the display.
b)
a)
Displays with the main list (a) and the elements of the INPUT list (b)
Next pressing of the <ENTER> push-button enables one to access mentioned above sub-lists.
MEASUREMENT SETUP window opened (path: MENU / INPUT / MEASUREMENT SETUP)
The desired position of a list is accessed after pressing the <
> or <
> push-button.
MEASUREMENT SETUP window; the INTEGR. PERIOD position accessible
The change of the value in a selected position is performed by pressing the <
> or <
> pushbuttons.
Displays with the accessed INTEGR. PERIOD position after pressing the <> or <> push-buttons,
respectively
The <ENTER> push-button is used for the confirmation of the selection in a position and
for closing the opened sub-list. The sub-list is closed ignoring any changes made in a sub-list by pressing
the <ESC> push-button.
Displays after three consecutive pressing of the <ESC> push-button from the MEASUR. SETUP sub-list
As it was mentioned, some of the sub-lists end with the windows informing the user about the state
of the instrument, available memory, not existing files or loggers, standards fulfilled by the unit, etc.
In order to close such window the user has to press the <ESC> push-button.
3-2
G7 USER MANUAL
Displays during and after the accessing the FREE SPACE window (path: MENU / FILE / FREE SPACE)
In the instrument, there are also windows, which are used for entering text (i.e. the name of the file,
the header for the printed reports from the measurements).
Displays during the edition of the text, which has to be printed as a header in the measurement reports
(path: MENU / REPORT / TITLE)
Below the structure of the elements of the main list is presented. The more detailed description
of the FUNCTION, INPUT, DISPLAY, FILE, REPORT and SETUP lists is given in the following chapters.
FUNCTION (one of the main lists available after pressing the <MENU> push-button)
MODE
VIBRATION METER; available values: [ ] / [*]
SOUND METER; available values: [ ] / [*]
MEASUREMENT FUNCTION (sub-list)
LEVEL METER; available values: [ ] / [*]
1/1 OCTAVE; available values: [ ] / [*]
1/3 OCTAVE; available values: [ ] / [*]
FFT; available values: [ ] / [*]
RT60; (function available only in sound meter mode) available values: [ ] / [*]
DOSE METER; (function available only in sound meter mode) available values: [ ] / [*]
CALIBRATION (sub-list)
BY SENSITIVITY
• SENSITIVITY; available values of sensitivity in mV/Pa:
2
2
o 10 µV / ms- .. 10 V / ms- (in the case of vibration measurements) and
o 50 µV/Pa .. 50 V/Pa (in the case of sound measurements)
• CAL. FACTOR; it displays calculated calibration factor
BY MEASUREMENT (sub-list)
• CAL. LEVEL; available values of calibration level:
2
2
o 100 mm / s .. 1 km / s in the case of vibration measurements(or 100 dB .. 180 dB if
2
the reference level was set to 1 µm / s and the LOGARITHM scale was selected in
the DISPLAY SCALE sub-list)
o 54 dB .. 134 dB in the case of sound measurements
• CAL. FACTOR; it displays calculated calibration factor after the measurement
LAST CALIBRATION; it enables the user to view the last calibration records
TEDS - automatical reading of the transducer parameters by the instrument, this function will
be available soon, NO DATA AVAILABLE message appears on the display
3-3
G7 USER MANUAL
_
Control diagram of the FUNCTION list
INPUT (one of the main lists available after pressing the <MENU> push-button)
3-4
MEASUREMENT SETUP (sub-list)
START DELAY; available values of the delay before starting the execution of the
measurements: 1s .. 60s
INTEGR. PERIOD; available values of the integration time: Inf, 1s .. 24h
REP. CYCLE; available values for the measurement cycles, which has to be repeated: Inf,
1 .. 1000
LOGGER off/ on; saving measurement results in instrument’s logger memory
• LOGGER STEP; available values of the step with which the measurement results
are saved in an instrument’s logger: 2 ms .. 1 h
• LOGGER NAME; editing the name of the logger’s file
MEASUREMENT RANGE; range of the sound or vibration level measurements
LOW
2
2
2
2
• RMS (HP): 1.41 mm/s ÷ 100 m/s , PEAK: 31.6 mm/s ÷ 141 m/s in the case of
vibration measurements
• RMS (A): 25.0 dB ÷ 126.6 dB, PEAK: 59.0 dB ÷ 129.6 dB (sound measurements)
HIGH
G7 USER MANUAL
•
•
2
2
2
2
RMS (HP): 10 mm/s ÷ 708 m/s , PEAK: 316 mm/s ÷ 1 km/s in the case of vibration
measurements
RMS (A): 36.0 dB ÷ 143.6 dB, PEAK: 72.0 dB ÷ 146.6 dB (sound measurements)
DOSIMETER SETUP (sub-list) (in DOSE METER mode, path: MENU / FUNCTION /
MEASUREMENT FUNCTION / DOSE METER)
CRITERION LEVEL; available values of the permitted steady state noise level: 80 dB, 84 dB,
85 dB, 90 dB
THRESHOLD LEVEL; available values of the noise threshold: None, 75 dB, 80 dB, 85 dB,
90 dB
EXCHANGE RANGE; available values of the exchange range (the amount by which
the permitted noise level may increase if the exposure time is halved) 2 dB .. 5 dB
PROFILE 1 (sub-list)
FILTER; available digital weighting filters used in the first profile during the measurements:
o Z, HP1, HP3, HP10, Vel1, Vel3, Vel10, VelMF, Dil1, Dil3, Dil10, KB, Wk, Wd, Wc,
Wj, Wm, Wh, Wg, Wb; available filters in vibration measurements
o Z, A, C; available filters in sound measurements
DETECTOR; available values of the detector time constant used in the first profile:
o 100ms, 125ms, 200ms, 500ms, 1.0s, 2.0s, 5.0s, 10.0s; available detector time
constant in vibration measurements
o IMP., FAST, SLOW; available detector time constant in sound measurements
LOGGER; available measurement results which has to be saved in the instrument’s logger
from the first profile (setting possible only when LOGGER is switched on (path: MENU /
INPUT / MEASUREMENT SETUP / LOGGER On)
o PEAK, P–P, MAX, RMS in the case of vibration measurements
o PEAK, MAX, MIN, RMS in the case of sound measurements
PROFILE 2 (sub-list)
FILTER; available digital weighting filters used in the second profile during
the measurements:
o Z, HP1, HP3, HP10, Vel1, Vel3, Vel10, VelMF, Dil1, Dil3, Dil10, KB, Wk, Wd, Wc,
Wj, Wm, Wh, Wg, Wb; available filters in vibration measurements
o Z, A, C; available filters in sound measurements
DETECTOR; available values of the detector time constant used in the second profile:
o 100ms, 125ms, 200ms, 500ms, 1.0s, 2.0s, 5.0s, 10.0s; available detector time
constant in vibration measurements
o IMP., FAST, SLOW; available detector time constant in sound measurements
LOGGER; available measurement results which has to be saved in the instrument’s logger
from the second profile
o PEAK, P–P, MAX, RMS in the case of vibration measurements
o PEAK, MAX, MIN, RMS in the case of sound measurements
PROFILE 3 (sub-list)
FILTER; available digital weighting filters used in the third profile during the measurements:
o Z, HP1, HP3, HP10, Vel1, Vel3, Vel10, VelMF, Dil1, Dil3, Dil10, KB, Wk, Wd, Wc,
Wj, Wm, Wh, Wg, Wb; available filters in vibration measurements
o Z, A, C; available filters in sound measurements
DETECTOR; available values of the detector time constant used in the third profile:
o 100ms, 125ms, 200ms, 500ms, 1.0s, 2.0s, 5.0s, 10.0s; available detector time
constant in vibration measurements
o IMP., FAST, SLOW; available detector time constant in sound measurements
LOGGER; available measurement results which has to be saved in the instrument’s logger
from the third profile
3-5
G7 USER MANUAL
_
o PEAK, P–P, MAX, RMS in the case of vibration measurements
o PEAK, MAX, MIN, RMS in the case of sound measurements
SPECTRUM (sub-list); this sub-list is not available in the case of the SLM or VLM; it appears on
the display in the case of 1/1 OCTAVE or 1/3 OCTAVE analyser
3-6
FILTER (position); available types of the digital weighting filter used during 1/1 OCTAVE
or 1/3 OCTAVE analysis:
o Z - in the case of vibration measurements and
o Z, A, C - in the case of sound measurements
•
BAND:
o FULL - in the case of vibration measurements and
o FULL, AUDIO in the case of sound measurements
•
LOGGER (position); it enables the user to save RMS results from 1/1 OCTAVE or
1/3 OCTAVE measurement function; available values: [ ] or [√
√]
FFT (sub-list) this sub-list appears on the display in the case of the FFT analyser
•
AVERAGING (position); it informs the user about the available averaging during FFT analysis:
•
LINEAR - in the case of vibration measurements
•
LINEAR, EXPON. - in the case of sound measurements
FILTER (position); available types of the digital weighting filter used during FFT analysis:
o Z - in the case of vibration measurements and
o Z, A, C - in the case of sound measurements
BAND (position); available values of the bands of the FFT analysis: 87.5Hz, 175Hz, 350Hz,
700Hz, 1.4kHz, 2.8kHz, 5.6kHz, 11.2kHz, 22.4kHz
WINDOW (position), it informs the user about the available coefficients of time window:
HANNING, RECTANGLE, FLAT TOP, KAISER-BESSEL
LINES; available values: 480, 960, 1920
LOGGER; available values: [ ] or [√
√]
TRIGGER SETUP (sub-list) (in LEVEL METER
MEASUREMENT FUNCTION / LEVEL METER)
mode,
path:
MENU
/
FUNCTION
/
MEASURE TRIGGER; it enables the user to switch on or off the triggering
o TRIGGER; available options: SLOPE+, SLOPE–, LEVEL+, LEVEL–, GRAD+
o SOURCE; available sources are RMS (1) and EXT. I/O (for SLOPE)
o LEVEL; available values 24 .. 136 dB
LOGGER TRIGGER; it enables the user to switch on or off the triggering in logger
o TRIGGER; available values LEVEL+, LEVEL–
o SOURCE: RMS (1)
o LEVEL; available values 24 .. 136 dB
o PRE; available values 0 .. 50, (for LOGGER STEP equal to 100 ms => 0.0 .. 5.0 s)
o POST; available values 0 .. 200, (for LOGGER STEP equal to 100 ms => 0.0 .. 20.0 s)
RECORDER TRIGGER; it enables the user to switch on or off the trigger of recording
o TRIGGER; available options: SLOPE+, SLOPE–, LEVEL+, LEVEL–, GRAD+
o SOURCE; available sources are RMS (1) and EXT. I/O (for SLOPE)
2
2
o LEVEL; available values 24 .. 136 dB, 1 mm / s .. 10 km / s
o GRADIENT (for GRAD+); available values 1 dB / ms .. 100 dB / ms
G7 USER MANUAL
Control diagram of the INPUT list in the 1/1 OCTAVE and 1/3 OCTAVE mode
Control diagram of the INPUT list in the DOSE METER mode
Control diagram of the INPUT list in the FFT mode
3-7
G7 USER MANUAL
_
Control diagram of the INPUT list in the LEVEL METER mode
3-8
G7 USER MANUAL
DISPLAY (one of the main lists available after pressing the <MENU> push-button)
DISPLAY MODES (sub-list); it enables the user to activate ([√
√]) or switch off ([ ]) the available
modes of result’s presentation
SPECTRUM; available values: [√
√] or [ ]; this position is active only for 1/1 OCTAVE,
1/3 OCTAVE and FFT mode
3 PROFILES; available values: [√
√] or [ ]
STATISTICS; available values: [√
√] or [ ]
LOGGER; available values: [√
√] or [ ]
FILE INFO; available values: [√
√] or [ ]
DISPLAY SETUP (sub-list)
DISPLAY SCALE
•
SCALE; available values:
o LIN, LOG in the case of vibration measurements
o LOG in the case of sound measurements
•
DYNAMIC; available values of the dynamics of graphical modes of the result’s
presentation: 80dB, 40dB, 20dB, 10dB
•
X-ZOOM; it informs the user about the multiplier for the horizontal axis of the graphical
modes of the result’s presentation; available values: 1x, 2x, 3x, 4x, 5x
•
GRID; available values [ ] or [√
√]
•
AUTOSCALE; available values [ ] or [√
√]
SPECTRUM VIEW (in the case of 1/1 OCTAVE, 1/3 OCTAVE or FFT analysis)
•
VIEW; available spectrum views: NORMAL, FULL, EXTENDED
•
TYPE available types of spectrum views: AVERAGED, INSTANTANEOUS, MAX, MIN
•
MAX; position is accessible if in TYPE position AVERAGED or INSTANTANEOUS were
selected; available values: [ ] or [√
√]
•
MIN; position is accessible if in TYPE position AVERAGED or INSTANTANEOUS were
selected; available values [ ] or [√
√]
SPECTRUM TYPE;available spectrum types (in the case of vibration only: ACCELERATION,
VELOCITY, DISPLACEMENT
TOTAL VALUES (in the case of 1/1 OCTAVE or 1/3 OCTAVE vibration analysis)
•
TOTAL 1; available positions in the case of vibration measurements:
o FILTER; available values: Z, S1, S2, S3
o TYPE; it appears when FILTER different than Z; available values: ACC, VEL, DIL
o CAL. F. ; it appears as above; available values: –60 dB, .., 60 dB
•
TOTAL 2; available positions:
o FILTER; available values: PR 2, S1, S2, S3
o TYPE; it appears when FILTER different than PR 2; available values: ACC, VEL, DIL
o CAL. F.; it appears as above; available values: –60 dB, .., 60 dB
•
TOTAL 3; available positions:
o FILTER; available values: PR 3, S1, S2, S3
o TYPE; it appears when FILTER different than PR 3; available values: ACC, VEL, DIL
o CAL. F.; it appears as above; available values: –60 dB, .., 60 dB
TOTAL VALUES (in the case of 1/1 OCTAVE or 1/3 OCTAVE sound analysis)
•
TOTAL 1; available values: A, S1, S2, S3
•
TOTAL 2; available values: C, S1, S2, S3
3-9
G7 USER MANUAL
•
_
TOTAL 3; available values: Z, S1, S2, S3
LOGGER VIEW;
•
VIEW; available logger views: NORMAL, FULL, EXTENDED
•
TIME; available time settings for logger: REAL TIME, AVAILABLE TIME
LOGGER VIEW (sub-list)
FILE NO.; number of the files in the instrument’s logger containing the results
of the measurements
LOG. FILE; name of the viewed logger’s file
RECORDS; number of records in the viewed logger’s file
P(1); settings for logger in PROFILE 1 (INPUT list), available values PEAK, MAX, MIN, RMS
(in the case of sound measurements) or PEAK, P–P, MAX, RMS (in the case of vibration
measurements)
P(2); settings for logger in PROFILE 2 (INPUT list), available values PEAK, MAX, MIN, RMS
or PEAK, P–P, MAX, RMS
P(3); settings for logger in PROFILE 3 (INPUT list), available values PEAK, MAX, MIN, RMS
or PEAK, P–P, MAX, RMS
FREE; it informs the user about the size of remaining free memory for logger files
AVAILABLE; it informs the user about the size of the available memory for logger files
SCREEN SETUP (sub-list)
CONTRAST; it enables the user to select one from twenty one possibilities of the contrast
level of the instrument’s display
BACKLIGHT TIMEOUT, available values [√
√] or [ ]; if [√
√] is chosen it will cause the self-made
backlight switching off in the case when the keyboard is not used during the last 30 seconds.
If it happened the first pressing of any push-button switches the backlight on
BATTERY; it informs the user about the source of powering of the instrument and current power
supply voltage; available sources: BATTERY, USB POWER and EXTERNAL POWER
UNIT LABEL; it informs the user about the type of the instrument, the serial number of the unit,
the internal memory size, available measurement modes and it’s software version and
the standards which the instrument fulfils
Control diagram of the DISPLAY SETUP list in 1/1 OCTAVE and 1/3 OCTAVE analysis of sound
3-10
G7 USER MANUAL
Control diagram of the DISPLAY SETUP list in 1/1 OCTAVE and 1/3 OCTAVE analysis of vibration
3-11
G7 USER MANUAL
_
Control diagram of the DISPLAY list
3-12
G7 USER MANUAL
FILE (one of the main lists available after pressing the <MENU> push-button)
SAVE: [name of the file]; available values: SAVE NEXT, SAVE
SAVE NEXT option simplifies the way of saving the file, the file name is generated
automatically, basing on the date set in the instrument or on the last name given for the file,
next result is saved as a file with the name increased by one (e.g. 11JAN0, 11JAN1, 11JAN2)
In the SAVE option the name of the file can be fully edited in the FILE NAME window
after pressing the <
> push-button. The cursor is moved with <
>, <
> push-buttons.
The current character is changed with <SHIFT>+<
>, <SHIFT>+<
> push-buttons.
The combination <SHIFT>+<
> deletes the character currently pointed by the cursor
The combination <SHIFT>+<
> inserts a new character in the position of the cursor
No results! text will be displayed if the instrument did not perform any measurement in prior
to choosing the SAVE option
SAVE OPTIONS (sub-list)
RAM FILE; (only in LEVEL METER mode) gives the user a possibility to save data in RAM
file. Each time the data are saved, the previous file is overwritten, available values [√
√] or [ ]
REPLACE; it enables the user to replace the existing files in the instrument’s memory
by the files having the same name; available values: [√
√] or [ ]
SAVE STATISTICS; it enables the user to save or not the calculated statistics along with
the measurement results; available values: [√
√] or [ ]
AUTO SAVE; it enables the user to save the measurement results in the instrument’s
memory automatically without entering SAVE or SAVE NEXT position (in order to perform this
operation the INT. PERIOD should be set to at least 10 s); available values: [√
√] or [ ]
DIRECT SAVE; this option enables saving the results with the automatically incremented
name after pressing the <ENTER> and <ALT> push-buttons together
SAVE MAX SPECT.; it enables the user to save the maximal values of the spectrum occurred
during the performed analysis; available values: [√
√] or [ ]
SAVE MIN SPECT.; it enables the user to save the minimal values of the spectrum occurred
during the performed analysis; available values: [√
√] or [ ]
LOAD; enables one to load to the working space of the instrument’s memory the measurement
results saved in a file; the NO FILES text is displayed in the case when the instrument’s memory
is empty
DELETE; it enables the user to verify the list of files in the memory and to delete the selected one
from RESULT FILES, LOGGER FILES, SETUP FILES lists; the NO FILES text is displayed in the
case when the instrument’s memory is empty
DELETE ALL; it enables the user to delete all files saved in the instrument’s memory; user can
choose to delete either RESULT FILES, LOGGER FILES or SETUP FILES; the confirmation
is required before the erasing of all files: „Are you sure?”
DEFRAGMENTATION;(sub list)
FILES DEFRAGMENT.; it enables the user to recover the memory, which was previously
used by the deleted files; the confirmation is required before the execution of this operation:
“Are you sure?”
LOGGER DEFRAGMENT.; it enables the user to recover the memory, which was previously
used by the deleted logger files; the confirmation is required before the execution
of this operation: “Are you sure?”
3-13
G7 USER MANUAL
_
The text DEFRAGMENTATION .. unnecessary PRESS ANY KEY is displayed when the
instrument’s memory was empty before trial of the defragmentation or when there were
no deleted files
CATALOGUE; it enables the user to verify the list of files in the memory; the NO FILES text
is displayed in the case when the instrument’s memory is empty
FREE SPACE; it informs the user about the size of the available memory for saving
the measurement results in the file (FILES FREE SPACE), the TOTAL AVAILABLE bytes
of the memory (the number displayed in the FILES FREE SPACE increased by the memory which
was previously used by the deleting files), the next two numbers given
in the FREE SPACE window, named LOGGER FREE SPACE and LOGGER AVAILABLE
characterize the logger files memory in the same way
SAVE SETUP; saves the current settings of the instrument; with <
>, <
> push-buttons one can
choose between two modes: SAVE NEXT and SAVE. These are similar to the options available
while saving result files. The SAVE mode enables to choose the file name manually.
In the SAVE NEXT mode the file name will be set automatically
LOAD SETUP; it enables the user to verify the list of setup files in the memory and to load
the previously saved settings of the instrument; the NO FILES text is displayed in the case when
there is no setup files
3-14
G7 USER MANUAL
Control diagram of the FILE list
REPORT (one of the main lists available after pressing the <MENU> push-button, to use option
from this list the instrument has to be connected to RS232 or to a PC connected to a printer)
TITLE; it enables the user to give the header to the printed report
PRINT RESULTS; it enables the user to print measurement results on the attached printer,
the No results text is displayed in the case when there is no results to be printed
PRINT STATISTICS; it enables the user to print the results of the statistical analysis,
the No results text is displayed in the case when there is no results to be printed
PRINT FILE, it enables the user to print out on a printer connected directly to the instrument the
selected file with the measurement results; the NO FILES text is displayed in the case when the
file memory is empty
PRINT LOGGER; it enables the user to print out on a printer connected directly to the
instrument the measurement results in a selected file from the logger; the NO LOGGERS text is
displayed in the case when the instrument did not perform any measurement and the logger is
empty; this function is currently under development and FUNCTION NOT AVAILABLE message
appears on the display
PRINT USER FILTERS; it enables the user to print out on a printer connected directly to the
instrument the values of the user filters introduced in the instrument: S1, S2, S3
PRINT CATALOGUE; it enables the user to print the catalogue of the files stored
in the instrument’s memory
OPTIONS
FORMAT; available values: A4, A5
EJECT P.; available values: None, Prompt, Auto
3-15
G7 USER MANUAL
_
Control diagram of the REPORT list
3-16
G7 USER MANUAL
SETUP (one of the main lists available after pressing the <MENU> push-button)
LANGUAGE; it allow the user to choose the instrument’s interface language; available values:
GERMAN, ENGLISH, SPANISH, ITALIAN, FLEMISH, FRENCH, HUNGARIAN, POLISH,
RUSSIAN, TURKISH
CLEAR SETUP; it enables the user to return to the factory settings of the instrument;
the confirmation has to be done before the execution of this function
Are you sure?
COMPENSATION FILTER (sublist available in sound mode); available values
Off; it enables the user to switch off the internal noise compensation which should be used in
a case of the electrical investigation of the measurement channel; available values: [ * ] or [ ]
FREE FIELD; it enables the user to switch on the compensation filter which should be used in
a case of the measurements performed in the free field using SA 22 windscreen; available
values: [ * ] or [ ]
DIFFUSE FIELD; it enables the user to switch on the compensation filter which should be
used in a case of the measurements performed in the diffuse field; available values: [ * ] or [ ]
OUTDOOR ENVIRONMENTAL; it enables the user to switch on the compensation filter
which should be used in a case of the measurements of the community noise performed in
the outdoor monitoring station using SA 201A protection; available values: [ * ] or [ ]
OUTDOOR AIRPORT; ; it enables the user to switch on the compensation filter which should
be used in a case of the measurements of the airport noise performed in the outdoor
monitoring station; available values: [ * ] or [ ]
EXTENSION CABLE; it enables the user to switch off all compensation filters, except
the internal noise, which should be done in a case of the measurements performed with the
usage of the extension cable; available values: [ * ] or [ ]
DAY TIME LIMITS (window which is available only for sound measurements); specifies the time
limits for the instrument to operate in the DOSE METER mode with the full 8h working time
assumed; available values: 8h–16h, 9h–17h
EXPOSURE TIME (window which is available only in sound mode); available values: 1 s .. 8 h
EXTERNAL I/O SETUP
MODE;
• ANALOG OUT
• DIGITAL IN;
FUNCTION: EXT. TRIGGER
• DIGITAL OUT;
FUNCTION:
- TRIG. PULSE (POLARISATION: POS. / NEG.)
- ALARM PULSE (ACTIVE LEVEL: LOW / HIGH, SOURCE: PEAK(1), SPL(1),
LEQ(1), ALARM LEVEL available values: 30.0 dB .. 140 dB)
IEPE CURRENT; it enables the user to select current IEPE supply, available values: 1.5 mA or
4.5 mA
REFERENCE LEVELS:
in the case of vibration measurements:
• ACC: - it enables the user to set the reference level of the acceleration for the logarithmic
2
scale (the results expressed in dB - decibels), available levels are from 1 µm/s to
2
100 µm/s
• VEL: - it enables the user to set the reference level of the velocity for the logarithmic scale
(the results expressed in dB - decibels), available levels are from 1 nm/s to 100 nm/s
• DIL: - it enables the user to set the reference level of the displacement for the logarithmic
scale (the results expressed in dB - decibels), available levels are from 1 pm to 100 pm
in the case of sound measurements: 20 µPa
REMOTE COMMUNICATION
TYPE; available values: OFF, CONTINUOUS, PACKET
PACKET; available values: 64 .. 1024
RMS INTEGRATION
3-17
G7 USER MANUAL
_
RMS INTEGRATION; available values of detector’s type: LINEAR or EXPONENTIAL
RS232;
BAUD RATE; it enables the user to set the baud rate: 1200, 2400, 4800, 9600, 19200, 38400,
57600, 115200
TIME OUT; it enables the user to set the time out: 1 s .. 60 s
RTC
RTC; it enables the user to set the internal real time clock and date of the instrument
RT60 AVERAGING
AVERAGING; available values On or Off
AVERAGING CLEAR; available values NO or YES
AVERAGING NO.; set during the execution of the option
RT60 OPTIONS
SMOOTHING; available values: 0, 1, .., 15
NOISE MAR.: 0.0 dB .. 20.0 dB
RT60 RESULTS; the results of the RT60 given in the table with EDT (E), T20 (2) and/or T30 (3)
31.5Hz [E]/[ ] [2]/[ ] [3]/[ ]
…
10.0kHz [E]/[ ] [2]/[ ] [3]/[ ]
SHIFT MODE
SHIFT; available modes of the <SHIFT> push-button: Shift or 2nd Fun.
ST/SP; available modes of the <START / STOP> push-button: Normal or Inverse
STATISTICAL LEVELS (sub-list which has is available only in sound mode); available levels N=1,
10, 20, ....... 90
TIMER (sub-list); it enables the user to set time of the self switching on of the instrument
MODE; specifies the mode of automatic power on; available values:
• Off
• SINGLE; (START DAY; specifies the date of automatic power on; START HOUR;
specifies the time of automatic power on)
• REGULAR; (START DAY; specifies the date of automatic power on; START HOUR;
specifies the time of automatic power on, REPETITION; specifies time after which next
automatic measurement will be executed)
• IRREGULAR; (START DAY; specifies the date of automatic power on; TIMEx; enables
the user to specify four times of automatic measurements)
USB–HOST PORT; it enables the user to choose with [*] proper functionality of USB–HOST
socket for connection of the instrument to RS232, USB IRDA, USB DISK, SRT RECORDING,
WAVE RECORDING, EVENT RECORDING
USER FILTERS; it enables the user to introduce the coefficients of the filters
SPECTRUM BASED FILTER
• VIEW it enables the user to select which filter used in 1/1 OCTAVE or 1/3 OCTAVE
analysis should be viewed; the available options are S1, S2, S3 and any other transmitted
to the instrument from a PC by means of the interface
• EDIT it enables the user to select which filters used in 1/1 OCTAVE or 1/3 OCTAVE
analysis should be edited; the available options are as follows: S1, S2, S3 or any other
transmitted to the instrument from a PC by means of the interface
After pressing the <ENTER> push-button the Sx (S1, S2, S3) sub-list is opened
containing the values of the filters; the user can set the values of correcting coefficients
for all 1/3 OCTAVE filters:
0.80 Hz: available values of 0.8 Hz centre frequency filter: -100.0dB .. 100.0dB
...
…
20.0 kHz: available values of 20 kHz centre frequency filter: -100.0dB .. 100.0dB
3-18
G7 USER MANUAL
•
CLEAR, enables the user to select which filters should be cleared; the available options
are as follows: ALL, S1, S2, S3 or any other
VIBRATION UNITS (sub-list which is available only in vibration mode)
2
METRIC (e.g. m/s , m/s, m) (position); available values: [ ] / [*]
NON-METRIC (e.g. g, ips, mil) (position); available values: [ ] / [*]
WARNINGS
RESULTS NOT SAVE; it enables the user to switch on or off the warning that the results
of the measurement were not saved in the memory; available values: [√
√] or [ ]
USB DISK FREE SP.; it enables to generate a warning after checking free space on the USB
disk
MIN FREE SPACE; specifies the limit of available memory for warning; if the available
memory is not greater than that limit the warning will be displayed; available values: 1 MB ..
1024 MB
Control diagram of the SETUP list in the RT60 mode
3-19
G7 USER MANUAL
3-20
_
G7 USER MANUAL
3-21
G7 USER MANUAL
_
Control diagram of the SETUP list in sound mode
3.2 Powering of the instrument
The G7 can be powered by one of the following sources:
• SA 15 external DC power source adapter (110 V / 230 V mains) - 6 V DC÷15 V DC (1.5 W)
• SA 17A external battery pack - operation time > 24 h (with USB 1.1 Host function not active and
backlight off)
• Four AA standard batteries. In the case of alkaline type, fully charged set can operate more than
12 h (6.0 V / 1.6 Ah) (with USB 1.1 Host function not active and backlight off). Instead
of the ordinary, four AA rechargeable batteries can be used (for charging them the separate
charger is required). In this case, using the best NiMH type, the operation time can be increased
up to 16 h (4.8 V / 2.6 Ah) (with USB 1.1 Host function not active and backlight off)
• USB interface - 500 mA HUB
The BATTERY window (path: MENU / DISPLAY / BATTERY) looks differently, depending on the
current powering source.
a)
b)
c)
d)
BATTERY windows with different sources powering the instrument: SA 15 external DC power adapter (a),
SA 17A external battery pack (b), internal batteries (c) and USB power (d)
For the external powering the SA 15 adapter should be connected to the Power socket located
on the bottom cover of the instrument. When the instrument is powered from the external power supply or
by the USB interface, the red diode on the right corner of the front panel bottom of the device switches on.
In the case of SA 15 the EXTERNAL POWER message appears in the BATTERY window (path: MENU /
DISPLAY / BATTERY).
3-22
G7 USER MANUAL
When the instrument is powered from batteries, the “Battery” icon is presented on the top
of the display. When voltage of the batteries is too low, the icon is flashing. To change the batteries
the user has to switch off the instrument, take off the black bottom cover of the instrument, unscrew
battery cover, change the batteries and reassemble the parts of the instrument. The fully charged NiMH
battery ensures more than 16 hours of the continuous work of the instrument (with the backlight off and
USB 1.1 Host function not active). The operation time is decreased about 20 % with the backlight
switched on. The battery condition can be checked by means of the BATTERY function. It is also
presented continuously on the display by means of the “Battery” icon.
a)
b)
Displays with “Battery” icon (a) and in the BATTERY window (path: MENU / DISPLAY / BATTERY) (b)
Display with LOW BATTERY message
When there is a connection to the USB interface (USB Device socket is connected by means
of the cable to a PC), the “Computer” icon is presented on the top of the display and in the BATTERY
window, there is the USB POWER 5.0 V message.
a)
b)
Displays with the “Computer” icon (a) and in the BATTERY window (b)
Notice: In the case when “Battery” icon is flashing, it is strongly recommended to use
as soon as possible the external power adapter or USB interface. In the other case the instrument
after a while will be switched off by itself!
The backlight of the display can be activated by means of the <
> + <
> push-buttons pressed
together. For saving the power of the battery, in the normal "day-light" operation it is recommended
to keep the backlight off. The user can set the BACKLIGHT TIMEOUT (path: MENU / DISPLAY /
SCREEN SETUP / BACKLIGHT TIMEOUT), which will cause the self-made backlight switching off in the
case when the keyboard is not used during the last 30 seconds. If it happened the first pressing of any
push-button switches the backlight on.
SCREEN SETUP windows; BACKLIGHT TIMEOUT activation
3-23
G7 USER MANUAL
_
3.3 Initial setup of the instrument
The instrument passes the self-test after switching on (in this time the producer and the name
of the instrument is displayed on the display) and then it enters the sound mode. The default display
mode for result’s presentation is one profile.
a)
b)
c)
Displays after switching on the instrument in sound (b) or vibration mode (c)
To start the measurements the user has to press the <START /STOP> push-button. The result
of the measurement is displayed with the unit of the measurement in so-called one profile mode.
On the left side of the display, the analogue-like indicator is presented. On the bottom of the display, there
is a profile from which comes the measurement (Profile (1), Profile (2) or Profile (3)). On the top of the
display (under the icons line) there are the following data: the function name (SPL, LEQ, SEL, Lden,
LEPd, Ltm3, Ltm5, Lxx, OVL, PEAK, MAX, MIN in the case of sound measurements or RMS, VDV,
OVL, PEAK, P–P, MTVV in the case of vibration measurements), the detector time constant (IMP., FAST,
SLOW or 100 ms, 125 ms, .. 10.0 s, .. - when the detector is exponential or Lin when the detector is
linear) and the weighted filter (A, C, Z or HP1, HP3, HP10, Vel1, Vel3, Vel10, VelMF, Dil1, Dil3, Dil10,
KB, Wk, Wd, Wc, Wj, Wm, Wh, Wg, Wb). The real time clock / time of the measurement are presented
on the right side of the bottom.
b)
a)
Displays in one profile (a) and 3 PROFILES display mode (b) with the SLM measurement results
Displays in one profile (a) and 3 PROFILES display mode (b) with the VLM measurement results
The results of the measurements can be presented in one profile, in 3 PROFILES,
in STATISTICS and in LOGGER (these are the available display modes set by the producer; cf. path:
MENU / DISPLAY / DISPLAY MODES). It is also possible to activate FILE INFO display mode (path:
MENU / DISPLAY / DISPLAY MODES / FILE INFO). It is possible to change the display mode pressing
the <
> or <
> push-buttons together with the <SHIFT> one. In so-called 3 PROFILES display mode
the results of the measurement from all profiles are displayed simultaneously. The units, weighted filter
and detector time constant are also shown. The default settings (set up by the producer) for the profiles
are as follows:
PROFILE 1 - A weighting filter (FILTER: A), FAST type of the RMS detector (DETECTOR: FAST),
the results of the measurements are not stored in the logger’s file (LOGGER PEAK: [ ],
LOGGER MAX: [ ], LOGGER MIN: [ ], LOGGER RMS: [ ]);
PROFILE 2 - C weighting filter (FILTER: C), FAST type of the RMS detector (DETECTOR: FAST),
the results of the measurements are not stored in the logger’s file (LOGGER PEAK: [ ],
LOGGER MAX: [ ], LOGGER MIN: [ ], LOGGER RMS:[ ]);
3-24
G7 USER MANUAL
PROFILE 3 - Z weighting filter (FILTER: Z), FAST type of the detector (DETECTOR: FAST), the results
of the measurements are not stored in the logger’s file (LOGGER PEAK: [ ],
LOGGER MAX: [ ], LOGGER MIN: [ ], LOGGER RMS:[ ]);
The default settings (set up by the producer) for the profiles, in the case of vibration measurements,
are as follows:
PROFILE 1 - HP1 weighting filter (FILTER: HP1); 1.0s type of the RMS detector (DETECTOR: 1.0s),
the results of the measurements are not stored in the logger’s file (LOGGER PEAK: [ ],
LOGGER P–P: [ ], LOGGER MAX: [ ], LOGGER RMS: [ ]);
PROFILE 2 - HP3 weighting filter (FILTER: HP3), 1.0s type of the RMS detector (DETECTOR: 1.0s),
the results of the measurements are not stored in the logger’s file (LOGGER PEAK: [ ],
LOGGER P–P: [ ], LOGGER MAX: [ ], LOGGER RMS: [ ]);
PROFILE 3 - HP10 weighting filter (FILTER: HP10), 1.0s type of the RMS detector (DETECTOR: 1.0s),
the results of the measurements are not stored in the logger’s file (LOGGER PEAK: [ ],
LOGGER P–P: [ ], LOGGER MAX: [ ], LOGGER RMS: [ ]);
The user can change all mentioned above settings using PROFILE x sub-list of the INPUT list. The
instrument remembers all changes. The return to the default settings (set up by the producer)
is possible after the execution of the CLEAR SETUP position available in the SETUP list.
The instrument can be used not only as the sound or vibration level meter (SLM or VLM) but also
as 1/1 OCTAVE and 1/3 OCTAVE analyser, DOSE METER and for FFT, RT60 measurements. In order
to distinguish the LEVEL METER function from the others, which are available in 3 PROFILES display
mode, two continuous horizontal lines are used to separate the measurement results from different
profiles. In other modes than SLM or VLM the mentioned above lines are dotted.
b)
a)
Displays in 3 PROFILES display mode with the measurements results, which are from LEVEL METER
mode (continuous lines) (b) and with the results, which are not from the LEVEL METER (dotted lines)
Notice: See next chapters for more details concerning different settings.
More data about the instrument’s state are given by means of the icon’s row visible in the top
of the display (“Paper sheet”, “Battery”, “Computer”, “Antenna” (“Tree”), “Loudspeaker”,
“Headphone”, “Envelope”, “Bell”, “Timer” and “Arrows”). The meanings of the icons are as follows:
Display with all available icons
“Paper sheet” icon is displayed when the USB disk or IrDA is connected to the instrument.
“Battery” is displayed when the instrument is powered from the batteries, icon corresponds
to the batteries state (three, two, one or none vertical bars in side of the icon). When voltage of batteries
is too low, the icon is flashing.
3-25
G7 USER MANUAL
_
Display with “Paper sheet” and “Battery” icons
“Computer” is displayed when there is the USB connection with the PC; the icon is flashing during
RT (Real Time) transmission.
Display with “Computer” icon
“Antenna” (“Tree”) icon is displayed in a flashing mode together with the “Loudspeaker” when
the measurement is started, the trigger is switched on and the level of the signal is too low to start
the registration.
Display with “Antenna” (“Tree”) icon
“Loudspeaker” icon is displayed when the measurement is started and executed. The crossed out
loudspeaker means measurement is paused (Pause).
Display with “Loudspeaker” icon
“Headphone” is displayed when RS 232 (SV 55) interface is connected to the instrument.
“Envelope” icon is presented when the current measurement results are logged
in the instrument’s logger file. Together with this icon, the “Loudspeaker” icon is always displayed.
In the case when the “Envelope” icon starts flashing, it means that the whole logger memory
of the instrument is filled out. The new measurement result is not saved in it. If the user wants to save
these results, he has to DELETE some logger files and execute LOGGER DEFRAGMENTATION (path:
MENU / FILE / DEFRAGMENTATION / LOGGER DEFRAGMENTATION).
“Bell” is displayed when overload has taken place during the last measurement cycle (the icon
is displayed also after the measurement and after loading the file with the overloaded results).
Displays with “Headphone”, “Envelope” and “Bell” icons
3-26
G7 USER MANUAL
“Timer” icon flashing means that the instrument’s Timer is switched on and the instrument
is waiting for the set time of the measurement. When the measurement was started by the Timer,
the icon is presented without flashing.
“Arrows” are flashing after pressing the <ALT> or <SHIFT> push-button when the 2nd Fun
is selected in the SHIFT MODE (path: MENU / SETUP / SHIFT MODE / SHIFT / 2nd FUN), that means
other push-buttons have second or third meaning (i.e. after pressing the <SHIFT> the meaning of
<ENTER> push-button is <MENU>; after pressing the <ALT> the meaning of <ESC> push-button is
changed into <PAUSE>).
Displays with “Timer” and “Arrows” icons
Notice: The time of the measurement is displayed in minutes and seconds in the range
from 1 sec. to 39 minutes and 59 seconds. After this limit, the hours and minutes are shown (i.e. 00:40).
Notice: THE USER DYNAMICALLY MODIFIES THE DEFAULT SETUP. The last set-up
of the instrument (during the power off) is stored and is available after power on.
3.4 Selection of the working mode- MODE
The device can work in two modes – vibration meter and sound meter. A mode is selected by
placing the special character in the line with the mode’s name. The position of the character can be
changed using the <
>, <
> push-buttons. After placing the character in the line with the option’s name
the user has to press the <ENTER> push-button.
a)
b)
c)
FUNCTION list opened, MODE selected (a) and MODE sub-list opened with all available modes b), (c)
3.5 Activation of optional functions
The 1/1 OCTAVE, 1/3 OCTAVE, DOSE METER, FFT, RT60 and time history data LOGGER,
time domain signal recording, human vibration filters are the optional functions broadening
applications of the instrument. Some of the additional functions are specified in the MEASUR. FUNCTION
(path: MENU / FUNCTION) others – in the other lists.
=> ENTER> =>
a)
b)
c)
3-27
G7 USER MANUAL
d)
_
e)
f)
g)
Displays with FUNCTION list opened in SM, MEASUREMENT FUNCTION selected (a) and
MEASUR. FUNCTION sub-list opened with all available options (b), (c), (d), (e), (f) and (g)
A function is selected by placing the special character in the line with the function’s name.
The position of the character can be changed using the <
>, <
> push-buttons. After placing
the character in the line with the function’s name the user has to press the <ENTER> push-button.
The window for entering the access code to a function is opened in the first essay of its execution
(after pressing the <ENTER> push-button) in the case when a function was not purchased together
with the instrument.
Displays during the entering of the access code to a function
The introduction of the access code is performed in the same way as the edition of the other text
variables using the <
>, <
> push-buttons (the selection of the character's position), the <SHIFT> and
<
> push-buttons (the Insert function), the <SHIFT> and <
> push-buttons (the Delete function) and
the <
>, <
> push-buttons (the codes of characters). The verification is made after pressing
the <ENTER> push-button. If the entered code was wrong, the message is displayed and the instrument
waits for the reaction of the user. After pressing the <ENTER> or the <ESC> push-button the information
that the function is not available is displayed and the instrument once more waits for the reaction
of the user.
Display after the unsuccessful verification of the access code
After pressing the <ENTER> or the <ESC> push-button the instrument returns to the FUNCTION
list displaying the list of the functions implemented in the unit (cf. the first Figure in this chapter).
After successful verification of the access code, the windows described above are no more displayed.
Once activated function is always available.
Notice: The number of the attempts for the access code entering is limited. After three
unsuccessful essays, the possibility is blocked.
3.6 Memory organisation
All available measurement results can be stored in the internal FLASH type memory
of the instrument (32 MB) or in the external USB Memory Stick (when the optional USB–HOST controller
is installed in the instrument).
3-28
G7 USER MANUAL
The internal memory of the instrument is divided into two separate parts. One part is dedicated
for saving the result and setup files and its size is equal to 16 252 428 bytes. The second part is used
for saving the logger files and its size is equal to 15 859 224 bytes. To save a result file the user
has to choose one of the available options: SAVE NEXT (path: MENU / FILE / SAVE or pressing
<ENTER> and <ALT> together), SAVE (path: MENU / FILE / SAVE or pressing <ENTER> and <ALT>
together), AUTO SAVE (path: MENU / FILE / SAVE OPTIONS) or DIRECT SAVE (path: MENU / FILE /
SAVE OPTIONS). To save a setup file the user has to choose SAVE SETUP option from the FILE list.
The logger files are created automatically (the usage of the SAVE is not required). The scheme
of the instrument’s memory organisation without the USB–HOST controller is presented below.
setup files
each
repetition
cycle
23MAR.svn
car1.svn
car2.svn
@save1.svn
@save2.svn
@save3.svn
……..
@savexxx.svn
and
main result files
signal
samples
logger
step
time
domain
logging
load/save
set.svn
HV_HA.svn
HV_WH.svn
save next
last
repetition
cycle
short
results
&log1.svn
&log2.svn
&log3.svn
&log4.svn
……..
……..
……..
……..
- avaliable only for
particular models
like SVAN 959 etc.
- only with external
USB flash memory
……..
……..
……..
……..
……..
……..
……..
&logxxx.svn
INTERNAL LOGGER
MEMORY
INTERNAL FLASH
DISK MEMORY
integration time
results
auto save
instrument
settings
load/save setup
RAM
MEMORY ORGANIZATION OF THE SVAN 95x instrument series without USB HOST
time history files
Scheme of the instrument’s memory organisation without the USB–HOST
Notice: The instrument’s logger memory is independent from the results and setup
memory. The capacity of the available memory is equal to 32 MB and is divided between logger
(15 859 224 bytes) and results and setup settings (16 252 428 bytes).
Notice: The logger files are created automatically (the usage of the SAVE is not required).
When the user connects to the instrument the USB memory stick, the data storing in the internal
instrument’s memory is not available any more. The user can only copy or move data from the internal
memory of the device and store new data in the USB memory stick. The scheme of the memory
organization of the instrument with the USB memory stick connected is presented below.
3-29
G7 USER MANUAL
_
EXTERNAL USB
FLASH DISK
set.svn
HV_HA.svn
HV_WH.svn
setup files
23MAR.svn
car1.svn
car2.svn
logger
step
time
domain
OR
SVAN 956/8/9 ONLY
each
repetition
cycle
signal
samples
recording
save next
load/save
last
repetition
cycle
short
results
logging
integration time
results
auto save
instrument
settings
load/save setup
RAM
MEMORY ORGANIZATION OF THE SVAN 95x instrument series with USB HOST
&time1.srt
&log2.svn
&time2.wav
@save1.svn
@save2.svn
@save3.svn
……..
@savexxx.svn
main result files
&log4.svn
……..
……..
……..
&logxxx.svn
……..
……..
……..
time history or time domain
Scheme of the instrument’s memory organisation with the USB–HOST and memory stick connected
Notice: The connection to the USB Host socket the USB disk switches off the instrument’s
internal flash memory. Only copying and moving the files to the USB stick is possible. All file functions and
remote commands are redirected to the USB disk. The internal flash memory is activated
after disconnecting the USB disk from the instrument.
Notice: The disconnection of the USB disk during the data transmission can cause the lost
of data saved in the USB disk as well as in the instrument’s internal flash memory.
3-30
G7 USER MANUAL
4 FUNCTIONS OF THE INSTRUMENT – FUNCTION
In order to select the FUNCTION list one has to press the <MENU> push-button, select by means
of the <
>, <
> (or <
>, <
>) push-buttons the FUNCTION text and press the <ENTER>.
The FUNCTION list contains three elements: MODE, MEASUREMENT FUNCTION and CALIBRATION.
The list is closed and the instrument returns to the presentation mode after pressing the <ESC> pushbutton.
a)
b)
c)
d)
Displays with the main list; the FUNCTION text selected (a) and the FUNCTION list opened;
the MODE selected (b) the MEASUREMENT FUNCTION selected (c) and the CALIBRATION selected (d)
4.1 Selecting the mode of the instrument – MODE
In order to select the required mode the user has to enter the MODE position in the FUNCTION
sub-list using <
>, <
> push-buttons and press the <ENTER> one. A mode is selected by placing the
special character in the line with the mode’s name. The position of the character can be changed using
the <>, <> push-buttons. After placing the character in the line with the option’s name the user has to
press the <ENTER> push-button.
a)
b)
c)
FUNCTION list opened; MODE selected (a) and MEASUR. FUNCTION sub-list opened with vibration
meter mode selected (b) and sound meter mode selected (c)
4.2 Measurement functions of the instrument - MEASUREMENT FUNCTION
In order to select the required function the user has to enter the MEASUREMENT FUNCTION sublist (to select the MEASUREMENT FUNCTION text using the <
>, <
> or <
>, <
> push-buttons
and press the <ENTER> one, when this text is displayed inversely).
After entering the MEASUREMENT FUNCTION sub-list, the set of the available functions appears
on the display (LEVEL METER, 1/1 OCTAVE, 1/3 OCTAVE, DOSE METER, FFT and RT60 in the case
SOUND METER MODE and LEVEL METER, 1/1 OCTAVE, 1/3 OCTAVE, FFT in the case of
VIBRATION METER MODE). The special character marks currently active function.
4-1
G7 USER MANUAL
_
a)
b)
c)
…
…
MEASUREMENT FUNCTION windows opened in SM (a), in VM (b) and the activation of the optional
function (c)
The main function of the instrument is the measurement of sound or vibration level. The other
functions are optional and they broaden the applications of the instrument. They can be supported
by the producer or purchased later. The producer activates the optional function bought
with the instrument. The user should activate by himself the function purchased later.
The sound LEVEL METER (SLM) mode provides the user with the functions of the SLM meeting
the IEC 61672:2002 standard for Type 1 accuracy and the functions of VLM meeting the ISO 8041:2005
standard. The instrument can also be used for the long-term acoustic monitoring using for this purpose
the huge logger, in which the measurement results are stored.
The required function is selected by placing the special character in the line with the proper text.
The position of the character can be changed using the <
>, <
> (or <
>, <
>) push-buttons.
After placing the character in the line with the function’s name the user has to press the <ENTER> pushbutton, which closes the MEASUR. FUNCTION sub-list.
Notice: It is not possible to change the measurement function during the measurements.
The instrument displays in this case for about 3 seconds the text: “MEASUREMENT IN PROGRESS”.
In order to change the mode of the instrument the measurement must be finished!
4.3 Instrument’s calibration - CALIBRATION
The instrument is factory calibrated with the supplied microphone for the standard environmental
conditions. Because the microphone sensitivity is a function of the temperature, ambient pressure
and humidity, when the absolute sound pressure level value is important, the calibration
of the measurement channel has to be done. In order to select a calibration function the user has to enter
the CALIBRATION sub-list (to select the CALIBRATION text using the <
>, <
> or <
>, <
> pushbuttons and press the <ENTER> one, when this text is displayed inversely).
The CALIBRATION sub-list consists of four positions: BY SENSITIVITY, BY MEASUREMENT,
which are used to perform the calibration, LAST CALIBRATION, which contains the list of the performed
in the past the calibration measurements and the obtained results and TEDS, which is used for
automatical reading of vibration transducer parameters.
a)
b)
Displays with the main list; the FUNCTION text selected (a), the FUNCTION list opened,
the CALIBRATION text selected (b)
4-2
G7 USER MANUAL
Note: The calibration level and the calibration result is expressed in different units depending
on the settings of the instrument. The metric or non-metric vibration units are set in the
VIBRATION UNITS (path: MENU / SETUP / VIBRATION UNITS). Additionally, the linear or logarithmic
units are set in the DISPLAY SCALE (path: MENU / DISPLAY / DISPLAY SETUP / DISPLAY SCALE).
4.3.1
The calibration BY SENSITIVITY in the case of acoustic signal
The calibration by the microphone’s sensitivity introduction can be conducted in the following way:
1. Select this type of the calibration (highlight the BY SENSITIVITY text) from the CALIBRATION
sub-list and press the <ENTER> push-button.
Displays with the selected calibration mode and after entering this mode
Notice: It is not possible to calibrate the instrument during the execution of the
measurements. It is possible to open different lists and sub-lists but the positions in these lists are not
displayed inversely and so - not accessible. The “Loudspeaker” icon indicates that the instrument is in
the measurement process. In order to change the sensitivity the measurement must be finished!
Displays with the SENSITIVITY positions (path: MENU / FUNCTION / CALIBRATION / BY SENSITIVITY)
not accessible
2. Set the sensitivity of the microphone taken from its calibration certificate using the <
>, <
>
push-buttons and then press the <ENTER> one.
The calibration factor is calculated, after pressing the <ENTER> push-button, in the relation
to 50.0 mV / Pa. In order to avoid the calculation the user has to leave the CALIBRATION without
pressing <ENTER>. For the sensitivity of the microphone higher than 50.0 mV / Pa the calibration factor is
negative.
a)
b)
Displays during setting the sensitivity higher than 50.0 mV / Pa (a) and after pressing
the <ENTER> push-button with the calibration factor calculated (b)
For the sensitivity of the microphone lower than 50.0 mV / Pa the calibration factor is positive.
4-3
G7 USER MANUAL
_
a)
Displays during setting the sensitivity lower than 50.0 mV / Pa with the calculated calibration factor
The lowest applicable value of the sensitivity to be introduced is equal to 50.0 µV / Pa (it conforms
to the calibration factor equal to 60.0 dB) and the highest one – 50.0 V / Pa (calibration factor equal
to -60.0 dB).
In order to return to the CALIBRATION sub-list the user has to press the <ESC> push-button.
a)
b)
Displays with the lowest possible sensitivity and the highest calibration factor (a)
and the highest sensitivity and the lowest calibration factor (b)
Notice: The calibration factor is always added to the results of measurements and analysis
(1/1 OCTAVE, 1/3 OCTAVE, FFT, etc.).
4.3.2
Calibration BY SENSITIVITY in the case of vibration signal
The calibration by the accelerometer’s sensitivity introduction can be conducted in the following
way:
1. Select this type of the calibration (highlight the BY SENSITIVITY text) from the CALIBRATION
sub-list and press the <ENTER> push-button.
Displays with the selected calibration mode and after entering this mode
Notice: It is not possible to calibrate the instrument during the execution
of the measurements. It is possible to open different lists and sub-lists but the positions in these lists
are not displayed inversely and so - not accessible. The “Loudspeaker” icon indicates that
the instrument is in the measurement process. In order to change the sensitivity the measurement
must be finished!
4-4
G7 USER MANUAL
Displays with the SENSITIVITY positions (path: MENU / FUNCTION / CALIBRATION /
BY SENSITIVITY) not accessible
2. Set the sensitivity of the accelerometer taken from its calibration certificate using the <
>, <
>
push-buttons and then press the <ENTER> one.
The calibration factor is calculated, after pressing the <ENTER> push-button, in the relation
-2
to 10.0 mV / ms . In order to avoid the calculation the user has to leave the CALIBRATION without
-2
pressing <ENTER>. For the sensitivity of the accelerometer higher than 10.0 mV / ms the calibration
factor is negative.
b)
a)
Displays during setting the sensitivity higher than 10.0 mV / ms-2 (a) and after pressing
the <ENTER> push-button with the calibration factor calculated (b)
-2
For the sensitivity of the accelerometer lower than 10.0 mV / ms the calibration factor is positive.
b)
a)
Displays during setting the sensitivity lower than 10.0 mV / ms-2 (a) and after pressing
the <ENTER> push-button with the calibration factor calculated (b)
The lowest applicable value of the sensitivity to be introduced is equal to 10.0 µV / ms (it conforms
-2
to the calibration factor equal to 60.0 dB) and the highest one – 10.0 V / ms (calibration factor equal
to -60.0 dB).
-2
In order to return to the CALIBRATION sub-list the user has to press the <ESC> push-button.
a)
b)
Displays with the lowest possible sensitivity and the highest calibration factor (a)
and the highest sensitivity and the lowest calibration factor (b)
Note: The calibration factor is always added to the results in the VIBRATION
LEVEL METER mode (VLM), 1/1 OCTAVE, 1/3 OCTAVE and the FFT analysis modes.
4.3.3
The calibration BY MEASUREMENT in the case of acoustic signal
The calibration for the sound measurements can be done in the following way:
1. Select the calibration by measurement (highlight the BY MEASUREMENT
from the CALIBRATION sub-list and press the <ENTER> push-button.
text)
4-5
G7 USER MANUAL
_
2. Attach the acoustic calibrator SV 30A (or equivalent 114 dB / 1000 Hz) to the microphone
of the instrument.
Notice: It is also possible to use the pistonphone, which generates the signal ca 124 dB
or different type of acoustic calibrator dedicated for ½” microphones. In any case, before starting
the calibration measurement, the user has to set (by means of the <>, <> push-buttons) the level
of the signal generated by the given calibrator (CAL. LEVEL position of BY MEASUREMENT sub-list),
which is usually stated in the calibration certificate of the unit (the value of the CAL. LEVEL set by
the producer of G7 is equal to 113.9 dB, the calibration factor value for 7052H microphone is within the
range of 6 to 7 dB; default value is equal to 6.62 dB ).
3. Switch on the calibrator and wait ca 30 seconds before starting the calibration measurement.
4. Start the calibration measurement by pressing the <START / STOP> push-button.
The measurement time is set to 5 seconds with 5 seconds delay. During the calibration
measurement the <ESC> and <PAUSE> push-buttons do not operate but it is possible to stop
the measurement using the <START / STOP> one. It is not recommended to stop the calibration
measurement before programmed 5 seconds period!
Displays during the calibration measurement
Waiting for the start of the measurements the DELAY is counted down on the display. After the end
of the measurement, its result is displayed on the display in the bottom line.
It is recommended to repeat the calibration measurement few times. The obtained results
should be almost the same (with ±0.1 dB difference). The reasons for the unstable results are as follows:
• the calibrator is not properly attached to the instrument,
• there are external disturbances,
• the calibrator or the measurement channel (the microphone, the preamplifier or the instrument
itself) are damaged.
Notice: During the calibration measurement, the external disturbances (acoustic noise or
vibrations) should not exceed the value of 100 dB.
5. Press the <ENTER> push-button in order to accept the measurement result.
The calibration factor is calculated, stored and displayed (cf. next Figure) after pressing
the <ENTER> push-button.
Notice: The user has to press the <ESC> push-button in order to quit the calibration
procedure without saving the calibration factor.
a)
b)
Displays after the measurements (a) and after the acceptance of the value of the calibration factor (b)
4-6
G7 USER MANUAL
During the calibration by measurement the compensation filter set in the COMPENSATION
FILTER window (path:SETUP/ COMPENSATION FILTER) is automatically switched off. At the first
measurement after the calibration on the display appears a question whether the user wants to switch on
the filter which was switched on before the calibration again. The selection of YES or NO is made with
<
>, <
> push- buttons and for confirmation the user has to press <ENTER>. After switching on the
compensation filter the first measurement is made with 5 seconds delay.
Displays with the question about switching on the compesation filter
4.3.4
The calibration BY MEASUREMENT in the case of vibration signal
The calibration by measurements can be conducted in the following way:
1. Select the calibration by measurement (highlight the BY MEASUREMENT
the CALIBRATION sub-list and press the <ENTER> push-button.
text)
from
Displays with the selected calibration mode and after entering this mode
2. Attach the vibration calibrator to the instrument’s accelerometer.
3. Switch on the calibrator and wait approximately 30 seconds before starting the calibration
measurement.
4. Start the calibration measurement by pressing the <START / STOP> push-button.
The measurement starts after 5 seconds delay. The measurement time is also predefined to
5 seconds. During the calibration period, the <ESC> and <PAUSE> push-buttons do not operate but it is
possible to stop the measurement using the <START / STOP> push-button. Waiting for the calibration
measurement to begin, a DELAY is counted down.
Displays while the instrument is waiting for the calibration measurement to commence
At the end of the measurement, the result is displayed on the display in the bottom line.
4-7
G7 USER MANUAL
_
Displays during the calibration measurements
Displays after the calibration measurements
The calibration procedure should be repeated a few times to ensure the integrity of the calibration.
The obtained results should be almost identical (with ±0.1 dB difference). The reasons for unstable results
are as follows:
• the calibrator is not properly attached to the instrument,
• there are external disturbances,
• the calibrator or the measurement channel (the accelerometer or the instrument itself) are damaged.
Note: During the calibration period, external disturbances (vibrations or acoustic noise)
should not exceed 100 dB.
5. Press the <ENTER> push-button in order to accept the measurement result.
The calibration factor is calculated, stored and displayed (cf. Fig. below for logarithmic and linear
scale – path: MENU / DISPLAY /DISPLAY SETUP / DISPLAY SCALE / SCALE) after pressing
the <ENTER> push-button.
=><ENTER>=>
=><ENTER>=>
Displays after pressing the <ENTER> push-button (after calculation of the calibration factor value)
Note: The calibration factor is always added to the measurement results in the
LEVEL METER mode and to those coming from the frequency analysis (1/1 OCTAVE, 1/3 OCTAVE and
FFT).
4.3.5
History of the calibration - LAST CALIBRATION
In order to enter the LAST CALIBRATION window in which up to last ten calibration records are
remembered, the user has to select the proper text in the CALIBRATION window using the <
>, <
>
push-buttons and press the <ENTER> one.
4-8
G7 USER MANUAL
a)
b)
Displays in the CALIBRATION window; the LAST CALIBRATION text selected (a)
the LAST CALIBRATION window opened with ten calibration records (b)
In order to review the calibration record, the user has to select the required line
in the LAST CALIBRATION window using the <
>, <
> push-buttons and press the <ENTER> one.
The opened window contains the date and time of the performed calibration measurement, the way
the calibration was done (BY MEASUREMENT or BY SENSITIVITY), the desired calibration level
(CAL. LEVEL) in the case of the measurements and the obtained calibration factor (CAL. FACTOR).
=><ENTER>=>
<
>
<
>
=><ENTER>=>
Displays with the LAST CALIBRATION records
In the case when the calibration measurements were not performed, the LAST CALIBRATION
window does not contain any record. The contents of this window is cleared after the CLEAR SETUP
operation.
Display with the empty LAST CALIBRATION window
4.3.6
Automatic reading of a vibration transducer parameters – TEDS
The TEDS (Transducer Electronic Data Sheet) function enables automatic reading
by the instrument the sensitivity and other electronic parameters of vibration transducer. This function is
under development. In order to enter the TEDS window the user has to select the TEDS text
in the CALIBRATION list using <
>, <
> push-buttons and press the <ENTER> one.
CALIBRATION window; TEDS text highlighted
4-9
G7 USER MANUAL
_
TEDS window opened; NO DATA AVAILABLE message
4-10
G7 USER MANUAL
5 MEASUREMENT PARAMETERS SETTING - INPUT
The profile parameters can be set in the INPUT list, which can be entered after pressing
the <MENU> push-button, then selecting by means of the <
>, <
> (or <
>, <
>) push-buttons
the INPUT text and finely pressing the <ENTER> one.
Main list with the INPUT text selected
The INPUT list in the LEVEL METER contains the elements which enable one the independent
programming of the measurement parameters (MEASUREMENT SETUP), the input range
(MEASUREMENT RANGE), parameters of three profiles (PROFILE 1, PROFILE 2 and PROFILE 3) and
the trigger function (TRIGGER SETUP). In the case of 1/1 OCTAVE and 1/3 OCTAVE on the display
appears SPECTRUM position. In the case of the DOSE METER instead of the trigger function there is a
DOSIMETER SETUP. In the case of FFT analyser on the display appears FFT position. In the cases of
RT60 there is not any new position in the INPUT list – RT60 position appears in the SETUP list.
b)
c)
d)
a)
INPUT list in the LEVEL METER (a), in 1/1 OCTAVE and 1/3 OCTAVE analyser (b), in DOSE METER (c),
and in FFT analyser (d)
Notice: Any parameter in the INPUT list can be changed only when the instrument
does not execute a measurement. The possibility of a change is signalled by displaying inversely
a parameter’s field. Moreover, normally displayed field means that the parameter cannot be
changed. The “Loudspeaker” icon indicates that the instrument is performing the measurements.
Displays with not active sub-lists of INPUT list during measurement
Notice: In the case of settings for vibration measurements the parameters can be
2
presented in LOGARITHMIC (decibels) or LINEAR (m/s ) units. It depends on the DISPLAY SCALE
2
position (path: MENU / DISPLAY / DISPLAY SETUP / DISPLAY SCALE/ LOG or LIN), e.g. 1 0 m/s
can be presented as 140 dB.
5-1
G7 USER MANUAL
_
5.1 Selection of measurement parameters - MEASUREMENT SETUP
The MEASUREMENT SETUP is opened after the selection of the MEASUREMENT SETUP text
from the INPUT list by means of the <
>, <
> (or <
>, <
> with <SHIFT>) push-buttons and pressing
the <ENTER> one. The MEASUREMENT SETUP consists of the parameters, which can be set or
switched on / off, namely: the delay of the start of measurements (START DELAY), the integration period
(INTEGR. PERIOD), the repetition of the measurement cycles (REP. CYCLE) and the logger activation or
deactivation (LOGGER). If the logger is active, the user can set the logging period (LOGGER STEP) and
give a name to the logger’s file (LOGGER NAME). In order to change the displayed inversely parameter
the user has to press the <
>, <
> push-buttons. The confirmation of any change made in the sub-list
requires pressing the <ENTER> push-button, which simultaneously closes the sub-list.
The MEASUREMENT SETUP is closed ignoring any changes made in there, after pressing any time
the <ESC> push-button.
Displays with the MEASUREMENT SETUP window
5.1.1
Setting time delay before the start of measurements - START DELAY
The START DELAY defines the delay period from the <START / STOP> push-button pressing to
the start of the measurements (the digital filters of the instrument analyse constantly the input signal even
when the measurements are stopped). This delay period can be set from 0 second to 60 seconds (with
1 second step by means of the <
>, <
> push-buttons and with 10 seconds step with the <>, <>
push-buttons pressed together with the <SHIFT> one). The <ENTER> push-button must be pressed for
the confirmation of the selection, which closes simultaneously the MEASUREMENT SETUP window.
MEASUREMENT SETUP windows; the setting of the START DELAY with 1-second step
...
MEASUREMENT SETUP windows; the setting of the START DELAY with 10-seconds step
Notice: The minimum delay period is equal to 0 second. In the CALIBRATION mode, the
delay period is equal to 5 seconds.
5.1.2
Setting the integration period - INTEGR. PERIOD
The INTEGR. PERIOD defines the period in which the signal is being averaged during the sound
level measurements. The definitions of the measurement results in which the integration period is used is
5-2
G7 USER MANUAL
given in App. D. The required value of this parameter can be set by means of the <
>, <
> and
confirmed by the <ENTER> push-button.
The integration period (INTEGR. PERIOD) can be set (by pressing the <
> (or <
> with <SHIFT>)
push- buttons):
-
From 1 s to 59 s (with 1 second or 10 seconds step).
MEASUREMENT SETUP windows; the setting of the INTEGR. PERIOD with 1-second step
MEASUREMENT SETUP windows; the setting of the INTEGR. PERIOD with 10-seconds step
-
From 1 m (min) to 59 m (with 1 minute or 10 minutes step).
...
MEASUREMENT SETUP windows; the setting of the INTEGR. PERIOD with 1 and 10-minutes step
-
From 1 h to 24 h (with 1 hour or 10 hours step). It is also possible to set Inf value.
...
MEASUREMENT SETUP windows; the setting of the INTEGR. PERIOD with 10-hours step
Additionally, the predefined periods: 1 m, 5 m, 15 m, 1 h, 8 h and 24 h, which are enumerated
in the standards, are also available (by pressing the <
> push-button or <
> with <SHIFT>; these values
are placed in the mentioned above sequence on the left in relation to 1 s).
Displays during setting the predefined INTEGR. PERIOD sequence
5-3
G7 USER MANUAL
_
Notice: In the case of switching on the AUTO SAVE function, the minimum value
of the integration period should be equal to 10 seconds.
Notice: In the DOSE METER the integration period cannot be set for the value greater than
8 hours.
If the user wants to switch on AUTO SAVE option (path: MENU / FILE / SAVE OPTIONS /
AUTO SAVE) the integration period value has to be greater or equal than 10 seconds. When AUTO SAVE
option was switched on and new entered integration period value is less than 10 seconds AUTO SAVE
option switches off and INT.PERIOD TOO SHORT / AUTO SAVE DISABLED message appears on the
display.
Dsplay, when the INT.PERIOD is too short for AUTO SAVE option
5.1.3
Setting the number of repetition of measurement cycles - REP. CYCLE
The REP. CYCLE defines the number of cycles (with the measurement period defined
in the INTEGR. PERIOD) which should be performed by the instrument. The required parameter can
be set by means of the <
>, <
> push-buttons (with the step equal to 1) or by means of the <
>, <
>
push-buttons pressed together with the <SHIFT> one (with the step equal to 20). The selected value
is accepted by pressing the <ENTER> push-button, which closes the MEASUREMENT SETUP window.
The Inf value denotes the infinite repetition of the measurements (until the pressing the <START / STOP>
push-button or after receiving the remote control code). The REP. CYCLE number values are within the
limits [1, 1000].
REP. CYCLE setting with the step equal to one
...
REP. CYCLE setting with the step equal to 20
5-4
G7 USER MANUAL
5.1.4
Logger functionality switching On / Off - LOGGER
The LOGGER switches on and off the functionality, which enables the user to save in a file
the selected results from three profiles with the defined period. The LOGGER can be activated and
deactivated by means of the <
>, <
> push-buttons and accepted by the <ENTER> one.
The acceptation closes simultaneously the MEASUREMENT SETUP window. Any changes are ignored
after pressing the <ESC> push-button.
Displays with the LOGGER deactivated and activated
The LOGGER functionality is not included in the standard set of the instrument. It can be bought
together with the instrument ordering the proper option or can be purchased by the user in the future.
In the latter case, after selecting On value, the user has to introduce special code activating
the functionality. After successful activation, the logger remains available and the instrument never more
asks for the code.
=>
Displays during setting the LOGGER STEP; available values in a sequence 1, 2, 5
5.1.5
Setting time period between two writings to the logger’s file - LOGGER STEP
The LOGGER STEP defines the period of the data logging in a file. It can be set from 2 ms
to 1 s in 1, 2, 5 sequence, the values from 1 second to 59 seconds, the values from 1 minute to 59 minute
and 1 hour. The required parameter can be set by means of the <
>, <
> push-buttons with the single
step and by means of the <
>, <
> with <SHIFT> with the incremented one. The selection is accepted by
the <ENTER> one, which closes simultaneously the MEASUREMENT SETUP window. Any changes are
ignored after pressing the <ESC> push-button.
LOGGER STEP setting; available values in milliseconds
...
...
5-5
G7 USER MANUAL
_
...
LOGGER STEP setting; available values from 500 milliseconds to 1 hour
5.1.6
Logger file name edition - LOGGER NAME
The LOGGER NAME enables the user to name the logger file. The default one is &LOG.
The name cannot be longer than eight characters including not edited first one character &. After entering
this line, the special help is displayed in the display’s last line. The name edition is performed similarly to
the name edition in the FILE NAME line of the SAVE or SAVE SETUP window. The edition process is
presented below. The displayed inversely character is currently edited. The <
>, <
>, <
>, <
>and
<SHIFT> push-buttons are used for editing the name. One can select the proper position of the character
in the edited text using the <
>, <
> push-buttons. The available ASCII characters can be changed using
the <
> (or <
>) push-button pressed together with the <SHIFT> one. The subsequent digits, underline,
big letters and space appear on the display in the inversely displayed position after each pressing of the
mentioned above push-buttons.
LOGGER NAME edition in MEASUREMENT SETUP
The edited name is accepted and the file is saved after pressing the <ENTER> push-button.
The special warning is displayed in the case the file with the edited name already exists in the memory.
The instrument waits then for a reaction of the user (any push-button should be pressed except
the <SHIFT> or the <ALT> one).
=>
=>
Displays during the attempt of overwriting the existing file
The main measurement results (cf. App. B):
•
LPeak, LMax, LMin, SPL, LEQ, Lden, Ltm3, Ltm5, for SOUND LEVEL METER , 1/1 OCTAVE,
1/3 OCTAVE, FFT and RT60
•
LPeak, LMax, LMin, SPL, LEQ, Lden, Ltm3, Ltm5, LAV and TLAV for DOSE METER
•
PEAK, P–P, MAX, MIN, RMS, VDV for VIBRATION LEVEL METER, 1/1 OCTAVE, 1/3 OCTAVE,
and FFT
are calculated in the period set in the INTEGR. PERIOD. These results can be saved in the result
files of the instrument’s memory by means of the SAVE or SAVE NEXT function (path: MENU / FILE /
SAVE). In the case the INTEGR. PERIOD is greater than 9 seconds, it can be done also by means of the
AUTO SAVE operation. The name of the file for that operation is set in the FILE NAME window (path:
MENU / FILE / AUTO SAVE / FILE NAME). In the case the REP. CYCLE is greater than one, the
AUTO SAVE operation will be performed after the period set in the INTEGR. PERIOD. The name of the
file with the main results is changed after each saving.
5-6
G7 USER MANUAL
In the same, when the LOGGER is On, the partial measurement results are calculated in the period
set in the LOGGER STEP. Up to 12 results can be logged simultaneously from three independent profiles
of the instrument (PEAK / MAX / MIN / RMS for sound measurements or PEAK/ P–P/ MAX/ RMS for
vibration measurements from each profile (path: MENU / INPUT / PROFILE x, where x = 1, 2 and 3)) with
time step down to 2 ms. These results are saved in one logger’s file memory of the instrument in the
SOUND or VIBRATION LEVEL METER as well as for other functions. The name of the file is set in the
LOGGER NAME position. The registration in the logger’s memory is stopped after the period, which is
equal to INTEGR. PERIOD multiplied by REP. CYCLE, after pressing the <START/STOP> push-button or
after stopping the measurements remotely.
REP. CYCLE
n=1
0
REP. CYCLE
n=1
T
2T
INTEGR. PERIOD INTEGR. PERIOD
T
T
start
AUTO SAVE
@sig1.svn
time history
main results
integration period
from 0 to T
PEAK, MAX, MIN or RMS
REP. CYCLE
n=N-1
AUTO SAVE
@sig2.svn
main results
integration period
from T to 2T
(N-2)T
REP. CYCLE
n=N
(N-1)T
NT
measurements
end
INTEGR. PERIOD INTEGR. PERIOD
T
T
AUTO SAVE
@sigN-1.svn
AUTO SAVE
@sigN.svn
main results
integration period
from (N-2)T
to (N-1)T
time
main results
integration period
from (N-1)T
to NT
main results
files
signal amplitude
Measurements started by <START/STOP> push-button, ended by last repetition cycle
LOGGER: ON
&logger1.svn
RMS results logged
with LOGGER STEP.
Number of results
equal NT / LS
0
LS
LOGGER STEP
NT
time
Relations between INTEGR. PERIOD and LOGGER STEP
5.2 Measurement range setting - MEASUREMENT RANGE
The MEASUREMENT RANGE is used to set one of the available measurement ranges in the
instrument. In order to open this window the user has to select the MEASUREMENT RANGE text in the
INPUT list by means of the <
>, <
> push-buttons and press the <ENTER> one.
INPUT list with the MEASUREMENT RANGE selected
There are two ranges available HIGH and LOW. The detailed description of the measurement
ranges parameters is given in App. C. The change of the input range is made by means of the <
>, <
>
push-buttons. After pressing the <ENTER> push-button the change is confirmed and the window closes.
5-7
G7 USER MANUAL
_
The return to the INPUT list ignoring any changes made in the sub-list is made after pressing the <ESC>
push-button.
MEASUREMENT RANGE windows in sound mode; the RANGE selection
MEASUREMENT RANGE windows in vibration mode, the RANGE selection
The range value changes due to the calibration factor (in case of SM changes only upper limit).
=>
Displays with change of the default range values in sound mode caused by the calibration factor
=>
Displays with change of the default range values in vibration mode caused by the calibration factor
5.3 Setting parameters in a profile - PROFILE x
The user enters the PROFILE x sub-list after pressing the <ENTER> push-button on the displayed
inversely PROFILE x text, which has to be selected by means of the <
>, <
> push-buttons.
In the PROFILE x sub-list the following parameters can be programmed independently for each profile:
weighting filter (FILTER), RMS detector type (DETECTOR) and profile's results logged in a file
(LOGGER PEAK, LOGGER MAX, LOGGER MIN and LOGGER RMS in the case of sound
measurements and LOGGER PEAK, LOGGER P–P, LOGGER MAX and LOGGER RMS in the case of
vibration measurements).
INPUT list with the PROFILE 1, PROFILE 2 and PROFILE 3 selected
5-8
G7 USER MANUAL
Notice: The change of the profile parameters is not possible when the measurement
is performed. The user has to finish the current measurement.
5.3.1
Weighting filter selection in a profile - FILTER
The following weighting filters are available in a profile of the instrument:
•
•
•
- in the case of sound measurements
Z type 1 according to the IEC 61672-1 standard,
A type 1 according to the IEC 651 and IEC 61672-1 standards,
C type 1 according to the IEC 651 and IEC 61672-1 standards,
PROFILE(x) windows; the selection of the weighting filter in SM
- in the case of acceleration measurements (vibration): HP1, HP3, HP10, KB, Wk, Wd, Wc, Wj,
Wm, Wh, Wg and Wb
PROFILE(1) windows; the selection of the weighting filter in acceleration measurements
- in the case of velocity measurements (vibration): Vel1, Vel3, Vel10 and VelMF
PROFILE(1) windows; the selection of the weighting filter in velocity measurements
- in the case of displacement measurements (vibration): Dil1, Dil3 and Dil10
5-9
G7 USER MANUAL
_
PROFILE(1) windows; the selection of the weighting filter in displacement measurements
The characteristics of the filters are given in App. D. The selection of the required filter is made
with the <
>, <
> push-buttons. The user can enter the FILTER line in the PROFILE x sub-list pressing
the <
>, <
> push-buttons. After pressing the <ENTER> push-button any changes made
in the sub-list are confirmed and it is closed. The return to the INPUT list ignoring any changes made
in the sub-list is made after pressing the <ESC> push-button.
5.3.2
RMS detector selection - DETECTOR
In the instrument the following RMS detectors are available: IMPULSE, FAST and SLOW (in the
case of sound measurements) and 100ms, 125ms, 200ms, 500ms, 1.0s, 2.0s, 5.0s, 10.0s (in the case of
vibration measurements). The selection of the required detector is made with the <
>, <
> push-buttons.
The user can enter the DETECTOR line in the PROFILE x sub-list pressing the <
>, <
> push-buttons.
After pressing the <ENTER> push-button any changes made in the sub-list are confirmed and it is closed.
The return to the INPUT list ignoring any changes made in the sub-list is made after pressing the <ESC>
push-button.
PROFILE(x) windows (SM); the selection of the RMS detector
PROFILE(1) windows (vibration mode); the selection of the RMS detector
5.3.3
PEAK result selection for saving in a logger’s file - LOGGER PEAK
Up to four measurement results from each profile can be saved in the logger’s file
of the instrument. In order to save the PEAK result (cf. the definition in App. D) the user has to activate
this line (by means of the <
>, <
> push-buttons) and place a special character in the brackets using the
<
>, <
> push-buttons. After pressing the <ENTER> push-button any changes made in the window are
confirmed and it is closed. The return to the INPUT list ignoring any changes made in the window
is made after pressing the <ESC> push-button.
5-10
G7 USER MANUAL
...
PROFILE(x) windows (sound mode); the PEAK result to be not saved or saved in a logger’s file
...
...
PROFILE(x) windows (vibration); the PEAK result to be not saved or saved in a logger’s file
5.3.4
MAX result selection for saving in a logger’s file - LOGGER MAX
In order to save the MAX result (cf. the definition in App. D) the user has to activate this line
(by means of the <
>, <
> push-buttons) and place a special character in the brackets using the <
>,
<
> push-buttons. After pressing the <ENTER> push-button any changes made in the window
are confirmed and it is closed. The return to the INPUT list ignoring any changes made in the window
is made after pressing the <ESC> push-button.
...
PROFILE(x) windows (SM); the MAX result to be not saved or saved in a logger’s file
...
PROFILE(x) windows (VM); the MAX result to be not saved or saved in a logger’s file
5-11
G7 USER MANUAL
5.3.5
_
P–P result selection for saving in a logger’s file - LOGGER P-P
In order to save the P–P result (cf. the definition in App. D) the user has to activate this line
(by means of the <
>, <
> push-buttons) and place a special character in the brackets using the <
>,
<
> push-buttons. After pressing the <ENTER> push-button any changes made in the window
are confirmed and it is closed. The return to the INPUT list ignoring any changes made in the window
is made after pressing the <ESC> push-button. The LOGGER P–P position is available only in VM.
...
PROFILE(x) windows; the P-P result to be not saved or saved in a logger’s file
5.3.6
MIN result selection for saving in a logger’s file - LOGGER MIN
In order to save the MIN result (cf. the definition in App. D) the user has to activate this line
(by means of the <
>, <
> push-buttons) and place a special character in the brackets using the <
>,
<
> push-buttons. After pressing the <ENTER> push-button any changes made in the window
are confirmed and it is closed. The return to the INPUT list ignoring any changes made in the window
is made after pressing the <ESC> push-button. The LOGGER MIN position is available only in SM.
...
PROFILE(x) windows; the MIN result to be not saved or saved in a logger’s file
5.3.7
RMS result selection for saving in a logger’s file - LOGGER RMS
In order to save the RMS result (cf. the definition in App. D) the user has to activate this line
(by means of the <
>, <
> push-buttons) and place a special character in the brackets using the <
>,
<
> push-buttons. After pressing the <ENTER> push-button any changes made in the window
are confirmed and it is closed. The return to the INPUT list ignoring any changes made in the window
is made after pressing the <ESC> push-button.
...
PROFILE(x) window (SM); the RMS result to be not saved or saved in a logger’s file
..
PROFILE(x) windows (VM); the RMS result to be not saved or saved in a logger’s file
5-12
G7 USER MANUAL
5.4 Triggering mode and parameters selection - TRIGGER SETUP
The TRIGGER SETUP sub-list enables the user to set the triggering parameters. It is not present
for the DOSE METER function. This sub-list is opened after the selection of the TRIGGER SETUP text
from the INPUT list by means of the <
>, <
> (or <
>, <
> with <SHIFT>) push-buttons and pressing
the <ENTER> one. The TRIGGER SETUP consists of the MEASURE TRIGGER, LOGGER TRIGGER
and RECORDER TRIGGER sub-lists. The return to the INPUT list is made after pressing the <ESC>
push-button.
<ENTER>
<ESC>
TRIGGER SETUP selected in the INPUT list and the TRIGGER SETUP window
5.4.1
Trigger parameters setting - MEASURE TRIGGER
The MEASURE TRIGGER is a contexts sub-list in which the triggering can be switched off or on
(TRIGGER), in the case when on - the source of the triggering signal can be determined (SOURCE),
its level (LEVEL) and sometimes also the speed of changes (GRADIENT). In order to enter this sub-list
the user has to select by means of the <
>, <
> push-buttons the MEASURE TRIGGER text
in the TRIGGER SETUP sub-list and press the <ENTER> one.
...
...
MEASURE TRIGGER windows
...
In order to change the displayed inversely parameter the user has to press the <
>, <
> pushbuttons. The confirmation of any change made in the window requires pressing the <ENTER> pushbutton, which simultaneously closes the current display. The MEASURE TRIGGER window is closed
ignoring any changes made, after pressing any time the <ESC> push-button.
5.4.1.1 Switching the triggering on and off - TRIGGER
The triggering of the measurements (TRIGGER) can be switched off using the <> push-button.
MEASURE TRIGGER window; TRIGGER switched off
The triggering is switched on if one of its five modes is selected: SLOPE +, SLOPE –, LEVEL +,
LEVEL – or GRAD +. The selection of the triggering mode is performed using the <
>, <
> pushbuttons. If the instrument works with the triggering switched on, the “Antenna” icon is flashing on the
display in the case when the triggering condition was not fulfilled.
5-13
G7 USER MANUAL
_
Displays during the measurements while the triggering condition is not fulfilled
In the case when the SLOPE + is selected, the measurement starts when the arising signal will
pass the level determined in the LEVEL. In the case when the SLOPE – is selected, the measurement
starts when the falling down signal will pass the level determined in the LEVEL. The measurement
is stopped when the conditions set in the MEASUREMENT SETUP sub-list are fulfilled, after pressing
the <START / STOP> push-button or after receiving the proper control code remotely.
MEASURE TRIGGER windows with the SLOPE modes selected
In the case when the LEVEL + is selected, in each second of the measurement the triggering
condition is checked; the measurement is registered only when the signal has the greater level than this
determined in the LEVEL and in the other case the measurement result is skipped.
In the case when the LEVEL – is selected, in each second of the measurement the triggering
condition is checked; the measurement is registered only when the signal has the lower level than this
determined in the LEVEL and in the other case the measurement result is skipped.
MEASURE TRIGGER windows with the LEVEL modes selected
In the case when the GRAD + is selected, in each second of the measurement the triggering
condition is checked; the measurement is registered only when the signal has the greater level than this
determined in the LEVEL and the speed of the signal changes is not less than that selected
in the GRADIENT. In the other case the measurement result is skipped.
MEASURE TRIGGER window with the GRAD + mode selected
5.4.1.2 Selection of the triggering signal - SOURCE
It is assumed that only one measured result can be used as a source of the triggering signal
in the LEVEL METER mode, namely the output signal from the RMS detector coming from the first profile
which is denoted here as RMS(1). This position does not become active (it is not displayed inversely) and
the text stated here remains unchanged in the case of LEVEL +, LEVEL – or GRAD + triggering mode.
After pressing there the <
> push-button, the SOURCE line is skipped.
5-14
G7 USER MANUAL
<
>
<
>
<
>
...
MEASURE TRIGGER windows with not active SOURCE signal line
In the case of SLOPE + and SLOPE – as a source of the triggering signal can be used the signal
connected to the external input/output socked named I/O. The selection of the source of the triggering
signal is performed using the <
>, <
> push-buttons.
...
MEASURE TRIGGER windows with the SOURCE signal selection
Notice: Only one signal measured in the instrument - the RMS detector in the first profile can be used as the triggering signal. Additionally, the signal from Ext.I/O can be also used as the trigger
source in the SLOPE + and SLOP – modes.
5.4.1.3 Setting the level of the triggering signal - LEVEL
The level of the triggering signal (LEVEL) can be set in 1 dB step (or 10 dB steps) from 24 dB to
136 dB range using the <
>, <
> push-buttons (or <
>, <
> with <SHIFT>).
...
...
MEASURE TRIGGER windows with the LEVEL selection in the SLOPE + mode
Notice: The LEVEL value of the triggering signal refers to the instantaneous value of the
RMS result from the first profile calculated during the period depending on selected DETECTOR (path:
MENU / INPUT / PROFILE 1 / DETECTOR).
<
>+ <SHIFT>
<
>+ <SHIFT>
MEASURE TRIGGER windows with the LEVEL selection in the SLOPE – mode (10 dB step down)
5-15
G7 USER MANUAL
_
<
>
<
>
MEASURE TRIGGER windows with the LEVEL selection in the LEVEL + mode (1 dB step up)
MEASURE TRIGGER windows with the LEVEL selection in the LEVEL – mode (1 dB step up)
MEASURE TRIGGER windows with the LEVEL selection in the GRAD + mode (1 dB step down)
5.4.1.4 Setting the speed of the triggering signal changes - GRADIENT
The speed of the triggering signal changes (GRADIENT) can be set in 1 dB/millisecond step
(or 10 dB/millisecond steps) from 1 dB/ms to 100 dB/ms range using the <>, <> push-buttons
(or <
>, <
> with <SHIFT>).
<
>
<
>+<SHIFT>
MEASURE TRIGGER windows with the GRADIENT selection (1 dB/ms and 10 dB/ms step up)
<
>+<SHIFT>
<
>
MEASURE TRIGGER windows with the GRADIENT selection (10 dB/ms up and 1 dB/ms down)
5.4.2
Trigger parameters in logger setting - LOGGER TRIGGER
The LOGGER TRIGGER parameters influence the way the measurement results are saved
in the logger. It is a contexts sub-list in which the triggering in logger can be switched off or on
(TRIGGER), in the case when on (LEVEL +) - the source of the triggering signal is determined
(SOURCE), its level can be selected (LEVEL), the number of the results saved in the logger before
the fulfilment of the triggering condition (PRE) and the number of the results saved in the logger after
5-16
G7 USER MANUAL
the fulfilment of the triggering condition (POST). If the triggering signal is greater than the selected
in the LEVEL, the logger contains:
• the measurement results registered directly before the fulfilment of the triggering condition; time
of the registration can be calculated by multiplying the value set in the PRE by the time period taken
from the LOGGER STEP (path: MENU / INPUT / MEASUREMENT SETUP / LOGGER STEP);
• all measurement results up to the moment the triggering signal falls down the LEVEL;
• the results registered directly after the fulfilment of the triggering condition; time of the registration can
be calculated by multiplying the value set in the POST by the time period taken from
the LOGGER STEP (path: MENU / INPUT / MEASUREMENT SETUP / LOGGER STEP).
In order to change the displayed inversely parameter the user has to press the <
>, <
> pushbuttons. The confirmation of any change made in the window requires pressing the <ENTER> pushbutton, which simultaneously closes the current display. The LOGGER TRIGGER window is closed
ignoring any changes made, after pressing any time the <ESC> push-button.
5.4.2.1 Switching the logger triggering on and off - TRIGGER
The logger triggering of the measurements (TRIGGER) can be switched off using the <
> pushbutton (or <
> with <SHIFT>). The triggering is switched on if the LEVEL + or LEVEL – mode
is selected using the <
> push-button (or <
> with <SHIFT>).
<
>
<
>
LOGGER SETUP windows in sound mode
<
>
<
>
LOGGER SETUP windows in vibration mode
5.4.2.2 Selection of the triggering signal in logger - SOURCE
It is assumed that only one measured result can be used as a source of the triggering signal
in the logger, namely the output signal from the RMS detector coming from the first profile which is
denoted here as RMS(1). This position does not become active (it is not displayed inversely) and the text
stated here remains unchanged. After pressing the <
> push-button, the SOURCE line is skipped.
<
>
LOGGER TRIGGER windows with the not active SOURCE signal line in sound mode
<
>
5-17
G7 USER MANUAL
_
LOGGER TRIGGER windows with the not active SOURCE signal line in vibration mode
5.4.2.3 Setting the level of the triggering signal in the logger - LEVEL
The level of the triggering signal in logger (LEVEL) can be set in sound mode in 1 dB step (or 10 dB
steps) from 24 dB to 136 dB range using the <
>, <
> push-buttons
(or <
>,2 <
> with <SHIFT>). In
2
vibration mode the step is equal to 1 dB (or 10 dB) from 1.00 mm/s to 10.0 km/ s .
LOGGER TRIGGER windows with the LEVEL selection (1 dB step up) in sound mode
LOGGER TRIGGER windows with the LEVEL selection (1 dB step up) in vibration mode
LOGGER TRIGGER windows with the LEVEL selection in vibration mode (1 dB step up, cont.)
Notice: The LEVEL value of the triggering signal in logger refers to the instantaneous value
of the RMS result from the first profile calculated during the period depending on selected DETECTOR
(path: MENU / INPUT / PROFILE 1 / DETECTOR).
<
>+<SHIFT>
<
>+<SHIFT>
...
<
>+<SHIFT>
5-18
<
>+<SHIFT>
G7 USER MANUAL
<
>+<SHIFT>
<
>+<SHIFT>
LOGGER TRIGGER windows with the LEVEL selection (10 dB step up) in sound mode
<
>+<SHIFT>
<
>+ <SHIFT>
<
>+ <SHIFT>
<
>+<SHIFT>
...
<
>+< SHIFT>
<
>+<SHIFT>
LOGGER TRIGGER windows with the LEVEL selection (10 dB step up) in vibration mode
5.4.2.4 Selection of the number of the results to be saved in the logger before the fulfilment of the
triggering condition - PRE
In the PRE line the number of the results registered in the logger’s file before the fulfilment
of the triggering condition can be set. This number is within the limits 0..50 and can be set with the step
equal to one using the <
>, <
> push-buttons or with the step equal to 10 using the <>, <> with
<SHIFT>.
=>
<
>
...
LOGGER TRIGGER windows with the PRE selection in sound mode
=>
<
>
...
LOGGER TRIGGER windows with the PRE selection in vibration mode
Time period of the measurements which are saved in the logger before the fulfilment
of the triggering condition can be calculated multiplying the value set in the PRE by the value set
in the LOGGER STEP (path: MENU / INPUT / MEASUREMENT SETUP). The result of the calculation
is presented in the same line, at the right side of the display.
5-19
G7 USER MANUAL
_
=>
...
=>
=>
LOGGER TRIGGER windows with the PRE selection for different LOGGER STEPS
The value set in the PRE is confirmed and the window is closed after pressing the <ENTER> pushbutton. After pressing the <ESC> push-button the window is closed ignoring the settings made
in the PRE.
5.4.2.5 Selection of the number of the results to be saved in the logger after the fulfilment of the
triggering condition - POST
In the POST line the number of the results registered in the logger’s file after the fulfilment
of the triggering condition can be set. This number is within the limits 0..200 and can be set with the step
equal to one using the <
>, <
> push-buttons or the step equal to 10 using the <
>, <
> with <SHIFT>.
=>
<
>
...
LOGGER TRIGGER windows with the POST selection
Time period of the measurements which are saved in the logger after the fulfilment of the triggering
condition can be calculated multiplying the value set in the POST by the value set in the LOGGER STEP
(path: MENU / INPUT / MEASUREMENT SETUP). The result of the calculation is presented in the same
line, at the right side of the display.
=>
...
=>
=>
LOGGER TRIGGER windows with the POST selection for different LOGGER STEPS
5-20
G7 USER MANUAL
=>
...
=>
=>
...
LOGGER TRIGGER windows with the POST selection for different LOGGER STEPS in vibration mode
The value set in the POST is confirmed and the window is closed after pressing the <ENTER>
push-button. After pressing the <ESC> push-button the window is closed ignoring the settings made
in the POST.
5.4.3
Trigger parameters for recorder setting - RECORDER TRIGGER
The RECORDER TRIGGER enables the user to set the parameters of time domain signal
recording on the external USB memory stick (path: MENU / SETUP / USB-HOST PORT /
SRT RECORDING or WAVE RECORDING or EVENT RECORDING). In order to enter
RECORDER TRIGGER window the user has to select the RECORDER TRIGGER text in the
TRIGGER SETUP window using the <
>, <
> push-buttons and press <ENTER>.
TRIGGER SETUP window; the RECORDER TRIGGER text highlighted
5.4.3.1 Selecting trigger mode - TRIGGER
In the TRIGGER position following options are available: Off, SLOPE +, SLOPE –, LEVEL +,
LEVEL –, GRAD +. The selection is made by pressing <
>, <
> push-buttons and <ENTER> one.
The RECORDER TRIGGER window is closed ignoring any changes made in there, after pressing any
time the <ESC> push-button.
RECORDER TRIGGER windows; the TRIGGER selection
5-21
G7 USER MANUAL
_
5.4.3.2 Selecting the triggering signal - SOURCE
In the case when in the TRIGGER position SLOPE + or SLOPE – is selected it is possible
to choose the SOURCE. Available sources are RMS(1) and EXT.I/O. The selection is made using <
>,
<
> push-buttons and pressing <ENTER> one. The RECORDER TRIGGER window is closed ignoring
any changes made in there, after pressing any time the <ESC> push-button.
a)
b)
RECORDER TRIGGER windows; the source selection for SLOPE + (a) and SLOPE – (b)
5.4.3.3 Selecting level for recording trigger- LEVEL
The level of the triggering signal for recording (LEVEL) can be set in 1 dB step (or 10 dB steps)
from 24 dB to 136 dB range using the <
>, <
> push-buttons (or <
>, <
> with <SHIFT>). In the case
of vibration measurements the level can be expressed not only in decibels (path: MENU / DISPLAY /
DISPLAY SETUP / SCALE / LOG) but also in linear units (placing in the path LIN instead of LOG).
RECORDER TRIGGER windows with the LEVEL selection (1 dB step up)
a)
b)
RECORDER TRIGGER windows with the LEVEL selection in vibration mode, level expressed in linear
units, 1 dB step up (a) and 10 dB step up (b)
RECORDER TRIGGER windows with the LEVEL selection in sound and vibration mode (10 dB step up)
5.4.3.4 Setting the speed of the triggering signal changes - GRADIENT
GRADIENT appears on the display when in the TRIGGER position the GRAD + option is selected.
In the GRADIENT position it is possible to select the GRADIENT value. The available values are from
1 dB/ms to 100 dB/ms. The selection is made by pressing <
>, <
> push-buttons and <ENTER> one.
5-22
G7 USER MANUAL
The RECORDER TRIGGER window is closed ignoring any changes made in there, after pressing any
time the <ESC> push-button.
RECORDER TRIGGER windows with the GRADIENT selection (1 dB step up)
RECORDER TRIGGER windows with the GRADIENT selection (10 dB step up)
5.5 Selection of dose meter parameters - DOSIMETER SETUP
The DOSIMETER SETUP is accessible in the INPUT list in the SOUND METER mode when
the DOSE METER function is selected (path: MENU / FUNCTION / MEASUREMENT FUNCTION). It is
not available in the VIBRATION METER. This sub-list is opened after the selection of the
DOSIMETER SETUP text from the INPUT list by means of the <
>, <
> (or <
>, <
>) push-buttons
and pressing the <ENTER> one. The DOSIMETER SETUP consists of the parameters, which influence
the calculation of the dose meter results: the CRITERION LEVEL, THRESHOLD LEVEL and
EXCHANGE RATE (the definitions of the dose meter results are given in App. D).
<ENTER>
DOSIMETER SETUP selected in the INPUT list and the DOSIMETER SETUP window
5.5.1
Setting criterion sound level - CRITERION LEVEL
The criterion sound level influences the calculations of the DOSE and D_8h results.
The
CRITERION LEVEL
line
is
accessible
after
pressing
the
<
>
push-button
in the DOSIMETER SETUP window. The available values are as follows: 80 dB, 84 dB, 85 dB or 90 dB.
They can be selected by means of the <
>, <
> push-buttons. The confirmation of any change made in
the line requires pressing the <ENTER> push-button, which simultaneously closes the window.
5-23
G7 USER MANUAL
_
The DOSIMETER SETUP is closed ignoring any changes made in there, after pressing any time
the <ESC> push-button.
DOSIMETER SETUP windows; the CRITERION LEVEL selection
5.5.2
Setting criterion sound level - THRESHOLD LEVEL
The threshold level influences the calculations of the dose meter results, namely DOSE, D_8h and
LAV. The THRESHOLD LEVEL line is accessible after pressing the <
>, <
> push-buttons
in the DOSIMETER SETUP window. The available values are as follows: None, 75 dB, 80 dB, 85 dB or
90 dB. They can be selected by means of the <
>, <
> push-buttons. The confirmation of any change
made in the line requires pressing the <ENTER> push-button, which simultaneously closes the window.
The DOSIMETER SETUP is closed ignoring any changes made in there, after pressing any time
the <ESC> push-button.
<
>
<
>
<
>
<
>
DOSIMETER SETUP windows; the THRESHOLD LEVEL selection
5.5.3
Setting criterion sound level - EXCHANGE RATE
The exchange rate influences the calculations of the dose meter results, namely DOSE, D_8h and
LAV. The exposure rate equal to three complies with ISO R 1999 “Assessment of Occupational Noise
Exposure for Hearing Conservation Purposes”, while equal to five complies with the American
“Occupational Safety and Health Act” – OSHA. The EXCHANGE RATE line is accessible after pressing
the <
> push-button in the DOSIMETER SETUP widow. The available values are as follows: 2, 3, 4 or 5.
They can be selected by means of the <
>, <
> push-buttons. The confirmation of any change made in
the line requires pressing the <ENTER> push-button, which simultaneously closes the window.
The DOSIMETER SETUP is closed ignoring any changes made in there, after pressing any time the
<ESC> push-button.
DOSIMETER SETUP windows; the EXCHANGE RATE selection
5-24
G7 USER MANUAL
5.6 Selection of FFT analysis parameters - FFT
The FFT is accessible in the INPUT list when the FFT function is selected in
MEASUREMENT FUNCTION window (path: MENU / FUNCTION / MEASUREMENT FUNCTION / FFT).
This sub-list is opened after the selection of the FFT text from the INPUT list by means of the <
>, <
>
(or <
>, <
>) push-buttons and pressing the <ENTER> one.
The FFT consists of the parameters, which influence the calculation and logging the results
of the FFT analysis: AVERAGING, FILTER, BAND, WINDOW, LINES and LOGGER. The FFT window
is closed ignoring any changes made in there, after pressing any time the <ESC> push-button.
=> <ENTER> =>
a)
b)
FFT selected in the INPUT list and the FFT window opened in sound mode (a) and in vibration mode (b)
5.6.1
The averaging of spectra in the FFT analysis - AVERAGING
The AVERAGING influences the way in which the spectra in the FFT analysis are averaged.
Up to the internal software version named as 6.04 only LINEAR is available (this position can not be
accessed and changed).
5.6.2
Selecting the weighting filter during the FFT analysis - FILTER
The FILTER influences the calculations of the FFT. In the case of sound measurements there are
Z, A and C filters available. In the case of vibration measurements, only Z filter is available and the
position is not accessible after entering the FFT window. The frequency characteristics of those filters
are given in Appendix D. The selection of this parameter is made by means of the <>, <> pushbuttons. The confirmation of the change made in the line requires pressing the <ENTER> push-button,
which simultaneously closes the window.
•
•
•
The following weighting filters are available in the case of the FFT analysis in sound mode:
Z type 1 according to the IEC 61672-1 standard,
A type 1 according to the IEC 651 and IEC 61672-1 standards,
C type 1 according to the IEC 651 and IEC 61672-1 standards.
•
In the case of vibration mode, during the FFT analysis the following filter is available:
Z type 1 according to the IEC 61672-1 standard.
FFT window; the FILTER selection in sound mode
5.6.3
Selecting the analysis band of the signal - BAND
The BAND position enables the user to select the band in which the narrow-band analysis
of the signal has to be performed. The user has the following possibilities: 22.4 kHz, 11.2 kHz, 5.6 kHz,
2.8 kHz, 1.4 kHz, 700 Hz, 350 Hz, 175 Hz and 87.5 Hz.
5-25
G7 USER MANUAL
_
The selection of the required value is made by means of the <
>, <
> push-buttons.
The confirmation of the change made in the line requires pressing the <ENTER> push-button, which
simultaneously closes the window. The FFT window is closed ignoring any changes made in there, after
pressing any time the <ESC> push-button.
FFT window; the BAND selection
5.6.4
Selecting the time window for the FFT analysis - WINDOW
The WINDOW position enables the user to select the coefficients of time window which are used
in the FFT analysis. Available time windows of the FFT analysis are as follows: HANNING, RECTANGLE,
FLAT TOP, KAISER-BESSEL.
The selection of the window is made by means of the <
>, <
> push-buttons. The confirmation
of the change made in the line requires pressing the <ENTER> push-button, which simultaneously closes
the window. The FFT window is closed ignoring any changes made in there, after pressing any time
the <ESC> push-button.
FFT sublist; the WINDOW selection
5.6.5
Selecting the number of the lines of FFT analysis - LINES
The LINES position enables the user to select the number of lines of the FFT analysis. There are
three values available: 1920, 960 and 480. The selection of the value is made by means of the <
>, <
>
push-buttons. The confirmation of the change made in the position requires pressing the <ENTER> pushbutton, which simultaneously closes the window. The FFT window is closed ignoring any changes made in
there, after pressing any time the <ESC> push-button.
FFT window; the LINES selection
5-26
G7 USER MANUAL
5.6.6
Enabling the FFT spectra time history logging - LOGGER
The LOGGER enables to record spectra of the FFT analysis in the logger file. The activation
of the logger is possible only if LOGGER functionality has been activated in the MEASUREMENT SETUP
sublist (path: MENU / INPUT / MEASUREMENT SETUP / LOGGER ON). In order to switch on the logger
of the FFT analysis the user has to press the <
> push-button and the <ENTER> one. If, instead
of the <ENTER> push-button the <ESC> one is pushed, the selection is ignored and the FFT sub-list
is closed.
FFT window; the LOGGER activation
5.7 Selection of 1/1 octave and 1/3 octave spectrum parameters - SPECTRUM
The SPECTRUM appears in the INPUT list when the 1/1 OCTAVE or 1/3 OCTAVE function
is
selected
in
the
MEASUREMENT FUNCTION
(path:
MENU
/
FUNCTION
/
MEASUREMENT FUNCTION / 1/1 OCTAVE or 1/3 OCTAVE). This sub-list is opened after the selection
of the SPECTRUM text from the INPUT list by means of the <
>, <
> (or <
>, <
>) push-buttons and
pressing the <ENTER> one.
The SPECTRUM consists of the parameters, which influence the calculation and logging the results
of 1/1 OCTAVE or 1/3 OCTAVE analysis: FILTER, BAND and LOGGER. The SPECTRUM window
is closed ignoring any changes made in there, after pressing any time the <ESC> push-button.
=> <ENTER> =>
a)
b)
SPECTRUM selected in the INPUT list and the SPECTRUM window opened in sound mode (a)
and in vibration mode (b)
5.7.1
Selecting the weighting filter during 1/1 OCTAVE or 1/3 OCTAVE analysis - FILTER
The FILTER influences the calculations of 1/1 OCTAVE or 1/3 OCTAVE analysis. In the case
of sound measurements there are Z, A and C filters available. In the case of vibration measurements only
Z filter is available and the position is not accessible after entering the SPECTRUM window.
The frequency characteristics of those filters are given in Appendix D.
The selection of this parameter is made by means of the <
>, <
> push-buttons.
The confirmation of the change made in the line requires pressing the <ENTER> push-button, which
simultaneously closes the window.
The following weighting filters are available in the case of 1/1 OCTAVE or 1/3 OCTAVE analysis
in sound mode:
• Z type 1 according to the IEC 61672-1 standard,
• A type 1 according to the IEC 651 and IEC 61672-1 standards,
• C type 1 according to the IEC 651 and IEC 61672-1 standards.
In the case of vibration mode, during 1/1 OCTAVE or 1/3 OCTAVE analysis the following filter
is available:
• Z type 1 according to the IEC 61672-1 standard.
5-27
G7 USER MANUAL
_
SPECTRUM window; the FILTER selection in sound mode
5.7.2
Selecting the band during the 1/1 OCTAVE or 1/3 OCTAVE analysis - BAND
The BAND position enables the user to select the band in which the 1/1 OCTAVE or 1/3 OCTAVE
analysis of the signal has to be performed. Available values of the bands of the analysis are as follows:
AUDIO, FULL - in the case of sound mode - and FULL - in the case of vibration mode. The selection
of this parameter is made by means of the <
>, <
> push-buttons. The confirmation of the change made
in the line requires pressing the <ENTER> push-button, which simultaneously closes the window. The
SPECTRUM window is closed ignoring any changes made in there, after pressing any time
the <ESC> push-button.
SPECTRUM window; the BAND selection in sound mode
5.7.3
Activation of logger for 1/1 OCTAVE or 1/3 OCTAVE analysis results - LOGGER
The RMS result from 1/1 OCTAVE or 1/3 OCTAVE analysis can be saved in the logger’s file
of the instrument (or on the USB memory stick).
The activation is made by placing a special character in the LOGGER position. The activation
is possible when the LOGGER functionality is switched on in the MEASUREMENT SETUP window (path:
MENU / INPUT / MEASUREMENT SETUP / LOGGER).
If the LOGGER functionality is switched off, the position is not accessible. The confirmation
of the change made in the position requires pressing the <ENTER> push-button, which simultaneously
closes the window. The SPECTRUM window is closed ignoring any changes made in there, after pressing
any time the <ESC> push-button.
SPECTRUM window; the LOGGER selection
5-28
G7 USER MANUAL
6 DATA AVAILABLE ON THE DISPLAY - DISPLAY
In order to open the DISPLAY list the user has to:
• press the <MENU> push-button,
• select from the main list, using the <
>, <
> (or <
>, <
>) push-buttons, the DISPLAY text (highlight
it inversely),
• press the <ENTER> push-button.
Pressing the <SHIFT> and <
> (or <SHIFT> and <
>) results in a movement to the first position
of the opened list and pressing the <SHIFT> and <
> (or <SHIFT> and <
>) results in a movement
to the last position of the opened list.
Display in the main list; the DISPLAY text highlighted (displayed inversely)
The DISPLAY list is used for setting the various parameters, which are mainly dedicated
for the control of the display. The following items are present on this list:
DISPLAY MODES
enables one to select the mode of the measurement results presentation;
DISPLAY SETUP
enables one to change the scale in the graphical modes of result’s presentation
and the parameters of the logger’s result presentation;
LOGGER VIEW
enables one to select and present the results stored in the logger’s files;
SCREEN SETUP
enables one to set the contrast and the switch on/off the backlight timeout
of the instrument’s display;
BATTERY
it informs the user about the source of powering of the instrument and current
power supply voltage;
UNIT LABEL
informs the user about the serial number of the instrument, the version of
the internal software and the standards to which conform the measurement
results.
In each available position any change is performed by means of the <
>, <
> and <
>, <
>
push-buttons. In order to confirm the selection the <ENTER> push-button has to be pressed. After this
confirmation, the opened window or list is closed. In order to ignore any changes made in the opened
window or list the user has to press the <ESC> push-button.
Display with the DISPLAY list
6.1 Selection of the modes of measurement results presentation DISPLAY MODES
The DISPLAY MODES sub-list enables one the selection of the currently available modes of
displaying the results of measurement. The selection is made by placing or replacing the special
6-1
G7 USER MANUAL
_
character in the inversely displayed position of the DISPLAY MODES sub-list by means of the <
>, <
>
push-buttons. In order to confirm the selection the user has to press the <ENTER> push-button.
The mode of the results presentation is related with the selection of the instrument’s function (SLM or
VLM, 1/1 OCTAVE, 1/3 OCTAVE, FFT analyser etc.). Only One Profile mode cannot be switched off
independently from the current mode of the instrument.
Notice: The abbreviation SM – Sound Mode refers to the sound mode (SOUND METER) and
the proper functions dedicated for the measurement and analysis of the acoustic signal: LEVEL METER,
1/1 OCTAVE, 1/3 OCTAVE, FFT, DOSIMETER, RT60; VM – Vibration Mode refers to the vibration mode
(VIBRATION METER) and the proper functions dedicated for the measurement and analysis of the
vibration signal: LEVEL METER, 1/1 OCTAVE, 1/3 OCTAVE and FFT
For the Sound Level Meter the following possibilities of the measurement results presentation are
available:
- One Profile,
-
3 PROFILES,
-
STATISTICS,
-
LOGGER (time history),
-
FILE INFO.
a)
b)
DISPLAY MODES windows in SM
For the Vibration Level Meter the following possibilities of the measurement results presentation
are available:
- One Profile,
-
3 PROFILES,
-
LOGGER (time history)
-
FILE INFO.
a)
b)
c)
DISPLAY MODES windows in VM
The LOGGER mode of results presentation is available if, and only if, the data from at least
one profile are logged in the logger’s file. If the LOGGER position is switched on ([√
√]) but there was
nothing stored in the logger’s file (in the selected profile there were selected results (PEAK, MAX, MIN
or RMS in the case of SM and PEAK, P–P, MAX or RMS in the case of VM) but the instrument still waits
for the logger results, i.e. the LOGGER STEP is long, the NO RESULTS text is displayed. When
the LOGGER is selected as active and the LOGGER positions in all profiles are not selected,
the LOGGER mode of results presentation is skipped.
6-2
G7 USER MANUAL
Display in the LOGGER mode when there is nothing in the logger to be displayed (after setting LOGGER as
active)
The display with the measurement result in so-called one profile mode is presented below.
On the top of the display (under the icons line) there are the following data: the function name (SPL, LEQ,
SEL, Lden, LEPd, Ltm3, Ltm5, Lxx, OVL, PEAK, MAX, MIN in the case of sound measurements or
RMS, VDV, OVL, PEAK, P–P, MTVV in the case of vibration measurements), the detector time constant
(in SM when the detector is exponential: IMP., FAST, SLOW or Lin when the detector is linear and in VM:
100 ms, 125 ms, .. 10.0 s, ..).
Notice: In the case of LINEAR RMS INTEGRATION (path: MENU / SETUP /
RMS INTEGRATION / LINEAR) for LEQ, SEL, SEL8, E, E_8h, LEPd, PSEL and Lxx results on the
display appears Lin. instead of IMP., FAST or SLOW detector time constant.
Notice: There is not any indication of the detector in the case of PEAK and OVL results.
The name of the implemented filter (path: MENU / INPUT / PROFILE x / FILTER) is presented as
the last element of the first line (A, C, Z in SM or HP1, HP3, HP10, Vel1, Vel3, Vel10, VelMF, Dil1, Dil3,
Dil10, KB, Wk, Wd, Wc, Wj, Wm, Wh, Wg, Wb in VM).
Measurement results in SM, made with linear integration, presented in one profile mode
2
The result of the measurement together with its unit (dB or m/s for almost all results and % only
for OVL) is given in the second line. The profile, the results are coming from, is visible in the bottom
of the display (Profile(1), Profile(2) or Profile(3)). The vertical line showing the value of the result in the
analogue-like form together with the scale is presented at the left side of the display. The real time clock is
visible in the bottom right corner of the display. The selection of the result is made pressing the <
>, <
>
push-buttons.
6-3
G7 USER MANUAL
_
Measurement results in VM presented in one profile mode
Measurement results, made with exponential integration in SM, presented in one profile mode
If the measurement results are saved in the internal memory in a file, its name is presented under
the profile’s number.
Measurement results, made with exponential integration in SM, saved in the file named MAR11, presented in
one profile mode
The profile is changed after pressing the <SHIFT> and <
> or <SHIFT> and <
> push-buttons.
The same result can be achieved after pressing the <ALT> and <
> or <ALT> and <
> push-buttons.
The statistics (i.e. these set in the instrument as a default: L01, L10, L20, L30, L40, L50, L60, L70,
L80 and L90), which are available only in SM, are visible in one profile’s mode after pressing the <SHIFT>
and <
> or <SHIFT> and <
> push-buttons.
The user can make the selection of these ten statistics Lxx in the STATISTICAL LEVELS window
(path: MENU / SETUP / STATISTICAL. LEVELS). The statistics are not longer displayed after pressing
the <
> or the <
> push-buttons.
6-4
G7 USER MANUAL
Displays with the statistics made with linear integration presented in one profile mode
The change of the RMS integration (path: MENU / SETUP / RMS INTEGRATION) from linear to
exponential influence a little bit the presentation – instead of Lin. there is the time constant (FAST,
SLOW, IMP.) on the display.
Displays with the statistics made with exponential integration presented in one profile mode
There is also possible to present differently the measurement data in one profile after pressing
the <ALT> and <
> or <ALT> and <
> push-buttons. In this case, the result is displayed
with the biggest possible fonts. The name of the result together with the units is given in the bottom line.
The current result from a selected profile is changed after pressing the <
> or the <
> push-buttons. The
profile the results are coming from is changed after pressing the <SHIFT> and <
> or <SHIFT> and <
>
but the profile’s number is not visible on the display.
The same result can be achieved after pressing the <ALT> and <
> or <ALT> and <
> pushbuttons. When the statistics level Lxx is presented, the another levels from the set of ten values
are available after pressing the <SHIFT> and <
> or <SHIFT> and <
> push-buttons.
The presentation mode is changed (to 3 PROFILES, STATISTICS and LOGGER or FILE INFO
if all of them are currently available) after pressing the <
> or <
> push-buttons.
6-5
G7 USER MANUAL
_
Measurement results in SM and unknown profile presented with the biggest fonts in one profile mode
Measurement results in VM and unknow profile presented with the biggest fonts in one profile mode
When the measurements are performed, what is indicated on the display by the loudspeaker icon,
the clock displayed in the right bottom shows the current second of the measurement. The value
presented there belongs to the range [1, INTEGRATION PERIOD].
The envelope icon visible above and below indicates that the selected results from the profiles
(path: MENU / INPUT / PROFILE x) are logged.
Displays during the measurement performed in SOUND LEVEL METER mode with the active LOGGER
(an envelope icon)
6-6
G7 USER MANUAL
Displays during the measurement performed in VM with the active LOGGER (an envelope icon)
The results can be saved using SAVE, SAVE NEXT or AUTO SAVE functions after the end
of the measurements caused by the selected reasons.
It is not possible to save the results during the execution of the measurements. In the case when
the saving was done, the name of the logger’s file is presented in the bottom line of one profile display
and the clock starts to show the real time.
Displays after stopping the measurements with the name of the logger’s file the data are saved
The display in one profile mode with the results coming from the DOSE METER (in SM) looks
nearly the same as it was described above for the LEVEL METER mode.
The measurement result (PEAK, MAX, MIN, SPL, DOSE, D_8h, LAV, LEQ, SEL, SEL8, E, E_8h,
LEPd, PSEL, Ltm3, Ltm5, Lxx and OVL – cf. the definitions in App. D) is presented in the first line
of the display.
Next, either the detector (path: MENU / INPUT / PROFILE x / DETECTOR) time constant (Fast,
Slow or Impulse) is given for all results (except PEAK and OVL) or in the case of LINEAR
RMS INTEGRATION (path: MENU / SETUP / RMS INTEGRATION / LINEAR) for LEQ, SEL, SEL8, E,
E_8h, LEPd, PSEL and Lxx results the Lin. text appears on the display.
Notice: There is not any indication of the detector in the case of PEAK and OVL results.
The name of the implemented filter (path: MENU / INPUT / PROFILE x / FILTER) is presented
as the last element of the first line (A, C or Z).
The result of the measurement together with its unit (dB for almost all results, % - for DOSE, D_8h
2
and OVL and Pa h for E and E_8h) is given in the second line. The profile, the results are coming from,
is visible in the bottom of the display (Profile(1), Profile(2) or Profile(3)).
The line showing the value of the result in the analogue-like form together with the appropriate
scale is presented at the left side of the display. The real time clock is visible in the bottom right corner
of the display.
The selection of the result is made pressing the <
>, <
> push-buttons. If the measurement
results are saved in the internal memory in a file, its name is presented under the profile’s number.
6-7
G7 USER MANUAL
_
Measurement results from DOSE METER, made with exponential integration, presented in one profile mode
6.1.1
Switching on/off spectrum view - SPECTRUM
The SPECTRUM position is accesible only in 1/1 OCTAVE, 1/3 OCTAVE and FFT function (path:
MENU / FUNCTION / MEASUREMENT FUNCTION). The possibility of the measurement results
presentation in SPECTRUM can be switched on or off placing or replacing the special character
in the displayed inversely line with the SPECTRUM text by means of the <
>, <
> push-buttons.
In order to confirm the selection the user has to press the <ENTER> push-button. This confirmation
closes also the DISPLAY MODES sub-list. The sub-list can be also closed after pressing the <ESC>
push-button but the settings made there are ignored.
DISPLAY MODES windows in SM; SPECTRUM position accesible
DISPLAY MODES windows in VM
6-8
G7 USER MANUAL
a)
b)
c)
Displays in SPECTRUM mode for 1/1 OCTAVE (a), 1/3 OCTAVE (b) and FFT (c)
6.1.2
Switching on/off three profiles view - 3 PROFILES
The possibility of the measurement results presentation in 3 PROFILES can be switched on or off
placing or replacing the special character in the displayed inversely line with the 3 PROFILES text
by means of the <
>, <
> push-buttons. In order to confirm the selection the user has to press
the <ENTER> push-button. This confirmation closes also the DISPLAY MODES sub-list. The sub-list can
be also closed after pressing the <ESC> push-button but the settings made there are ignored.
Setting on and off the accessibility of three profiles presentation mode
The exemplary measurement results presented in the 3 PROFILES mode when the results from
three profiles are on the display are given below. In the case of the 3 PROFILES in three consecutive
lines the following data are seen: the name of the function, the result together with the units, the filters and
detector time constants in each profile (in the case of sound mode) and (in the case of vibration mode)
the profil number (P(1), P(2), P(3)). The current real time, the profile from which the result is displayed
inversely and the name of the file, in which the results are saved, are displayed at the bottom. At the right
bottom, there is another clock, which displays real time in the case when the measurements
are performed and the current second of the measurement – in the opposite case. The PEAK result does
not depend on the detector type, so the corresponding place remains empty. In the case of sound
measurements when the measurement result (LEQ, SEL, Lden, LEPd and Lxx) depends on the linear
RMS integration currently set in the RMS INTEGRATION (path: MENU / SETUP / RMS INTEGRATION),
the L is placed instead of the letter F, S or I (Fast, Slow, Impulse). In the case of the exponential RMS
integration, the kind of this detector is displayed (F, S or I).
Measurement results in 3 PROFILES mode
6-9
G7 USER MANUAL
_
The presented result in a selected profile is changed using the <
>, <
> push-buttons
as presented below for sound and vibration measurements.
Results in 3 PROFILES mode (SM); selection of the result in a profile
Results in 3 PROFILES mode (VM); selection of the result in a profile
The change of the selected (displayed inversely) profile is done pressing the <SHIFT> and <
> or
<SHIFT> and <
> push-buttons. The same result can be achieved after pressing the <ALT> and <
> or
<ALT> and <
> push-buttons.
Results in 3 PROFILES mode; selection of the profile
Ten statistics set by the user (path: MENU / SETUP / STATISTICAL LEVELS) or set
in the instrument as a default (L01, L10, L20, L30, L40, L50, L60, L70, L80 and L90) are visible in this
mode after pressing the <SHIFT> and <
> or <SHIFT> and <
> push-buttons.
Displays with the statistics made with linear integration presented in 3 PROFILES mode
During the measurements, which are indicated by the loudspeaker icon, the current time
from the range [1, INTEGRATION PERIOD] is displayed on the right bottom clock. The envelope icon
indicates that results selected in the profiles (path: MENU / INPUT / PROFILE x) are logged.
6-10
G7 USER MANUAL
Displays during the measurement performed in SM with the active LOGGER
There is also possible to present differently the measurement data in 3 PROFILES after pressing
the <ALT> and <
> or <ALT> and <
> push-buttons. In this case, at the left side of the display three
analogue-like indicators are shown, each one for the selected result from a profile. The currently active
profile is marked by the cursor and inversely displayed name of the function. The filter selected in that
profile and the integration type (in the case of the linear one) or the detector type (in the case
of exponential) are written below the measurement results. During the measurements, the bottom right
clock displays the current time from the range [1, INTEGRATION PERIOD]. The current result from
a selected profile is changed after pressing the <
> or the <
> push-buttons. The profile the results
are coming from is changed after pressing the <SHIFT> and <
> or <SHIFT> and <
>. The same result
can be achieved after pressing the <ALT> and <
> or <ALT> and <
> push-buttons. When
the statistics level Lxx is presented, the another levels from the set of ten values are available after
pressing the <SHIFT> and <
> or <SHIFT> and <
> push-buttons. The results can be saved using
SAVE, SAVE NEXT or AUTO SAVE functions after the end of the measurements caused by the selected
reasons. It is not possible to save the results during the execution of the measurements. In the case when
the saving was done, the name of the logger’s file is presented in the bottom line of one profile display
and the clock starts to show the real time. The presentation mode is changed (to one profile, STATISTICS
and LOGGER or FILE INFO if all of them are currently available) after pressing the <
> or <
> pushbuttons.
Displays during the measurement performed in LEVEL METER mode with the active LOGGER (the first
three) and after saving the results (the last one)
6.1.3
Setting on/off statistics view in SM - STATISTICS
The possibility of the statistics results presentation can be switched on or off placing or replacing
the special character in the displayed inversely line with the STATISTICS text by means of the <
>, <
>
push-buttons. In order to confirm the selection the user has to press the <ENTER> push-button.
This confirmation closes also the DISPLAY MODES sub-list. The sub-list can be also closed after
pressing the <ESC> push-button but the settings made there are ignored. The STATISTICS mode
is taken off from the DISPLAY MODES window in VM.
a)
b)
Setting on (a) and off (b) the accessibility of statistics presentation mode
The display with the statistics analysis results presents in the graphical form the values from L01 to
L99. The Lxx level selected by the cursor is displayed in the bottom line together with its value and units
(dB). The P value indicating that the statistics results are updated every 100 ms is placed at the end
of the bottom line. The profile’s number the statistics are taken from, the RMS detector (Lin., or Exp.:
6-11
G7 USER MANUAL
_
Fast, Slow or Imp.), the filter’s name (A, C or Z) and real time are displayed on the right side
of the view in the presentation modes. The selection of the profile is made by pressing the <SHIFT> and
<
> or the <SHIFT> and <
> push-buttons. The same result can be achieved after pressing the <ALT>
and <
> or <ALT> and <
> push-buttons.
Results presented in the statistics presentation mode
The selection of the Lxx to be displayed is done by pressing the <
>, <
> push-buttons.
The statistics L01 is immediately available after pressing the <SHIFT> and <
>, while the L99 - after
pressing the <SHIFT> and <
> push-buttons.
Instrument’s default Lxx levels presented in the graphical form
The change of the mode is done by pressing the <ALT> and <
> or the <ALT> and <
> pushbuttons. The second mode differs slightly from the first one described above: the description on the left
side is shorter but on the right side the value of the statistic levels are shown.
Results presented in both statistic presentation modes
During the measurements, which are indicated by the loudspeaker icon, the current time
from the range [1, INTEGRATION PERIOD] is displayed on the right bottom clock in the first mode.
The envelope icon indicates that results selected in the profiles (path: MENU / INPUT / PROFILE x)
are logged.
Results presented in both statistic presentation modes during the measurements
6-12
G7 USER MANUAL
6.1.4
Setting on/off logger view - LOGGER
The possibility of the presentation of the measurement results, which are saved in the logger,
on the instrument’s display can be switched on or off placing or replacing the special character
in the displayed inversely line with the LOGGER text by means of the <
>, <
> push-buttons. In order
to confirm the selection the user has to press the <ENTER> push-button. This confirmation closes also
the DISPLAY MODES sub-list. The sub-list can be also closed after pressing the <ESC> push-button but
the settings made there are ignored.
Setting on and off the accessibility of LOGGER presentation mode
The results saved in the logger can be presented in three different modes which differ slightly each
other. These modes are changed after pressing the <ALT> and <
> or the <ALT> and <
> pushbuttons or they can be set in the VIEW (path: MENU / DISPLAY / DISPLAY SETUP / LOGGER VIEW /
VIEW).
Exemplary displays with the measurement results saved in the logger
6.1.5
Setting on/off the view of the file description - FILE INFO
The possibility of the additional file description presented on the instrument’s display can
be switched on or off placing or replacing the special character in the displayed inversely line
with the FILE INFO text by means of the <
>, <
> push-buttons. In order to confirm the selection
the user has to press the <ENTER> push-button. This confirmation closes also the DISPLAY MODES
sub-list. The sub-list can be also closed after pressing the <ESC> push-button but the settings made
there are ignored.
Setting on and off the file description presentation mode
In the FILE INFO window the file name, its size, date and time of the registration of the main results
(cf. App. B) and time (so-called ELAPSED TIME) during which the main results saved in the logger were
measured. The value presented there belongs to the range [1, INTEGRATION PERIOD] and depends on
the moment and the way the measurements were stopped.
Exemplary contents of the FILE INFO window
6-13
G7 USER MANUAL
_
6.2 Setting the parameters of the graphical modes - DISPLAY SETUP
The DISPLAY SETUP sub-list enables the user to change several parameters of the graphical
results presentations. Using the DISPLAY SCALE sub-list for example, one can select the scale
in the available modes of graphical presentation of the measurement results (time history in the LOGGER
and spectra in the SPECTRUM). Using the TOTAL VALUES sub-list it is possible to select the weighting
filters used in the calculation of the Total values. This sub-list appears on the display only in the case
of 1/1 OCTAVE or 1/3 OCTAVE analyser. Using the SPECTRUM TYPE sub-list, which appears
on the display only in VM, it is possible to select the spectrum type which has to be presented during
the vibration measurements. In order to enter the DISPLAY SETUP list one has to press the <ENTER>
push-button on the inversely displayed DISPLAY SETUP text of the DISPLAY list. The DISPLAY SETUP
sub-list is closed and the instrument returns to the DISPLAY after pressing the <ESC> push-button, which
ignores any changes in the positions of the sub-list or the <ENTER> push-button, which confirms
the changes.
DISPLAY list with the DISPLAY SETUP selected
6.2.1
Setting the scale of the presentation and the display’s grid - DISPLAY SCALE
The DISPLAY SCALE sub-list enables the user to change the scale in the available modes
of graphical presentation of the measurement results and switch on/off the grid. In order to enter this list
one has to press the <ENTER> push-button on the inversely displayed DISPLAY SCALE text
of the DISPLAY SETUP sub-list. The DISPLAY SCALE sub-list is closed and the instrument returns
to the DISPLAY SETUP sub-list after pressing the <ESC> (the settings made there are not confirmed) or
the <ENTER> push-button (the settings are confirmed).
a)
b)
c)
d)
DISPLAY SETUP windows in SLM (a), in VLM (b) in FFT (SM) (c) and in 1/1 and 1/3 OCTAVE (VM) (d)
6.2.1.1 Setting the scale of the measurement results presentation - SCALE
The SCALE position is accessible only in the case of vibration measurements (path: MENU /
FUNCTION / MODE / VIBR. METER). Two options are available: LIN (linear) and LOG (logarithmic).
In the case of the first one the graphical presentation and the units both are linear. In the latter case
the graphical presentation is given in the logarithmic scale and the measurement results are expressed in
decibels (the result is related to the values set in the REFERENCE LEVEL – path: MENU / SETUP /
REFERENCE LEVEL). It is possible to set the required option using the <
>, <
> push-buttons.
The confirmation of the selection is made by pressing the <ENTER> push-button. The return without
taking into account any change is made after pressing the <ESC> push-button. In the case of the sound
measurements the SCALE position is not active. All results are presented in the logarithmic scale.
Displays with the possible options of the vibration SCALE
6-14
G7 USER MANUAL
a)
b)
Measurement results (VM) presented in linear (a) and logarithmic (b) scale
6.2.1.2 Scaling the vertical axis of the graphical mode presentation - DYNAMIC
The DYNAMIC enables the user to select the proper scaling of the graphical mode presentation.
In the case of the vertical axis one can obtain the double, four times and eight times expansion
(as the default the vertical axis corresponds to 80 dB, after expansion it corresponds to 40 dB, 20 dB and
10 dB – respectively) using the <
>, <
> push-buttons and pressing the <ENTER> for the confirmation.
Displays with the possible values of the DYNAMIC parameter
Displays with the results stored in the logger presented with different DYNAMIC parameter
6.2.1.3
Scaling the horizontal axis of the graphical presentation - X–ZOOM
The X–ZOOM enables the user to change the horizontal axis in the SPECTRUM presentation
mode by means of the <
>, <
> push-buttons. In order to confirm the selection the user has to press the
<ENTER> push-button, which closes also the DISPLAY SCALE sub-list. The sub-list can be also closed
after pressing the <ESC> push-button but the settings made there are ignored. In 1/1 OCTAVE mode
available values are 3x, 4x and 5x. In 1/3 OCTAVE mode available values are 2x, 3x, 4x and 5x.
DISPLAY SCALE windows; the X–ZOOM selection
Displays in 1/1 OCTAVE SPECTRUM 3x, 4x, and 5x X–ZOOM
6-15
G7 USER MANUAL
_
Displays in 1/3 OCTAVE SPECTRUM 2x, 3x, 4x, and 5x X–ZOOM
Displays in FFT SPECTRUM 1x, 2x, 3x, 4x, and 5x X–ZOOM
6.2.1.4 Switching on/off the grid in the graphical mode presentation - GRID
The GRID enables the user to switch on or off the grid in any graphical presentation placing or
replacing the special character in the displayed inversely line with the GRID text by means of the <
>,
<
> push-buttons. In order to confirm the selection the user has to press the <ENTER> push-button. This
confirmation closes also the DISPLAY SCALE sub-list. The sub-list can be also closed
after pressing the <ESC> push-button but the settings made there are ignored.
Displays with the grid switched on and off
Displays with the grid switched on and off
6.2.1.5 Switching on/off the autoscale in the graphical mode presentation - AUTOSCALE
The AUTOSCALE enables the user to switch on or off the autoscaling of the plot in 1/1 OCTAVE or
1/3 OCTAVE spectrum presentation mode. The activation/deactivation of autoscale is made by placing or
replacing the special character in the displayed inversely line with the AUTOSCALE text by means of the
6-16
G7 USER MANUAL
push-buttons. In order to confirm the selection the user has to press the <ENTER> push-button. This
confirmation closes also the DISPLAY SCALE sub-list. The sub-list can be also closed after pressing the
<ESC> push-button but the settings made there are ignored.
Displays with the autoscale switched on and off
6.2.2
Selection of the Spectrum Type in VM - SPECTRUM TYPE
The SPECTRUM TYPE enables the user to change the spectrum type. This sub-list contains three
positions: ACCELERATION, VELOCITY and DISPLACEMENT and is available only in the case
of the vibration measurements.
In order to enter this sub-list one has to press the <ENTER> push-button on the inversely displayed
SPECTRUM TYPE text of the DISPLAY SETUP sub-list. The user can selected the required type
of the spectrum presented on the display by means of the <
>, <
> push-buttons.
The SPECTRUM TYPE window is closed and the instrument returns to the DISPLAY SETUP list after
pressing the <ESC> push-button, which ignores any changes in the positions of the sub-list or
the <ENTER> push-button, which confirms the changes.
DISPLAY SETUP window; the SPECTRUM TYPE text highlighted
SPECTRUM TYPE windows with the available values
6.2.3
Setting the parameters of the logger files presentation - SPECTRUM VIEW
The SPECTRUM VIEW enables the user to change the shape of the graphical presentation (VIEW)
and a TYPE parameter as well as to activate the presentation on the display the MAX and MIN spectrum.
In the VIEW position the EXTENDED, FULL and NORMAL views are available (by means
of the <
>, <
> push-buttons).
In the TYPE position the AVERAGED, INSTANTENOUS, MAX and MIN texts are available
(by means of the <
>, <
> push-buttons).
In order to enter this window one has to press the <ENTER> push-button on the inversely displayed
LOGGER VIEW text of the DISPLAY SETUP sub-list. The LOGGER VIEW window is closed and
the instrument returns to the DISPLAY SETUP sub-list after pressing the <ESC> (the settings made there
are not confirmed) or the <ENTER> push-button (the settings are confirmed).
6-17
G7 USER MANUAL
_
DISPLAY SETUP window; the SPECTRUM VIEW text highlighted
6.2.3.1 Selection of the graphical presentation type - VIEW
In the VIEW position the EXTENDED, FULL and NORMAL texts are available after pressing
the <
>, <
> push-buttons. These texts correspond to the slightly different data presented
on the display in the graphical presentation modes.
SPECTRUM VIEW windows; the VIEW selection
6.2.3.2 Selection of the spectrum type for the presentation - TYPE
In the TYPE position the AVERAGED, INSTANTENOUS, MAX and MIN texts are available
after pressing the <
>, <
> push-buttons. Each text corresponds to the different spectrum type
to be presented on the display in the graphical presentation modes.
SPECTRUM VIEW windows; the TYPE selection
6.2.3.3 Selection of the MAX spectrum for the presentation – MAX
In the MAX position the corresponding spectrum can be selected (by means of the <
>, <
> pushbuttons) to be presented on the display in the graphical presentation modes.
SPECTRUM VIEW windows, the MAX selection
6.2.3.4 Selection of the MIN spectrum for the presentation - MIN
In the MIN position the corresponding spectrum can be selected (by means of the <
>, <
> pushbuttons) to be presented on the display in the graphical presentation modes.
6-18
G7 USER MANUAL
SPECTRUM VIEW windows; the MIN selection
6.2.4
Selection of the Weighting Filters - TOTAL VALUES
The TOTAL VALUES, which is available only in 1/1 OCTAVE or 1/3 OCTAVE analysis, enables
the user to select the weighting filter.
In order to enter this window one has to press the <ENTER> push-button on the inversely displayed
TOTAL VALUES text of the DISPLAY SETUP sub-list. The TOTAL VALUES window is closed and
the instrument returns to the DISPLAY SETUP sub-list after pressing the <ESC> (the settings made there
are not confirmed) or the <ENTER> push-button (the settings are confirmed).
DISPLAY SETUP window; the TOTAL VALUES text highlighted
TOTAL VALUES windows; the weighting filters selection in SM
In the case of vibration mode after entering the TOTAL VALUES position on the display appears
sub-list with the TOTAL 1, TOTAL 2 and TOTAL3 positions. The selection of the position is made by
<
>, <
> push-buttons and pressing <ENTER> for the confirmation.
TOTAL VALUES windows in VM; the TOTALx selected
In the TOTALx window for user filters (S1, S2, S3) selected in the FILTER position, the TYPE and
CAL. F. positions appear on the display.
6-19
G7 USER MANUAL
_
TOTAL x windows; the weighting filters selection in VM
6.2.4.1 Selecting the type of the spectrum in VM to be presented - TYPE
In the TYPE three options are available: ACC (acceleration), VEL (velocity) and DIL
(displacement). The selection is made by <
>, <
> push-buttons and pressing <ENTER> to confirm.
TOTALx windows; the TYPE selection
6.2.4.2 Setting the calibration factor for the presented spectrum in VM - CAL. F.
In the CAL. F. the user can introduce CALIBRATION FACTOR value from -60.0 dB to 60.0 dB
using <
>, <
> push-buttons with 0.1 dB step, or using <
>, <
> push-buttons with the <SHIFT>
with 1 dB step. In order to confirm all changes made in this window the user has to press the <ENTER>.
After pressing <ESC> the settings made there are ignored and the instrument returns
to the TOTAL VALUES window.
TOTALx windows; CALIBRATION FACTOR setting
6.2.5
Setting the parameters of the logger files presentation - LOGGER VIEW
The LOGGER VIEW enables the user to change the shape of the graphical presentation and
a TIME parameter. In order to enter this window one has to press the <ENTER> push-button
on the inversely displayed LOGGER VIEW text of the DISPLAY SETUP sub-list. The LOGGER VIEW
window is closed and the instrument returns to the DISPLAY SETUP sub-list after pressing the <ESC>
(the settings made there are not confirmed) or the <ENTER> push-button (the settings are confirmed).
DISPLAY SETUP windows, the LOGGER VIEW text highlighted
6-20
G7 USER MANUAL
6.2.5.1 Selecting the shape of the graphical presentation - VIEW
LOGGER VIEW windows with the possible values of the VIEW parameter
The VIEW enables the user to select the shape of the graphical mode presentation. Three different
views are available which are called as NORMAL, FULL and EXTENDED. The selection is made
by means of <
>, <
> push-buttons and pressing the <ENTER> for the confirmation. The user can
achieve the same effect after pressing the <ALT> and <
> or the <ALT> and <
> push-buttons.
Displays with the possible values of the VIEW parameter
6.2.5.2 Setting the time to be presented - TIME
LOGGER VIEW windows with the possible values of the TIME parameter
The TIME enables the user to select the time to be presented with the logger’s file results.
The REAL TIME selection means that on the display the real time is visible, while AVAILABLE TIME
means that time after which the logger’s memory will be filled up by the current measurement result
is given there. The selection is made using the <
>, <
> push-buttons and pressing the <ENTER>
for the confirmation.
Displays with the possible values of the TIME parameter
6.3 Selection of the logger’s file to the display presentation - LOGGER VIEW
The LOGGER enables the user to examine the contents of the logger files. In order to open
this window the user has to press the <ENTER> push-button when the LOGGER VIEW text is displayed
inversely.
6-21
G7 USER MANUAL
_
DISPLAY list; the LOGGER VIEW text highlighted
•
•
•
•
•
•
•
•
•
In the first line the available still logger’s memory is displayed followed by:
The selected number of the logger’s file and the number of all saved files (FILE NO.:).
The name of the logger’s file (LOG.FILE:).
The number of the records in the file, which name is displayed in the previous line (RECORDS:).
The results saved (if any are present) in the logger from the first profile (P(1):).
The results saved (if any are present) in the logger from the second profile (P(2):).
The results saved (if any are present) in the logger from the third profile (P(3):).
The type of spectrum (if 1/1 OCTAVE , 1/3 OCTAVE or FFT ).
The size of the remaining free memory for logger files (FREE:).
The size of the available memory for logger file (AVAILABLE:).
Displays in the LOGGER VIEW sub-list
The change of the number of the logger’s file is done by pressing the <
>, <
> push-buttons.
Displays in the LOGGER VIEW sub-list; the selection of the file to be seen
The size of the FREE memory for logger files is equal to the size of the AVAILABLE memory for
logger file in the case when the logger files were not deleted from the memory. If it has happened,
the FREE memory is always smaller than AVAILABLE.
In order to increase the free memory space and achieve the available one, the user has to perform
the defragmentation (path: MENU / FILE / DEFRAGMENTATION / LOGGER DEFRAGMENT.).
Displays in the LOGGER VIEW sub-list; the scrolling of the file to be seen
The display of the instrument after entering the LOGGER VIEW looks as on the figure below
in the case when the logger’s file does not exist (there was no measurement or the measurements were
performed but with the settings LOGGER: Off (path: MENU / INPUT / MEASUREMENT SETUP).
6-22
G7 USER MANUAL
Display in the LOGGER VIEW sub-list in the case when the files do not exist
The contents of the selected logger’s file is displayed after pressing the <ENTER> push-button.
The cursor position is changed after pressing the <
>, <
> push-buttons. The left end of the graphical
presentation is reached immediately after pressing the <SHIFT> and <
> while the right end - after
pressing the <SHIFT> and <
> push-buttons.
The type of the registered result, the number of the profile the result is coming from, the related
time from the beginning of the registration, the value with the units and the indicator of the filter
are presented in the NORMAL and EXTENDED logger’s view mode on the right side of the display.
Displays with the selected logger’s file; the change of the cursor position
The scrolling of the display to the right is made when the cursor is at the left end of the graphical
presentation space and the <
> push-button is still pressed and in the file there are still the results.
Displays with the selected logger’s file; the scrolling to the right
The scrolling of the display to the left is made when the cursor is at the right end of the graphical
presentation space and the <
> push-button is still pressed and in the file there are still the results.
Displays with the selected logger’s file; the scrolling to the left
The position of the horizontal axis in relation to the vertical one can be changed after pressing
the <
>, <
> push-buttons together with the <SHIFT> one.
Displays with the selected logger’s file; the change of the axis relation
6-23
G7 USER MANUAL
_
The results from logger’s file, coming from different profiles, are changed after pressing the <
> or
<
> push-buttons – after each pressing the result from the next profile is displayed.
Displays with the selected logger’s file; the change of the profile
The results from logger’s file, coming from the same profile, are displayed after each pressing
of the <ALT> and <
> or <ALT> and <
> push-buttons.
Displays with the selected logger’s file; the change of the result from a profile
6.4 Setting the parameters of the display - SCREEN SETUP
The SCREEN SETUP window enables the user to set the proper contrast of the display and switch
on the backlight’s automatic switch off after a certain period (30 seconds). In order to enter the window
one has to press the <ENTER> push-button on the inversely displayed SCREEN SETUP text
of the DISPLAY list. The SCREEN SETUP window is closed and the instrument returns to the DISPLAY
list after pressing the <ESC> or the <ENTER> push-button.
DISPLAY list; the SCREEN SETUP text highlighted
6.4.1
Setting the contrast of the display - CONTRAST
The CONTRAST enables the user to set the proper contrast of the display (by means of the <
>,
<
> push-buttons). The position is opened after pressing the <ENTER> push-button on the highlighted
(displayed inversely) CONTRAST text. The user can select 21 different values of this parameter.
Notice: The new value of the contrast is confirmed after each pressing of the <
> or <
>
push-buttons (new value is selected without any confirmation from the <ENTER> push-button).
The window is closed and the instrument returns to the DISPLAY list after pressing the <ESC> or
<ENTER> push-button.
6-24
G7 USER MANUAL
SCREEN SETUP windows; the change of the contrast
6.4.2
Automatic switch off of the backlight - BACKLIGHT TIMEOUT
Taking into account the saving of the internal source of the instrument’s power the backlight should
be used relatively rare. It is possible to set the backlight’s automatic switch off. In the case when
this option is set, after 30 seconds from pressing any push-button the backlight is switched off.
If it happened, the first pressing of any push-button would cause the switch on of the backlight.
The confirmation of the selection is made by pressing the <ENTER> push-button. The return without
taking into account any change is made after pressing the <ESC> push-button.
b)
a)
SCREEN SETUP windows; the BACKLIGHT TIMEOUT active (a), and not active (b)
6.5 Checking the state of the internal battery - BATTERY
The BATTERY enables the user to check the internal battery condition. In order to enter
the window one has to press the <ENTER> push-button on the inversely displayed BATTERY text
of the DISPLAY list. The BATTERY window is closed and the instrument returns to the DISPLAY list after
pressing the <ESC> or the <ENTER> push-button.
DISPLAY window with BATTERY text highlighted
The instrument can be powered from the external power supplier, from the external battery pack,
from four AA standard or AA rechargeable batteries or from the USB interface when its USB Device
socket is connected by means of the cable to a PC. The view presented on the display in each case is
different. The current battery voltage is displayed together with its approximate state (in the graphical
form).
BATTERY windows for different sources powering the instrument
6.6 Checking specification of the instrument - UNIT LABEL
6-25
G7 USER MANUAL
_
The UNIT LABEL enables the user to check the type of the instrument, its serial number,
the current software versions installed in it and the standards, which the instrument fulfils. In order
to enter the list one has to press the <ENTER> push-button on the inversely displayed UNIT LABEL text
of the DISPLAY list. The UNIT LABEL sub-list is closed and the instrument returns to the DISPLAY list
after pressing the <ESC> or the <ENTER> push-button.
DISPLAY list; the UNIT LABEL text highlighted
After pressing the <
>, <
> (or <
>, <
>) push-buttons the displayed text is scrolled on the
display and the user can check the number of the standard fulfilled by the instrument and the current
software version number. The window is closed and the instrument returns to the DISPLAY list after
pressing the <ESC> or <ENTER> push-button.
UNIT LABEL windows opened and after scrolling with the <
>, <
> push-buttons
Notice: The contents of the UNIT LABEL should be always transmitted to the Svantek’s
service in the case of any problems faced by the user during the instrument’s operation.
6-26
G7 USER MANUAL
7 SAVING THE MEASUREMENT RESULTS - FILE
The registration of the measurement results is an essential task for the efficient use
of the instrument. All available measurement results can be stored in the FLASH type memory
of the instrument or on the USB memory stick.
There are two main ways for storing the measurement data in the instrument:
1. Save files containing the main results and setup settings using the FILE list.
2. Save data in the logger’s file.
Notice: The instrument’s logger memory is independent from the results and setup
memory. The capacity of the available memory is equal to 32 MB and is divided between logger
(16 252 428 bytes) and results and setup settings (15 859 224 bytes).
Notice: All of the options (except DEFRAGMENTATION) from the FILE list can be used for
the USB memory stick.
Saving files
•
•
•
•
•
•
•
•
In the case of the G7 instrument there are files containing data:
from Sound LEVEL METER;
from Vibration LEVEL METER;
from 1/1 OCTAVE analysis;
from 1/3 OCTAVE mode;
from DOSE METERmode;
from FFT analysis;
from RT60 mode;
stored in the instrument’s logger (accessible in the DISPLAY / LOGGER VIEW window).
Notice: The logger files are created automatically (the usage of the SAVE is not
required).
•
•
•
•
•
•
Each file consists of some elements, which are the same for all kind of files:
a file header;
the unit and software specification;
the user’s text stored together with the measurement data;
the parameters and global settings;
the special settings for profiles;
the marker of the end of the file.
The other elements of the file structure depend on the type of the file (SLM, VLM, 1/1 OCTAVE,
1/3 OCTAVE, DOSE METER, FFT, RT60, logger) and on the setting of SAVE STAT. (path: MENU / FILE
/ SAVE OPTIONS / SAVE STAT.). These elements are as follows:
• the main results;
• the results coming from 1/1 OCTAVE analysis;
• the results coming from 1/3 OCTAVE analysis;
• the results coming from DOSE METER mode;
• the header of the FFT analysis performed in the selected band;
7-1
G7 USER MANUAL
•
•
•
•
•
•
•
•
_
the FFT analysis results;
the results coming from RT60 mode;
the statistics header;
the results of statistical analysis;
the header of the statistical analysis performed in 1/1 OCTAVE or 1/3 OCTAVE analysis;
the results of the statistical analysis performed in 1/1 OCTAVE or 1/3 OCTAVE analysis;
the header of the file from the logger;
the data stored during the measurements in the logger’s file.
Notice: The detailed description of all types of file structures is given in the Appendix B.
Storing the sound measurement results as files in the instrument’s FLASH DISC can be done
by means of the FILE list. In order to open, the FILE list the user has to:
• press the <MENU> push-button,
• select from the main list, using the <
>, <
> or <
>, <
> push-buttons, the FILE text (highlight
it inversely),
• press the <ENTER> push-button.
Main list; the FILE text highlighted (displayed inversely)
The FILE list contains the following items:
SAVE
SAVE OPTIONS
LOAD
enables one to save the measurement results as a file in the instrument’s
memory;
enables one to set the options of the measurement result savings;
DELETE
enables one to load to the working space of the instrument’s memory
the measurement results saved in a file;
enables one to delete a selected file from the instrument’s memory;
DELETE ALL
enables one to delete all files from the instrument’s memory;
DEFRAGMENTATION
enables one to consolidate the flash memory after deleting some files from it;
enables one to overview the catalogue of the files saved in the instrument’s
memory;
informs the user about the capacity of the instrument’s memory still available
for storing the measurement results:
enables one to save the setup as a file in the instrument memory;
CATALOGUE
FREE SPACE
SAVE SETUP
LOAD SETUP
enables one to load to the working space of the instrument’s memory the selected
setup saved in a file;
DIRECTORY
this position appears only in case when external USB memory stick is connected
to the instrument; it informs the user about connected memory stick, the free
space on USB memory stick, number of directory, the number of files, enables
also to edit the name of the directory;
COPY FILES TO USB this position appears only in when the external USB memory stick is connected
to the instrument; it enables to copy files from the internal memory
of the instrument to the connected USB memory stick;
MOVE FILES TO USB this position appears only in case when USB memory stick is connected
to the instrument; it enables the user to move files from the internal memory
of the instrument to the connected USB memory stick.
7-2
G7 USER MANUAL
Pressing the <SHIFT> and <
> (or <SHIFT> and <
>) results in a movement to the first position
of the opened list and pressing the <SHIFT> and <
> (or <SHIFT> and <
>) results in a movement
to the last position of the opened list.
FILE list of the instrument
In each available position any change is performed by means of the <
>, <
> push-buttons.
In order to confirm the selection the <ENTER> push-button has to be pressed. After this confirmation,
the opened window or list is closed. In order to ignore any changes made in the opened window or list
the user has to press the <ESC> push-button.
7.1
Saving files in the instrument’s memory - SAVE and SAVE NEXT
The SAVE is used for storing data in the internal non-volatile (FLASH DISC) memory (files
are always written at the beginning of a free continuous space) as a file (see Appendix B for the file
formats). In order to enter the window the user has to select the SAVE text in the FILE list, using
the <
> (or <
>) push-button and press the <ENTER> push-button. There are two available functions:
the SAVE NEXT – save a file with the name increased by one, and SAVE – save a file with the edited
name. These functions are available after pressing the <
>, <
> push-buttons.
SAVE window in the FILE list
The name of the file, in which the measurements results are to be saved, is displayed above
the SAVE or SAVE NEXT text. The default name for a file is displayed in the case of the first entering
to this position (after power on). The default name consists of the day and the month’s abbreviation.
The line of the file’s name edition (FILE NAME) is opened after pressing the <
> push-button.
The user can skip the file’s name edition and start saving file pressing the <ENTER> push-button
or return to the FILE list pressing the <ESC> one.
The edition process is presented on the Figure below. The displayed inversely character
is currently edited. The <
>, <
>, <
>, <
> and <SHIFT> push-buttons are used for editing the name
which cannot exceed eight characters.
Display during the process of setting the character in the edited name
One can select the position of the character in the edited text using the <
>, <
> push-buttons.
7-3
G7 USER MANUAL
_
Display during the selection of the character’s position to be edited
The available ASCII characters can be changed using the <
> (or <
>) push-button pressed
together with the <SHIFT> one. The subsequent digits, underline, big letters and space appear on
the display in the inversely displayed position after each pressing of the mentioned above push-buttons.
...
...
Display during the selection of the character
FILE NAME edition after pressing the <SHIFT> and <> push-buttons
FILE NAME edition after pressing the <SHIFT> and <> push-buttons
The edited name is accepted and the file is saved after pressing the <ENTER> push-button.
The special warning is displayed in the case the file with the edited name already exists in the memory.
The instrument waits then for a reaction of the user (any push-button should be pressed except
the <SHIFT> or the <ALT> one).
7-4
G7 USER MANUAL
Displays during the attempt of overwriting the existing file, changing the name and saving data
All changes introduced to the file name during the edition are ignored after pressing the <ESC>
push-button. This pressing causes the return to the list from which the SAVE option was entered.
The return after the edition to the line with the SAVE or SAVE NEXT text is possible after pressing
the <
> push-button.
The simplified edition consists in the addition at the end of the file name the natural number.
The increase by one of the number is made automatically. After the execution of the saving operation the
new file name is displayed and the instrument waits then for a reaction of the user (any push-button
should be pressed except the <SHIFT> or the <ALT> one). In the next attempt of saving data, the new
name is displayed in the FILE NAME line and that name is increased by one during the saving operation.
Displays in the simplified edition of the file name and the execution of the saving operation
The number can be changed from 0 to N. The only limitation of the N value is the length of the file
name, which cannot be longer than eight characters. In the case, when such limitation is achieved and
the instrument can not change automatically the file’s name the only possibility is to edit new file name.
Notice: The files can be overwritten (the use of the same file name) without any warning
if the REPLACE option is switched on (path: MENU / FILE / SAVE OPTIONS / REPLACE).
Displays in the simplified edition of the file name, saving and the “saturation” of that operation
As it was already written, the instrument attempts to save a file after pressing the <ENTER> pushbutton. The saving is not possible in the case when the instrument is measuring the signal. The special
message is displayed for about 3 seconds in this case and the instrument returns to the SAVE window.
Displays after the attempt to perform unavailable saving operation and the return to the SAVE NEXT
The presented below message is displayed after trying to execute the save operation in the case
when no measurements were performed and there are no results to be saved. The instrument then waits
7-5
G7 USER MANUAL
_
for the reaction of the user (any push-button should be pressed except the <SHIFT> or the <ALT> one)
and after pressing a push-button it returns to the SAVE window.
Display after the SAVE operation when there were no results for storing
Notice: During the execution of the SAVE or SAVE NEXT function an additional window
is displayed informing about the operation performed. In the case of short files, this window can
be unnoticed by the user.
View of all displays during and after the execution of the SAVE operation
As it was already written, it is not possible to store the data in the file, which already exists, when
the REPLACE is not active ([ ]) (path: MENU / FILE / SAVE OPTIONS / REPLACE). The presented
below sequence of displays illustrates the situation when during the name edition process the user
selected the name, which was used before. The instrument displays a special message and waits for the
reaction of the user (any push-button should be pressed except the <SHIFT> or the <ALT> one) and
after pressing a push-button it returns to the FILE list.
Displays after the attempt to overwrite a file if the REPLACE is not active
Notice: The direct access to the SAVE / SAVE NEXT function is possible after pressing
simultaneously the <ENTER> and <ALT> push-buttons if the DIRECT SAVE option is switched off
(path: MENU / FILE / SAVE OPTIONS / DIRECT SAVE). In another case, (DIRECT SAVE option is
switched on) the results are saved, after pressing these push-buttons, in the file with the automatically
incremented name.
Notice: After the usage of the <ENTER> and <ALT> push-buttons (if the DIRECT SAVE
option is switched on) the measurement results are saved only once. The following pressing
will not cause any instrument’s reaction unless next measurement is performed. The same result
can be saved in the multiply number of files only using the SAVE / SAVE NEXT function.
Finely, let us present some examples showing the occupation of the result files memory and
the logger files memory after the execution of the saving operation.
7-6
G7 USER MANUAL
Example 1. Let us assume the settings presented below where one measurement is performed
with the integration period equal to 10 seconds, nothing is saved in the logger and the statistics are not
stored. The measurement results are saved in the file named @EXAMP1.
=>
Settings and the FILE INFO after the performed measurements
The size of the file is equal to 466 bytes and it is visible in the FILE INFO window. The detailed
description of the level-meter file structure is given in App. B. The @EXAMP1 file saved in the result files
memory decreases the amount of the FREE SPACE and TOTAL AVAILABLE memory
by the value of the file size (466 bytes) plus 4 bytes containing the addresses of the previous file and
4 bytes containing the address of the next file (all together 474 bytes). The size of the logger files memory
(the LOGGER FREE SPACE and LOGGER AVAILABLE) is not changed as the LOGGER (path: MENU /
INPUT / MEASUREMENT SETUP) was not activated.
=>
FREE SPACE window before and after saving the @EXAMP1 file
Example 2. Let us assume the settings presented below where one measurement is performed
with the integration period equal to 10 seconds, nothing is saved in the logger but this time the statistics
are also stored. The measurement results are saved in the file named @EXAMP2.
=>
Settings and the FILE INFO after the performed measurements
The size of the file is now equal to 1946 bytes and it is visible in the FILE INFO window.
The detailed description of the level-meter file structure is given in App. B. The @EXAMP2 file saved in
the result files memory decreases the amount of the FREE SPACE and TOTAL AVAILABLE memory by
the value of the file size (1946 bytes) plus 4 bytes containing the addresses of the previous file and
4 bytes containing the address of the next file (all together 1954 bytes). The size of the logger files
memory (the LOGGER FREE SPACE and LOGGER AVAILABLE) is not changed as the LOGGER
(path: MENU / INPUT / MEASUREMENT SETUP) was not activated.
=>
FREE SPACE window before and after saving the @EXAMP2 file
7-7
G7 USER MANUAL
_
Example 3. Let us assume the settings presented below where one measurement is performed
with the integration period equal to 10 seconds, the statistics are not saved but this time the LOGGER
is activated (On). The measurement results are saved in the file named @EXAMP3.
Settings before the execution of the measurements
All together eight different results coming from PROFILE 1 (PEAK, MAX, MIN and RMS),
PROFILE 2 (PEAK and RMS) and PROFILE 3 (MAX and MIN) (path: MENU / INPUT / PROFILE x) are
saved every 100 milliseconds. Therefore, during 10 seconds integration period it gives 10*10=100
RECORDS (path: MENU / DISPLAY / LOGGER VIEW), each containing eight values (each two-bytes
long). All results are saved in the logger’s file named &LOG100. The exact size of the &LOG100 is not
displayed, only the approximate value (2 kilobytes) can be visible in the logger files delete window (path:
MENU / FILE / DELETE / LOGGER FILES).
=>
Settings for the current measurements
=>
FILE INFO during and after the measurements
The size of the file is equal to 466 bytes and it is visible in the FILE INFO window. The detailed
description of the level-meter file structure is given in App. B. The @EXAMP3 file saved in the result files
memory decreases the amount of the FREE SPACE and TOTAL AVAILABLE memory
by the value of the file size (466 bytes) plus 4 bytes containing the addresses of the previous file and
4 bytes containing the address of the next file (all together 474 bytes). The size of the logger files memory
(the LOGGER FREE SPACE and LOGGER AVAILABLE) is also decreased by the value
of 2064 bytes (8 bytes for the addresses, 1682 bytes for the selected results from the profiles and
374 bytes for the additional information described in details in App. B).
=>
FREE SPACE window before and after saving the @EXAMP3 and &LOG100 files
Example 4. Let us assume the settings presented below where one measurement is performed
with the integration period equal to 10 seconds, the statistics are saved and the LOGGER is activated
(On). The measurement results are saved in the file named @EXAMP4.
7-8
G7 USER MANUAL
Settings before the execution of the measurements
All together eight different results coming from PROFILE 1 (PEAK, MAX, MIN and RMS),
PROFILE 2 (PEAK and RMS) and PROFILE 3 (MAX and MIN) (path: MENU / INPUT / PROFILE x)
are saved every 100 milliseconds. Therefore, during 10 seconds integration period it gives 10*10=100
RECORDS (path: MENU / DISPLAY / LOGGER VIEW), each containing eight values (each two-bytes
long). All results are saved in the logger’s file named &LOG101. The exact size of the &LOG101 is not
displayed, only the approximate value (2 kilobytes) can be visible in the logger files delete window (path:
MENU / FILE / DELETE / LOGGER FILES).
=>
=>
Settings and the FILE INFO during and after the measurements
The size of the file is equal to 1946 bytes and it is visible in the FILE INFO window. The detailed
description of the level-meter file structure is given in App. B. The @EXAMP1 file saved in the result files
memory decreases the amount of the FILES FREE SPACE and TOTAL AVAILABLE memory
by the value of the file size (1946 bytes) plus 4 bytes containing the addresses of the previous file and
4 bytes containing the address of the next file (all together 1954 bytes). The size of the logger files
memory (the LOGGER FREE SPACE and LOGGER AVAILABLE) is also decreased by the value of
2064bytes (8 bytes for the addresses, 1682 bytes for the selected results from the profiles and 374 bytes
for the additional information described in details in App. B).
=>
FREE SPACE window before and after saving the @EXAMP4 and &LOG100 files
All four result files: @EXAMP1, @EXAMP2, @EXAMP3 and @EXAMP4 and two logger files:
&LOG100 and &LOG101 described in the examples, are visible in the CATALOGUE window (path:
MENU / FILE / CATALOGUE).
7.2
Controlling the data storing in the instrument’s memory - SAVE OPTIONS
The SAVE OPTIONS sub-list is used for the selection of the options of data storing in the
FLASH DISC memory of the instrument. The sub-list is opened after pressing the <ENTER> push-button
when the SAVE OPTIONS text in the FILE list is displayed inversely (selected using the <
>, <
>
7-9
G7 USER MANUAL
_
(or <
>, <
>) push-buttons). The return to the FILE list is possible after pressing the <ESC> pushbutton.
FILE list with the SAVE OPTIONS text highlighted (displayed inversely)
It is possible to write data into the same part of the memory starting all the time with the same
address (RAM FILE), to replace the existing in the memory file by the new with the same name
(REPLACE), to add to the results the statistics of the measurements (SAVE STAT.), to save
automatically the results of the measurements (AUTO SAVE). The position of the sub-list is changed after
pressing the <
>, <
> push-buttons. In order to confirm the selection the <ENTER> push-button has to
be pressed. Such pressing closes also the opened sub-list.
7.2.1
Saving data starting from the same address - RAM FILE
The measurement data usually are saved in the different files in the flash memory
of the instrument. There is also possibility to save data in RAM file starting from the same address.
It means that each time the data are saved the previous file is overwritten. This option is useful
for the permanent monitoring and remote reading data from the instrument by means of any available
interface with the proper period. In order to read data saved in a RAM file one has to use #4,3 function
described in details in App. A.
The RAM FILE is switched on after placing the special character ([√
√]) in the inversely displayed
position in the line with the RAM FILE text. The activation or deactivation of the RAM FILE is done
by pressing the <
>, <
> push-buttons.
SAVE OPTIONS sub-list; the selection of the RAM FILE
After pressing the <ENTER> push-button the selections made in any position of the sub-list
(in particular also in the RAM FILE) are confirmed and the sub-list is closed. In the case when
the AUTO SAVE was active ([√
√]), after pressing the <ENTER> push-button the FILE NAME window
is opened for editing the names for the AUTO SAVE files. The SAVE OPTION is closed ignoring
all settings made in it after pressing the <ESC> push-button.
The RAM FILE functionality is available only in the LEVEL METER, 1/1 OCTAVE and 1/3 OCTAVE
mode. In the DOSE METER, FFT, RT60, modes the line with the RAM FILE text does not appear
on the display after entering the SAVE OPTIONS sub-list.
7.2.2
Replacement of the existing files by the new ones - REPLACE
The result of the attempt to save the file with the name, which already exists in the memory,
depends on the setting of the REPLACE. It is possible to erase the old file and to save the new one
with the same name if the position is active ([√
√]). The activation or deactivation of the REPLACE is done
by pressing the <
>, <
> push-buttons.
7-10
G7 USER MANUAL
SAVE OPTIONS sub-list; the selection of the REPLACE
SAVE OPTIONS window without RAM FILE position; the selection of the REPLACE
The message is displayed that such operation is not available in the case when this position is not
active ([ ]) – cf. the description of the SAVE. In the other case, the existing file is overwritten.
Displays during the file saving when the REPLACE is switched off and on
After pressing the <ENTER> push-button the selections made in any position of the sub-list
(in particular also in the REPLACE) are confirmed and the sub-list is closed. In the case when
the AUTO SAVE was active ([√
√]), after pressing the <ENTER> push-button the FILE NAME window
is opened for editing the names for the AUTO SAVE files. The SAVE OPTION sub-list is closed ignoring
all settings made in it after pressing the <ESC> push-button.
7.2.3
Controlling the measurement statistics savings - SAVE STATISTICS
The SAVE STATISTICS is used to set self saving, together with the measurement results,
the statistics of the measurements ([√
√]) or to switch off ([ ]) this possibility. Together
with the measurements 100-class statistics are calculated (the values named from L01 to L99).
The activation or deactivation of the SAVE STATISTICS is done by pressing the <
>, <
> push-buttons.
Notice: This position was created to save the memory of the instrument in the case when the
knowledge of the statistics is not necessary. Each registration of the statistics requires 600 bytes of
the memory! Ten selected statistic levels are always saved with the main results.
SAVE OPTIONS sub-list; the selection of the SAVE STATISTICS
7-11
G7 USER MANUAL
_
SAVE OPTIONS window without RAM FILE position; the selection of the SAVE STATISTICS
After pressing the <ENTER> push-button the selections made in any position of the sub-list
(in particular also in the SAVE STAT.) are confirmed and the sub-list is closed. In the case when
the AUTO SAVE was active ([√
√]), after pressing the <ENTER> push-button the FILE NAME window
is opened for editing the names for the AUTO SAVE files. The SAVE OPTION sub-list is closed ignoring
all settings made in it after pressing the <ESC> push-button.
7.2.4
Controlling the measurement results savings - AUTO SAVE
Using the AUTO SAVE one can set the self-saving of the measurement results ([√
√]) or to switch off
([ ]) this possibility. The activation or deactivation of the AUTO SAVE is done by pressing the <
>, <
>
push-buttons. This position was also established in order not to waist too much memory
of the instruments when the self-saving is not necessary.
SAVE OPTIONS sub-list; the selection of the AUTO SAVE
Notice: The AUTO SAVE function can be performed only in the case when
the INTEGR. PERIOD (path: MENU / INPUT / MEASUREMENT SETUP) is not less than 10 seconds.
If it is less than 10 seconds, the measurement results are not saved without any indication of that fact!
There is only one exception - when the REP. CYCLE (path: MENU / INPUT / MEASUREMENT SETUP)
is equal to one, the AUTO SAVE function is executed disregarding the value of the integration period.
SAVE OPTIONS sub-list; the selection of the AUTO SAVE in DOSE METER
The FILE NAME window is opened after switching on the AUTO SAVE function and pressing
the <ENTER> push-button. After pressing the <ESC> push-button the FILE NAME window is closed and
the instrument returns to the SAVE OPTION, but with the AUTO SAVE function switched off.
Displays during the execution of the AUTO SAVE switching on; the FILE NAME skipping and return to the
SAVE OPTION sub-list
7-12
G7 USER MANUAL
When the integration period is too short for switching on the AUTO SAVE option the following
message appears on the display:
Display after attempt of switching on AUTO SAVE option with too short INT. PERIOD
The FILE NAME window is closed after pressing the <ENTER> push-button with the confirmation
of the AUTO SAVE function switched on and the user interface returns to the FILE list.
Displays during the execution of the AUTO SAVE switching on; the FILE NAME confirmation and return to
the FILE list
The edition of the file name in the FILE NAME window is performed almost in the same way
as it was described in the case of the SAVE / SAVE NEXT function. The displayed inversely character
is currently edited. The <
>, <
>, <
>, <
> and <SHIFT> push-buttons are used for editing the name
which cannot exceed eight characters including the starting special character @ which cannot be edited.
One can select the proper position of the character in the edited text using the <
>, <
> push-buttons.
The available ASCII characters can be changed using the <
> (or <
>) push-button pressed together
with the <SHIFT> one. Additionally, the character can be also changed using the <
> (or <
>) pushbutton (this functionality is not available in the SAVE / SAVE NEXT function). The subsequent digits,
underline, big letters and space appear on the display in the inversely displayed position after each
pressing of the mentioned above push-buttons.
The edition is finished after pressing the <ENTER> push-button. The edited name is compared
with the file names existing in the catalogue. In the case when the file with the same name already exists,
the special message is displayed and after pressing any character except the <SHIFT> or <ALT> one,
the instrument returns once more to the FILE NAME window.
Displays after the incorrect file name edition
When the AUTO SAVE option is active ([√
√]), after starting the measurements by pressing
the <START/STOP> push-button the results are saved in the file with the selected name. Depending on
the instrument’s mode and selected options the sequence of the displays available after each pressing
of the <
> or <
> could be as presented below.
7-13
G7 USER MANUAL
_
Measurement results (SM) presented after pressing the <> or <> push-buttons
Measurement results (VM) presented after pressing the <> or <> push-buttons
In the case when from a profile more than one result was saved in the logger’s file, the other results
are presented after pressing the <
>, <
> push-buttons together with the <ALT> one.
Results saved from a profile presented after pressing the <> or <> and <ALT> push-buttons
Results saved from a profile presented after pressing the <> or <> and <ALT> push-buttons
After pressing the <
> or <
> and <ALT> push-buttons the VIEW is changed (path: MENU /
DISPLAY / DISPLAY SETUP / LOGGER VIEW / VIEW). So, after pressing these push-buttons and then
repeating the previous sequence (the <
>, <
> push-buttons together with the <ALT> one) the user can
observe the displays presented below.
Results saved from a profile presented after pressing the <> or <> and <ALT> push-buttons
Another measurement is started after next pressing of the <START/STOP> push-button.
The measurement is stopped after the selected INTEGR. PERIOD (path: MENU / INPUT /
MEASUREMENT SETUP / INTEGR. PERIOD) names of the next saved files are automatically
7-14
G7 USER MANUAL
incremented by one. The same remarks are valid in this case as it was already stated in the description
of the SAVE NEXT function.
7.2.5
Direct access to the SAVE / SAVE NEXT function - DIRECT SAVE
The DIRECT SAVE enables one to select the instrument’s reaction on the simultaneous pressing
of the <ENTER> and <ALT> push-buttons. If this option is not active ([ ]), after pressing these pushbuttons the SAVE window is accessed (if the measurements are not performed). If the option is active
([√
√]), after pressing the <ENTER> and <ALT> push-buttons the results are saved in the file with
the automatically incremented name and the proper message is displayed for a few seconds. The proper
setting of the DIRECT SAVE is done by pressing the <
>, <
> push-buttons.
SAVE OPTIONS sub-list; the selection of the DIRECT SAVE
SAVE OPTIONS window without RAM FILE position; the selection of the DIRECT SAVE
After pressing the <ENTER> push-button the selections made in any position of the sub-list
(in particular also in the DIRECT SAVE) are confirmed and the sub-list is closed. In the case when
the AUTO SAVE was active ([√
√]), after pressing the <ENTER> push-button the FILE NAME window
is opened for editing the names for the AUTO SAVE files. The SAVE OPTION sub-list is closed ignoring
all settings made in it after pressing the <ESC> push-button.
During the execution of the measurements pressing the <ENTER> and <ALT> push-buttons
causes, disregarding the option set in the DIRECT SAVE, that the message presented below
is displayed.
Display after the attempt to perform an unavailable operation during measurement in progress
The presented below displays illustrates the difference in the user interface execution
after pressing the <ENTER> and <ALT> push-buttons in the case when the measurements are not
performed and the DIRECT SAVE is not active ([ ]) and active ([√
√]).
=> <ENTER> =>
Exemplary executions of the software with the DIRECT SAVE not active
7-15
G7 USER MANUAL
_
Exemplary executions of the software with the DIRECT SAVE active
7.2.6
Saving maximum values in the spectrum - SAVE MAX SPECT.
The SAVE MAX SPECT. enables the user to save the highest values of the INSTANTENEOUS
spectra (calculated with 100-milliseconds time step) in 1/1 OCTAVE or 1/3 OCTAVE analysis, which
occured during the INTEGR. PERIOD set in the INPUT list (path: MENU / INPUT /
MEASUREMENT SETUP / INTEGR. PERIOD).
The activation or deactivation of the SAVE MAX SPECT. is done by pressing the <
>, <
> pushbuttons. After pressing the <ENTER> push-button the activation is confirmed. The SAVE OPTION sub-list
is closed ignoring all settings made in it after pressing the <ESC> push-button.
a)
b)
SAVE OPTIONS sub-list; the selection of the SAVE MAX SPECT. in SM (a) and in VM (b)
To see the MAX values on the display during the the real time 1/1 OCTAVE or 1/3 OCTAVE
analysis measurement the user has to activate the option in the DISPLAY list (path: MENU / DISPLAY /
DISPLAY SETUP / SPECTRUM VIEW / MAX or path: MENU / DISPLAY / DISPLAY MODES /
SPECTRUM).
7.2.7
Saving the lowest values in the spectrum - SAVE MIN SPECT.
The SAVE MIN SPECT. enables the user to save the lowest values of the INSTANTENEOUS
spectra (calculated with 100-milliseconds time step) in 1/1 OCTAVE or 1/3 OCTAVE analysis, which
occured during the INTEGR. PERIOD set in the INPUT list (path: MENU / INPUT /
MEASUREMENT SETUP / INTEGR. PERIOD).
The activation or deactivation of the SAVE MIN SPECT. is done by pressing the <
>, <
> pushbuttons. After pressing the <ENTER> push-button the activation is confirmed. The SAVE OPTION sub-list
is closed ignoring all settings made in it after pressing the <ESC> push-button.
a)
b)
SAVE OPTIONS sub-list; the selection of the SAVE MIN SPECT. in SM (a) and in VM (b)
To see the MIN values on the display during the real time 1/1 OCTAVE or 1/3 OCTAVE analysis
the user has to activate the option in the DISPLAY list (path: MENU / DISPLAY / DISPLAY SETUP /
SPECTRUM VIEW / MIN with active SPECTRUM mode or path: MENU / DISPLAY / DISPLAY MODES /
SPECTRUM).
7-16
G7 USER MANUAL
7.3
Loading the files with the measurement results - LOAD
The LOAD is used for loading data file from the FLASH DISC (e.g. for the verification or
comparison). The position is opened after pressing the <ENTER> push-button when the LOAD text in
the FILE list is displayed inversely (selected using the <
>, <
> (or <
>, <
>) push-buttons).
The return to the FILE list is possible after pressing the <ESC> push-button.
FILE list with the LOAD text highlighted (displayed inversely)
Notice: It is not possible to load the file during the execution of the measurements.
On such attempt the message: MEASUREMENT IN PROGRESS is displayed for about 3 seconds.
After pressing the <ENTER> push-button the instrument checks its current state. In the case when
the measurements are performed, the file loading is impossible and the message is displayed.
Display after the attempt to perform an unavailable operation during measurement in progress
In the case when the instrument memory is empty (no file is stored), after entering the LOAD
window the NO FILES text is displayed and the instrument waits for the reaction of the user. The user
should press then the <ESC>, <ENTER> (the instrument returns to the FILE list) or <START / STOP>
push-button (the instrument starts the measurement).
Display during the execution of the LOAD operation
The current number of the file and the total number of the saved files is displayed in the first line
of the LOAD window. The name of the file is displayed in the second line (its current number is presented
in the first line). The name of the file suggests the operation the file was created-in. The names in which
the first character is @ are coming from the AUTO SAVE function. The file with the default name
@Timer@ is coming from the AUTO SAVE function executed in the TIMER operation. The other names
suggest the SAVE / SAVE NEXT function. The type of the current file (LEVEL METER, 1/1 OCTAVE,
1/3 OCTAVE, DOSE METER, FFT and RT60) and the mode ([SOUND] or [VIBR.]) are given in the third
line. If during the measurements which results are saved in the file, the logger file was also created its
name is displayed in the fourth line.
7-17
G7 USER MANUAL
_
Notice: The logger file can be deleted from the instrument’s memory in the FILE / DELETE /
LOGGER FILES window and this deleting operation does not modify the contents of the fourth line
of the LOAD window.
The date and time of the SAVE operation are displayed in the fifth and sixth line, respectively.
The change of the current file with the unit step can be done after pressing the <
>, <
> push-buttons.
The first file is available after pressing the <
> with <SHIFT> push-button (or <
> with <SHIFT>) and the
last one is displayed after pressing the <
> with <SHIFT> push-button (or <
> with <SHIFT>).
Exemplary contents of the LOAD window
Notice: Many result files can be associated with one logger file, i.e. during the execution
of the AUTO SAVE function.
..
Exemplary result files associated with the same logger file (&LOG2)
The name of the file is accepted and the file is loaded after pressing the <ENTER> push-button.
The message with the name of the selected file is displayed during the execution of the loading operation.
Display during the execution of the loading function
The next message is displayed after successful end of loading operation. The instrument waits
for the reaction of the user (any push-button should be pressed except the <SHIFT> or <ALT> one) and
after pressing a push-button it returns to the FILE list.
<A KEY>
Displays after the execution of the LOAD operation
7-18
G7 USER MANUAL
The contents of the loaded file is displayed in the available result presentation modes
(after pressing the <
>, <
> push-buttons) depending on the current settings of the instrument.
=> <ENTER> =>
...
<A KEY>
Exemplary displays during the loading and checking the contents of a DOSE METER file
In the case when in the DISPLAY MODES sub-list the STATISTICS are activated and
in the loaded file the statistic analysis was not included the display with NO RESULT message
is presented in the graphical presentation of the statistical levels as it is given above.
=> <ENTER> =>
...
<A KEY>
Exemplary displays during the loading and checking the contents of a LEVEL METER file
7.4
Removing a file with the measurement results from memory - DELETE
The DELETE is used to remove a file from memory. In order to enter the window the user has
to select the DELETE text (to display it inversely) using the <
>, <
> push-buttons and then press
the <ENTER> one.
FILE list with the DELETE text highlighted (displayed inversely)
In the DELETE window, there are three elements: RESULT FILES, LOGGER FILES and
SETUP FILES. In order to enter the selected sub-list the user has to select the proper text (to display
it inversely) using the <
>, <
> (or <
>, <
>) push-buttons and then press the <ENTER> one.
The DELETE window is closed and the instrument returns to the FILE list after pressing the <ESC> one.
7-19
G7 USER MANUAL
7.4.1
_
Deleting files with the main results - RESULT FILES
In order to enter the window one has to press the <ENTER> push-button on the inversely displayed
RESULT FILES text of the DELETE sub-list using the <
>, <
> (or <
>, <
>) push-buttons. The
DELETE sub-list is closed and the instrument returns to the FILE list after pressing the <ESC> pushbutton.
In order to enter the list of the saved result files in the flash memory one has to press the <ENTER>
push-button. In the case when the result files were not saved in the memory, the special message
is displayed and the instrument waits for the reaction of the user. The user should press any push-button
except the <SHIFT> and <ALT>.
=> <ENTER> =>
RESULT FILES selected to be deleted and the flash memory does not contain any file
After pressing the <ENTER> push-button the instrument checks its current state. In the case when
the measurements are performed, the RESULT FILES entering is impossible. In such case, the message
is displayed and the instrument returns after few seconds to the DELETE sub-list.
Display after the attempt to perform an unavailable operation during measurement in progress
The same data about the existing in the instrument files as in the FILE / LOAD window
are displayed after successful opening the FILE / DELETE / RESULT FILES one (pressing the <ENTER>
push-button).
The current number of the file and the total number of the saved files is displayed in the first line
of the window.
The name of the file is displayed in the second line (its current number is presented
in the first line).
The name of the file suggests the operation the file was created-in. The names in which the first
character is @ are coming from the AUTO SAVE function. The file with the default name @Timer@ is
coming from the AUTO SAVE function executed in the TIMER operation. The other names suggest the
SAVE / SAVE NEXT function. The type of the current file LEVEL METER, 1/1 OCTAVE, 1/3 OCTAVE,
DOSE METER, FFT or RT60) and the mode ([SOUND] or [VIBR.]) are given in the third line. If during the
measurements which results are saved in the file, the logger file was also created its name is displayed in
the fourth line.
Notice: The logger file can be deleted from the instrument’s memory in the FILE / DELETE /
LOGGER FILES window and this deleting operation does not modify the contents of the fourth line of the
DELETE window.
The DATE and TIME of the SAVE operation are displayed in the fifth and sixth line, respectively.
The change of the current file with the unit step can be done after pressing the <
>, <
> push-buttons.
The first file is available after pressing the <
> with <SHIFT> push-button (or <
> with <SHIFT>) and the
last one is displayed after pressing the <
> with <SHIFT> push-button (or <
> with <SHIFT>).
7-20
G7 USER MANUAL
Selection of the RESULT FILES to be deleted
The selected file is deleted after pressing the <ENTER> push-button. The message is displayed
after the successful end of the operation. The instrument waits for the reaction of the user (any pushbutton should be pressed except the <SHIFT> and <ALT> one) and after pressing a push-button
it returns to the DELETE sub-list.
=> <ENTER> =>
=> <ANY PUSH-BUTTON> =>
=> <ENTER> =>
Execution of the RESULT FILES deletion
After the execution of the result files removing from the memory usually the FREE SPACE memory
(path: MENU / FILE / FREE SPACE) rests the same as before the deletion but TOTAL AVAILABLE
memory is increased. It is because erased file was somewhere in the file’s space. The file is no longer
accessible but the recuperated memory is still unused for the next saving. This memory becomes
available after the defragmentation process (path: MENU / FILE / DEFRAGMENTATION) in which all files
are moved to the continuous space. In order to illustrate it let us consider the result file named
@EXAMP4, which is 1946 bytes long.
=><ENTER>=>
=>
Execution of the @EXAMP4 file deletion and the influence of this process on the memory space
After removing @EXAMP4 from the memory, only the TOTAL AVAILABLE is increased (path:
MENU / FILE / FREE SPACE).
=>
=>
Execution of the @EXAMP5 file deletion and the influence of this process on the memory space
7-21
G7 USER MANUAL
_
The displays above illustrates the erasing from the flash memory another file named @EXAMP5
which was also 1946 bytes long; the FILES FREE SPACE, LOGGER FREE SPACE and
LOGGER AVAILABLE remain unchanged while the TOTAL AVAILABLE is increased.
7.4.2
Deleting logger files - LOGGER FILES
In order to enter the window one has to press the <ENTER> push-button on the inversely displayed
LOGGER FILES text of the DELETE sub-list using the <
>, <
> push-buttons. The DELETE sub-list
is closed and the instrument returns to the FILE list after pressing the <ESC> push-button.
In order to enter the list of the saved logger files in the memory one has to press the <ENTER>
push-button. In the case when the logger files were not saved in the memory, the special message
is displayed and the instrument waits for the reaction of the user. The user should press any push-button
except the <SHIFT> and <ALT>.
=> <ENTER> =>
LOGGER FILES selected to be deleted and the memory does not contain any file
After pressing the <ENTER> push-button the instrument checks its current state. In the case when
the measurements are performed, the LOGGER FILES entering is impossible. In such case,
the message is displayed and the instrument returns after few seconds to the DELETE sub-list.
Display after the attempt to perform an unavailable operation during measurement in progress
The similar data about the existing in the instrument logger files as in the DISPLAY /
LOGGER VIEW window are displayed after successful opening the FILE / DELETE / LOGGER FILES
one (pressing the <ENTER> push-button).
In the first line, the available still logger’s memory is displayed followed by:
• The selected number of the logger’s file and the number of all saved files (FILE NO.:).
• The name of the logger’s file (LOG.FILE:).
• The size of the logger file which name is displayed in the previous line (LOG.SIZE:).
• The results saved (if any are present) in the logger from the first profile (P(1):).
• The results saved (if any are present) in the logger from the second profile (P(2):).
• The results saved (if any are present) in the logger from the third profile (P(3):).
The change of the current file with the unit step can be done after pressing the <
>, <
> pushbuttons. The first file is available after pressing the <
> with <SHIFT> push-button (or <
> with
<SHIFT>) and the last one is displayed after pressing the <
> with <SHIFT> push-button (or <
> with
<SHIFT>).
7-22
G7 USER MANUAL
Selection of the LOGGER FILES to be deleted
The selected file is deleted after pressing the <ENTER> push-button. The message is displayed
after the successful end of the operation. The instrument waits for the reaction of the user (any pushbutton should be pressed except the <SHIFT> and <ALT> one) and after pressing a push-button
it returns to the DELETE sub-list.
=> <ENTER> =>
=> <ANY PUSH-BUTTON> =>
=> <ENTER> =>
Execution of the LOGGER FILES deletion
After the execution of the logger files deletion from the memory, usually the logger free space rests
the same as before the deletion but the total logger available memory is increased. It is because erased
file was somewhere in the file’s space. The file is no longer accessible but the recuperated memory is still
unused for the next saving. This memory becomes available after the defragmentation process (path:
MENU / FILE / DEFRAGMENTATION / LOGGER DEFRAGMENT.) in which all files are moved
to the continuous space.
It can be illustrated on the figures below by erasing from the memory 2 kB-long logger file named
&LOG107. The presented there FREE SPACE window comes from the FILE list.
=> <ENTER> =>
=>
Execution of the &LOG107 file deletion from the logger memory and its influence on the memory space
(LOGGER AVAILABLE)
The displays below illustrates the erasing from the logger memory another big file (29 kB) named
&LOG113 just after the erasing of the file &LOG107 the FILES FREE SPACE, TOTAL AVAILABLE and
LOGGER FREE SPACE remain unchanged while the LOGGER AVAILABLE is increased.
7-23
G7 USER MANUAL
_
=>
=>
Execution of the &LOG113 file deletion and the influence of this process on the memory space
7.4.3
Deleting files with setup settings - SETUP FILES
In order to enter the window one has to press the <ENTER> push-button on the inversely displayed
SETUP FILES text of the DELETE sub-list using the <
>, <
> push-buttons. The DELETE sub-list is
closed and the instrument returns to the FILE list after pressing the <ESC> push-button.
In order to enter the list of the saved setup files in the memory one has to press the <ENTER>
push-button. In the case when the setup files were not saved in the memory, the special message
is displayed and the instrument waits for the reaction of the user. The user should press any push-button
except the <SHIFT> and <ALT>.
=> <ENTER> =>
SETUP FILES selected to be deleted and the instrument’s memory does not contain any file
After pressing the <ENTER> push-button the instrument checks its current state. In the case when
the measurements are performed, the SETUP FILES entering is impossible. In such case, the message
is displayed and the instrument returns after few seconds to the DELETE sub-list.
Display after the attempt to perform an unavailable operation during measurement in progress
The data about the existing in the instrument setup files are displayed after successful opening
the FILE / DELETE / LOGGER FILES window (pressing the <ENTER> push-button).
The current number of the file and the total number of the saved setup files is displayed in the first
line of the window. The date and time of the SAVE SETUP operation is displayed in the last two lines
respectively.
The change of the current file with the unit step can be done after pressing the <
>, <
> pushbuttons. The first file is available after pressing the <
> with <SHIFT> push-button (or <
> with
<SHIFT>) and the last one is displayed after pressing the <
> with <SHIFT> push-button (or <
> with
<SHIFT>).
Selection of the SETUP FILES to be deleted
7-24
G7 USER MANUAL
The selected file is deleted after pressing the <ENTER> push-button. The message is displayed
after the successful end of the operation. The instrument waits for the reaction of the user (any pushbutton should be pressed except the <SHIFT> and <ALT> one) and after pressing a push-button
it returns to the DELETE sub-list.
=> <ENTER> =>
=> <ANY PUSH-BUTTON> =>
=> <ENTER> =>
Execution of the RESULT FILES deletion
After the execution of the setup files removing from the memory usually the FREE SPACE memory
(path: MENU / FILE / FREE SPACE) rests the same as before the deletion but TOTAL AVAILABLE
memory is increased. It is because erased file was somewhere in the file’s space. The file is no longer
accessible but the recuperated memory is still unused for the next saving.
This memory becomes available after the defragmentation process (path: MENU / FILE /
DEFRAGMENTATION / FILES DEFRAGMENT.) in which all files are moved to the continuous space.
In order to illustrate it let us consider the removing from the memory the setup file named @SET3.
After this, only the TOTAL AVAILABLE is increased (path: MENU / FILE / FREE SPACE).
=> <ENTER> =>
=>
Execution of the @SET3 file deletion and its influence on the memory space
The displays below illustrates the erasing from the flash memory another file named @SET8;
the FILES FREE SPACE, LOGGER FREE SPACE and LOGGER AVAILABLE remain unchanged while
the TOTAL AVAILABLE is increased.
=>
=>
Execution of the @SET8 file deletion and the influence of this process on the memory space
7-25
G7 USER MANUAL
7.5
_
Removing all files with measurement results from memory - DELETE ALL
The DELETE ALL is used to remove all files from memory. In order to enter the position the user
has to select the DELETE ALL text in the FILE list, using the <
>, <
> (or <
>, <
>) push-buttons and
press the <ENTER> one. The DELETE ALL sub-list consists of three positions: RESULT FILES,
LOGGER FILES and SETUP FILES.
DELETE ALL text highlighted (displayed inversely) in the FILE list
7.5.1
Deleting all result files - RESULT FILES
In order to activate the position the user has to place the special character in the line
with the RESULT FILES text using the <
> push-button. The DELETE ALL sub-list is closed and
the instrument returns to the FILE list after pressing the <ESC> push-button. In order to enter
the DELETE ALL window one has to press the <ENTER> push-button.
RESULT FILES selected to the execution of the DELETE ALL operation
After pressing the <ENTER> push-button the instrument checks its current state. In the case when
the measurements are performed, the execution of the DELETE ALL operation is not possible.
In such case, the message is displayed for a few seconds and the instruments returns to the FILE list.
Display after the attempt to perform an unavailable operation during measurement in progress
If the measurements are not performed the instrument requests the confirmation of the operation
after entering this window (after pressing the <ENTER> push-button). After next pressing the <ENTER>
push-button, when the NO option is selected, the window is closed and the instrument returns to the FILE
list. The selection of the NO or YES option is possible using the <
>, <
> push-buttons. The return
to the FILE list is also possible after pressing the <ESC> push-button.
Displays with the confirmation window during the execution of the DELETE ALL operation
All files from the selected type are deleted after the <ENTER> push-button pressing, when the YES
option is selected. The message is displayed after the successful execution of all stages
7-26
G7 USER MANUAL
of the operation. The instrument waits for the reaction of the user (any push-button should be pressed
except the <SHIFT> and <ALT> one) and after pressing a push-button it returns to the FILE list.
Execution of the DELETE ALL operation in the case of RESULT FILES selection
7.5.2
Deleting all logger files - LOGGER FILES
In order to activate the position the user has to place the special character in the line
with the LOGGER FILES text using the <
> push-button. The DELETE ALL sub-list is closed and
the instrument returns to the FILE list after pressing the <ESC> push-button.
In order to enter the DELETE ALL window one has to press the <ENTER> push-button.
LOGGER FILES selected to the execution of the DELETE ALL operation
After pressing the <ENTER> push-button the instrument checks its current state. In the case when
the measurements are performed, the execution of the DELETE ALL operation is not possible.
In such case, the message is displayed for a few seconds and the instruments returns to the FILE list.
Display after the attempt to perform an unavailable operation during measurement in progress
If the measurements are not performed the instrument requests the confirmation of the operation
after entering this window (after pressing the <ENTER> push-button). After next pressing the <ENTER>
push-button, when the NO option is selected, the window is closed and the instrument returns to the FILE
list. The selection of the NO or YES option is possible using the <
>, <
> push-buttons. The return
to the FILE list is also possible after pressing the <ESC> push-button.
Displays with the confirmation window during the execution of the DELETE ALL operation
All files from the selected type are deleted after the <ENTER> push-button pressing, when the YES
option is selected. The message is displayed after the successful execution of all stages
of the operation. The instrument waits for the reaction of the user (any push-button should be pressed
except the <SHIFT> and <ALT> one) and after pressing a push-button it returns to the FILE list.
7-27
G7 USER MANUAL
_
Execution of the DELETE ALL operation in the case of LOGGER FILES selected
7.5.3
Deleting all setup files - SETUP FILES
In order to activate the position the user has to place the special character in the line
with the SETUP FILES text using the <
> push-button. The DELETE ALL sub-list is closed and
the instrument returns to the FILE list after pressing the <ESC> push-button.
In order to enter the DELETE ALL window one has to press the <ENTER> push-button.
SETUP FILES selected to the execution of the DELETE ALL operation
After pressing the <ENTER> push-button the instrument checks its current state. In the case when
the measurements are performed, the execution of the DELETE ALL operation is not possible.
In such case, the message is displayed for a few seconds and the instruments returns to the FILE list.
Display after the attempt to perform an unavailable operation during measurement in progress
If the measurements are not performed the instrument requests the confirmation of the operation
after entering this window (after pressing the <ENTER> push-button). After next pressing the <ENTER>
push-button, when the NO option is selected, the window is closed and the instrument returns to the FILE
list. The selection of the NO or YES option is possible using the <
>, <
> push-buttons. The return to the
FILE list is also possible after pressing the <ESC> push-button.
Displays with the confirmation window during the execution of the DELETE ALL operation
All files from the selected type are deleted after the <ENTER> push-button pressing, when the YES
option is selected. The message is displayed after the successful execution of all stages
of the operation. The instrument waits for the reaction of the user (any push-button should be pressed
except the <SHIFT> and <ALT> one) and after pressing a push-button it returns to the FILE list.
7-28
G7 USER MANUAL
Execution of the DELETE ALL operation in the case of SETUP FILES selection
Notice: The execution of the DELETE ALL function described above takes place in the case
when only one type of the files is selected in the DELETE ALL sub-list. If all types are selected
simultaneously and the logger, result and setup are saved, only Clearing operation is performed but two
times – one time in logger files memory and one time in result and setup files memory. After clearing
all memory, the defragmentation is not done. The memory merging is done only in the case of setup and
results memory, as these two different types of files are saved together in the same space.
Execution of the DELETE ALL operation for all type files simultaneously
7.6
Merging file space - DEFRAGMENTATION
The DEFRAGMENTATION is used to make the file memory continuous. All new files are saved
starting from the beginning of the free memory space. The memory occupied by the deleted file,
assuming that the file was not the last one, remains unused for the next files saving. After the removing
a file the files memory becomes discontinuous, with unused parts, which cannot be utilized in the future.
The situation changes after the process called defragmentation. During this process, the files saved
in the files memory are moved in order to obtain the continuous occupied space. The files’ merging is
performed separately for two parts of the instrument’s memory: the FILES DEFRAGMENT. is used to join
the result and setup files and LOGGER DEFRAGMENT. is used in the case of the logger.
Before the defragmentation the FILES FREE SPACE and TOTAL AVAILABLE, characterizing
the result memory (path: MENU / FILE / FREE SPACE), usually differ between each other. After this
operation, these two parts are equal.
The same situation is in the case of the LOGGER FREE SPACE and TOTAL AVAILABLE
characterizing the logger file. In order to enter the DEFRAGMENTATION sub-list the user has to select
the DEFRAGMENTATION text in the FILE list, using the <
>, <
> (or <
>, <
>) push-buttons and
press the <ENTER>.
DEFRAGMENTATION text highlighted (displayed inversely) in the FILE list
7-29
G7 USER MANUAL
_
Notice: The DEFRAGMENTATION must not be broken – the user should never press
<ESC> or any other push-button during the DEFRAGMENTATION process.
7.6.1
Merging result and setup files memory - FILES DEFRAGMENTATION
The FILES DEFRAGMENT. is used to join the result and setup files memory. In order to select this,
the user has to display inversely the FILES DEFRAGMENT. text in the DEFRAGMENTATION sub-list
using the <
> (or <
>) push-button.
FILES DEFRAGMENT. selected to the execution of the DEFRAGMENTATION operation
The DEFRAGMENTATION sub-list is closed and the instrument returns to the FILE list
after pressing the <ESC> push-button. In order to continue the execution of the function one has to press
the <ENTER> push-button. The instrument requests the confirmation of the operation. The next pressing
of the <ENTER> push-button, when the NO option is selected, causes the closing of the window and
the return to the DEFRAGMENTATION sub-list. The selection of the NO or YES option is possible using
the <
>, <
> push-buttons. The return to the DEFRAGMENTATION sub-list is also possible after
pressing the <ESC> push-button.
Confirmation windows during the execution of the FILES DEFRAGMENTATION operation
After pressing the <ENTER> push-button the instrument checks its current state. In the case when
the measurements are performed, the execution of the DEFRAGMENTATION operation is not possible.
In such case, the message is displayed and after few seconds instrument returns
to the DEFRAGMENTATION sub-list.
Display after the attempt to perform an unavailable operation during measurement in progress
If the measurements are not performed, after pressing the <ENTER> push-button on the active
YES option, the instrument checks whether the used result and setup files memory is continuous or not.
If this memory is continuous, the DEFRAGMENTATION operation is not executed and the special
message is displayed. The instrument waits for the reaction of the user (any push-button should
be pressed except the <SHIFT> and <ALT> one) and after pressing a push-button it returns
to the DEFRAGMENTATION sub-list.
7-30
G7 USER MANUAL
Message in the case when the execution of the DEFRAGMENTATION operation is unnecessary
If there are conditions to execute the DEFRAGMENTATION operation, it is done and the current
progress is shown on the display.
After the successful execution, the special message is displayed and the instrument waits
for the reaction of the user. Any push-button should be then pressed except the <SHIFT> and <ALT>
one. After pressing a push-button, the instrument returns to the DEFRAGMENTATION sub-list.
Execution of the DEFRAGMENTATION operation
The displays below illustrate the results of the FILES DEFRAGMENT. – after the execution,
the FILES FREE SPACE and TOTAL AVAILABLE become equal while the LOGGER FREE SPACE and
LOGGER AVAILABLE remain unchanged.
=>
Result of the FILES DEFRAGMENTATION operation
7.6.2
Merging logger files memory - LOGGER DEFRAGMENT.
The LOGGER DEFRAGMENT. is used to join the logger files memory. In order to select this,
the user has to display inversely the LOGGER DEFRAGMENT. text using the <
> (or <
>) push-button.
LOGGER DEFRAGMENT. selected to the execution of the DEFRAGMENTATION operation
The DEFRAGMENTATION sub-list is closed and the instrument returns to the FILE list
after pressing the <ESC> push-button. In order to continue the execution of the function one has to press
the <ENTER> push-button. The instrument requests the confirmation of the operation. The next pressing
of the <ENTER> push-button, when the NO option is selected, causes the closing of the window and
the return to the DEFRAGMENTATION sub-list. The selection of the NO or YES option is possible using
the <
>, <
> push-buttons. The return to the DEFRAGMENTATION sub-list is also possible after
pressing the <ESC> push-button.
7-31
G7 USER MANUAL
_
Confirmation windows during the execution of the LOGGER DEFRAGMENTATION operation
After pressing the <ENTER> push-button the instrument checks its current state. In the case when
the measurements are performed, the execution of the DEFRAGMENTATION operation is not possible.
In such case, the message is displayed and after few seconds instrument returns
to the DEFRAGMENTATION sub-list.
Display after the attempt to perform an unavailable operation during measurement in progress
If the measurements are not performed, after pressing the <ENTER> push-button on the active
YES option, the instrument checks whether the used logger files memory is continuous or not.
If this memory is continuous, the DEFRAGMENTATION operation is not executed and the special
message is displayed. The instrument waits for the reaction of the user (any push-button should
be pressed except the <SHIFT> and <ALT> one) and after pressing a push-button it returns
to the DEFRAGMENTATION sub-list.
Message in the case when the execution of the DEFRAGMENTATION operation is unnecessary
If there are conditions to execute the DEFRAGMENTATION operation, it is done and the current
progress is shown on the display. After the successful execution, the special message is displayed and
the instrument waits for the reaction of the user. Any push-button should be then pressed except
the <SHIFT> and <ALT> one. After pressing a push-button the instrument returns
to the DEFRAGMENTATION sub-list.
Execution of the DEFRAGMENTATION operation
The displays below illustrate the results of the LOGGER DEFRAGMENT. – after the execution
the LOGGER FREE SPACE and LOGGER AVAILABLE become equal while the FILES FREE SPACE
and TOTAL AVAILABLE remain unchanged.
7-32
G7 USER MANUAL
=>
Result of the LOGGER DEFRAGMENTATION operation
7.7
Checking the contents of the memory - CATALOGUE
The CATALOGUE is used for checking the contents of the memory (the list of the result and setup
files). In order to enter the window the user has to select the CATALOGUE text in the FILE list, using
the <
>, <
> (or <
>, <
>) push-buttons and press the <ENTER> one.
CATALOGUE text highlighted (displayed inversely) in the FILE list
In the case when the instrument memory is empty (no file is stored), after entering
the CATALOGUE the NO FILES text is displayed and the instrument waits for the reaction of the user.
The user should press then the <ESC>, <ENTER> (the instrument returns to the FILE list) or
<START / STOP> push-button (the instrument starts the measurement).
CATALOGUE window when the memory is empty
In the case when the result and setup files memory in the instrument is not empty (some files
are stored) another window is displayed in which the same data about the existing in the instrument files
as in the FILE / LOAD window are presented.
The current number of the file and the total number of the saved result and setup files is displayed
in the first line of the window. The name of the file is displayed in the second line (its current number is
presented in the first line).
The name of the file suggests the operation the file was created-in. The names in which the first
character is @ are coming from the AUTO SAVE function. The file with the default name @Timer@
is coming from the AUTO SAVE function executed in the TIMER operation. The other names suggest
the SAVE / SAVE NEXT function. The type of the current file (LEVEL METER, 1/1 OCTAVE or
1/3 OCTAVE, DOSE METER, FFT and RT60) and the mode ([SOUND] or [VIBRATION]) is given in the
third line. If during the measurements which results are saved in the file, the logger file was also created
its name is displayed in the fourth line.
Notice: The logger file can be deleted from the instrument’s memory in the FILE / DELETE /
LOGGER FILES window and this deleting operation does not modify the contents of the fourth line
of the CATALOGUE window.
7-33
G7 USER MANUAL
_
The date and time of the SAVE operation are displayed in the fifth and sixth line, respectively.
The change of the current file with the unit step can be done after pressing the <
>, <
> push-buttons.
The first file is available after pressing the <
> with <SHIFT> push-button (or <
> with <SHIFT>) and the
last one is displayed after pressing the <
> with <SHIFT> push-button (or <
> with <SHIFT>).
The setup file is indicated by the SETUP text displayed in the third line instead of the LEVEL METER /
DOSE METER text.
Contents of the CATALOGUE window
Notice: Many result files can be associated with one logger file, i.e. during the execution
of the AUTO SAVE function.
Exemplary result files associated with the same logger file &LOG2 in the CATALOGUE window
7.8
Checking the free space in the memory - FREE SPACE
The FREE SPACE is used to read out the free space in the FLASH DISC memory
of the instrument. In order to enter the window the user has to select the FREE SPACE text in the FILE
list, using the <
>, <
> (or <
>, <
>) push-buttons and press the <ENTER> one.
FREE SPACE text highlighted (displayed inversely) in the FILE list
The files memory in the instrument is divided into two separate parts.
One part is dedicated for saving the result and setup files and its size is equal to 16252428 bytes.
The second part is used for saving the logger files and its size is equal to 15859224 bytes.
The FREE SPACE window in the instrument after the execution of the DELETE ALL operation
is presented below.
7-34
G7 USER MANUAL
FREE SPACE window after the execution of the DELETE ALL operation
The FREE SPACE window contains four numbers. First two, named FILES FREE SPACE and
TOTAL AVAILABLE, characterize the result and setup files memory.
The files are always saved starting from the beginning of the continuous memory space. The size
in bytes of this space is given in the FILES FREE SPACE position.
If the result and setup files were not deleted from the memory the number of bytes displayed
in the TOTAL AVAILABLE position is the same as in the FILES FREE SPACE. However, if some of them
were deleted, assuming that they were not the last saved, the memory used by them is empty but it does
not increase the continuous space.
In such case, the number given in the TOTAL AVAILABLE position is greater than that
in the FILES FREE SPACE. The DEFRAGMENTATION operation, which merges files, should be used to
increase the FREE SPACE.
The next two numbers given in the FREE SPACE window, named LOGGER FREE SPACE and
LOGGER AVAILABLE characterize the logger files memory where the saving mechanism is the same.
Therefore, the numbers presented in the FREE SPACE window depend on the history
of the measurements and the operations performed by the user.
FREE SPACE window with the number depending on the measurements and operations performed
The window is closed and the instrument returns to the FILE list after pressing the <ENTER> or
<ESC> push-buttons or it starts the measurements (after pressing the <START / STOP> one).
7.9
Saving setup files in the instrument’s memory - SAVE SETUP
The SAVE SETUP is used for storing setup settings in the internal non-volatile (FLASH DISC)
memory (files are always written at the beginning of a free continuous space) as a file (see Appendix B for
the file formats). In order to enter the window the user has to select the SAVE SETUP text in the FILE list,
using the <
>, <
> (or <
>, <
>) push-button and press the <ENTER> one.
SAVE SETUP text highlighted (displayed inversely) in the FILE list
There are two available functions: the SAVE NEXT – save a setup file with the name increased
by one, and SAVE – save a setup file with the edited name. These functions are available after pressing
the <
>, <
> push-buttons.
7-35
G7 USER MANUAL
_
SAVE SETUP window in the FILE list
The name of the file, in which the setup settings are to be saved, is displayed above the SAVE or
SAVE NEXT text. The default name for a setup file is displayed in the case of the first entering to this
position (after power on). The default file name for setup settings is SET. The line of the setup file’s name
edition (FILE NAME) is opened after pressing the <
> push-button.
The user can skip the setup file’s name edition and start saving file pressing the <ENTER> pushbutton or return to the FILE list pressing the <ESC> one. The edition process is presented on the Figure
below. The displayed inversely character is currently edited. The <
>, <
>, <
>, <
> and <SHIFT>
push-buttons are used for editing the name which cannot exceed eight characters.
Display during the process of setting the character in the edited name
One can select the proper position of the character in the edited text using the <
>, <
> pushbuttons.
Display during the selection of the character’s position to be edited
The available ASCII characters can be changed using the <
> (or <
>) push-button pressed
together with the <SHIFT> one. The subsequent digits, underline, big letters and space appear on
the display in the inversely displayed position after each pressing of the mentioned above push-buttons.
...
Display during the selection of the character
7-36
G7 USER MANUAL
Displays in the FILE NAME edition after pressing the <SHIFT> and <> push-buttons
Displays in the FILE NAME edition after pressing the <SHIFT> and <> push-buttons
The edited name is accepted and the setup file is saved after pressing the <ENTER> push-button.
The special warning is displayed in the case the file with the edited name already exists in the memory,
if the REPLACE position is not activated (path: MENU / FILE / SAVE OPTIONS). The instrument waits
then for a reaction of the user (any push-button should be pressed except the <SHIFT> or the <ALT>).
=>
...
...
Displays during the attempt of overwriting the existing file, changing the name and saving data
All changes introduced to the setup file name during the edition are ignored after pressing
the <ESC> push-button. This pressing causes the return to the list from which the SAVE option
was entered. The return after the edition to the line with the SAVE or SAVE NEXT text is possible
after pressing the <
> push-button.
The simplified edition consists in the addition at the end of the file name the natural number.
The increase by one of the number is made automatically. After the saving operation execution the new
setup file name is displayed and the instrument waits then for a reaction of the user (any push-button
should be pressed except the <SHIFT> or the <ALT> one). In the next attempt of saving data, the new
name is displayed in the FILE NAME line and that name is increased by one during the saving operation.
...
...
Displays in the simplified edition of the setup file name and saving operation execution
The number can be changed from 1 to N. The only limitation of the N value is the length
of the file name, which cannot be longer than 8 characters. In the case when such limitation is achieved
7-37
G7 USER MANUAL
_
and the instrument can not change automatically the file’s name the only possibility is to edit new base file
name.
Notice: The files can be overwritten (the use of the same file name) without any warning
if the REPLACE option is switched on (path: MENU / FILE / SAVE OPTIONS / REPLACE).
...
Displays in the simplified edition of the file name, saving and the “saturation” of that operation
As it was already written, the instrument attempts to save a file after pressing the <ENTER> pushbutton. The saving is not possible in the case when the instrument is measuring the signal. The special
message is displayed for about 3 seconds in this case and the instrument returns to the SAVE SETUP
window.
Displays after the attempt to perform unavailable saving operation; the return to the SAVE SETUP
Notice: During the execution of the SAVE or SAVE NEXT function an additional window
is displayed informing about the operation performed. This window can be unnoticed by the user
as it appears for the short time.
View of all displays during and after the execution of the SAVE operation
As it was already written it is not possible to store the data in the file, which already exists, when
the REPLACE is not active ([ ]) (path: MENU / FILE / SAVE OPTIONS / REPLACE).
The presented below sequence of displays illustrates the situation when during the name-edition
process, the user selected the name that was used before but this time the REPLACE is active.
The setup file is overwritten, the instrument displays a special message and waits for the reaction
of the user (any push-button should be pressed except the <SHIFT> or the <ALT> one) and after
pressing a push-button it returns to the FILE list.
...
7-38
... =>
=> ...
G7 USER MANUAL
...
Displays after the attempt to overwrite a file if the REPLACE is active
7.10 Loading the files with the setup settings - LOAD SETUP
The LOAD SETUP is used for loading setup setting file from the FLASH DISC (e.g. for performing
different type of measurements with different instrument’s settings). The position is opened after pressing
the <ENTER> push-button when the LOAD SETUP text in the FILE list is displayed inversely (selected
using the <
> (or <
>) or <
> (or <
>) with the <SHIFT> push-buttons). The return to the FILE list
is possible after pressing the <ESC> push-button.
FILE list with the LOAD SETUP text highlighted (displayed inversely)
Notice: It is not possible to load the file during the execution of the measurements.
On such attempt the message: MEASUREMENT IN PROGRESS is displayed for about 3 seconds.
After pressing the <ENTER> push-button the instrument checks its current state. In the case when
the measurements are performed, the file loading is impossible and the message is displayed.
Display after the attempt to perform an unavailable operation during measurement in progress
In the case when the setup files were not saved, after entering the LOAD SETUP window,
the NO FILES text is displayed and the instrument waits for the reaction of the user. The user should
press then the <ESC>, <ENTER> (the instrument returns to the FILE list) or <START / STOP> pushbutton (the instrument starts the measurement).
Display during the execution of the LOAD SETUP operation
The current number of the setup file and the total number of the saved setup files is displayed
in the first line of the LOAD SETUP window. The name of the file is displayed in the second line
(its current number is presented in the first line).
7-39
G7 USER MANUAL
_
The date and time of the SAVE SETUP operation is displayed in the fourth and fifth line
respectively. The change of the current file with the unit step can be done after pressing the <
>, <
>
push-buttons. The first file is available after pressing the <
> with <SHIFT> push-button (or <
> with
<SHIFT>) and the last one is displayed after pressing the <
> with <SHIFT> push-button (or <
> with
<SHIFT>).
Exemplary contents of the LOAD SETUP window
The name of the file is accepted and the file is loaded after pressing the <ENTER> push-button.
The message with the name of the selected file is displayed during the execution of the loading operation.
The next message is displayed after successful end of loading operation. The instrument waits
for the reaction of the user (any push-button should be pressed except the <SHIFT> or <ALT> one) and
after pressing a push-button it returns to the FILE list.
<A KEY>
Displays after the execution of the LOAD SETUP operation
7.11 Connecting the external USB memory stick- DIRECTORY
The DIRECTORY text appears in the FILE list when the USB memory stick is connected
to the device. (It is necessary to select in the USB–HOST PORT window the USB DISK position, path:
MENU / SETUP / USB–HOST PORT / USB DISK). In order to enter the window the user has to select
the DIRECTORY text in the FILE list, using the <
>, <
> (or <
>, <
>) push-buttons and press
the <ENTER> one. The return to the FILE list is possible after pressing the <ESC> push-button.
a)
b)
FILE list with the DIRECTORY text selected (a) and the DIRECTORY window opened (b)
The FREE SPACE denotes the available free memory on the connected disk. The DIR NO. shows
st
the number of the selected directory (the 1 number) and the number of the existing directories
nd
(the 2 number). In the case the directories do not exist, these numbers are equal to zero.
st
The DIR NAME enables one to edit the directory name (the 1 number) or displays its name. The help
lines are placed at the display’s bottom.
There are two ways of the current directory selection:
• the name edition in the DIR NAME line. The default name consists of the day number and the month
abbreviation. The not existing directory will be created.
• the selection of the existing directory by means of the <
>, <
> push-buttons pressed in the line
with the DIR NO. text. The name of the selected directory is displayed in the DIR NAME line.
The selection is confirmed after pressing the <ENTER> push-button which closes the window and
returns to the FILE list. The return to this list is also possible after pressing the <ESC> push-button but
7-40
G7 USER MANUAL
the selection is not confirmed. The selection of the directory is obligatory during the initialisation process.
In this case also the <ESC> push-button confirms the settings.
FILE list, the DIRECTORY window
Notice: After connecting a USB memory stick to the device the paper sheet icon appears in
the top of the display.
7.12 Copying files to the external USB memory stick- COPY FILES TO USB
The COPY FILES TO USB is used for copying files to the external USB memory stick. The position
is opened after pressing the <ENTER> push-button when the COPY FILES TO USB text in the FILE list
is displayed inversely. The return to the FILE list is possible after pressing the <ESC> push-button.
a)
b)
FILE list with the COPY FILES TO USB text selected (a) and the COPY FILES window opened (b)
The COPY FILES TO USB sub-list consists of three positions to be selected: RESULT FILES,
LOGGER FILES and SETUP FILES and DIRECTORY position with the name of the directory in which the
files from the internal memory of the instrument will be stored.
In order to copy required type of the files the user has to place the special character in the line
with the RESULT FILES, LOGGER FILES or SETUP FILES text using the <
> or <
> push-button.
After next pressing the <ENTER> push-button, when no option is selected, the window is closed and
the instrument returns to the FILE list. The return to the FILE list is also possible after pressing the
<ESC> push-button.
a)
b)
RESULT FILES selection to the execution of the COPY FILES TO USB operation (a); the RESULT,
LOGGER and SETUP files selected to the execution of the COPY FILES TO USB operation (b)
After pressing the <ENTER> push-button the instrument checks its current state. When
the measurements are performed, the execution of the COPY FILES TO USB operation is not allowed.
In such case, the message is displayed for a few seconds and the instrument returns to the FILE list.
7-41
G7 USER MANUAL
_
Display after the attempt to perform an unavailable operation during measurement in progress
If the measurements are not performed, the instrument starts the operation. After the operation
Files Copied O.K. message is presented on the display. If a file has been already copied to the USB
stick, a message ALREADY EXIST is presented on the display as well as the name of the file.
a)
b)
Display after the execution of COPY FILES TO USB operation (a) and when the file exists already (b)
7.13 Moving files to the USB memory stick- MOVE FILES TO USB
The MOVE FILES TO USB is used for moving files from internal instrument’s memory to the USB
memory stick.
The proper window is opened after pressing the
the MOVE FILES TO USB text in the FILE list is displayed inversely.
<ENTER>
push-button
when
The return to the FILE list is possible after pressing the <ESC> push-button.
b)
a)
FILE list with the MOVE FILES TO USB text selected (a) and the MOVE FILES window opened (b)
The MOVE FILES TO USB sub-list consists of three positions: RESULT FILES, LOGGER FILES,
SETUP FILES and DIRECTORY position with the name of the file in which the files from the internal
memory of the instrument will be stored.
In order to activate required position the user has to place the special character in the line
with the RESULT FILES, LOGGER FILES or SETUP FILES text using the <
> or <
> push-button.
After next pressing the <ENTER> push-button, when no option is selected, the window is closed and
the instrument returns to the FILE list. The return to the FILE list is also possible after pressing
the <ESC> push-button.
a)
b)
RESULT FILES selection to the execution of the MOVE FILES TO USB operation (a) the RESULT,
LOGGER and SETUP files selected to the execution of the MOVE FILES TO USB operation (b)
7-42
G7 USER MANUAL
After pressing the <ENTER> push-button the instrument checks its current state. In the case when
the measurements are performed, the execution of the MOVE FILES TO USB operation is not possible.
In such case, the message is displayed for few seconds and the instruments returns to the FILE list.
Display after the attempt to perform an unavailable operation during measurement in progress
If the measurements are not performed, the instrument starts the operation. After the operation
Files Moved O.K. message is presented on the display.
If the file already exist in the USB memory stick the message with the name of the file and
ALREADY EXIST text is presented on the display.
Display after the execution of MOVE FILES TO USB operation (a) and when the file already exists
in the USB memory (b)
Notice: After the execution of the MOVE FILES TO USB operation, files, which have been
moved, do not exist in the internal instrument’s memory any more.
7-43
G7 USER MANUAL
8 REPORTS PRINTING - REPORT
The printed reports of the sound or vibration measurement results in the predefined format can be
obtained by means of the REPORT list. In order to open the REPORT list the user has to:
• press the <MENU> push-button,
• select from the main list, using the <
>, <
> (or <
>, <
>) push-buttons, the REPORT text (highlight
it inversely),
• press the <ENTER> push-button.
Display in the main list; the REPORT text highlighted (displayed inversely)
In order to obtain the report the user has to connect the instrument to the printer’s RS 232 port
using the SV 55 RS 232 interface. This hardware interface is hidden in the Cannon type, 9-pin RS 232
plug-in. On the other end of the SV 55 interface, which itself looks like a cable, there is the USB Host plugin. This plug-in should be placed in the USB Host socket of the instrument.
It is also possible to connect the instrument to the USB port of a PC using the proper cable.
Measurement results can be easy downloaded to any PC (using USB interface and SvanPC
software) and printed out on the printer attached to a PC.
Notice: The converter SV 55 serves as the RS 232 interface. The SV 55 connection to the
USB Host socket is detected and after successful detection the headphone icon is switched on.
The transmission using the SV 55 is possible only in the case when the instrument is not connected to a
PC with the USB Device port.
The RS232 is the default setting in the USB–HOST PORT in the SETUP list. Only in this option
the USB host controller is awaken and the power consumption is the lower one.
<ENTER>
SETUP list with the USB–HOST PORT selected and this window with the activated RS232
The user has to be sure that the RS232 is activated (path: MENU / SETUP / USB–HOST PORT /
RS232) before starting printing reports. Additionally, in the RS232 list (path: MENU / SETUP / RS232) the
user has to select the proper speed of the transmission and the parameter called TIME OUT.
<ENTER>
...
SETUP list with the RS232 selected and the exemplary contents of this window
8-1
G7 USER MANUAL
_
The RS 232 interface transmission (BAUD RATE) speed can be selected from the following
available values: 1200 (bits / second), 2400 (bits / s), 4800 (bits / s), 9600 (bits / s), 19200 (bits / s),
38000 (bits / s), 57600 (bits / s) or 115200 (bits / s).
The selection is made by means of the <
>, <
> push-buttons. The transmission speed should
correspond to the one selected in a printer. The other RS 232 transmission parameters are fixed to 8 bits
for data, No parity & 1 Stop bit. The default value of the TIME OUT parameter is equal to one but it can
be too short period for the printers, which are not too fast. In such case, this parameter has to be
increased.
The description of the SV 55 pin-outs is given in App. C. The printers with the different connections
on the RS 232 socket require the special, individual RS 232 – RS 232 cable that should fulfil the suitable
wire crossing.
The printers, in which the Centronics interface is available instead of the RS 232 one, can be
connected to the instrument by means of the SV 52 RS 232 – Centronics interface.
The printers, which have only USB interface, are currently not driven by the instrument.
Notice: Switch the power off before connecting the instrument to any external device (e.g. a
printer or a Personal Computer).
The REPORT list contains the following elements:
TITLE
that enables the user to give the header to the printed report;
PRINT RESULTS
that enables the user to print out the measurement results on the default printer
or to send the measurement results to a PC using SvanPC software and USB
interface;
PRINT STATISTICS
that enables the user to print out the statistics of the measurement results; this
position is not available in the case of vibration measurements;
PRINT FILE
that enables the user to print out on a printer the selected file with
the measurement results or to send it to a PC using SvanPC software
and USB interface
PRINT LOGGER
that enables the user to print out on a printer connected directly
to the instrument the measurement results in a selected file from the logger
or to send it to a PC using SvanPC software and USB interface
PRINT USER FILTERS that enables the user to print out on a printer connected directly
to the instrument the values of the user filters introduced in the instrument
or to send them to a PC using SvanPC software and USB interface;
PRINT CATALOGUE
that enables the user to print out the catalogue of the files
OPTIONS
that enables the user to determine the options of the report.
REPORT windows in SM (SOUND METER) mode
REPORT windows in the vibration mode
8-2
G7 USER MANUAL
Notice: All reports are printed in the character format using the ASCII set.
Notice: The abbreviation SM mode refers to the SOUND METER mode, VM mode refers to
the VIBRATION METER mode.
8.1 Edition of the user’s text to be added to the reports - TITLE
The TITLE enables the user to edit the text added to the file and to the report to be printed.
This operation is performed in the same way as it was described in the case of the FILE NAME window.
In order to enter the position the user has to select the TITLE text in the REPORT list, using the <
>,
<
> (or <
>, <
> with <SHIFT>) push-buttons and press the <ENTER> one.
a)
b)
REPORT windows with the TITLE selected in SM (a) and VM (b)
The text edition is made using the <
>, <
>, <
>, <
> and <SHIFT> push-buttons. The <
>,
<
> push-buttons are used for changing the position of the edited character. The number (counted from
the beginning of the text) of the edited character is displayed in the first line of the display, in the brackets.
The text is limited to 128 characters.
Displays in the text edition of the report’s header
The <
>, <
> push-buttons are used for the selection of the ASCII characters. Digits, small
and big letters as well as special characters, all together 91, are available (cf. the view of the displays
below). Small and big letters are placed one after another.
Pressing the <SHIFT> and <
> push-buttons causes that the highlighted character is erased from
the text (DEL function). Pressing the <SHIFT> and <
> causes that the whole text is shifted one position
to the right (INSERT function).
The window is closed and the instrument returns to the REPORT list after pressing the <ENTER>
or <ESC> push-button. In the first case, the edited text is saved and will be added to the printed reports.
In the latter case newly introduced text or the amendments made in the old one are ignored.
Displays with all available characters
8-3
G7 USER MANUAL
_
Displays with all available characters (cont.)
8.2 Printing of the measurement results - PRINT RESULTS
The PRINT RESULTS enables the user to print the report on the attached printer or to send out
the report to a PC using the SvanPC software and the USB interface.
In order to enter the position the user has to select the PRINT RESULT text in the REPORT list,
using the <
>, <
> (or <
>, <
>) push-buttons and press the <ENTER> one.
a)
b)
REPORT windows with the PRINT RESULTS selected in SM (a) and VM (b)
After pressing the <ENTER> push-button the instrument checks its current state. In the case when
the measurements are performed, the printing is impossible and the message is displayed.
Display after the attempt to perform an unavailable operation during measurement in progress
In the case when a measurement was already performed and a result is available, the message
presented below is displayed.
Display in the REPORT list; the execution of the PRINT RESULTS
When the message is on the display, the data are transferred from the instrument to the attached
printer. The instrument returns to the REPORT list after transferring all data.
The exemplary report printed in A5 format (path: MENU / REPORT / OPTION / FORMAT A5)
with the TITLE “13MAR” (path: MENU / REPORT / TITLE / 13MAR) looks as follows:
(C) SVANTEK
2007/08/03
G7
(v6.06/6.06.2)
No.12800
12:44:53
TITLE:
------------ SETTINGS -----------
8-4
G7 USER MANUAL
Device mode........:
Input..............:
Field correction...:
Outdoor filter.....:
Device function....:
LEVEL METER version:
Meas. start date...:
Meas. start hour...:
Range..............:
Measure trigger....:
Logger trigger.....:
Repeat cycle.......:
Start delay........:
Integration time...:
Calibr. factor.....:
Calibration by.....:
Calibration date...:
Calibration hour...:
Leq integration....:
Profile:
Filter:
Detector:
Logger:
#1
A
FAST
None
SOUND METER
Microphone
FREE
Off
LEVEL METER
6.06
2007/08/03
12:42:04
HIGH
Off
Off
2
1 s
10 s
6.6 dB
Measurement
2007/08/03
12:39:58
Linear
#2
C
FAST
None
#3
Z
FAST
None
--------------- RESULTS -------------Measurement time: 00:00:10
Prof.:
PEAK
MAX
MIN
SPL
LEQ
SEL
Ld
LEPd
Ltm3
Ltm5
#1
63.7dB
48.5dB
41.8dB
48.5dB
44.0dB
54.0dB
44.0dB
44.0dB
46.2dB
47.5dB
#2
68.9dB
56.1dB
50.2dB
55.9dB
53.0dB
63.0dB
53.0dB
53.0dB
55.4dB
55.6dB
#3
76.3dB
70.7dB
58.1dB
67.9dB
64.8dB
74.8dB
64.8dB
64.8dB
69.3dB
69.5dB
L01
L10
L20
L30
L40
L50
L60
L70
L80
L90
49.5dB
45.3dB
44.6dB
44.2dB
43.8dB
43.5dB
43.2dB
43.0dB
42.6dB
42.2dB
56.5dB
54.7dB
54.0dB
53.5dB
53.1dB
52.7dB
52.3dB
51.9dB
51.4dB
51.0dB
72.5dB
68.1dB
66.7dB
65.4dB
64.4dB
63.4dB
62.4dB
61.4dB
60.2dB
58.0dB
--------------------------------------
Example of the printed results - A5 format
The same result’s report printed in A4 format is presented below:
(C) SVANTEK
G7
No.12800 2007/08/03
(v6.06/6.06.2)
12:42:54
TITLE:
------------ SETTINGS -----------
------------ SETTINGS -----------
Device mode........:
Input..............:
Field correction...:
Device function....:
Outdoor filter.....: Off
LEVEL METER version: 6.06
SOUND METER
Microphone
FREE
LEVEL METER
8-5
G7 USER MANUAL
_
Meas. start date...:
Range..............:
Logger trigger.....:
Start delay........:
Calibr. factor.....:
Calibration date...:
Leq integration....:
Profile:
Filter:
Logger:
#1
A
None
2007/08/03
HIGH
Off
1 s
6.6 dB
2007/08/03
Linear
#2
C
None
Meas. start hour...:
Measure trigger....:
Repeat cycle.......:
Integration time...:
Calibration by.....:
Calibration hour...:
#3
Z
None
Profile:
Detector:
#1
FAST
12:42:04
Off
2
10 s
Measurement
12:39:58
#2
FAST
#3
FAST
-------------------- RESULTS -------------------Measurement time: 00:00:10
Prof.:
PEAK
MAX
MIN
SPL
LEQ
SEL
Ld
LEPd
Ltm3
Ltm5
#1
63.7
48.5
41.8
48.5
44.0
54.0
44.0
44.0
46.2
47.5
dB
dB
dB
dB
dB
dB
dB
dB
dB
dB
#2
68.9
56.1
50.2
55.9
53.0
63.0
53.0
53.0
55.4
55.6
dB
dB
dB
dB
dB
dB
dB
dB
dB
dB
#3
76.3
70.7
58.1
67.9
64.8
74.8
64.8
64.8
69.3
69.5
dB
dB
dB
dB
dB
dB
dB
dB
dB
dB
L01
L10
L20
L30
L40
L50
L60
L70
L80
L90
49.5
45.3
44.6
44.2
43.8
43.5
43.2
43.0
42.6
42.2
dB
dB
dB
dB
dB
dB
dB
dB
dB
dB
56.5
54.7
54.0
53.5
53.1
52.7
52.3
51.9
51.4
51.0
dB
dB
dB
dB
dB
dB
dB
dB
dB
dB
72.5
68.1
66.7
65.4
64.4
63.4
62.4
61.4
60.2
58.0
dB
dB
dB
dB
dB
dB
dB
dB
dB
dB
-------------------------------------------------
Example of the printed results from the SOUND METER mode (LEVEL METER) - A4 format
(C) SVANTEK
G7
No.12800 2007/08/03
(v6.06/6.06.2)
12:50:42
TITLE:
------------ SETTINGS -----------
------------ SETTINGS -----------
Device mode........:
Input..............:
Device function....:
Meas. start date...:
Range..............:
Ref.level for Vel..:
Measure trigger....:
Repeat cycle.......:
Integration time...:
Calibration by.....:
Calibration hour...:
Spectrum filter....:
Meas. start hour...:
Ref.level for Acc..:
Ref.level for Dil..:
Logger trigger.....:
Start delay........:
Calibr. factor.....:
Calibration date...:
RMS integration....:
Spectrum in logger.:
Profile:
Filter:
Logger:
#1
HP1
None
VIBR. METER
Accelerometer
1/3 OCTAVE
2007/08/03
LOW
1 nm/s
Off
1
1 m
Measurement
12:39:58
Z
#2
HP3
None
#3
HP10
None
Profile:
Detector:
-------------------- RESULTS -------------------Measurement time: 00:01:00
8-6
#1
1.0s
12:47:02
1 um/s2
1 pm
Off
1 s
0.0 dB
2007/08/03
Linear
None
#2
1.0s
#3
1.0s
G7 USER MANUAL
Prof.:
PEAK
P-P
MAX
RMS
VDV
#1
813
1.57
412
151
653
mm/s2
m/s2
mm/s2
mm/s2
mm/s1.75
--- 1/3 OCTAVE -[Hz]
0.80
1.00
1.25
1.60
2.00
2.50
3.15
4.00
5.00
6.30
8.00
10.00
12.50
16.00
20.00
[m/s2]
4.90e-02
5.82e-02
6.17e-02
8.32e-02
5.89e-02
5.07e-02
3.98e-02
3.35e-02
3.72e-02
2.63e-02
2.37e-02
3.13e-02
2.79e-02
1.05e-02
6.84e-03
#2
767
1.38
266
100
442
mm/s2
m/s2
mm/s2
mm/s2
mm/s1.75
#3
653
1.14
160
58.9
292
mm/s2
m/s2
mm/s2
mm/s2
mm/s1.75
--- 1/3 OCTAVE -[Hz]
25.00
31.50
40.00
50.00
63.00
80.00
100.00
125.00
160.00
200.00
250.00
315.00
400.00
500.00
630.00
[m/s2]
7.50e-03
1.72e-02
1.15e-02
9.02e-03
6.46e-03
4.27e-03
5.19e-03
5.82e-03
3.76e-03
7.24e-03
5.96e-03
4.95e-03
4.62e-03
5.82e-03
3.39e-03
--- 1/3 OCTAVE -[Hz]
[m/s2]
800.00 3.16e-03
1000.00 3.02e-03
1250.00 2.79e-03
1600.00 2.66e-03
2000.00 1.93e-03
2500.00 1.30e-03
3150.00 1.01e-03
4000.00 8.32e-04
5000.00 7.50e-04
6300.00 5.69e-04
8000.00 4.62e-04
10000.00 3.98e-04
12500.00 3.55e-04
16000.00 3.16e-04
20000.00 3.59e-04
-------- TOTALS FOR FILTERS ------Filter Type
R3
Acc
HP3
Acc
HP10
Acc
CF[dB]
0.0
0.0
0.0
Total
1.78e-01 m/s2
1.00e-01 m/s2
5.89e-02 m/s2
-----------------------------------
Example of the printed results from the VIBRATION METER mode (1/3 OCTAVE) - A4 format
The following confirmation question is displayed after the printing, if the Prompt parameter
was selected in the EJECT P. (path: MENU / REPORT / OPTIONS / EJECT P.). The user has to answer
in this case if the paper in the printer has to be ejected to the new page. The change of the available
answers is possible after pressing the <
>, <
> push-buttons. The return to the REPORT list
is performed after pressing the <ENTER> push-button with the possible ejection of the paper to the new
page.
Displays with the confirmation request of the paper ejection
The similar message is displayed after sending out the statistics of the results, the contents of the
selected file, the contents of the selected file in the logger and the catalogue of the files
(PRINT STATISTICS,
PRINT FILE,
PRINT LOGGER,
PRINT USER FILTERS
and
PRINT CATALOGUE).
The message about the time limit is displayed in the case when the printer (or a PC)
is not connected or there is any other reason that it does not receive the data. The instrument waits
for the reaction of the user (any push-button should be pressed except the <SHIFT> and <ALT> one)
and after pressing a push-button it returns to the REPORT list. Another message is presented
and the instrument waits for the reaction of the user in the case when there is no data to be printed.
8-7
G7 USER MANUAL
_
a)
b)
Displays during the results printing when there is no transfer (a) and no data (b)
8.3 Printing of the statistics of sound measurement results - PRINT STATISTICS
The PRINT STATISTICS enables the user to print the results of the statistics analysis
on the attached printer. This position is not accessible for the vibration measurements. In order to enter
the position the user has to select the PRINT STATISTICS text in the REPORT list, using the <
>, <
>
(or <
>, <
>) push-buttons and press the <ENTER>.
REPORT window with the PRINT STATISTICS selected
After pressing the <ENTER> push-button the instrument checks its current state. In the case when
the measurements are performed, the printing is impossible and the message is displayed.
Display after the attempt to perform an unavailable operation during measurement in progress
After pressing the <ENTER> push-button, in the case when a measurement was already performed
and a result is available, the message is displayed:
Display in the REPORT list; the execution of the PRINT STATISTICS
When the message is on the display, the data are transferred from the instrument to the attached
printer (or PC). The instrument returns to the REPORT list when all data are transferred but if the Prompt
parameter was selected in the EJECT P. (path: MENU / REPORT / OPTIONS / EJECT P.),
the confirmation question is displayed after the printing. The user has to answer in this case if the paper
in the printer has to be ejected to the new page. The change of the available answers is possible
after pressing the <
>, <
> push-buttons. The return to the REPORT list is performed after pressing
the <ENTER> push-button with the possible ejection of the paper to the new page.
8-8
G7 USER MANUAL
Displays with the confirmation request of the paper ejection
The printed statistics examples (format A5 and A4) are presented below:
(C) SVANTEK
2007/08/03
G7
(v6.06/6.06.2)
No.12800
13:27:14
TITLE:
------------ SETTINGS ----------Device mode........:
Input..............:
Field correction...:
Outdoor filter.....:
Device function....:
LEVEL METER version:
Meas. start date...:
Meas. start hour...:
Range..............:
Measure trigger....:
Logger trigger.....:
Repeat cycle.......:
Start delay........:
Integration time...:
Calibr. factor.....:
Calibration by.....:
Calibration date...:
Calibration hour...:
Leq integration....:
Profile:
Filter:
Detector:
Logger:
#1
A
FAST
None
SOUND METER
Microphone
FREE
Off
LEVEL METER
6.06
2007/08/03
13:09:54
LOW
Off
Off
1
1 s
1 m
6.6 dB
Measurement
2007/08/03
12:39:58
Linear
#2
C
FAST
None
#3
Z
FAST
None
--------- STATISTICS -------Measurement time: 00:01:00
Profile:
L01
L02
L03
L04
L05
L06
L07
L08
L09
L10
L11
L12
L13
L14
L15
L16
L17
L18
L19
L20
L21
#1
#2
[dB A] [dB C]
52.6
62.3
50.6
60.2
49.4
59.1
48.0
58.6
47.3
58.3
46.8
57.8
46.5
57.0
46.3
56.7
46.0
56.4
45.8
56.1
45.7
55.9
45.5
55.7
45.4
55.5
45.2
55.3
45.1
55.1
44.9
54.9
44.8
54.8
44.7
54.7
44.6
54.6
44.5
54.5
44.4
54.4
#3
[dB]
87.0
85.5
84.0
83.3
82.7
82.1
81.5
80.9
80.3
79.7
79.3
78.8
78.5
78.1
77.8
77.5
77.2
77.0
76.5
76.1
75.8
8-9
G7 USER MANUAL
_
L22
L23
L24
L25
L26
L27
L28
L29
L30
L31
L32
L33
L34
L35
L36
L37
L38
L39
L40
L41
L42
L43
L44
L45
L46
L47
L48
L49
L50
L51
L52
L53
L54
L55
L56
L57
L58
L59
L60
L61
L62
L63
L64
L65
L66
L67
L68
L69
L70
L71
L72
L73
L74
L75
L76
L77
L78
L79
L80
L81
L82
L83
L84
L85
L86
L87
L88
L89
L90
L91
L92
L93
8-10
44.3
44.2
44.1
44.0
43.9
43.9
43.8
43.8
43.7
43.6
43.6
43.5
43.5
43.4
43.3
43.3
43.2
43.2
43.1
43.0
43.0
42.9
42.9
42.8
42.8
42.7
42.6
42.6
42.5
42.5
42.4
42.4
42.3
42.3
42.2
42.2
42.1
42.0
42.0
41.9
41.9
41.8
41.8
41.7
41.6
41.6
41.5
41.5
41.4
41.3
41.3
41.2
41.2
41.1
41.1
41.0
40.9
40.9
40.8
40.7
40.6
40.5
40.4
40.3
40.3
40.2
40.1
40.0
39.8
39.6
39.4
39.1
54.3
54.2
54.1
54.0
53.8
53.7
53.6
53.5
53.4
53.3
53.2
53.1
53.0
52.9
52.8
52.7
52.6
52.6
52.5
52.4
52.3
52.2
52.1
52.0
51.9
51.9
51.8
51.7
51.6
51.5
51.5
51.4
51.3
51.2
51.1
51.1
51.0
50.9
50.9
50.8
50.7
50.7
50.6
50.5
50.5
50.4
50.4
50.3
50.2
50.2
50.1
50.0
50.0
49.9
49.8
49.7
49.7
49.6
49.5
49.4
49.3
49.2
49.1
49.1
49.0
48.8
48.7
48.5
48.3
48.2
48.0
47.8
75.6
75.4
75.1
74.9
74.7
74.5
74.3
74.1
74.0
73.7
73.5
73.3
73.1
72.9
72.7
72.4
72.2
72.0
71.7
71.4
71.1
70.8
70.5
70.2
69.9
69.7
69.6
69.4
69.2
69.0
68.7
68.3
67.9
67.7
67.5
67.2
67.0
66.8
66.5
66.2
65.9
65.5
65.2
64.9
64.6
64.3
64.1
63.8
63.5
63.3
63.0
62.7
62.4
62.1
61.8
61.5
61.2
60.9
60.6
60.4
60.1
59.9
59.7
59.5
59.3
59.1
58.8
58.5
58.2
57.8
57.5
57.1
G7 USER MANUAL
L94
L95
L96
L97
L98
L99
38.6
37.3
35.9
35.6
35.4
35.1
47.6
47.4
47.2
47.0
46.3
45.4
56.7
56.2
55.7
55.1
54.6
54.0
-----------------------------
Example of the printed statistics from the SOUND LEVEL METER mode - format A5
(C) SVANTEK
G7
No.12800 2007/08/03
(v6.06/6.06.2)
14:05:39
TITLE:
------------ SETTINGS ----------Device mode........:
Input..............:
Field correction...:
Device function....:
Meas. start date...:
Range..............:
Threshold level....:
Exposure time......:
Logger trigger.....:
Start delay........:
Calibr. factor.....:
Calibration date...:
Leq integration....:
Profile:
Filter:
Logger:
#1
A
None
SOUND METER
Microphone
FREE
DOSE METER
2007/08/03
LOW
None
08h00
Off
1 s
6.6 dB
2007/08/03
Linear
#2
C
None
#3
Z
None
--------- STATISTICS --------
------------ SETTINGS -----------
Outdoor filter.....: Off
Meas. start hour...:
Criterion level....:
Exchange rate......:
Measure trigger....:
Repeat cycle.......:
Integration time...:
Calibration by.....:
Calibration hour...:
Profile:
Detector:
#1
FAST
14:03:56
80 dB
3 dB
Off
1
30 s
Measurement
12:39:58
#2
FAST
#3
FAST
--------- STATISTICS --------
Measurement time: 00:00:30
Profile:
L01
L02
L03
L04
L05
L06
L07
L08
L09
L10
L11
L12
L13
L14
L15
L16
L17
L18
L19
L20
L21
L22
L23
L24
L25
L26
L27
L28
L29
#1
#2
[dB A] [dB C]
56.5
59.9
55.8
59.6
55.5
59.3
55.2
59.0
54.9
58.8
54.6
58.7
54.3
58.6
54.0
58.5
53.8
58.3
53.7
58.2
53.5
58.1
53.4
58.0
53.2
57.9
53.1
57.8
52.9
57.7
52.8
57.6
52.7
57.5
52.6
57.4
52.4
57.3
52.3
57.2
52.2
57.2
52.1
57.1
52.0
57.0
51.8
56.9
51.6
56.8
51.5
56.7
51.3
56.7
51.2
56.6
51.0
56.5
#3
[dB]
71.0
70.2
69.3
68.7
68.3
68.0
67.4
66.9
66.7
66.5
66.3
66.1
65.9
65.7
65.6
65.4
65.3
65.1
65.0
64.8
64.7
64.5
64.4
64.2
64.1
63.9
63.8
63.7
63.6
Profile:
L51
L52
L53
L54
L55
L56
L57
L58
L59
L60
L61
L62
L63
L64
L65
L66
L67
L68
L69
L70
L71
L72
L73
L74
L75
L76
L77
L78
L79
#1
#2
[dB A] [dB C]
48.7
54.8
48.6
54.7
48.5
54.7
48.5
54.6
48.4
54.5
48.3
54.5
48.3
54.4
48.2
54.3
48.1
54.2
48.1
54.2
48.0
54.1
47.9
54.0
47.8
54.0
47.8
53.9
47.7
53.8
47.6
53.7
47.5
53.6
47.5
53.5
47.4
53.4
47.3
53.3
47.2
53.3
47.1
53.2
47.1
53.1
47.0
53.0
46.9
52.9
46.8
52.8
46.8
52.8
46.7
52.7
46.6
52.6
#3
[dB]
61.3
61.3
61.2
61.1
61.0
61.0
60.9
60.8
60.7
60.6
60.5
60.4
60.3
60.2
60.1
60.0
59.9
59.8
59.7
59.7
59.6
59.5
59.4
59.3
59.3
59.2
59.1
59.0
59.0
8-11
G7 USER MANUAL
L30
L31
L32
L33
L34
L35
L36
L37
L38
L39
L40
L41
L42
L43
L44
L45
L46
L47
L48
L49
L50
50.9
50.8
50.7
50.6
50.5
50.4
50.3
50.2
50.1
50.0
49.8
49.7
49.6
49.5
49.3
49.2
49.1
49.0
48.9
48.8
48.7
_
56.4
56.3
56.3
56.2
56.1
56.0
56.0
55.9
55.8
55.7
55.6
55.6
55.5
55.4
55.3
55.2
55.2
55.1
55.0
54.9
54.9
63.5
63.4
63.3
63.2
63.1
63.0
62.8
62.7
62.6
62.5
62.3
62.2
62.1
62.0
61.9
61.8
61.7
61.6
61.6
61.5
61.4
-----------------------------
L80
L81
L82
L83
L84
L85
L86
L87
L88
L89
L90
L91
L92
L93
L94
L95
L96
L97
L98
L99
46.5
46.5
46.4
46.3
46.3
46.2
46.1
46.0
46.0
45.9
45.7
45.6
45.5
45.3
45.2
45.1
45.0
44.6
44.2
43.6
52.6
52.5
52.4
52.4
52.3
52.2
52.2
52.1
52.0
52.0
51.8
51.7
51.6
51.5
51.3
51.2
51.1
51.0
50.6
50.2
58.8
58.7
58.5
58.4
58.2
58.1
58.0
57.8
57.6
57.4
57.2
57.0
56.7
56.5
56.2
56.0
55.6
55.2
54.8
54.4
-----------------------------
Example of the printed statistics from the SOUND METER mode (DOSE METER) - format A4
The message about the time limit is displayed in the case when the printer is not connected or
there is any other reason that it does not receive the data. The instrument waits for the reaction
of the user (any push-button should be pressed except the <SHIFT> and <ALT>) and after pressing
a push-button it returns to the REPORT list. Another message is presented and the instrument waits
for the reaction of the user in the case when there is no data to be printed.
b)
a)
Displays during the statistics printing when there is no transfer (a) and no data (b)
8.4 Printing of the measurement results from the selected file - PRINT FILE
The PRINT FILE enables the user to print out on a printer connected directly to the instrument the
selected file with the measurement results or to send it to a PC using SvanPC software and the USB
interface. In order to enter the position the user has to select the PRINT FILE text in the REPORT list,
using the <
>, <
> (or <
>, <
>) push buttons and press the <ENTER>.
a)
b)
REPORT windows with the PRINT FILE selected in SM (a) and VM (b)
After pressing the <ENTER> push-button the instrument checks its current state. In the case when
the measurements are performed, the printing is impossible and the message is displayed.
8-12
G7 USER MANUAL
Display after the attempt to perform an unavailable operation during measurement in progress
If no files were saved in the instrument’s memory then after pressing <ENTER> a special message
is displayed and the unit waits for the reaction of the user. In this time any push-button should be pressed
except the <SHIFT> and <ALT> one and after pressing a push-button the instrument returns
to the REPORT list.
Display in the REPORT list; the PRINT FILE position when no files were saved
In the consecutive lines of the display the current file number, the total number of the files, the file
name, file type, date and time of registration are presented. The change of the current file with the unit
step can be done pressing the <
>, <
> push-buttons. After pressing the <
> with <SHIFT> push-button
the first file is available and after pressing the <
> with <SHIFT> push-button - the last one
is displayed.
Displays during the selection of the file to be printed
The contents of the selected file is sent out to a PC after pressing the <ENTER> push-button.
The following message is displayed on the display during the printing:
Display during the execution of the PRINT FILE operation
The instrument returns to the REPORT list when all data are transferred but if the Prompt
parameter was selected (path: MENU / REPORTS / OPTIONS / EJECT P. / Prompt), the described
in the PRINT RESULTS message is displayed on the display after the printing. The user has to answer
in this case if the Line Feed has to be added to the transferred data. The change of the available answers
is possible after pressing the <
>, <
> push-buttons. The return to the REPORT list is performed after
pressing the <ENTER> push-button with the possible Line Feed addition.
Display during the file sending out when there is no data transfer
8-13
G7 USER MANUAL
_
The message about the time limit is displayed in the case when the printer (or PC) is not connected
or there is any other reason that it does not receive the data. The instrument waits for the reaction
of the user (any push-button should be pressed except the <SHIFT> and <ALT> one) and it returns
to the REPORT list after pressing a push-button.
The exemplary printed file contents are presented below.
(C) SVANTEK
2007/08/06
G7
(v6.06/6.06.2)
No.12800
17:55:35
File name: 06AUG0
TITLE:
------------ SETTINGS ----------Device mode........:
Input..............:
Device function....:
Meas. start date...:
Meas. start hour...:
Range..............:
Ref.level for Acc..:
Ref.level for Vel..:
Ref.level for Dil..:
Measure trigger....:
Logger trigger.....:
Repeat cycle.......:
Start delay........:
Integration time...:
Calibr. factor.....:
RMS integration....:
Spectrum filter....:
Spectrum in logger.:
Profile:
Filter:
Detector:
Logger:
#1
HP1
1.0s
None
VIBR. METER
Accelerometer
1/3 OCTAVE
2007/08/06
17:52:52
HIGH
1 um/s2
1 nm/s
1 pm
Off
Off
1
1 s
30 s
0.0 dB
Linear
Z
None
#2
HP3
1.0s
None
#3
HP10
1.0s
None
--------------- RESULTS -------------Measurement time: 00:00:30
Prof.:
#1
PEAK
794mm/s2
P-P
1.36 m/s2
MAX
282mm/s2
RMS
122mm/s2
VDV
442mm/sX
Remark:
X = 1.75
--- 1/3 OCTAVE -[Hz]
0.80
1.00
1.25
1.60
2.00
2.50
3.15
4.00
5.00
6.30
8.00
10.00
12.50
8-14
[m/s2]
2.04e-02
3.98e-02
4.68e-02
3.98e-02
2.88e-02
2.32e-02
3.02e-02
3.16e-02
4.03e-02
1.70e-02
2.79e-02
1.38e-02
2.85e-02
#2
525mm/s2
1.00 m/s2
150mm/s2
93.3mm/s2
305mm/sX
#3
543mm/s2
989mm/s2
79.4mm/s2
62.4mm/s2
204mm/sX
G7 USER MANUAL
16.00
20.00
25.00
31.50
40.00
50.00
63.00
80.00
100.00
125.00
160.00
200.00
250.00
315.00
400.00
500.00
630.00
800.00
1000.00
1250.00
1600.00
2000.00
2500.00
3150.00
4000.00
5000.00
6300.00
8000.00
10000.00
12500.00
16000.00
20000.00
1.00e-02
6.24e-03
6.76e-03
2.16e-02
1.95e-02
9.89e-03
6.76e-03
4.42e-03
1.07e-02
8.71e-03
5.69e-03
1.16e-02
1.12e-02
6.76e-03
6.76e-03
7.76e-03
5.56e-03
4.32e-03
4.42e-03
4.27e-03
3.47e-03
2.29e-03
1.91e-03
1.29e-03
1.20e-03
1.68e-03
1.16e-03
1.26e-03
1.70e-03
1.57e-03
1.91e-03
2.02e-03
-------- TOTALS FOR FILTERS ------Filter Type
HP1
Acc
HP3
Acc
HP10
Acc
CF[dB]
0.0
0.0
0.0
Total
1.32e-01 m/s2
9.33e-02 m/s2
6.24e-02 m/s2
-----------------------------------
Example of the printed file from the VIBRATION METER mode (1/3 OCTAVE) - format A5
(C) SVANTEK
G7
No.12800 2007/08/06
(v6.06/6.06.2)
17:57:59
File name: 03AUGST
TITLE:
------------ SETTINGS ----------Device mode........:
Input..............:
Field correction...:
Device function....:
Meas. start date...:
Range..............:
Logger trigger.....:
Start delay........:
Calibr. factor.....:
Calibration date...:
Leq integration....:
Profile:
Filter:
Logger:
#1
A
None
SOUND METER
Microphone
FREE
LEVEL METER
2007/08/03
LOW
Off
1 s
6.6 dB
2007/08/03
Linear
#2
C
None
#3
Z
None
------------ SETTINGS -----------
Outdoor filter.....:
LEVEL METER version:
Meas. start hour...:
Measure trigger....:
Repeat cycle.......:
Integration time...:
Calibration by.....:
Calibration hour...:
Profile:
Detector:
#1
FAST
Off
6.06
13:09:54
Off
1
1 m
Measurement
12:39:58
#2
FAST
#3
FAST
-------------------- RESULTS --------------------
8-15
G7 USER MANUAL
_
Measurement time: 00:01:00
Prof.:
PEAK
MAX
MIN
SPL
LEQ
SEL
Ld
LEPd
Ltm3
Ltm5
#1
76.1
60.0
34.8
47.5
44.3
62.1
44.3
44.3
50.5
52.2
dB
dB
dB
dB
dB
dB
dB
dB
dB
dB
#2
75.9
64.6
44.7
60.0
53.5
71.3
53.5
53.5
57.9
59.6
dB
dB
dB
dB
dB
dB
dB
dB
dB
dB
#3
92.7
89.7
53.6
72.7
76.0
93.8
76.0
76.0
82.7
82.7
dB
dB
dB
dB
dB
dB
dB
dB
dB
dB
L01
L10
L20
L30
L40
L50
L60
L70
L80
L90
52.6
45.8
44.5
43.7
43.1
42.5
42.0
41.4
40.8
39.8
dB
dB
dB
dB
dB
dB
dB
dB
dB
dB
62.3
56.1
54.5
53.4
52.5
51.6
50.9
50.2
49.5
48.3
dB
dB
dB
dB
dB
dB
dB
dB
dB
dB
87.0
79.7
76.1
74.0
71.7
69.2
66.5
63.5
60.6
58.2
dB
dB
dB
dB
dB
dB
dB
dB
dB
dB
--------- STATISTICS --------
--------- STATISTICS --------
Measurement time: 00:01:00
Profile:
L01
L02
L03
L04
L05
L06
L07
L08
L09
L10
L11
L12
L13
L14
L15
L16
L17
L18
L19
L20
L21
L22
L23
L24
L25
L26
L27
L28
L29
L30
L31
L32
L33
L34
L35
L36
L37
L38
L39
L40
L41
8-16
#1
#2
[dB A] [dB C]
52.6
62.3
50.6
60.2
49.4
59.1
48.0
58.6
47.3
58.3
46.8
57.8
46.5
57.0
46.3
56.7
46.0
56.4
45.8
56.1
45.7
55.9
45.5
55.7
45.4
55.5
45.2
55.3
45.1
55.1
44.9
54.9
44.8
54.8
44.7
54.7
44.6
54.6
44.5
54.5
44.4
54.4
44.3
54.3
44.2
54.2
44.1
54.1
44.0
54.0
43.9
53.8
43.9
53.7
43.8
53.6
43.8
53.5
43.7
53.4
43.6
53.3
43.6
53.2
43.5
53.1
43.5
53.0
43.4
52.9
43.3
52.8
43.3
52.7
43.2
52.6
43.2
52.6
43.1
52.5
43.0
52.4
#3
[dB]
87.0
85.5
84.0
83.3
82.7
82.1
81.5
80.9
80.3
79.7
79.3
78.8
78.5
78.1
77.8
77.5
77.2
77.0
76.5
76.1
75.8
75.6
75.4
75.1
74.9
74.7
74.5
74.3
74.1
74.0
73.7
73.5
73.3
73.1
72.9
72.7
72.4
72.2
72.0
71.7
71.4
Profile:
L51
L52
L53
L54
L55
L56
L57
L58
L59
L60
L61
L62
L63
L64
L65
L66
L67
L68
L69
L70
L71
L72
L73
L74
L75
L76
L77
L78
L79
L80
L81
L82
L83
L84
L85
L86
L87
L88
L89
L90
L91
#1
#2
[dB A] [dB C]
42.5
51.5
42.4
51.5
42.4
51.4
42.3
51.3
42.3
51.2
42.2
51.1
42.2
51.1
42.1
51.0
42.0
50.9
42.0
50.9
41.9
50.8
41.9
50.7
41.8
50.7
41.8
50.6
41.7
50.5
41.6
50.5
41.6
50.4
41.5
50.4
41.5
50.3
41.4
50.2
41.3
50.2
41.3
50.1
41.2
50.0
41.2
50.0
41.1
49.9
41.1
49.8
41.0
49.7
40.9
49.7
40.9
49.6
40.8
49.5
40.7
49.4
40.6
49.3
40.5
49.2
40.4
49.1
40.3
49.1
40.3
49.0
40.2
48.8
40.1
48.7
40.0
48.5
39.8
48.3
39.6
48.2
#3
[dB]
69.0
68.7
68.3
67.9
67.7
67.5
67.2
67.0
66.8
66.5
66.2
65.9
65.5
65.2
64.9
64.6
64.3
64.1
63.8
63.5
63.3
63.0
62.7
62.4
62.1
61.8
61.5
61.2
60.9
60.6
60.4
60.1
59.9
59.7
59.5
59.3
59.1
58.8
58.5
58.2
57.8
G7 USER MANUAL
L42
L43
L44
L45
L46
L47
L48
L49
L50
43.0
42.9
42.9
42.8
42.8
42.7
42.6
42.6
42.5
52.3
52.2
52.1
52.0
51.9
51.9
51.8
51.7
51.6
71.1
70.8
70.5
70.2
69.9
69.7
69.6
69.4
69.2
-----------------------------
L92
L93
L94
L95
L96
L97
L98
L99
39.4
39.1
38.6
37.3
35.9
35.6
35.4
35.1
48.0
47.8
47.6
47.4
47.2
47.0
46.3
45.4
57.5
57.1
56.7
56.2
55.7
55.1
54.6
54.0
-----------------------------
Example of the printed file from the SOUND METER mode (LEVEL METER) - format A4
8.5 Printing of the logger results - PRINT LOGGER
The PRINT LOGGER enables the user to print out on a printer connected directly to the instrument
the measurement results in a selected file from the logger or to send them to a PC using SvanPC
software and USB interface. In order to enter the position the user has to select the PRINT LOGGER text
in the REPORT list, using the <
>, <
> (or <
>, <
>) push buttons and press the <ENTER>. This
option is under development - Function not available text appears on the display.
a)
b)
REPORT windows with the PRINT LOGGER selected in SM (a) and VM (b)
PRINT LOGGER window opened - Function not available message
8.6 Printing of the coefficients of the user filters - PRINT USER FILTERS
The PRINT USER FILTERS enables the user to print out the values of the user filters introduced
in the instrument: S1, S2, S3.
a)
b)
REPORT windows with the PRINT USER FILTERS selected in SM and in VM
In order to enter the position the user has to select the PRINT USER FILTERS text in the REPORT
list, using the <
>, <
> (or <
>, <
>) push buttons and press the <ENTER>. After pressing the
<ENTER> push-button the instrument checks its current state. In the case when the measurements are
performed, the printing is impossible and the message is displayed.
8-17
G7 USER MANUAL
_
Display after the attempt to perform an unavailable operation during measurement in progress
The selection of the USER FILTER is made by means of the <
>, <
> push buttons.
PRINT USER FILTERS windows; the user filter selection
The contents of the selected file is sent out to the attached printer (or to a PC) after pressing
the <ENTER> push-button. The following message is displayed on the display during the printing:
Display in the REPORT list; the execution of the PRINT USER FILTERS
When the message is on the display, the data are transferred from the instrument to the attached
printer (or PC). The instrument returns to the REPORT list after transferring all data.
In the case when the printer or PC is not connected or there is any other reason that it does not
receive the data the message about the time limit is displayed. The instrument waits for the reaction
of the user (any push-button should be pressed except the <SHIFT> and <ALT>) and after pressing
a push-button it returns to the REPORT list.
Display during the file transfer from the logger when there is no data transfer
The exemplary USER FILTER coefficients printed in A4 format look as follows:
(C) SVANTEK
G7
No.12800 2007/08/06
(v6.06/6.06.2)
17:59:59
Sound meter mode filter
------- S1 -----[Hz]
0.80
1.00
1.25
1.60
2.00
2.50
8-18
[dB]
-INF
-100.0
-90.0
-80.0
-70.0
-60.0
------- S1 -----[Hz]
25.00
31.50
40.00
50.00
63.00
80.00
[dB]
40.0
50.0
60.0
70.0
80.0
90.0
------- S1 -----[Hz]
800.00
1000.00
1250.00
1600.00
2000.00
2500.00
[dB]
10.0
0.0
-10.0
-20.0
-30.0
-40.0
G7 USER MANUAL
3.15
4.00
5.00
6.30
8.00
10.00
12.50
16.00
20.00
-50.0
-40.0
-30.0
-20.0
-10.0
0.0
10.0
20.0
30.0
100.00
125.00
160.00
200.00
250.00
315.00
400.00
500.00
630.00
-----------------
100.0
90.0
80.0
70.0
60.0
50.0
40.0
30.0
20.0
-----------------
3150.00
4000.00
5000.00
6300.00
8000.00
10000.00
12500.00
16000.00
20000.00
-50.0
-60.0
-70.0
-80.0
-90.0
-100.0
-INF
-INF
-INF
-----------------
Example of the printed coefficients of the user filter S1- format A4
(C) SVANTEK
G7
2007/08/06
(v6.06/6.06.2)
No.12800
18:05:35
Sound meter mode filter
------- S2 -----[Hz]
0.80
1.00
1.25
1.60
2.00
2.50
3.15
4.00
5.00
6.30
8.00
10.00
12.50
16.00
20.00
25.00
31.50
40.00
50.00
63.00
80.00
100.00
125.00
[dB]
-INF
-INF
-INF
-INF
0.0
0.0
0.0
0.0
0.0
0.0
0.0
0.0
0.0
0.0
0.0
0.0
0.0
0.0
0.0
0.0
0.0
1.0
0.0
-----------------
------- S2 -----[Hz]
160.00
200.00
250.00
315.00
400.00
500.00
630.00
800.00
1000.00
1250.00
1600.00
2000.00
2500.00
3150.00
4000.00
5000.00
6300.00
8000.00
10000.00
12500.00
16000.00
20000.00
[dB]
1.0
1.0
1.0
3.0
3.0
3.0
1.0
1.0
1.0
1.0
1.0
0.0
0.0
0.0
0.0
0.0
0.0
0.0
-INF
-INF
-INF
-INF
-----------------
Example of the printed coefficients of the user filter S2 - format A5
8.7 Printing of the file’s catalogue - PRINT CATALOGUE
The PRINT CATALOGUE enables the user to print the catalogue of the files stored
in the instrument on the attached printer. In order to enter the position the user has to select
the PRINT CATALOGUE text in the REPORT list, using the <
>, <
> (or <
>, <
>) push buttons
and press the <ENTER>.
b)
a)
REPORT windows with the PRINT CATALOGUE selected in SM (a) and VM (b)
8-19
G7 USER MANUAL
_
After pressing the <ENTER> push-button the instrument checks its current state. In the case when
the measurements are performed, the printing is impossible and the message is displayed.
Display after the attempt to perform an unavailable operation during measurement in progress
After pressing the <ENTER> push-button the following message is displayed:
Display in the REPORT list; the execution of the PRINT CATALOGUE
When the message is on the display, the data are transferred from the instrument to the attached
printer.
The instrument returns to the REPORT list after transferring all data but if the Prompt parameter
was selected in the EJECT P. (path: MENU / REPORT / OPTIONS / EJECT P.), the confirmation question
is displayed after the printing. The user has to answer in this case if the paper in the printer has to be
ejected to the new page. The change of the available answers is possible after pressing the <>, <>
push-buttons.
The return to the REPORT list is performed after pressing the <ENTER> push-button with the
possible ejection of the paper to the new page.
Displays with the confirmation request of the paper ejection
The exemplary printed catalogue is presented below.
(C) SVANTEK
G7
No.12800 2007/08/06
CATALOGUE CONTENTS
Name
03AUG0
03AUGST
06AUG0
Mf Length
<Sl>
466
<Sl>
1946
<Vt>
486
(v6.06/6.06.2)
Number of files: 5
Date
07/08/03
07/08/03
07/08/06
Time
12:42
13:11
17:53
--------------------------------------
Name
Mf Length
03AUG0CT <Vt>
486
03AUGDOS <Sd>
1946
Date
07/08/03
07/08/03
Time
12:50
14:05
--------------------------------------
Example of the printed catalogue - format A4
8-20
18:04:18
G7 USER MANUAL
The same catalogue printed in A5 format looks as follows:
(C) SVANTEK
2007/08/06
G7
(v6.06/6.06.2)
No.12800
18:05:38
CATALOGUE CONTENTS
Number of files: 5
Name
03AUG0
03AUG0CT
03AUGST
03AUGDOS
06AUG0
Mf Length
<Sl>
466
<Vt>
486
<Sl>
1946
<Sd>
1946
<Vt>
486
Date
07/08/03
07/08/03
07/08/03
07/08/03
07/08/06
Time
12:42
12:50
13:11
14:05
17:53
--------------------------------------
Example of the printed catalogue - format A5
When the catalogue of the files is empty (the measurement results were not saved), the instrument
returns to the REPORT list without any reaction.
Display during the catalogue printing when there is no data transfer
8.8 Selection of the printing options - OPTIONS
Using the OPTIONS the user can select the format of the listing (FORMAT), can control the way
the paper is ejected in the printer (EJECT P.). In order to enter the position the user has to select
the OPTIONS text in the REPORT list, using the <
>, <
> (or <
>, <
>) push-buttons and press
the <ENTER>.
a)
b)
REPORT windows with the OPTION selected in SM (a) and in VM (b)
8.9 Selection of the format of the print out - FORMAT
The FORMAT enables the user to select the format of the listing (A4 and A5 options are available).
In order to confirm the selection the <ENTER> push-button has to be pressed. After this confirmation,
the OPTIONS sub-list is closed. In order to ignore any changes made in the OPTIONS sub-list the user
has to press the <ESC> push-button.
OPTIONS windows; the selection of the format
8-21
G7 USER MANUAL
_
8.10 Controlling the paper ejection after print out - EJECT P.
The EJECT P. enables the user to control the ejection of the paper after the listing is done.
The following options are available: Prompt (the instrument asks whether to eject the page after printing
report, statistics or catalogue), Auto (after printing, the paper is ejected) and None (the paper
is not ejected after printing). In particular, it is possible to have one result after another using the None
or Prompt options.
In the EJECT P. position any change is performed by means of the <
>, <
> push-buttons.
In order to confirm the selection the <ENTER> push-button has to be pressed. After this confirmation,
the OPTIONS sub-list is closed. In order to ignore any changes made in the OPTIONS sub-list the user
has to press the <ESC> push-button.
OPTIONS windows; the selection of the paper ejection
The request is displayed after the printing of the measurement results, the statistics of the results,
the contents of the selected file, the contents of the selected file in the logger and the catalogue of the
files (PRINT RESULTS, PRINT STATISTICS, PRINT FILE, PRINT LOGGER, PRINT USER FILTERS,
PRINT CATALOGUE) if the Prompt parameter was selected in the EJECT P. position of the OPTIONS
sub-list. The user has to answer in this case if the paper in the printer has to be ejected to the new page.
The change of the available answers is possible after pressing the <
>, <
> push-buttons. The return
to the REPORT list is performed after pressing the <ENTER> push-button with the possible ejection
of the paper to the new page.
Displays with the request for the confirmation of the paper ejection
The message about the time limit is displayed in the case when the printer is not connected or
there is any other reason that it does not eject a paper. The instrument waits for the reaction of the user
(any push-button should be pressed except the <SHIFT> one) and after pressing a push-button it returns
to the REPORT list.
Display after a printing when there is not possible to eject a paper
8-22
G7 USER MANUAL
9 SETUP MENU - SETUP
The SETUP list contains different sub-lists and positions. Some of them are directly related with
sound or vibration measurements, and some - with the settings of the hardware components of the
instrument. In order to open the SETUP list the user has to:
• press the <MENU> push-button,
• select from the main list, using the <
>, <
> (or <
>, <
>) push-buttons, the SETUP text (highlight it
inversely),
• press the <ENTER> push-button.
Display in the main list; the SETUP text highlighted (displayed inversely)
In the SETUP list, the following items are available:
LANGUAGE
it enables the user to set language of the user interface.
CLEAR SETUP
it enables the user to return to the default, factory setup.
COMPENSATION FILTER
it enables the user to set the type of compensation filter for sound
measurements. This position is taken off from the menu in the vibration
meter mode
DAY TIME LIMITS
it enables the user to select the hours limiting day and night for
the calculation of the Lden result. This position is taken off from the menu
in the vibration meter mode.
EXPOSURE TIME
it enables the user to define the exposure time used for the LEPd
measurement and other DOSE METER results. This position is taken off
from the menu in the vibration meter mode.
EXTERNAL I/O SETUP
it enables the user to select the available functionality of the Ext. I/O port.
HUMAN VIB. FILT.
it enables the user to activate HUMAN VIBRATION FILTERS. This
position appears only in vibration mode before activation of those filters.
IEPE CURRENT
it enables the user to choose current IEPE supply.
REFERENCE LEVELS
it enables the user to select the reference level for the vibration
measurements and it informs the user about the reference level
in the sound measurements.
REMOTE COMMUNICATION it enables the user to select the type of remote communication and
packet size for data transmission.
RMS INTEGRATION
it enables the user to select the way of integration for the “family”
of the LEQ measurements.
RS232
it enables the user to set the transmission speed and the timeout
in the RS232 interface.
RTC
it enables the user to set the Real Time Clock.
RT60 AVERAGING
this position appears only in RT60 mode it enables the user to switch on
and reset averaging and it informs the user how many measurement
were taken to the averaging process calculation
RT60 OPTIONS
context position (appears only in case of RT60 measurements) it enables
the user to set the auxiliary parameters of RT 60 mode
RT60 RESULTS
this position appears only in case of RT60 mode, it enables the user set
which of the reverberation time results (EDT, RT20, RT30) will be
presented in the visualization levels to each 1/3 octave band:
SHIFT MODE
it enables the user to set the operating mode of the <SHIFT> and
the <START / STOP> push-buttons.
9-1
G7 USER MANUAL
STATISTICAL LEVELS
TIMER
USB–HOST PORT
USER FILTERS
VIBRATION UNITS
WARNINGS
_
it enables the user to select ten statistic levels to be displayed
in one profile and 3 PROFILES modes and saved in the files
with the main results. This position is taken off from the menu
in the vibration meter mode.
it enables the user to set the Timer function.
it enables the user to select the available functionality of the USB Host
port.
it enables the user to select and set the correcting values for all real-time
and 1/1 and 1/3 octave filters.
it enables the user to select the vibration units in which the results
of the measurements are to be given. This position is taken off
from the menu in the sound meter mode.
it enables the user to switch on or off the warnings that can be displayed
during the operation of the instrument.
Pressing the <SHIFT> and <
> (or <SHIFT> and <
>) push-buttons results in a movement
to the first position of the opened list and pressing the <SHIFT> and <
> (or <SHIFT> and <
>) – results
in a movement to the last position of the opened list.
In each available position any change is performed by means of the <
>, <
> push-buttons.
In order to confirm the selection the <ENTER> push-button has to be pressed. After this confirmation,
the opened window or list is closed. In order to ignore any changes made in the opened window or list
the user has to press the <ESC> push-button.
SETUP list in the SM
Notice: The abbreviation SM – Sound Mode refers to the sound mode (SOUND METER) and
the proper functions dedicated for the measurement and analysis of the acoustic signal: LEVEL METER,
1/1 OCTAVE, 1/3 OCTAVE, FFT, DOSIMETER and RT60; VM – Vibration Mode refers to the vibration
mode (VIBRATION METER) and the proper functions dedicated for the measurement and analysis of the
vibration signal: LEVEL METER, 1/1 OCTAVE, 1/3 OCTAVE and FFT.
SETUP list in the VM
9.1 Setting the language of the user interface - LANGUAGE
The LANGUAGE enables one to select the language of the user interface. In order to enter the list
one has to press the <ENTER> push-button on the inversely displayed LANGUAGE text of the SETUP
list. The selection is made by placing a special character by means of the <
>, <
> push-buttons
in the line with the selected language. Pressing the <SHIFT> and <
> (or <SHIFT> and <
>) pushbuttons results in a movement to the first position of the opened list and pressing the <SHIFT> and <
>
(or <SHIFT> and <
>) – results in a movement to the last position of the opened list. The selection
is confirmed and the list is closed after pressing the <ENTER> push-button. The list is closed without any
confirmation after pressing the <ESC> push-button.
9-2
G7 USER MANUAL
SETUP list; the LANGUAGE text highlighted (displayed inversely)
Displays with the English version of the user interface
Displays with the Italian version of the user interface
Displays with the Polish version of the user interface
Displays with the Hungarian version of the user interface
Displays with the Flemish version of the user interface
Displays with the French version of the user interface
9-3
G7 USER MANUAL
_
Displays with the Spanish version of the user interface
Displays with the German version of the user interface
Displays with the Turkish version of the user interface
For activation of the Russian version of the user interface, the special code has to be entered.
Displays during the entering of the access code to the Russian version of the user interface
Displays with the Russian version of the user interface available only on some markets
9.2 Return to the factory settings - CLEAR SETUP
The CLEAR SETUP enables the user to return to the default set up of the instrument.
In order to enter the position the user has to select the CLEAR SETUP text in the SETUP list, using
the <
>, <
> (or <
>, <
>) push-buttons and press the <ENTER>.
SETUP list; the CLEAR SETUP text highlighted (displayed inversely)
9-4
G7 USER MANUAL
After entering this position, the request for the confirmation is displayed. The proper answer
for the request is selected by means of the <
>, <
> push-buttons. The instrument returns to the default
set up after pressing the <ENTER> push-button in the case when the answer YES was chosen.
Displays with the request for the confirmation for the CLEAR SETUP execution
During the clearing process the message WAIT... is displayed. The following message is displayed
after the return to the default settings and the instrument waits for the user’s reaction.
Displays during and after the execution of the CLEAR SETUP function
The window is closed and the instrument returns to the SETUP list after pressing any push-button
with an exception of the <SHIFT> and the <ALT> one.
9.3 Compensation filter selection- COMPENSATION FILTER
The COMPENSATION FILTER position is available only in case of the sound measurements ( in
the MODE sublist the SOUND METER position is selected). It enables the user to switch off or select the
required compensation filter for sound measurements. In order to enter the window the user has to select
the COMPENSATION FILTER text in the SETUP list, using the <
>, <
> (or <
>, <
>) push-buttons
and press the <ENTER>. Selection of the option is made by placing a special character in the line with the
name of the proper option and pressing <ENTER>. The frequency characteristics of the filters is given in
App. D.
SETUP list; the COMPENSATION FILTER text highlighted (displayed inversely)
The following options are available: OFF (switches off the compensation filter and microphone
noise compensation /in other options microphone noise compensation is always switched on/)
FREE FIELD (compensation filter for the measurements performed in the free field conditions which
corrects the case effect), DIFFUSE FIELD (compensation filter for measurements performed in the diffuse
field conditions), OUTDOOR ENVIRON. (compensation filter for measurements when the acoustic signal
is perpendicular to the microphone’s grid with correction of SA 203 (outdoor microphone kit) effect,
OUTDOOR AIRPORT (compensation filter which is used when the acoustic signal is parallel to the
microphone’s grid with correction of SA 203 (outdoor microphone kit) effect, EXTENSION CABLE (in
case of this option only internal noise compensation is switched on, option can be used in case when
the microphone is connected with the instrument by the cable) .
9-5
G7 USER MANUAL
_
Compensation filter window with all available options
During the calibration by measurement the selected compensation filter is automatically switched
off. At the first measurement after the calibration on the display appears a question whether the user
wants to switch on the filter which was switched on before the calibration again. The selection of YES or
NO is made with <
>, <
> push- buttons and for confirmation the user has to press <ENTER>. After
switching on the compensation filter the first measurement is made with 5 seconds delay.
Displays with the question about switching on the compesation filter
9.4 Day time limits selection - DAY TIME LIMITS
The DAY TIME LIMITS enables the user to select the required by the local standards determination
of the day and night. These limits are used for the calculation of the Lden function (cf. App. D for the
definition). In order to enter the window the user has to select the DAY TIME LIMITS text in the SETUP
list, using the <
>, <
> (or <
>, <
>) push-buttons and press the <ENTER>.
SETUP list with the DAY TIME LIMITS text highlighted (displayed inversely)
Two options are available: 6H–18H and 7H–19H. The required limits can be selected by means
of the <
>, <
> push-buttons.
The window is closed and the instrument returns to the SETUP list after pressing the <ENTER>
(with the confirmation of a change made in the position) or <ESC> push-button (ignoring a change made
in the position).
Displays with the available DAY TIME LIMITS
9-6
G7 USER MANUAL
9.5 Exposure time setting - EXPOSURE TIME
The EXPOSURE TIME enables the user to set the desired value of the exposure time that
is used for the calculation of different DOSE METER functions as well as LEPd that is also calculated
in the LEVEL METER mode (cf. App. D for the definitions of the functions).
In order to enter the window the user has to select the EXPOSURE TIME text in the SETUP list,
using the <
>, <
> (or <
>, <
>) push-buttons and press the <ENTER>. This sub-list is available only
in the sound mode; in vibration mode it is taken off from the SETUP list.
SETUP list with the EXPOSURE TIME text highlighted (displayed inversely)
The EXPOSURE TIME values are within the range [00h01, 08h00]. The required value can be set
using the <
>/ <
> push-buttons – after each pressing the exposure time is decremented / incremented
by one second. The step can be decremented / incremented up to 30 minutes after pressing the <
>/
<
> push-buttons together with the <SHIFT> one.
The window is closed and the instrument returns to the SETUP list after pressing the <ENTER>
(with the confirmation of a change made in the position) or <ESC> push-buttons (ignoring a change made
in the position).
EXPOSURE TIME windows
9.6 Setting parameters of the Ext. I/O port - EXTERNAL I/O SETUP
The EXTERNAL I/O SETUP enables the user to select the available functionality of the Ext. I/O
port. In order to enter the window the user has to select the EXTERNAL I/O SETUP text in the SETUP
list, using the <
>, <
> (or <
>, <
>) push-buttons and press the <ENTER> one.
SETUP list, the EXTERNAL I/O SETUP text highlighted
In order to select a value in a position of the sub-list the <
>, <
> should be pressed.
The position of the sub-list is changed after pressing the <
>, <
> push-buttons. In order to confirm
9-7
G7 USER MANUAL
_
the selection the <ENTER> push-button has to be pressed. Such pressing closes the sub-list.
After pressing the <ESC> push-button the sub-list is also closed but all changes, which were made, are
ignored.
9.6.1 Mode selection of the Ext. I/O port - MODE
In the MODE, it is possible to select the function of the instrument’s socket named as Ext. I/O.
This socket can be used as
• the output of the analogue signal (ANALOG OUT) transmitted from the input of the instrument
to its output without any digital processing (i.e. filtering),
• the input of the digital signal used as an external trigger to start the measurements (DIGITAL IN)
in the “slave” instrument,
• the digital output (DIGITAL OUT) used for triggering other “slave” instrument from the “master” one,
• the source of any alarm signal in the case of certain circumstances occurred during the measurements
(i.e. the level of the input signal was higher than selected one).
The more detailed description of the Ext. I/O is given in App. C.
To select the mode, the user has to use the <
>, <
> push-buttons in the line with the MODE text.
The window is closed and the instrument returns to the SETUP list after pressing the <ENTER>
(with the confirmation of all changes made there) or <ESC> push-buttons (ignoring all changes).
EXTERNAL I/O SETUP windows; the MODE selection
In the case of ANALOG OUT selection there are two options DIRECT and D/A (Digital/Analog).
To select the option the user has to place a special character in the line with the option’s name using <
>,
<
> and <
>, <
> push-buttons. In the case of D/A option the SOURCE position appears on the
display. The available sources are as follows: A, C, Z, 1 Hz, 2 Hz, ..., 20 Hz. The selection of the
SOURCE is made by means of <
>, <
> push-buttons and pressing <ENTER>.
EXTERNAL I/O SETUP windows; D/A selection
EXTERNAL I/O SETUP windows; the source selection for D/A option
9-8
G7 USER MANUAL
In the case of DIGITAL IN selection the signal appearing on the I/O socket will be treated
as the external trigger if the EXT. I/O is chosen (path: MENU / INPUT / TRIGGER SETUP /
MEASURE TRIGGER / SOURCE / EXT. I/O) and it can be set only if SLOPE + or SLOPE – was set as a
TRIGGER (path: MENU / INPUT / TRIGGER SETUP / MEASURE TRIGGER / TRIGGER).
MEASURE TRIGGER windows; the TRIGGER selection
9.6.2 Digital output function selection of the I/O socket - FUNCTION
In the FUNCTION, it is possible to set the function of the digital output of the I/O instrument’s
socket. The socket can be used as the source of the trigger pulse (TRIG. PULSE) which starts the
measurement in another “slave” instrument linked to the “master” one or the alarm signal which appears
there after fulfilling certain measurement conditions (ALARM PULSE).
In order to select the function of the digital output the user has to use the <
>, <
> push-buttons in
the active line with the FUNCTION text. The window is closed and the instrument returns to the SETUP
list after pressing the <ENTER> (with the confirmation of all changes made there) or <ESC> push-buttons
(ignoring all changes).
EXTERNAL I/O SETUP windows; the FUNCTION selection
9.6.3 Polarisation selection of the digital output signal - POLARISATION
In the POLARISATION, it is possible to select which polarisation of the signal (negative or positive)
will be valid.
In order to select the polarisation the user has to use the <
>, <
> push-buttons in the active line
with the POLARISATION text. The window is closed and the instrument returns to the SETUP list after
pressing the <ENTER> (with the confirmation of all changes made there) or <ESC> push-buttons
(ignoring all changes).
EXTERNAL I/O SETUP windows; the POLARISATION selection
9.6.4 Active level selection of the digital output signal - ACTIVE LEVEL
In the ACTIVE LEVEL, it is possible to select which level of the signal should be treated as a valid
one (“negative” or “positive” logic).
9-9
G7 USER MANUAL
_
In order to select the level the user has to use the <
>, <
> push-buttons in the active line
with the ACTIVE LEVEL text. The window is closed and the instrument returns to the SETUP list
after pressing the <ENTER> (with the confirmation of all changes made there) or <ESC> push-buttons
(ignoring all changes).
EXTERNAL I/O SETUP windows; the ACTIVE LEVEL selection
9.6.5 Source signal selection for the alarm pulse generation - SOURCE
In the SOURCE, it is possible to select the measurement result which level should be checked.
If the measured result level is greater than selected alarm level – the instrument will generate alarm signal
on the I/O socket. The measurement results from the first profile: PEAK(1), SPL(1) or LEQ(1) can be
used for the purpose described above.
In order to select the function of the digital output the user has to use the <
>, <
> push-buttons in
the active line with the SOURCE text. The window is closed and the instrument returns to the SETUP list
after pressing the <ENTER> (with the confirmation of all changes made there) or <ESC> push-buttons
(ignoring all changes).
EXTERNAL I/O SETUP windows; the SOURCE selection
9.6.6 Alarm level selection on the digital output of I/O - ALARM LEVEL
In the ALARM LEVEL, it is possible to set the level of the result to be monitored during
the measurements. If the result is greater than the one set in this line, the instrument will generate
the alarm signal in the selected logic. The available levels are within the range [30.0 dB, 140 dB].
The ALARM LEVEL current value decreasing / increasing by 0.1 dB is possible by means
of the <
>/ <
> push-buttons. The step can be decreased / increased up to 1 dB after pressing
simultaneously the <
>/ <
> push-buttons with the <SHIFT> one. The window is closed and
the instrument returns to the SETUP list after pressing the <ENTER> (with the confirmation of all changes
made in the window) or <ESC> push-buttons (ignoring all changes).
9-10
G7 USER MANUAL
EXTERNAL I/O SETUP windows; the ALARM LEVEL setting
9.7 Activation of human vibration filters - HUMAN VIB. FILT.
In the HUMAN VIBR. FILT. it is possible to activate the human vibration filters (Wk, Wd, Wc, Wj,
Wm, Wh, Wg, Wb), which are not included in the standard set of the instrument. This option can be
bought together with the instrument or can be purchased by the user in the future. In the latter case, after
selecting the HUMAN VIB. FILT. text in the SETUP list (in vibration mode), using the <
>, <
> (or <
>,
<
>) push-buttons, and pressing <ENTER>, the user has to introduce special code for activation of the
function. After successful activation the HUMAN VIBRATION filters, this text does not appear on the
SETUP list any more and the instrument never more asks for the code.
SETUP list, the HUMAN VIB. FILT. text highlighted (displayed inversely)
Displays during the entering of the access code to a function
9.8 Selection of the current IEPE supply - IEPE CURRENT
The IEPE CURRENT enables the user to choose current IEPE supply.
In order to enter the window the user has to select the IEPE CURRENT text in the SETUP list,
using the <
>, <
> (or <
>, <
>) push-buttons and press the <ENTER> one.
SETUP list, the IEPE CURRENT text highlighted (displayed inversely)
Two options are available: 1.5 mA and 4.5 mA. The selection is made by placing a special
character in the required position by means of the <
>, <
> (or <
>, <
>) push-buttons. The window is
closed and the instrument returns to the SETUP list after pressing the <ENTER> (with the confirmation of
a change made in the position) or <ESC> push-buttons (ignoring a change made in the position).
9-11
G7 USER MANUAL
_
IEPE CURRENT windows; the IEPE supply selection
9.9 Reference signal in vibration measurements - REFERENCE LEVELS
The REFERENCE LEVELS sub-list enables the user to set the reference level of the vibration
signal or to inform the user about the reference level in the case of sound measurements. The values,
which are set here, are taken into account during the calculations of the measurement results expressed
in the logarithmic scale (with the dB as the units).
In order to enter the position the user has to select the REFERENCE LEVELS text in the SETUP
list, using the <
>, <
> (or <
>, <
>) push-buttons and press the <ENTER> one. The selection
of a parameter which level has to be set is done by means of the <
>, <
> push-buttons.
SETUP list, the REFERENCE LEVELS text highlighted (displayed inversely)
9.9.1 Setting the reference level of the acceleration signal - ACC
In the ACC position the user can set the reference level of the acceleration signal. It is possible
-2
-2
-2
to set this level from 1 µms to 100 µms with 1 µms step pressing the <
>, <
> push-buttons.
-2
The step can be increased to 10 µms pressing the <SHIFT> with the <
>, <
> push-buttons.
In order to confirm the setting the <ENTER> push-button has to be pressed. Such pressing closes
the sub-list. After pressing the <ESC> push-button the sub-list is also closed but all changes, which were
made, are ignored.
REFERENCE LEVELS windows; the reference level setting of acceleration signal
9.9.2 Setting the reference level of the velocity signal - VEL
In the VEL position, the user can set the reference level of the velocity signal. It is possible to set
-1
-1
-1
this level from 1 nms to 100 nms with 1 nms step pressing the <
>, <
> push-buttons. The step can
-1
be increased to 10 nms pressing the <SHIFT> with the <
>, <
> push-buttons.
In order to confirm the setting the <ENTER> push-button has to be pressed. Such pressing closes
the sub-list. After pressing the <ESC> push-button the sub-list is also closed but all changes, which were
made, are ignored.
9-12
G7 USER MANUAL
REFERENCE LEVEL windows; setting the reference level of velocity signal
9.9.3 Setting the reference level of the displacement signal - DIL
In the DIL position, the user can set the reference level of the displacement signal. It is possible
to set this level from 1 pm to 100 pm with 1 pm step pressing the <
>, <
> push-buttons. The step can
be increased to 10 pm pressing the <SHIFT> with the <
>, <
> push-buttons.
In order to confirm the setting the <ENTER> push-button has to be pressed. Such pressing closes
the sub-list. After pressing the <ESC> push-button the sub-list is also closed but all changes, which were
made, are ignored.
REFERENCE LEVELS windows; setting the reference level of displacement signal
In the case of sound measurements the REFERENCE LEVELS sub-lists is used only to inform
the user that the reference level of the acoustic signal is equal to 20 µPa. After pressing the <ESC> or
<ENTER> push-buttons the sub-list is closed.
REFERENCE LEVELS windows; the reference level of the acoustic signal
9.10 Parameters of remote communication - REMOTE COMMUNICATION
The REMOTE COMMUNICATION enables the user to select the type and set the packet size
of the packet communication.
In order to enter the position the user has to select the REMOTE COMMUNICATION text in the
SETUP list, using the <
>, <
> (or <
>, <
>) push-buttons and press the <ENTER>.
SETUP list, the REMOTE COMMUNICATION text highlighted (displayed inversely)
9-13
G7 USER MANUAL
9.10.1
_
Selecting the type of remote communication - TYPE
The TYPE enables the user to select the type of the REMOTE COMMUNICATION. Three options
are available: Off, CONTINUOUS and PACKET. The selection of the required option is made by <
>,
<
> push-buttons. The confirmation is made by pressing <ENTER> push button.
REMOTE COMMUNICATION windows; the TYPE selection
9.10.2
Setting the packet size of the remote communication - PACKET
In the case of the PACKET type it is possible to select the packet size. The available options are
1024, 512, 256, 128 and 64. The selection is made by the <
>, <
> push-buttons. The confirmation
is made by pressing the <ENTER> push button.
REMOTE COMMUNICATION windows; packet size selection
9.11 Detector’s type selection in the LEQ calculations - RMS INTEGRATION
The RMS INTEGRATION enables the user to select the detector type for the calculations
of the LEQ, Lden, LEPd, Lxx and SEL functions in case of sound measurements and RMS function in
case of vibration measurements.
In order to enter the position the user has to select the RMS INTEGRATION text in the SETUP list,
using the <
>, <
> (or <
>, <
>) push-buttons and press the <ENTER>.
SETUP list with the RMS INTEGRATION text highlighted (displayed inversely)
Two options are available: LINEAR and EXPONENTIAL. The required parameter can be selected
by means of the <
>, <
> (or <
>, <
>) push-buttons. The window is closed and the instrument returns
to the SETUP list after pressing the <ENTER> (with the confirmation of a change made
in the position) or <ESC> push-buttons (ignoring a change made in the position).
9-14
G7 USER MANUAL
Displays and with the available options of the RMS INTEGRATION
The formulae used for the LEQ calculation are given in Appendix D. Setting LINEAR is required
for getting the true RMS value of the measured signal. When this option is selected in sound mode the
value of the LEQ, Lden, LEPd, Lxx and SEL functions do not depend on the detector time constant:
Fast, Slow or Impulse (the results are displayed without the indicator of the detectors selected in the
profiles). In this case, the indicator Lin. (or L) is displayed in the different modes of the result
presentation. When this option is selected in vibration mode the value of the RMS function do not depend
on the detector time constant: 100ms, 125ms, 200ms, 500ms, 1.0s, 2.0s, 5.0s, 10.0s.
Setting EXPONENTIAL enables the user to fulfil the requirements of another standard for the LEQ
measurements. When this option is selected in sound mode the value of the LEQ, Lden, LEPd, Lxx and
SEL function depends on the detector time constant (the results are displayed with the indicator of the
detectors selected in the profiles (path: MENU / INPUT / PROFILE x / DETECTOR: Fast, Slow or
Impulse). When this option is selected in vibraton mode the value of the RMS function depends on the
detector time constant.
9.12 Setting the parameters of the serial interface - RS232
The RS232 enables the user to programme the RS 232 interface transmission speed
(BAUD RATE) and to set the time limit before which the interface operation should be performed
(TIME OUT). In order to enter the position the user has to select the RS232 text in the SETUP list, using
the <
>, <
> (or <
>, <
>) push-buttons and press the <ENTER>.
SETUP list, the RS232 text highlighted (displayed inversely)
9.12.1 Setting the transmission speed of the serial interface - BAUD RATE
The RS 232 interface transmission (BAUD RATE) speed can be selected from the following
available values: 1200 (bits / second), 2400 (bits / s), 4800 (bits / s), 9600 (bits / s), 19200 (bits / s),
38000 (bits / s), 57600 (bits / s) or 115200 (bits / s). The selection is made by means of the <
>, <
>
push-buttons.
The other RS 232 transmission parameters are fixed to 8 bits for data, No parity & 1 Stop bit.
The selected value has to be confirmed by pressing the <ENTER> push-button, which causes
the simultaneous return to the SETUP list. All settings are ignored after the return to the SETUP list
by pressing the <ESC> push-button.
9-15
G7 USER MANUAL
_
RS232 windows; the possible settings of the BAUD RATE
9.12.2 Setting time limit for the performance of serial interface operation - TIME OUT
The TIME OUT value shown in the inversely displayed line is increased or decreased by one
with each pressing the <
>, <
> push-buttons. The step is increased / decreased to ten after pressing
the <
>, <
> push-buttons together with the <SHIFT> one. The default value of this parameter is equal
to one but it can be too short period for the printers, which are not too fast. In such case, the TIME OUT
parameter has to be increased. The window is closed and the instrument returns to the SETUP list
after pressing the <ENTER> (with the confirmation of all changes made in the window) or <ESC> pushbuttons (ignoring all changes made there).
RS232 window; the setting of the TIME OUT with 1-second step
...
RS232 window; the setting of the TIME OUT with 10-seconds step
9.13 Programming the instrument’s internal Real Time Clock - RTC
The RTC enables one to programme the internal Real Time Clock. This clock is displayed
in the different places depending on the selected presentation mode. In order to enter the position
the user has to select the RTC text in the SETUP list, using the <
>, <
> (or <
>, <
>) push-buttons
and press the <ENTER> one.
SETUP list, the RTC text highlighted (displayed inversely)
The selection of the setting parameter (hour, minute, second, day, month and year) is performed
using the <
>, <
> push-buttons and the change of its value – using the <
>, <
> push-buttons
pressed together with the <SHIFT>.
9-16
G7 USER MANUAL
RTC windows with the different parameters to be set
Notice: The new value of a parameter is confirmed after each pressing of the <
> or <
>
together with the <SHIFT> push-buttons (new value is selected without any confirmation from
the <ENTER> push-button).
The window is closed and the instrument returns to the SETUP list after pressing the <ENTER> or
<ESC> push-button.
9.14 The RT 60 averaging function - RT60 AVERAGING
The RT60 AVERAGING appears in the SETUP list when the RT60 function is selected
in the MEASUREMENT FUNCTION window (path: MENU / FUNCTION / MEASUREMENT FUNCTION
/ RT60). It is available only in sound mode. This window is opened after the selection of the
RT60 AVERAGING text from the SETUP list by means of the <
>, <
> (or <
>, <
>) push-buttons
and pressing the <ENTER> one.
The RT60 AVERAGING
and AVERAGING NO.
contains
three
positions:
AVERAGING,
AVERAGING CLEAR
SETUP list, the RT60 AVERAGING text highlighted (displayed inversely)
9.14.1
The RT 60 averaging - AVERAGING
In the AVERAGING position, the user can switch on averaging option for the RT60 measurements.
The activation is made by setting of On text in the AVERAGING line by means of the <
>, <
> pushbuttons. The confirmation of the activation requires pressing the <ENTER> push-button, which
simultaneously closes the window. The RT60 AVERAGING window is closed ignoring any changes made
in there, after pressing any time the <ESC> push-button.
RT60 AVERAGING window; the AVERAGING activation
9-17
G7 USER MANUAL
9.14.2
_
Resetting the averaging process - AVERAGING CLEAR
The AVERAGING CLEAR enables the user to reset the averaging process. All averaged results
are lost if not saved. In this position two options are available YES (clear) and NO.
The selection is made by means of the <
>, <
> push-buttons. The confirmation of the selection
requires pressing the <ENTER> push-button, which simultaneously closes the window.
The RT60 AVERAGING window is closed ignoring any changes made in there, after pressing any time
the <ESC> push-button.
RT60 AVERAGING window; the AVERAGING CLEAR selection
9.14.3
RT 60 averaging number - AVERAGING NO.
This line is only for indicating purpose. It shows how many measurements were taken
to the averaging process calculation. The position is not accessible The RT 60 AVERAGING window
is closed ignoring any changes made in there, after pressing any time the <ESC> push-button.
RT60 AVERAGING window; the change of AVERAGING NO. after measurement (position is not accessible)
9.15 Setting the auxiliary parameters of RT 60 mode - RT60 OPTIONS
The RT60 OPTIONS is accessible in the SETUP list in the SOUND METER mode when
the RT60 function is selected in the MEASUREMENT FUNCTION window (path: MENU / FUNCTION /
MEASUREMENT FUNCTION / RT60). This sub-list is opened after the selection of the RT60 OPTION
text from the SETUP list by means of the <
>, <
> (or <
>, <
>) push-buttons and pressing the
<ENTER> one. The RT60 OPTIONS consists of two parameters, which influence the calculation
of the RT60 measurements results: SMOOTHING and NOISE MAR.
=> <ENTER> =>
RT60 selected in the SETUP list and the RT60 OPTIONS window opened
9.15.1
Setting the sound pressure level decay curve averaging - SMOOTHING
In the SMOOTHING position, the user can set the parameter of decay curve averaging. In this
position available values are from 0 to 15.The selection is made by means of the <
>, <
> push-buttons
9-18
G7 USER MANUAL
with step equal to 1 or by means of the <
>, <
> push-buttons pressed together with the <SHIFT> one
with the step equal to 5. The confirmation of the selection requires pressing the <ENTER> push-button,
which simultaneously closes the window. The RT60 OPTION window is closed ignoring any changes
made in there, after pressing any time the <ESC> push-button.
RT60 OPTIONS window; the SMOOTHING selection with the step equal to 1
RT60 OPTIONS window; the SMOOTHING selection with the step equal to 5
9.15.2
Setting the margin value of background noise level - NOISE MAR.
In the NOISE MAR. position the user can set the requesting additional margin value
to the background noise level noise margin during the RT60 measurements. In this position values from
0.0dB to 20.0dB are available. The selection is made by means of the <
>, <
> push-buttons with
0.1 dB step or by means of the <
>, <
> push-buttons pressed together with the <SHIFT> one with
the step equal to 1 dB. The confirmation of the selection requires pressing the <ENTER> push-button,
which simultaneously closes the window. The RT60 OPTIONS window is closed ignoring any changes
made in there, after pressing any time the <ESC> push-button.
RT60 OPTIONS window; the NOISE MAR. selection with 0.1dB step
RT60 OPTIONS window; the NOISE MAR. selection with 1dB step
9.16 Selection of RT60 results parameters - RT60 RESULTS
The RT60 RESULTS appears in the SETUP list after selection of the RT60 function
in the MEASUREMENT FUNCTIONS window (path: MEN / FUNCTION/ MEASUREMENT FUNCTION).
This sub-list is opened after the selection of the RT60 AVERAGING text from the SETUP list
by means of the <
>, <
> (or <
>, <
>) push-buttons and pressing the <ENTER> one.
9-19
G7 USER MANUAL
_
=> <ENTER> =>
RT60 RESULTS selected in the SETUP list and the RT60 RESULTS window opened
By marking ([E], [2], [3]) or unmarking ([ ], [ ], [ ]) the options, the user can set to each 1/3 octave
band which of the reverberation time results will be presented in the visualization levels:
• [E] (EDT) - the EDT (Early Decay Time) is marked,
• [2] (RT 20) - the RT 20 reverberation time is marked,
• [3] (RT 30) - the RT 30 reverberation time is marked.
By pressing the <
>, <
> and <
>, <
> push-buttons the user can highlight the one of three
options [E], [2], [3] in each 1/3 octave band.
For faster scroll between the rows press the <SHIFT> push-button and while holding it, press the
<
>, <
> push-buttons.
To mark or unmark the desired option first highlight it and then press <
> or <
> push-button with
<SHIFT> one.
The confirmation of the changes is made by pressing <ENTER> push-button. The RT60 RESULTS
window is closed ignoring any changes made in there, after pressing the <ESC> push-button.
RT60 RESULTS window, unmarking option in 1/3 octave band
9.17 Selection of few push-buttons mode - SHIFT MODE
The SHIFT MODE enables the user to programme the operation mode of the <SHIFT>, <ALT> and
<START / STOP> push-buttons.
In order to enter the position the user has to select the SHIFT MODE text in the SETUP list,
using the <
>, <
> (or <
>, <
>) push-buttons and press the <ENTER> one. The selection
of a parameter in both positions is done by means of the <
>, <
> push-buttons and confirmed
by the <ENTER> one. Any changes made in the window are not confirmed in the case of pressing
the <ESC> push-button but the window is closed.
SETUP list, the SHIFT MODE text highlighted (displayed inversely)
9.17.1 <SHIFT> / <ALT> push-button working mode selection - SHIFT
In the SHIFT, the user can choose between 2nd Fun. and Shift. When the Shift text is selected,
the <SHIFT> and <ALT> push-buttons operates as in the keyboard of a computer – in order to achieve
9-20
G7 USER MANUAL
the desired result, the second push-button has to be pressed in conjunction with the <SHIFT>/<ALT>
one. When the 2nd Fun. text is selected the <SHIFT>/<ALT> push-button operates in the sequence
with the other one.
In order to select a desired mode of the <SHIFT> push-button the <
>, <
> should be pressed.
In order to confirm the selection the <ENTER> push-button has to be pressed. Such pressing closes
the sub-list. After pressing the <ESC> push-button the sub-list is also closed but all changes,
which were made, are ignored.
SHIFT MODE windows; the available SHIFT settings
9.17.2 <START / STOP> push-button working mode selection - ST/SP
In the ST/SP the user can choose between Normal and Inverse. When the Normal text is selected
the instrument reacts on each of the <START / STOP> push-button pressing, starting or stopping
the measurements.
When the Inverse text is selected the <START / STOP> push-button operates in conjunction or
in a sequence with the <SHIFT> one. The measurements are started or stopped after pressing both pushbuttons.
In order to select a desired mode of the <START / STOP> push-button the <
>, <
> should
be pressed. In order to confirm the selection the <ENTER> push-button has to be pressed. Such pressing
closes the sub-list. After pressing the <ESC> push-button the sub-list is also closed but all changes, which
were made, are ignored.
SHIFT MODE windows; the available ST/SP settings
9.17.3 Setting ten statistical levels - STATISTICAL LEVELS
The STATISTICAL LEVELS position is available only in the case of the sound measurements
(in the MODE sub-list the SOUND METER position is selected).
In the STATISTICAL LEVELS it is possible to select which ten statistical levels, named from N1 to
N10, has to be calculated, displayed and saved in the files together with the main results.
In order to enter the sub-list the user has to select the STATISTICAL LEVELS text in the SETUP
list, using the <
>, <
> (or <
>, <
>) push-buttons and press the <ENTER> one.
SETUP list, the STATISTICAL LEVELS sub-list selected
9-21
G7 USER MANUAL
_
The default statistic levels have the following settings: 1, 10, 20, 30, 40, 50, 60, 70, 80 and 90.
All values have to be within the range [1, 99]. Each one value can be set independently from the others.
The selection of the Nx is made using the <
>, <
> push-buttons.
The upper Nx visible on the display is active after pressing the <
> together with the <SHIFT>
push-button.
The lower Nx visible on the display is active after pressing the <
> together with the <SHIFT>
push-button.
The Nx current value decreasing / increasing by one is possible by means of the <
>/ <
> pushbuttons.
The step can be decreased / increased up to ten after pressing simultaneously the <
>/ <
> pushbuttons with the <SHIFT> one.
The sub-list is closed and the instrument returns to the SETUP list after pressing the <ENTER>
(with the confirmation of all changes made in this list) or <ESC> push-buttons (ignoring all changes).
Displays in the STATISTICAL LEVELS sub-list
9.18 Programming the instrument’s internal timer - TIMER
The TIMER enables one to programme the internal timer. The instrument can be switched on
by itself in the programmed time and it can perform the measurements using the setup, which was used
before its switching off.
The selection of the parameter to be set is performed using the <
>, <
> and the change of its
value – using the <
>, <
> push-buttons pressed together with the <SHIFT>.
In order to enter the position the user has to select the TIMER text in the SETUP list (using
the <
>, <
> or <
>, <
> push-buttons) and press the <ENTER> one.
SETUP list, the TIMER text highlighted (displayed inversely)
9.18.1 Selecting the mode of the timer function - MODE
The MODE of the timer function is selected pressing the <
>, <
> push-buttons when the MODE
text is displayed inversely in the TIMER sub-list.
The timer can be switched off – Off, switched on only once – SINGLE, switched on many times
regularly – REGULAR with the period between two consecutive measurements set in the REPETITION
line or switched on up to four times, not regularly – IRREGULAR in the time set in the TIMEx positions.
9-22
G7 USER MANUAL
The selected value has to be confirmed by pressing the <ENTER> push-button, which causes
the simultaneous return to the SETUP list. All settings are ignored after the return to the SETUP list
by pressing the <ESC> push-button.
In the case the timer function is active (SINGLE, REGULAR or IRREGULAR) the clock icon starts
blinking up to switching timer function off or up to finishing programmed measurements.
TIMER windows; the mode selection
9.18.2 Setting day of the instrument’s switch on - START DAY
The START DAY determines the date of the measurement start. The timer can be programmed up
to one month ahead and during the date setting the current state of the Real Time Clock is taken
into account.
The required date can be selected pressing the <
>, <
> push-buttons when the START DAY text
is displayed inversely in the TIMER sub-list.
The selected value has to be confirmed by pressing the <ENTER> push-button, which causes
the simultaneous return to the SETUP list. All settings are ignored after the return to the SETUP list
by pressing the <ESC> push-button.
...
TIMER windows; setting day of the instrument’s switch on
9.18.3 Setting hour of the instrument’s switch on - START HOUR
The START HOUR determines hour of the measurement start. The required hour can be selected
pressing the <
>, <
> push-buttons when the START HOUR text is displayed inversely in the TIMER
sub-list.
In order to set minutes one has to enter their position pressing the <
>, <
> pushbuttons and then
pressing the <
>, <
> push-buttons to select the proper value. The selected value has to be confirmed
by pressing the <ENTER> push-button, which causes the simultaneous return to the SETUP list. All
settings are ignored after the return to the SETUP list by pressing the <ESC> push-button.
9-23
G7 USER MANUAL
_
TIMER windows; setting hour and minute of the instrument’s switch on
9.18.4 Selecting the start hours for four irregular automatic measurements - TIMEx
The TIMEx (TIME1, TIME2, TIME3, TIME4) is used to determine four irregular automatic starts
of the measurements. The required hour can be selected pressing the <
>, <
> push-buttons when
the TIMEx text is displayed inversely in the TIMER sub-list (mode IRREGULAR).
In order to set minutes one has to enter the proper line pressing the <
>, <
> push-buttons and
then pressing the <
>, <
> push-buttons to select the proper value. The selected value has to be
confirmed by pressing the <ENTER> push-button, which causes the simultaneous return to the SETUP
list. All settings are ignored after the return to the SETUP list by pressing the <ESC> push-button.
9.18.5 Selecting the period between two consecutive measurements - REPETITION
The REPETITION of the timer function is selected pressing the <
>, <
> push-buttons when
the REPETITION text is displayed inversely in the TIMER sub-list (mode REGULAR). This parameter can
be programmed from 00:00 up to 99:59.
In order to set the proper value one has to select hours or minutes pressing the <
>, <
> pushbuttons and then, pressing the <
>, <
> push-buttons, to select the proper value. The selected value has
to be confirmed by pressing the <ENTER> push-button, which causes the simultaneous return to
the SETUP list. All settings are ignored after the return to the SETUP list by pressing the <ESC> pushbutton.
TIMER windows; setting REPETITION parameter
9.18.6 Description of the exemplary timer function execution
The TIMER function is used to programme the instrument’s switch on at the given time and perform
the measurements with the parameters set in the INPUT sub-list. Let us assume that the user wants to
st
switch on the instrument the 1 of February, at 13:25, measure sound during 10 seconds without using
logger and save the results in a file @RES2.
In order to do this the user has to set the parameters of the TIMER function (path: MENU / SETUP /
TIMER), the measurement parameters (path: MENU / INPUT / MEASUREMENT SETUP), activate
the AUTO SAVE function (path: MENU / FILE / SAVE OPTIONS), named the file (the FILE NAME window
is opened after switching on the AUTO SAVE function) and finely – switched off the instrument.
9-24
G7 USER MANUAL
Exemplary settings made for the desired execution of the TIMER function
st
The instrument will be switched on the 1 of February at 13:25 and will be warmed up
for the period of 60 seconds decrementing by one after each second the counter visible on the display.
Counting down during the warming up of the instrument after switching it on
After warming up the instrument and the preset DELAY time, the measurements are performed
for a period of ten seconds. Then, the results are saved in the file which name was given or accepted
(the proper information is displayed) and finely – the instrument is switched off.
Displays during the executing of the TIMER function
Notice: The instrument’s TIMER function can be used for multiply measurements
(at the programmed day and time with the selected repetition). The first switch on of the instrument must
be within one month ahead.
9.19 Selection the USB–HOST port functionality - USB–HOST PORT
The USB–HOST PORT enables one to programme the functionality of the instrument’s socket
named USB Host.
In order to enter the position the user has to select the USB–HOST PORT text in the SETUP list,
using the <
>, <
> (or <
>, <
>) push-buttons and press the <ENTER> one.
SETUP list, the USB–HOST PORT text highlighted (displayed inversely)
The socket USB Host can be used to serve as the input of the different interfaces: RS 232 or USB.
The RS 232 interface in the G7 instrument is available as a hardware option (a special interface, named
as the SV 55, with a dedicated microprocessor has to be attached to the socket USB Host).
9-25
G7 USER MANUAL
_
The RS232 is the default setting in this window. Only in this option the USB host controller is awaken and
the power consumption is the lower one. An error occurs in the case of the connection to the socket
the peripheral device of the different type than the selected one.
Displays in the USB–HOST PORT
The selection of the socket’s functionality is made with the <
>, <
> (or <
>, <
>) push-buttons
which moves the special character between the available options. The selection is confirmed
after pressing the <ENTER> push-button which closes the window and returns to the SETUP list.
The return to this list is also possible after pressing the <ESC> push-button but the selection is not
confirmed. In order to activate IrDA, SRT RECORDING, WAVE RECORDING or EVENT RECORDING
the user has to introduce a special code.
Displays during the entering of the access code to SRT RECORDING, WAVE RECORDING or
EVENT RECORDING
The USB host interface can be used to control the external USB memory disk (USB DISK,
SRT RECORDING, WAVE RECORDING, EVENT RECORDING) with the FAT16 or FAT32 file systems
or IrDA (Infrared Data Association) interface (USB IrDA) based on the dedicated circuit STIr4200.
Notice: The converter SV 55 serves as the RS 232 interface. The SV 55 connection
to the USB Host socket is detected and after successful detection the headphone icon is switched on.
The transmission using the SV 55 is possible only in the case when the instrument is not connected
to a PC with the USB Device port.
Notice: The connection to the USB Host socket the USB disk switches off the instrument’s
internal flash memory. All file functions and remote commands are redirected to the USB disk.
The internal flash memory is activated after disconnecting USB disk and the instrument.
After the USB DISK, SRT RECORDING, WAVE RECORDING or EVENT RECORDING selection,
the device connected to that socket is recognised. The warning appears on the display after the
connection of the unknown device.
In the case, the device declares the current consumption greater than 200 mA the dedicated
warning is presented.
In the case, the current consumption is greater than 250 mA the connected USB disk is switched
off and special warning is displayed.
9-26
G7 USER MANUAL
In other cases, the connected USB disk is initiated and the free space is determined.
Displays with the different USB disk warnings
This operation can last up to few minutes depending on the disk’s capacity. The detection
of the USB DISK is signalised by the paper sheet icon (at the display’s left corner). Next, the file’s
directory should be determined (path: MENU / FILE / DIRECTORY). This directory can be created
in the instrument or already existing one in the disk is selected.
The FREE SPACE denotes the available free memory on the connected disk.
st
The DIR NO. shows the number of the selected directory (the 1 number) and the number
nd
of the existing directories (the 2 number). In the case the directories do not exist, these numbers
are equal to zero.
st
The DIR NAME enables one to edit the directory name (the 1 number) or displays its name.
The help lines are placed at the display’s bottom.
There are two ways of the current directory selection:
• the name edition in the DIR NAME line. The default name consists of the day number and the month
abbreviation. The not existing directory will be created.
• the selection of the existing directory by means of the <
>, <
> push-buttons pressed in the line
with the DIR NO. text. The name of the selected directory is displayed in the DIR NAME line.
The selection is confirmed after pressing the <ENTER> push-button which closes the window and
returns to the FILE list. The return to this list is also possible after pressing the <ESC> push-button but the
selection is not confirmed. The selection of the directory is obligatory during the initialisation process. In
this case also the <ESC> push-button confirms the settings.
Contents of the DIRECTORY window
In the case of the TIMER function, the directory selection is skipped and the default one is created.
The usage of the USB disk modifies a few windows and lists. First of all, the described above
DIRECTORY window and COPY FILES TO USB, MOVE FILES TO USB windows appear in the FILE list.
Additionally, in some places concerning the file management the info about the name of the current USB
disk directory is displayed in the upper line: DIRECTORY: the name of the current directory.
These places are as follows: DISPLAY / LOGGER VIEW, FILE / LOAD, FILE / DELETE /
RESULT FILES, FILE / DELETE / LOGGER FILES, FILE / DELETE / SETUP FILES, FILE /CATALOGUE,
FILE / LOAD SETUP.
The usage of the USB disk modifies also the execution of a few functions, namely:
• the DEFRAGMENTATON is not executed,
• the REAL TIME transmission is stopped,
• the remote file writing using the #9 function is not available
• in the FILE / FREE SPACE window the free space and the total capacity of the USB disk are given,
• in the file report the name of the current directory of the USB disk is added,
9-27
G7 USER MANUAL
_
• the USB disk memory is not divided between the files and the logger, so the free space concerns both:
logger and file memory.
The USB disk can be disconnected when the measurements are not performed and the results
are presented. The internal instrument’s flash memory is initialised after switching off the USB disk.
In the USB disk that is divided into partitions its first partition has to serve FAT32 or FAT16 file
system. Only short name file (up to 8 characters, similar to DOS system) is implemented. The existing
longer names are shortened.
Notice: The disconnection of the USB disk during the data transmission can cause the lost
of data saved in the USB disk as well as in the instrument’s internal flash.
The IrDA is the wireless interface used for the communication between the instrument and a PC.
The connection of the IrDA converter results in displaying the info window and switching on the paper
sheet icon (at the left side of the upper line).
In the case of the unsuitable settings in the USB HOST PORT window or connecting wrong device
another info window is displayed.
The transmission parameters are selected automatically during the negotiation process. The fastest
available speed equals to 115 200 kb/s. In this case, the real speed is not bigger than 1.5 kB/s. The IrDA
programming is based on a virtual COM port emulation in a PC.
Displays during the IrDA interface connection
9.20 Setting the coefficients of the user filters - USER FILTERS
The USER FILTERS position enables the user to introduce the values of the coefficients of the user
filters.
In order to enter the position the user has to select the USER FILTERS text in the SETUP list,
using the <
>, <
> (or <
>, <
>) push-buttons and press the <ENTER>.
SETUP list, the USER FILTERS text highlighted (displayed inversely)
9.20.1 Setting filter coefficients for octave analysis - SPECTRUM BASED FILTERS
The SPECTRUM BASED FILTERS sub-list enables the user to introduce the values of the filter
coefficients correcting the results of 1/1 OCTAVE or 1/3 OCTAVE analysis. The results of the analysis
(the TOTAL values) can be modified by the introduced factors.
In order to enter the sub-list the user has to select the USER FILTERS text in the SETUP list, using
the <
>, <
> (or <
>, <
>) push-buttons and press the <ENTER>. The USER FILTERS (sub-list)
contains 3 sub-lists: VIEW, EDIT and CLEAR.
9-28
G7 USER MANUAL
USER FILTERS windows, SPECTRUM BASED FILTERS selected
9.20.1.1 Looking at the coefficients of the user filters set - VIEW
The VIEW sub-list enables one to look at the coefficients of the USER FILTERS sets saved
in the instrument under the names S1, S2, S3. The coefficients can be set by the user in the instrument
by means of the EDIT option or sent to it (together with the name) by means of the interface using #6
function (cf. App. A for the description).
In order to enter the sub-list the user has to select in the SPECTRUM BASED FILTER sub-list
the VIEW text, using the <
>, <
> (or <
>, <
>) push-buttons and press the <ENTER>. In the VIEW
window one can select one of three mentioned above filters (S1, S2 and S3). The selection of the filter
in this sub-list is performed by means of the <
>, <
> push-buttons.
SPECTRUM BASED FILTERS window, the VIEW text highlighted
The sub-list is closed and the instrument returns to the USER FILTERS sub-list after pressing
the <ESC> push-button (ignoring a change made in the position).
VIEW windows, the filter selection
After pressing the <ENTER> push-button on the displayed inversely text the proper sub-list is
opened containing the values of the coefficients for all SPECTRUM BASED 1/1 OCTAVE and
1/3 OCTAVE filters. It is not possible to change the values. The selection of the displayed coefficients
in the selected filter is performed by means of the <
>, <
> push-buttons.
S1 filter windows
9.20.1.2 Setting the coefficients of the user filters set - EDIT
The EDIT sub-list enables the user to select which filters should be edited; the available options are
as follows: S1, S2, S3 or any other transmitted to the instrument from a PC by means of the interface.
In order to enter the sub-list the user has to select the EDIT text in the SPECTRUM BASED FILTER sublist, using the <
>, <
> (or <
>, <
>) push-buttons and press the <ENTER>.
9-29
G7 USER MANUAL
_
SPECTRUM BASED FILTERS window, the EDIT text highlighted
The selection of the position in this sub-list is performed by means of the <
>, <
> push-buttons.
After pressing the <ENTER> push-button when the S1, S2, S3 or any other (in the EDIT window) text is
displayed inversely, the sub-list containing the values of the coefficients for all 1/1 OCTAVE and
1/3 OCTAVE filters is opened.
EDIT windows, the filter selection
The opened window contains the centre frequencies of the filters and their coefficients:
0.80 Hz: available values of 0.8 Hz centre frequency filter: -INF, -100.0dB ... 100.0dB
1.00 Hz: available values of 1Hz centre frequency filter: -INF,-100.0dB ... 100.0dB
...
20.0kHz: available values of 20 kHz centre frequency filter: -INF, -100.0dB ... 100.0dB
The selection of the position in the set is performed by means of the <
>, <
> push-buttons.
The value is introduced by pressing the <
>, <
> push-buttons. The sub-list is closed and
the instrument returns to the USER FILTERS sub-list after pressing the <ENTER> (with the confirmation
of all settings made in the sub-list) or <ESC> push-button (ignoring all settings made in the sub-list).
…
S1 filter windows; the coefficient selection
9.20.1.3 Clearing the coefficients of the user filters - CLEAR
The CLEAR position enables the user to clear the values of the user coefficients of octave or third
octave filters. It is possible to clear all sets of coefficients (ALL), to clear the first set (S1), to clear the
second set (S2), to clear the third one (S3) or any other transmitted to the instrument from a PC by means
of the interface.
9-30
G7 USER MANUAL
SPECTRUM BASED FILTER window; the CLEAR position selected
In order to enter the sub-list the user has to select in the SPECTRUM BASED FILTER sub-list
the CLEAR text, using the <
>, <
> (or <
>, <
>) push-buttons and press the <ENTER>.
The selection of the position in this sub-list is performed by means of the <
>, <
> push-buttons.
The coefficients of a set (or sets) are cleared after the selection of the proper text by means of the <
>,
<
> push-buttons and after pressing the <ENTER> one.
CLEAR windows, the selection of the filters to be cleared
After this, the WAIT text appears on the display and the instrument returns to the
SPECTRUM BASED window. The CLEAR sub-list is also closed and the instrument returns to the
SPECTRUM BASED window after pressing the <ESC> push-button (without taking any action).
Displays during and after the execution of CLEAR operation
9.21 Selection of the vibration units - VIBRATION UNITS
The VIBRATION UNITS position enables the user to select the units for the vibration
measurements (this position is available only in VM). In order to enter the position the user has to select
the VIBRATION UNITS text in the SETUP list, using the <
>, <
> (or <
>, <
>) push-buttons and
press the <ENTER>.
SETUP list, the VIBRATION UNITS text highlighted (displayed inversely)
2
It is possible to select the NON-METRIC units (e.g. g, ips, mil etc.) or METRIC units (e.g. m/s , m/s,
m etc.). The selection is done by means of the <
>, <
> push-buttons. In order to confirm the selection
the <ENTER> push-button has to be pressed. Such pressing closes the sub-list. After pressing
the <ESC> push-button the sub-list is also closed but all changes, which were made, are ignored.
VIBRATION UNITS windows with the available positions
9-31
G7 USER MANUAL
_
9.22 Warnings selection - WARNINGS
The WARNINGS enables the user to select the messages, which could be displayed during
the operation of the instrument. In order to enter the window the user has to select the WARNINGS text
in the SETUP list, using the <
>, <
> (or <
>, <
>) push-buttons and press the <ENTER>.
This window contains only one position.
SETUP list, the WARNINGS text highlighted (displayed inversely)
9.22.1 Saving the measurement results in a file - RESULTS NOT SAVED
In order to switch on the displaying of the message the user has to place, by means of the <
>,
<
> push-buttons, the special character in the warning’s position. The window is closed and
the instrument returns to the SETUP list after pressing the <ENTER> (with the confirmation of a change
made in the position) or <ESC> push-button (ignoring a change made in the position).
WARNINGS windows; RESULTS NOT SAVED selected
When the position is set to be active the special warning can be displayed after pressing
the <START / STOP> push-button. It will be happened in a case when the result of the previous
measurement was not saved in a file of the instrument.
Displays with LAST RESULTS NOT SAVE warning
The question Continue? appears with the warning message. The default value of the CONTINUE
position is SAVE NEXT. After pressing the <ENTER> push-button the instrument saves last results
with the name number increased by one. Using the <
>, <
> push-buttons one can change the value
of the CONTINUE position to YES or NO. If YES is chosen (to confirm the change the <ENTER> should
be pressed), the instrument returns to the active mode of result presentation starting the new
measurement process. If NO is chosen (to confirm the change the <ENTER> should be pressed),
the instrument returns to the active mode of measurement result’s presentation without starting the new
measurement process.
9.22.2 Checking free space on the USB disk - USB DISK FREE SP.
In order to switch on the displaying of the message the user has to place, by means of the <
>,
<
> push-buttons, the special character in the warning’s position. The window is closed and
the instrument returns to the SETUP list after pressing the <ENTER> (with the confirmation of a change
made in the position) or <ESC> push-button (ignoring a change made in the position).
9-32
G7 USER MANUAL
WARNINGS windows; USB DISK FREE SP. selected
9.22.3 Minimum USB disk memory free space setting - MIN FREE SPACE
In this line, the user can determine the amount of the USB disk memory free space.
WARNINGS windows; MIN FREE SPACE selection
The selected limit has to be within the range [1 MB, 1024 MB]. If the available memory is not
greater than that limit, the warning will be displayed. The limit is set by means of the <
>, <
> pushbuttons with the step equal to one MB. The step is increased up to ten MB, pressing the <
>, <
> pushbuttons together with the <SHIFT> one. The window is closed and the instrument returns to the SETUP
list after pressing the <ENTER> (with the confirmation of a change made in the position) or <ESC> pushbutton (ignoring a change made in the position).
The exemplary warning is presented below. The return to the programme execution is done
after pressing any push-button except the <SHIFT> and <ALT>.
Display with USB DISK FREE SPACE warning
9-33
G7 USER MANUAL
A. REMOTE CONTROL
The USB 1.1 interface is the serial one working with 12 MHz clock. Its speed is relatively high and
it ensures the common usage of USB in all produced nowadays Personal Computers.
The HOST USB functionality is also available. The USB HOST controller installed in the instrument
enables the user to connect to this meter the USB memory sticks, USB hard disks, USB printers etc.
The RS 232 interface is also available but as an option. In order to activate this option the user has
to by a special cable with a programmed processor. This interface complies with CCIT V.24 standard.
Practically all Personal Computers can be linked to the instrument by means of this interface.
The maximum available transmission speed is equal to 115200 bits / sec.
Note: For reliable operation of the RS 232, proper synchronisation of the transmission
by CTS and RTS lines (according to their definitions) is required.
The IrDA serial interface is also available as an option. It requires dedicated hardware and
the programme can be unlocked by a software code.
The functions, which are developed in order to control data flow in the serial interfaces, ensure:
- bi-directional data transmission,
- remote control of the instrument.
The user, in order to programme the serial interface, has to:
1. send "the function code",
2. send an appropriate data file
or
3. receive a data file.
A.1. Input / Output transmission types
The following basic input / output transmission types (called functions) are available:
#1 input / output of the control setting codes,
#2 read out of the measurement results in the sound level meter (SLM) mode or vibration level meter
(VLM) mode,
#3 read out of the measurement results in 1/1 OCTAVE or 1/3 OCTAVE mode,
#4 read out of the data file from the internal Flash-disc,
#5 read out of the statistical analysis results.
#7 special control functions,
#9 writing the data file into the internal flash-disk.
A.2. Function #1 – Input / Output of the control setting codes
#1 function enables the user to send the control setting codes to the instrument and read out a file
containing the current control state. A list of the control setting codes is given in Tab. A.1. The format of #1
function is defined as follows:
#1,Xccc,Xccc,(...),Xccc;
or
#1,Xccc,X?,Xccc,(...),X?,Xccc;
where:
X - the group code, ccc - the code value,
X? - the request to send the current X code setting.
A-1
G7 USER MANUAL
_
The instrument outputs in this case a control settings file for all requests X? in the following format:
#1,X ccc,X ccc,(...),X ccc;
In order to read out all current control settings the user should send to the device the following
sequence of characters:
#1;
The instrument outputs in this case a file containing all control settings given in Tab. A1 in the
format:
#1,X ccc,X ccc,(...),X ccc;
Example: The following sequence of characters send by the instrument as an answer for the
mentioned above request:
#1,U957,N6909,WL6.06,W6.06.2,Q0.2,Z1,V0,M1,R2,P1,F2:1,F3:2,F3:3,f0,I3:1,I2:2,I1:3,C1:1,C0:2,
C2:3,E4:1,E4:2,E4:3,B0:1,B2:2,B15:3,b0,G0:1,G15:2,G7:3,g0,d200,D1s,K5,L0,r1,w0,a0,m0,s0,o6,t17,l
75,n100,p20,q30,O25,k30,A0,e120,c2,h1,x3,y0,z0,T1,Y3,S0,Xx0,Xz0,Xc0,Xs3,Xn500,Xa1,Xv1,Xd1,
XA0,XR0,XS0,XM0,Xm0,XP0,XD0,Xr0,Xp90,Xu1,XT0,XL75,XQ25,Xq100;
means that:
• the G7 is investigated (U957)
• serial number of the instrument is 6909 (N6909)
• the LEVEL METER has the software version number 6.06 (WL6.06)
• the software version is 6.06.2 (W6.06.2)
• the calibration factor is equal to 0.2 dB (Q0.2)
• the SOUND METER mode is selected currently (Z1)
• the VOLTAGE input is off (V0)
• the LEVEL METER is selected as the measurement function (M1)
• the range is HIGH (R2)
• the current displayed profile is 1 (P1)
• the A filter is selected in in SLM mode (F2:1)
• the C filter is selected in profile 2 in SLM mode (F3:2)
• and the C filter is selected in profile 3 in SLM mode (F3:3)
• the HP filter is selected for 1/1 OCTAVE or 1/3 OCTAVE analysis (f0)
• the HP10 filter is selected in profile 1 in VLM mode (I3:1)
• the HP3 filter is selected in profile 2 in VLM mode (I2:2)
• the HP1 filter is selected in profile 3 in VLM mode (I1:3)
• the FAST detector is selected in profile 1 in SLM mode (C1:1)
• the IMPULSE detector is selected in profile 2 in SLM mode (C0:2)
• the SLOW detector is selected in profile 3 in SLM mode (C2:3)
• the detector 1.0s is selected in profile 1 in VLM mode (E4:1)
• the detector 1.0s is selected in profile 2 in VLM mode (E4:2)
• the detector 1.0s is selected in profile 3 in VLM mode (E4:3)
• the logger is not filled by the results from profile 1 in SLM mode (B0:1)
• the MAX values are stored in the files of the logger from profile 2 in SLM mode (B2:2)
• the RMS values are stored in the files of the logger from profile 3 in SLM mode (B4:3)
• the results of 1/1 or 1/3 OCTAVE analysis are not stored in the files of the logger in SLM mode (b0)
• the results coming from profile 1 are not saved in VLM mode in the logger’s file (G0:1)
• the PEAK, P–P, MAX and RMS results from profile 2 are saved in the logger’s file in VLM mode
(G15:2)
• the PEAK, P–P and MAX results from profile 3 are saved in the logger’s file in VLM mode (G7:3)
• the 1/1 OCTAVE or 1/3 OCTAVE analysis results are not saved in the logger’s file in VLM mode (g0)
• the measurement results has to be stored in a file of the logger every 200 millisecond (d200)
• the integration time is equal to 1 second (D1s)
• the measurement has to be repeated 5 times (K5)
A-2
G7 USER MANUAL
•
•
•
•
•
•
•
•
•
•
•
•
•
•
•
•
•
•
•
•
•
•
•
•
•
•
•
•
•
•
•
•
•
•
•
•
•
•
•
•
•
•
•
•
•
•
the linear detector is selected to the LEQ calculations (L0)
the narrow-band frequency analysis is performed in 22.4 kHz band (r1)
the HANNING window is used during the analysis (w0)
the linear averaging is used during the analysis (a0)
the triggering is switched off (m0)
the SPL result from the first profile is used as the triggering signal (s0)
the sixth 1/1 OCTAVE filter is treated as the triggering signal for 1/1 OCTAVE analysis (o6)
the value of the seventeenth 1/3 OCTAVE filter is treated as a source of the triggering signal for
1/3 OCTAVE analysis (t17)
the trigger level in SLM mode is equal to 75 dB (l75)
the trigger level in VLM mode is equal to 100 dB (n100)
the number of the records before the triggering saved in a file of the logger is equal to 20 (p20)
the number of records registered after the moment in which the measured signal does not fulfil any
longer the condition of the triggering is equal to 30 (q30)
the gradient in SLM mode in MEASURE TRIGGER is equal to 25 dB/ms (O25)
the gradient in VLM mode in MEASURE TRIGGER is equal to 30 dB/ms (k30)
the spectrum analysis is performed in a full band (A0)
the exposure time is equal to 120 minutes (e120)
the criterion level is equal to 84 dB (c2)
the threshold level is equal to 75 dB (h1)
the exchange rate is equal to (x3)
the FFT analysis is performed using 1920 lines (y0)
the FFT logger is switched off (z0)
the logger is switched on (T1)
the delay of the start of the measurements is equal to 3 seconds (Y3)
the instrument is in the Stop state (S0)
the ANALOG OUT is selected for MODE in the EXT. I/O SETUP (Xx0)
the TRIGGER PULSE is selected as the FUNCTION in the EXT. I/O SETUP (Xz0)
the LOW is selected as the ACTIVE LEVEL in the EXT. I/O SETUP (Xc0)
the PEAK value from the first profile is selected as the SOURCE in the EXT. I/O SETUP (Xs3)
the ALARM LEVEL set in the EXT. I/O SETUP is equal to 50.0 dB (Xn500)
2
the reference level for the acceleration measurements is equal to 1 µm/s (Xa1)
the reference level for the velocity measurements is equal to 1 nm/s (Xv1)
the reference level for the acceleration measurements is equal to 1 pm (Xd1)
the auto save is switched off (XA0)
the RAM file is switched off (XR0)
the statistics are not saved (XS0)
the saving of Max spectrum is switched off (XM0)
the saving of Min spectrum is switched off (Xm0)
the REPLACE in SAVE OPTIONS is switched off (XP0)
the DIRECT SAVE in SAVE OPTIONS is switched off (XD0)
the RPM measurement is switched on (Xr0)
the PULSE in the RPM measurement is set to 90 pulses/rotation (Xp90)
the RPM is measured in RPM units (Xu1)
the TRIGGER in the LOGGER TRIGGER is set to OFF (XT0)
the LEVEL in the LOGGER TRIGGER is set to 75 dB (XL75)
the PRE in the LOGGER TRIGGER is set to 25 (XQ25)
the POST in the LOGGER TRIGGER is set to 100 (Xq100).
Note: All bytes of that transmission are ASCII characters.
A-3
G7 USER MANUAL
_
A.3. Function #2 – Measurement results read-out in the level meter or dose meter
modes
#2 function enables one to read out the current measurement result from the selected profile in the
sound or vibration LEVEL METER or DOSE METER modes.
Notice: This function can also be programmed while measurements are taking place. In this
case, the RMS values measured after entering #2 function are sent out.
#2 function has the format defined as follows:
#2,p,X?,X?,X?,(...),X?;
where:
X - the code of the result,
p - the number of the profile (1, 2 or 3).
Notice: After finishing the measurement, #2 function is no longer active and has to be
reprogrammed in order to read-out successive measurements.
The instrument sends the values of results in the format defined as follows:
#2,p,Xccc,Xccc,Xccc,(...),Xccc;
(where p - the number of the profile: 1, 2 or 3)
or
#2,?;
(when the results are not available).
The codes of the results in the case of SLM mode are defined as follows:
v
the under-range flag (ccc equals to 0 when the overload did not occur, 2 when the under-range took
place during the last measurement period but did not occur in the last second of the measurement
and 3 when the under-range took place during the last measurement period and it lasted in the last
second of the measurement);
V
the overload flag (ccc equals to 0 or 1);
T
time of the measurement (ccc – value in seconds);
P
the PEAK value (ccc – the value in dB);
M
the MAX value (ccc – the value in dB);
N
the MIN value (ccc – the value in dB);
S
the SPL result (ccc – the value in dB);
R
the LEQ result (ccc – the value in dB).
U
the SEL result (ccc – the value in dB);
B(k) the Lden result (ccc – the value in dB; k – flag determining the kind of the result);
I(nn) the LEPd result (ccc – the value in dB, nn – the value of Exposure Time in minutes);
Y
the Ltm3 result (ccc – the value in dB);
Z
the Ltm5 result (ccc – the value in dB);
L(nn) the value L of the nn statistics (ccc – the value in dB).
Notice: In the case of Lden, the value k placed in the parenthesis after the code B, denotes
the kind of the currently measured result. The kind of the Lden result depends on the time during which
the measurements were performed (d denotes day, e denotes evening and n denotes night).
The corresponding values of k parameter and the kind of the measured Lden result are presented below:
k = 1 Ld result, k = 2 Le result,
k = 3 Lde result, k = 4 Ln result,
k = 5 Lnd result, k = 6 Len result, k = 7 Lden result.
A-4
G7 USER MANUAL
The codes of the results from the DOSE METER mode are defined as follows:
v
the under-range flag (ccc equals to 0 when the overload did not occur, 2 when the under-range took
place during the last measurement period but did not occur in the last second of the measurement
and 3 when the under-range took place during the last measurement period and it lasted in the last
second of the measurement);
V
the overload flag (ccc equals to 0 or 1);
T
time of the measurement (ccc – value in seconds);
P
the PEAK value (ccc – the value in dB);
M
the MAX value (ccc – the value in dB);
N
the MIN value (ccc – the value in dB);
S
the SPL result (ccc – the value in dB);
D
the DOSE result (ccc – the value in %);
d
the D_8h result (ccc – the value in %);
A
the LAV result (ccc – the value in dB);
R
the LEQ result (ccc – the value in dB);
U
the SEL result (ccc – the value in dB);
u
the SEL8 result (ccc – the value in dB);
2
E
the E result (ccc – the value in Pa h);
2
e
the E_8h result (ccc – the value in Pa h);
I(nn) the LEPd result (ccc – the value in dB, nn – the value of Exposure Time in minutes);
J
the PSEL result (ccc – the value in dB);
Y
the Ltm3 result (ccc – the value in dB);
Z
the Ltm5 result (ccc – the value in dB);
L(nn) the value L of the nn statistics (ccc – the value in dB).
v
V
T
P
Q
M
R
H
The codes of the results in the case of VLM mode are defined as follows:
the under-range flag (ccc equals to 0 when the overload did not occur, 2 when the under-range took
place during the last measurement period but did not occur in the last second of the measurement
and 3 when the under-range took place during the last measurement period and it lasted in the last
second of the measurement);
the overload flag (ccc equals to 0 or 1);
time of the measurement (ccc – value in seconds);
the PEAK value (ccc – the value in dB);
the P_P value (ccc – the value in dB);
the MAX value (ccc – the value in dB);
the RMS value (ccc – the value in dB);
the VDV value (ccc – the value in dB).
The exemplary results of the instrument’s response after sending to it the following sequence
of characters: #2,1; coming from the first profile are given below:
a) for the case of the SLM mode:
#2,1,v2,V0,T39,P125.4,M107.0,N20.6,S81.7,R102.1,U118.0,B(4)112.1,I(480)102.1,Y103.9,Z105.4,
L(01)107.9,L(10)107.6,L(20)107.2,L(30)102.8,L(40)99.0,L(50)96.7,L(60)82.5,L(70)54.5,L(80)20.9,
L(90)20.4;
b) for the case of the DOSE METER mode:
#2,1,v3,V0,T60,P116.0,M113.0,N20.6,S20.9,D14,d6635,A98.2,R98.2,U116.0,u142.8,E0.04,e21.14,
I(480)98.2,J71.4,Y103.1,Z102.9,L(01)113.5,L(10)96.1,L(20)82.8,L(30)21.3,L(40)20.8,L(50)20.7,
L(60)20.5,L(70)20.4,L(80)20.2,L(90)20.1;
c) and for the case of the VLM mode:
#2,1,v0,V0,T1,P93.9,Q99.7,M45.6,R45.6,H85.0;
A-5
G7 USER MANUAL
_
Notice: The presented above order of the measurement results sent out by the instrument
does not depend on the sequence of the characters sent to the unit.
Example: After sending to the instrument the string:
#2,1,T?,R?,V?,P?,L?;
the unit sends out the results of measurement coming from the first profile in predefined, described above,
order:
#2,1,V0,T39,P125.4,R102.1,L(01)107.9,L(10)107.6,L(20)107.2,L(30)102.8,L(40)99.0,L(50)96.7,
L(60)82.5,L(70)54.5,L(80)20.9,L(90)20.4;
Notice: The value displayed on the screen during the result’s presentation is sent out from
the instrument in the case when nn is not given after X character.
Notice: All bytes of that transmission are ASCII characters.
A.4. Function #3 – Read-out of the measurement results in 1/1 OCTAVE or
1/3 OCTAVE mode
#3 function enables one to read out the current measurement results in 1/1 OCTAVE or
1/3 OCTAVE mode.
#3 function format is defined as follows:
#3;
The device responds, sending the last measured spectrum (when the instrument is in STOP state)
or currently measured spectrum (when the instrument is in RUN state) in the following format:
#3;<Status Byte> <LSB of the transmission counter> <MSB of the transmission counter>
<data byte> (...) <data byte>
Status Byte gives the information about the current state of the instrument.
D7
D6
D5
D4
D3
D2
D1
D0
where:
D7 = 0
= 1
D6 = 0
= 1
D5 = 0
= 1
D0 to D4
means that "overload does not happen",
means that “overload appeared”,
means that "spectrum is not averaged ",
means that "spectrum is averaged ",
the instantaneous current result (RUN State),
the final result (STOP State),
reserved bits.
Note: The measurement result is coded in binary form as dB•10 (e.g. 34.5 dB is sent as
binary number 345).
A-6
G7 USER MANUAL
A.5. Function #4 – Read-out of the data file from the internal Flash-Disc
#4 function enables the user to read-out the data file from the internal Flash-disc memory. The data
file formats are given in Appendix B.
#4 function formats are defined as follows:
#4,0,\;
the file containing the catalogue,
#4,0,?;
the count of the files,
#4,0,index,count;
the part of the file containing the catalogue,
where:
index - first record,
count - number of records in the catalogue.
#4,1,fname;
#4,1,fname,?;
#4,1,fname,offset,length;
#4,1<address,length;
the file containing the measurement results,
file size,
the part of the file containing the measurement results,
the part of the file containing the measurement results,
where:
fname - name containing not more than eight-characters,
offset - offset from the beginning of the file,
length - number of bytes to read,
address - absolute internal address,
#4,2,fname;
the file containing the logger results,
#4,2,fname,?;
file size,
#4,2,fname,offset,length; the part of file containing the logger results,
where:
fname - name containing not more than eight-characters
offset - offset from the beginning of the file,
length - number of bytes to read,
#4,3;
the RAM file,
#4,3,?;
size of RAM file,
#4,3,offset,length;
the part of RAM file,
where:
offset - offset from the beginning of the RAM file,
length - number of bytes to read,
Notice: The "\" character is treated as the file name of the catalogue and must be sent
to the instrument.
All data words are sent as <LSB>,<MSB>.
When an error is detected in the file specification or data, the instrument will send:
#4,?;
The catalogue of the files is a set of the records containing 16 words (16 bits each). Each record
describes one file saved in the instrument’s Flash-disc. The record structure is as follows:
words 0 - 3
word 4
word 5
word 6
word 7
words 8 - 15
8 characters of the file name,
file type (binary number),
reserved,
the least significant word of the file size,
the most significant word of the file size,
reserved.
A-7
G7 USER MANUAL
_
A.6. Function #5 – Statistical analysis results read-out
#5 function enables one to read out the statistical analysis results.
#5 function format is defined as follows:
#5,p;
where:
p
the source of the statistical analysis results, for p = 1, 2 or 3 it is the corresponding profile
and for p = 0 - the results obtained during 1/1 OCTAVE or 1/3 OCTAVE analysis.
The device responds, sending the current classes of the statistics in the following format:
#5,p;<Status Byte> <LSB of the transmission counter> <MSB of the transmission counter>
<NofClasses><BottomClass><ClassWidth><Counter of the class> (...) <Counter of the class>
Status Byte gives the information about the current state of the instrument.
D7
D6
D5
D4
D3
D2
D1
D0
where:
D7 = 0
= 1
D6 = 1
D5 = 0
= 1
D0 to D4
means "overload does not happen",
means "overload appeared",
reserved,
the instantaneous current result (RUN State),
the final result (STOP State),
reserved bits.
Notice: There is not any succeeding transmission in the case when the Status Byte is equal
to zero.
The transmission counter is a two-byte word denoting the number of the remaining bytes to be
transmitted. Its value is calculated from the formulae:
Transmission counter = 6+n * (4 * the number of the classes in the statistics)
where:
n the number of the transmitted statistics. For p = 1, 2 or 3 only one statistic is transmitted (n = 1).
For p = 0 the number of the transmitted statistics depends on the measurement function and
• in the case of 1/1 OCTAVE analysis n is equal to the number of the analysis results (NOct –
cf. App. B) plus the number of the TOTAL values for this type of analysis (NOctTot);
• in the case of 1/3 OCTAVE analysis n is equal to the number of the analysis results (NTer –
cf. App. B) plus the number of the TOTAL values for this type of analysis (NTerTot).
NofClasses is a two-byte word denoting the number of classes in the statistic.
BottomClass is a two-byte word denoting the lower limit of the first class (*10 dB).
ClassWidth is a two-byte word denoting the width of the class (*10 dB).
Counter of the class is a four-byte word containing the number of the measurements belonging to
the current class.
Notice: The bytes in the words are sent according to the scheme <LSByte>..<MSByte>.
A-8
G7 USER MANUAL
A.7. Function #6 – Remote setting of the user filters
Function #6 enables one to send to the instrument the coefficients of the user filters.
In the available formats description of #6 functions the following symbols are used:
type
name, name1, name2
v
first
pos
avd
cal
chn
- 0 for the vibration filters,
- 1 for the acoustic filters,
- filter names given by the user,
- real type value, expressed in [dB],
- integer type value (number of the coefficient in the user filter),
- integer type value (Total value number),
- for the vibration filters: 0 - Acc, 1- Vel, 2 - Dil,
- for the acoustic filters, this parameter is always equal to 0,
- the calibration coefficient given as the real number expressed in [dB].
- channel number (1, 2, 3 or 4)
#6 function formats are defined as follows:
#6,type,L;
This function returns the list of the defined (existing in the instrument) filters in the following format:
#6,type,n,name1, ... ,namen;
#6,type,W,name,v,v,...,v;
This function sets the coefficients of the new user filter named as name. The name parameter
should be unique (in the instrument there is not any other filter with the same name, otherwise it will be
an error). The function answers in the format: #6;
#6,type,R,name;
This function returns the coefficients of the user filter named as name. If the name filter does not
exist, an error occurs. The function’s answer is in the following format: #6,type,n,v1,v2, ... ,vn;
#6,type,D,name;
This function deletes from the instrument the user filter named as name. If the name filter does not
exist, an error occurs. The function answers in the format: #6;
#6,type,S,name,v,v,...,v;
This function sets the user filter named as name. If the name filter already exists, its coefficients
are redefined. If the name filter does not exist, the filter is created. The function answers in the format:
#6;
#6,type,C,name,first,v,v,...,v;
This function sets the coefficients in the user filter named as name starting from the first position. If
the name filter does not exist, an error occurs. The function answers in the format: #6;
#6,type,N,name1,name2;
This function changes the name of the user filter from name1 to name2. The function answers in the
format: #6;
#6,type,@,chn,L;
This function returns the names of the user filters, assigned to the channel chn consecutive TOTAL
values, in the following format: #6,type,chn,3,name1,name2,name3;
#6,type,@,chn,pos,?;
A-9
G7 USER MANUAL
_
This function returns the description record of the user filter assigned to the pos TOTAL value of
channel chn in the following format: #6,type,@,chn,pos,name,avd,cal; (the description record
contains: the name of the filter, its type and the calibration coefficient).
#6,type,@,chn,pos,*;
This function recovers the predefined filter for the pos TOTAL value of channel chn and answers in
the following format: #6,type,@,chn,pos,name,avd,cal;
#6,type,@,chn,pos,name,avd,cal;
This function sets the description record of the user filter assigned to the pos TOTAL value of
channel chn in the following format: #6,type,@,chn,pos,name,avd,cal;
The returned parameters: name, avd and cal are set in the description record after the execution of
the function. In the case of an error they can differ from the current parameters of the function.
Notice: In the case of an error all these functions return the following sequence of the
characters: #6?;
A.8. Function #7 – Special control functions
Function #7 enables the user to perform special control functions. Some of them should be used
with the extreme care.
#7 function formats are defined as follows:
#7,CB;
This function clears the logger memory - all logger files will be deleted. The function returns #7,CB;
This function is not accepted while the instrument is in the RUN state.
#7,BF;
This function returns logger memory free space in the format: #7,BF,ddddd; (ddddd - number
of bytes in decimal format).
#7,BN;
This function returns the number of logger files created to the current time in the format:
#7,BN,ddddd; (ddddd - number of logger files in decimal format).
#7,RT;
This function returns current real time clock settings in the format: #7,RT,hh,mm,ss,DD,MM,YYYY;
where hh:mm:ss denote the time and DD/MM/YYYY gives the date.
#7,RT,hh,mm,ss,DD,MM,YYYY;
This function sets the current real time clock and returns the following sequence of characters:
#7,RT;
#7,AS;
This function returns current real time and date settings for the AutoStart function in the format:
#7,AS,e,hh,mm,DD,Rhh,Rmm; where e=1 if AutoStart function is switched ON in SINGLE mode, e=2
if AutoStart function is switched ON in MULTI mode or 0 if it is switched OFF, hh:mm gives the time,
DD gives the day for the current date, Rhh,Rmm gives the repetitions time.
A-10
G7 USER MANUAL
#7,AS,e,hh,mm,DD,Rhh,Rmm;
This function uses the given time and date settings for AutoStart function and returns the following
sequence of characters: #7,AS;
#7,IC;
Reserved.
#7,SC;
Reserved.
#7,DA;
This function deletes all files (result files and setup files). The function returns #7,DA; This function
is not accepted while the instrument is in the RUN state.
#7,LP;
Reserved.
#7,BP;
Reserved.
#7,ME;
This function returns the size of internal flash memory in format #7,ME,FlashMB;
#7,LS,setup_name;
This function loads setup and writes settings into EEPROM. The selected file must exist.
The function returns #7,LS;
#7,SS;
This function creates setup file based on the current settings. The function returns #7,SS;
#7,HO;
This function enables one to calibrate the instrument via the Harvest SPE Modems.
#7,CS;
This function clears current setup.
#7,DF;
#7,DF,file_name;
#7,DF,file_name<address;
This function deletes all result files or deletes file specified by file_name or internal flash address.
#7,DS;
#7,DS,file_name;
#7,DS,file_name<address;
This function deletes all setup files or deletes file specified by file_name or internal flash address.
#7,US;
This function returns unit subversion.
A-11
G7 USER MANUAL
_
#7,BS;
This function returns battery state in percentage. If the instrument is powered from the external
power, this function return -1 or if it is powered from the USB interface, the function returns -2.
#7,DL;
This function returns day time limits in format #7,DL,x;
#7,DL,x;
This function enables ( x = 1 ) or disables ( x = 0 ) day time limits and returns the following
sequence of characters: #7,DL;
#7,SL;
This function returns all statistical levels in the format #7,SL,sl1,sl2,sl3,sl4,sl5,sl6,sl7,sl8,sl9,sl10;
#7,SL,sl_index,sl_level;
This function sets statistical levels where sl_index is the statistical index, sl_level is the statistical
level and it returns the following sequence of characters: #7,SL;
#7,MC;
This function returns microphone compensation in the format #7,MC,x;
#7,MC,xxx;
This function sets the microphone compensation and returns the following sequence of characters:
#7,MC; where xxx means:
x=0: Off
x=1: FREE FIELD
x=2: DIFFUSE FIELD
x=3: OUTDOOR ENVIRONMENT
x=4: OUTDOOR AIRPORT
x=5: EXTENSION CABLE
#7,LA;
This function returns the current language in the format: #7,LA,xx; where xx is language codes: EN
(English), IT (Italian), PL (Polish), RU (Russian), HU (Hungarian), TU (Turkish), NL (Flemish), FR
(French), SP (Spanish), DE (German).
#7,PO;
This function powers off the instrument.
#7,BD;
This function returns baud rate in the format #7,BD,xxx;
#7,BD,xxx;
This function sets baud rate and returns the following sequence of characters: #7,BD; where xxx
means:
xxx=8: 115200
xxx=7: 57600
xxx=6: 38400
xxx=5: 19200
xxx=4: 9600
A-12
G7 USER MANUAL
xxx=3: 4800
xxx=2: 2400
xxx=1: 1200
#7,TO;
This function returns RS232 time out in the format #7,TO,xxx;
#7,TO,xxx;
This function sets RS232 time out in seconds where xxx ∈(1 ÷ 60) and returns the following
sequence of characters: #7,TO;
#7,WS;
This function returns states of warnings if results are not saved in the format #7,WS,x;
#7,WS,x;
This function enables ( x = 1 ) or disables ( x = 0 ) the warnings if the results are not saved and
it returns the following sequence of characters: #7,WS;
#7,RC;
This function returns the transition type for remote communication in the format #7,RC,xxx;
#7,RC,xxx;
This function sets the transition type for remote communication and returns the following sequence
of characters: #7,RC; where xxx means:
xxx=0: Off
xxx=1: Continuous
xxx=2: Packet
#7,RP;
This function returns the packet size for remote communication in the format #7,RP,xxx;
#7,RP,xxx;
This function sets the packet size for remote communication and returns the following sequence
of characters: #7,RP; The possible values are as follows: 1024, 512, 256, 128, 64.
#7,WU;
This function returns the vibration unit type in the format #7,WU,x;
#7,WU,x;
This function sets the vibration unit type: non-metric ( x = 0 ), or metric ( x = 1 ) and returns
the following sequence of characters: #7,WU;
#7,RA;
This function returns the ACC reference levels in the format #7,RA,xxx;
#7,RA,xxx;
This function sets the ACC reference levels, where xxx ∈(1 ÷ 100) and returns the following
sequence of characters: #7,RA;
A-13
G7 USER MANUAL
_
#7,RV;
This function returns the VEL reference levels in the format #7,RV,xxx;
#7,RV,xxx;
This function sets the VEL reference levels, where xxx ∈(1 ÷ 100) and returns the following
sequence of characters: #7,RV;
#7,RD;
This function returns the DIL reference levels in the format #7,RD,xxx;
#7,RD,xxx;
This function sets the DIL reference levels, where xxx ∈(1 ÷ 100) and returns the following
sequence of characters: #7,RD;
#7,MB;
This function returns the tonality maximum band in the format #7,MB,xxx;
#7,MB,xxx;
This function sets the tonality maximum band in percentage, where xxx ∈(5 ÷ 25) and returns
the following sequence of characters: #7,MB;
#7,TS;
This function returns the tonality tone seek in the format #7,TS,xxx;
#7,TS,xxx;
This function sets the tonality tone seek in dB, where xxx ∈(10 ÷ 50) and returns the following
sequence of characters: #7,TS;
#7,RE;
This function returns the tonality regression in the format #7,RE,xxx;
#7,RE,xxx;
This function sets the tonality regression in percentage, where xxx ∈(50 ÷ 100) and returns
the following sequence of characters: #7,RE;
#7,TB;
This function returns the tonality tone band in the format #7,TB,xxx;
#7,TB,xxx;
This function sets the tonality tone band in dB, where xxx ∈(10 ÷ 60) and returns the following
sequence of characters: #7,TB;
#7,SM;
This function returns the RT60 smoothing in the format #7,SM,xxx;
#7,SM,xxx;
This function sets the RT60 smoothing, where xxx ∈(0 ÷ 15) and returns the following sequence
of characters: #7,SM;
A-14
G7 USER MANUAL
#7,NM;
This function returns the RT60 noise margin in the format #7,NM,xxx;
#7,NM,xxx;
This function sets the RT60 noise margin in dB, where xxx ∈(0 ÷ 200) and returns the following
sequence of characters: #7,NM;
#7,AV;
This function returns the RT60 averaging in the format #7,AV,x;
#7,AV,x;
This function enables ( x = 1 ) or disables ( x = 0 ) the RT60 averaging and returns the following
sequence of characters: #7,AV;
#7,AC,1;
This function clears the RT60 averaging and returns the following sequence of characters: #7,AC;
#7,RR;
This function returns the real time results mode in the format #7,RR,xxx;
#7,RR,xxx;
This function sets the real time results mode: samples ( xxx = 0 ), or logger results ( xxx = 1 ) and
returns the following sequence of characters: #7,RR;
#7,WF;
This function returns the state of the USB DISK FREE SPACE warning. If the USB disk connected
to the instrument has less free space than required to save measurement data, the function returns
the following sequence of characters #7,WF,x;
#7,WF,x;
This function enables ( x = 1 ) or disables ( x = 0 ) the USB DISK FREE SPACE warning and
returns the following sequence of characters: #7,WF;
#7,WM;
This function returns the state of the MIN FREE SPACE warning. If the USB disk connected to
the instrument has less free space than set in this position, the function returns the following sequence
of characters #7,WM,xxx;
#7,WM,xxx;
This function sets the value in the MIN FREE SPACE position of the WARNINGS sub-list (path:
MENU / SETUP / WARNINGS MIN FREE SPACE), xxx ∈(1 ÷ 1024) MB and returns the following
sequence of characters: #7,WM;
#7,LB;
This function returns the name of last logger in format #7,LB,logger_name;
#7,IE;
This function returns the IEPE CURRENT setting in format #7,IE,x;
A-15
G7 USER MANUAL
_
#7,IE,x;
This function sets IEPE CURRENT amperage to 1.5 mA ( x = 0 ) or 4.5 mA ( x = 1 ) and returns
the following sequence of characters: #7,IE;
For the unknown function and/or in the case of the other error, all these functions return
the following sequence of characters: #7,?;
A.9. Function #9 – Write-in of the data file into the internal Flash-Disc
#9 function enables the user to write-in the data file into the internal Flash-disc memory. The data
file formats are given in Appendix B.
#9 function formats are defined as follows:
#4,2,FILE_LENGTH,DATA the setup file
where:
FILE_LENGTH
length of the file in bytes,
DATA
binary content of the file.
A.10. Control setting codes
The control setting codes used in the G7 instrument (the internal software revision 6.04) are given
in the table below.
Table A.1. Control setting codes
A-16
Group name
Group
code
Unit type
U
U957 (read only)
Serial number
N
Nxxxx
(read only)
LEVEL METER software version
W
WLxxx
xxx - revision number (read only)
Software version
WL
Calibration factor
Q
Qnnnn nnnn-real number with the value of the
calibration factor ∈(-99.9 ÷ 99.9)
Meter mode
Z
Z0 Z1 -
VoltageInput
V
VoltageInput:
V0 - off
V1 - on
Measurement function
M
M1 M2 M3 M4 M6 M8 -
Range
R
R1 - LOW
R2 - HIGH
Results displayed on the screen
P
P1 P2 P3 -
Code description
Wyyy yyy - revision number (read only)
VIBRATION METER
SOUND METER
LEVEL METER
1/1 OCTAVE analyser
1/3 OCTAVE analyser
DOSE METER
FFT analyser
RT60
PROFILE 1 (read only)
PROFILE 2 (read only)
PROFILE 3 (read only)
G7 USER MANUAL
Filter type in profile n
in SLM mode
F
F1:n Z filter for profile n
F2:n A filter for profile n
F3:n C filter for profile n
Filter type in 1/1 OCTAVE,
1/3 OCTAVE or FFT analysis
f
f1 f2 f3 -
Z filter
A filter
C filter
Filter type in profile n
in VLM mode
I
I1:n
I2:n
I3:n
I4:n
I5:n
I6:n
I7:n
I8:n
I9:n
I10:n
I15:n
I16:n
I17:n
I18:n
I19:n
I20:n
I21:n
I22:n
I23:n
HP1 filter for profile n
HP3 filter for profile n
HP10 filter for profile n
Vel11 filter for profile n
Vel3 filter for profile n
Vel10 filter for profile n
VelMF filter for profile n
Dil1 filter for profile n
Dil3 filter for profile n
Dil10 filter for profile n
KB filter for profile n
Wk filter for profile n
Wd filter for profile n
Wc filter for profile n
Wj filter for profile n
Wm filter for profile n
Wh filter for profile n
Wg filter for profile n
Wb filter for profile n
Detector type in profile n in SLM mode
C
C0:n C1:n C2:n -
IMPULSE detector in profile n
FAST detector in profile n
SLOW detector in profile n
E
E0:n E1:n E2:n E3:n E4:n E5:n E6:n E7:n -
100ms detector in profile n
125ms detector in profile n
200ms detector in profile n
500ms detector in profile n
1.0s detector in profile n
2.0s detector in profile n
5.0s detector in profile n
10.0s detector in profile n
Logger type in profile n
in SLM mode
B
Bx:n x - sum of the following flags
flags:
1logger with PEAK values in profile n
2logger with MAX values in profile n
4logger with MIN values in profile n
8logger with RMS values in profile n
Storing the results of 1/1 OCTAVE or
1/3 OCTAVE analysis in logger’s file
in SLM mode
b
b0 b1 -
Logger type in profile n
in VLM mode
G
Gx:n - x - sum of the following flags
flags:
1logger with PEAK values in profile n
2logger with P–P values in profile n
4logger with MAX values in profile n
8logger with RMS values in profile n
Storing the results of 1/1 OCTAVE or
1/3 OCTAVE analysis in logger’s file
in VLM mode
g
g0 g1 -
Detector type in profile n in VLM mode
switched off ([ ])
switched on ([√
√])
switched off ([ ])
switched on ([√
√])
A-17
G7 USER MANUAL
_
nnn number in milliseconds ∈(2, 5, 10,
20, 25, 50, 100, 200, 500, 1000)
dnns nn number in seconds ∈(1 ÷ 60)
dnnm nn number in minutes ∈( 1 ÷ 60)
dnnn
Logger step
d
D0 -
Integration period
D
infinity (measurement finished by
pressing the <STOP> push-button or
remotely - by sending S0 control code)
Dnns nn number in seconds
Dnnm nn number in minutes
Dnnh nn number in hours
K0 -
infinity (measurement finished by
pressing the <STOP> push-button or
remotely - by sending S0 control code)
Repetition of the measurement cycles
(RepCycle)
K
Detector type in the LEQ function
L
L0 L1 -
LINEAR
EXPONENTIAL
r
r1 r2 r3 r4 r5 r6 r7 r8 r9 -
FFT analysis band = 22.4 kHz
FFT analysis band = 11.2 kHz
FFT analysis band = 5.6 kHz
FFT analysis band = 2.8 kHz
FFT analysis band = 1.4 kHz
FFT analysis band = 700 Hz
FFT analysis band = 350 Hz
FFT analysis band = 175 Hz
FFT analysis band = 87.5 Hz
Window in FFT analysis
w
w0 w1 w2 w3 -
HANNING
RECTANGLE
FLAT TOP
KAISER BESSEL
Averaging in FFT analysis
a
a0 a1 -
LINEAR
EXPONENTIAL
Measure Triggering mode
(TriggerMode)
m
m0 m1 m2 m3 m4 m5 -
switched off (OFF)
SLOPE +
SLOPE –
LEVEL +
LEVEL –
GRAD+
Source of the measure triggering signal
for measurement functions: M1, M6, M7
(TriggerSource)
s
s0 s1 -
o
o0 - SPL(1) (SPL from the first profile)
onn - nn number of the filter in 1/1 OCTAVE
spectra ∈(8 ÷ NOct); Noct = 15 - number
of filters in 1/1 OCTAVE analysis. There
are respectively:
8125 Hz
9250 Hz
...
15 16 kHz
FFT analysis band
Source of the measure triggering signal
for measurement function M2
(TriggerOctSource)
A-18
.....................
Knnnn - nnnn number of repetitions ∈(1 ÷ 1000)
RMS
EXT. IO
G7 USER MANUAL
Source of the measure triggering signal
for measurement function M3
(TriggerTerSource)
Measure Triggering level (TriggerLev)
in SLM mode
Measure Triggering level (TriggerLev)
in VLM mode
t
t0 - SPL(1) (SPL from the first profile)
tnn nn number of the filter in 1/3 OCTAVE
spectra ∈(23 ÷ NTer), NTer=45 - number
of filters in 1/3 OCTAVE analysis. There
are respectively:
23 125 Hz
24 160 Hz
...
45 20 kHz
l
Innn - nnn level in dB ∈(24 ÷ 136)
n
nxxx - xxx level in dB ∈(60 ÷ 200)
pnn -
nn number of records saved in the
logger before the triggering condition;
nn ∈(0 ÷ 50)
Number of records taken into account
before the fulfilment of the triggering
condition (TriggerPre)
p
Number of records taken into account
after the fulfilment of the triggering
condition (TriggerPost)
q
qnnn - nnn number of records saved in the
logger after the fulfilment of the
triggering condition; nn ∈(0 ÷ 200)
O
Onnn -
k
knnn - nnn gradient in dB/ms ∈(1 ÷ 100)
Spectrum Band
A
A0 A1 -
Exposure Time
e
ennn -
c
c1 c2 c3 c4 -
80 dB
84 dB
85 dB
90 dB
h
h0 h1 h2 h3 h4 -
None
75 dB
80 dB
85 dB
90 dB
Exchange Rate
x
x2 x3 x4 x5 -
2 dB
3 dB
4 dB
5 dB
FFT lines
y
y0 y1 y2 -
1920
960
480
FFT logger
z
z0 z1 -
switched off ([ ])
switched on ([√
√])
Logger
T
T0 T1 -
switched off ([ ])
switched on ([√
√])
Delay in the start of measurement
Y
Ynn
nn delay given in seconds ∈(0 ÷ 59)
State of the instrument (Stop or Start)
S
S0 S1 -
STOP
START
Measure Triggering gradient
in SLM mode
Measure Triggering gradient
in VLM mode
Criterion Level
Threshold Level
nnn gradient in dB/ms ∈(1 ÷ 100)
FULL
AUDIO
nnn time in minutes ∈ (1 ÷ 480)
A-19
G7 USER MANUAL
_
Extended IO Mode
Xx
Xx0 - ANALOG OUT
Xx1 - DIGITAL IN
Xx2 - DIGITAL OUT
Extended IO Function
Xz
Xz0 - TRIGGER PULSE
Xz1 - ALARM PULSE
Extended IO Active Level
Xc
Xc0 - LOW
Xc1 - HIGH
Extended IO Source
Xs
Xs3 - PEAK(1)
Xs4 - SPL(1)
Xs5 - LEQ(1)
Extended IO Alarm Level
Xn
Xnxxxx - xxxx alarm level in dB multiple by 10
∈ (300 ÷ 1400)
Reference Level ACC
Xa
Xannn 2
µm/s
nnn reference level ∈(1 ÷ 100) in
Reference Level VEL
Xv
Xvnnn nm/s
nnn reference level ∈(1 ÷ 100) in
Reference Level DIL
Xd
Xdnnn -
nnn reference level ∈(1 ÷ 100) in pm
Auto Save
XA
XA0 - switched off ([ ])
XA1 - switched on ([√
√])
RAM File
XR
XR0 - switched off ([ ])
XR1 - switched on ([√
√])
Save Statistics
XS
XS0 - switched off ([ ])
XS1 - switched on ([√
√])
Save Max Spectrum
XM
XM0 - switched off ([ ])
XM1 - switched on ([√
√])
Save Min Spectrum
Xm
Xm0 - switched off ([ ])
Xm1 - switched on ([√
√])
Replace File
XP
XP0 - switched off ([ ])
XP1 - switched on ([√
√])
Direct Save
XD
XD0 - switched off ([ ])
XD1 - switched on ([√
√])
RPM On
Xr
Xr0 - switched off ([ ])
Xr1 - switched on ([√
√])
RPM Pulse
Xp
Xpnnn -
RPM Unit
Xu
Xu0 - RPS
Xu1 - RPM
Logger Triggering mode (TriggerMode)
XT
XT0 - switched off (OFF)
XT1 - LEVEL +
XT2 - LEVEL –
XL
XLnnn -
XQ
XQnn - nn number of records saved in the
logger before the triggering condition;
nn ∈(0 ÷ 50)
Logger Triggering level (TriggerLev)
in SLM mode
Logger Triggering
Number of records taken into account
before the fulfilment of the triggering
condition (TriggerPre)
A-20
nnn pulse/rot ∈(1 ÷ 360)
nnn level in dB ∈(24 ÷ 136)
G7 USER MANUAL
Logger Triggering
Number of records taken into account
after the fulfilment of the triggering
condition (TriggerPost)
Xq
Xqnnn - nnn number of records saved in the
logger after the fulfilment of the
triggering condition; nn ∈(0 ÷ 200)
A-21
G7 USER MANUAL
.
B. DATA FILE STRUCTURES
B.1. Structure of the G7 file
Each file containing data from the G7 instrument consists of several groups of words. In the case
of the G7 (the internal file system version 6.04) there are different types of files that contain:
• the results stored in the file in the instrument’s logger (cf. App. B.2)
• the measurement results from the Sound Level Meter mode (cf. App. B.3)
• the measurement results from the Vibration Level Meter mode (cf. App. B.4)
• the results of the DOSE METER function (cf. App. B.5)
• the results from 1/1 OCTAVE analysis (cf. App. B.6)
• the results from 1/3 OCTAVE analysis (cf. App. B.7)
• the results from the FFT analysis (cf. App. B.8)
• the results of the RT60 function (cf. App. B.9)
• the setup data (cf. App. B.10)
Each file has the following elements:
• a file header (cf. Tab. B.1.1);
• the unit and internal software specification (cf. Tab. B.1.2)
• the user’s text (a header) stored together with the measurement data (cf. Tab. B.1.3)
• the parameters and global settings, common for all profiles (cf. Tab. B.1.4_SLM and Tab. B.1.4_VLM)
• the parameters for measurement trigger (cf. Tab. B.1.5)
• the parameters for logger trigger (cf. Tab. B.1.6)
• the parameters for recorder trigger (cf. Tab. B.1.7)
• the Extended I/O settings (cf. Tab. B.1.8)
• the special settings for profiles (cf. Tab. B.1.9_SLM and Tab. B.1.9_VLM)
• the marker for the end of the file (cf. Tab. B.1.27)
The other elements of the file structure are not obligatory for each file type stated above.
They depend on the file type (VLM or SLM, 1/1 OCTAVE, 1/3 OCTAVE, FFT, RT60, file from the logger).
These elements are as follows:
• the main results (cf. Tab. B.1.10_SLM, Tab. B.1.10_DM and Tab. B.1.10_VLM)
• the results coming from 1/1 OCTAVE analysis (cf. Tab. B.1.11)
• the results coming from 1/3 OCTAVE analysis (cf. Tab. B.1.12)
• the header of the FFT analysis (cf. Tab. B.1.13)
• the results of the FFT analysis (cf. Tab. B.1.14)
• statistical levels (cf. Tab. B.1.15)
• the header of the statistical analysis (cf. Tab. B.1.16)
• the results of the statistical analysis (cf. Tab. B.1.17)
• the header of the statistical analysis performed in 1/1 OCTAVE or 1/3 OCTAVE analysis
(cf. Tab. B.1.18)
• the results of the statistical analysis made in 1/1 OCTAVE or 1/3 OCTAVE analysis (cf. Tab. B.1.19)
• the parameters of the RT60 function (cf. Tab. B.1.20)
• the results from the RT60 function (cf. Tab. B.1.21)
• the averaged results from the RT60 function (cf. Tab. B.1.22)
• the RPM results (cf. Tab. B.1.23)
• the settings of the instrument saved in the setup file (cf. Tab. B.1.24)
B-1
G7 USER MANUAL
.
• the logger header (cf. Tab. B.1.25)
• the data stored during the measurements in the logger (cf. Tab. B.1.26)
Below, all file structure groups are described separately in Tab. B.1.1 ÷ Tab. B.1.27. The format
used in the columns, named Comment with the square parenthesis ( [xx, yy] ), means the contents
of the word with xx is the most significant byte (MSB) and yy the lowest significant byte (LSB) of the word.
The format 0xnnnn means that the nnnn is four-digit number in hexadecimal form.
Table B.1.1. File header
Word
number
0
1..4
5
6
7
8..11
…
Name
0xnn01
FileName
Reserved
CurrentDate
CurrentTime
AssBufFileName
…
Comment
[01 = id, nn = block’s length]
file or logger name (8 characters)
reserved
file creation date
file creation time
name of the associated logger or file (8 bytes)
…
Table B.1.2. Unit and software specification
Word
number
0
1
2
3
4
Name
0xnn02
UnitNumber
UnitType
SoftwareVersion
SoftwareIssueDate
5
DeviceMode
6
7
8
9
…
UnitSubtype
FileSysVersion
LevelMetVersion
SoftwareSubversion
…
Comment
[02 = id, nn = block’s length]
unit number
unit type: 957
software version * 100
software issue date
device mode:
0 - Vibration Level Meter / Analyser (VLM)
1 - Sound Level Meter / Analyser (SLM)
unit subtype: 1
file system version
level meter version
software subversion
…
Table B.1.3. USER’s text
Word
number
0
0xnn03
1…
title text
B-2
Name
Comment
[03 = id, nn = block’s length]
the user’s text (two characters in a word) finished with one or two
null bytes
G7 USER MANUAL
.
Table B.1.4_SLM. Parameters and global settings in the case of SLM mode
Word
number
0
1
2
Name
0xnn04
MeasureStartDate
MeasureStartTime
3
DeviceFunction
4
MeasureInput
5
Range
6
UnitFlags
7
RepCycle
8
NofProf
9
StartDelay
10..11
IntTimeSec
12
MicFieldCorr
13
LeqInt
14
SpectrumFilter
15
SpectrumBuff
16
ExposureTime
17
CriterionLevel or
RT60Method
18
ThresholdLevel
19
ExchangeRate
20
CalibrType
Comment
[04 = id, nn = block’s length]
measure start date
measure start time
device function:
1 - LEVEL METER
2 - 1/1 OCTAVE analyser
3 - 1/3 OCTAVE analyser
4 - DOSE METER
6 - FFT analyser
8 - RT60 function
measurement input type:
2 - Microphone
measurement range:
1 - LOW
2 - HIGH
calibration flags
repetition cycle:
0 - infinity
nnnn - number of repetitions ∈(1 ÷ 1000)
number of profiles (3)
start delay time specified in seconds:
0..60
integration time specified in seconds
field correction:
0 - FREE
1 - DIFFUSE
detector's type in the LEQ function:
0 - LINEAR
1 - EXPONENTIAL
1/1, 1/3 OCTAVE or FFT analysis filter:
0 - Z, 2 - A, 3 - C
1/1, 1/3 OCTAVE or FFT logger:
0 - off, 1 - on
in other cases:
reserved
exposure time:
1..480 (min)
criterion level in case of DOSE METER:
80, 84, 85, 90 (*10 dB)
RT60 method in case of RT60 function:
1 - DECAY, 2 - IMPULSE
in other cases:
reserved
threshold level (only DOSE METER):
0, 75, 80, 85, 90 (*10 dB)
exchange rate (only DOSE METER):
2, 3, 4, 5
last calibration type:
0 - none, 1 - by measurement, 2 - by sensitivity
B-3
G7 USER MANUAL
.
21
22
23
24
CalibrDate
CalibrTime
25
OutdoorFilter
26
OutdoorType
27
MicComp
28
VoltageInput
29
HighCurrentIEPE
30..47
…
…
last calibration date
last calibration time
reserved
reserved
outdoor filter:
0 - off, 1 - on
outdoor filter type:
0 - ENVIRONMENT, 1 - AIRPORT
compensating filter for microphones:
0 - off, 1 - on
voltage input:
0 - off, 1 - on
0 - 1.5 mA
1 - 4.5 mA
reserved
…
Table B.1.4_VLM. Parameters and global settings in the case of VLM mode
Word
number
0
1
2
Name
0xnn04
MeasureStartDate
MeasureStartTime
3
DeviceFunction
4
MeasureInput
5
Range
6
UnitFlags
7
RepCycle
8
NofProf
9
StartDelay
10..11
12
IntTimeSec
Reserved
Comment
[04 = id, nn = block’s length]
measure start date
measure start time
device function:
1 - LEVEL METER
2 - 1/1 OCTAVE analyser
3 - 1/3 OCTAVE analyser
6 - FFT analyser
measurement input type:
5 - Accelerometer
measurement range:
1 - LOW
2 - HIGH
calibration flags
repetition cycle:
B-4
13
LeqInt
14
SpectrumFilter
15
SpectrumBuff
0 - infinity
nnnn - number of repetitions ∈(1 ÷ 1000)
number of profiles (3)
start delay time specified in seconds:
0..60
integration time specified in seconds
reserved
detector type in the RMS function:
0 - LINEAR, 1 - EXPONENTIAL
1/1, 1/3 OCTAVE or FFT analysis filter:
0-Z
1/1, 1/3 OCTAVE or FFT logger:
0 - off, 1 - on
in other cases:
G7 USER MANUAL
.
reserved
reserved
16
17
18
19
RefLev_a
RefLev_v
RefLev_d
20
CalibrType
21
22
CalibrDate
CalibrTime
23
RPM_On
24
RPM_Pulse
-2
25
26
27
28
VoltageInput
29
HighCurrentIEPE
30..47
…
reference level for acceleration given in µms ∈(1 ÷ 100)
-1
reference level for velocity given in nms ∈(1 ÷ 100)
reference level for displacement given in pm ∈(1 ÷ 100)
last calibration type:
0 - none, 1 - by measurement, 2 - by sensitivity
last calibration date
last calibration time
RPM measure
0 - off, 1 - on
RPM pulse:
1..360
reserved
reserved
reserved
voltage input:
0 - off, 1 - on
0 - 1.5 mA
1 - 4.5 mA
reserved
…
…
Table B.1.5. MEASURE TRIGGER parameters
Word
number
0
Name
0xnn2B
1
TriggerMode
2
TriggerSource
3
TriggerLev
4
TriggerGrad
5
6
…
TriggerPre
TriggerPost
…
Comment
[2B = id, nn = block’s length]
trigger mode:
0 - OFF
1 - SLOPE +
2 - SLOPE –
3 - LEVEL +
4 - LEVEL –
6 - GRAD +
source of the triggering signal:
0 - RMS(1) the RMS result from the first profile
in the case of TriggerMode=SLOPE + or SLOPE –:
1 - External IO
level of triggering:
24..136 dB (*10)
gradient of triggering (in case of TriggerMode=GRAD +):
1dB/ms..100dB/ms
reserved
reserved
…
B-5
G7 USER MANUAL
.
Table B.1.6. LOGGER TRIGGER parameters
Word
number
0
Name
0xnn2C
1
TriggerMode
2
TriggerSource
3
TriggerLev
4
TriggerGrad
5
TriggerPre
6
TriggerPost
…
…
Comment
[2C = id, nn = block’s length]
trigger mode:
0 - OFF
3 - LEVEL +
4 - LEVEL –
in the case of RT60 function and DECAY method
5 - DECAY
in the case of RT60 function and IMPULSE method
1 - SLOPE+
source of the triggering signal:
0 - RMS(1) the RMS result from the first profile
in the case of 1/1 OCTAVE analyser
nn - number of 1/1 OCTAVE filter ∈(8 ÷ NOct)
in the case of 1/3 OCTAVE analyser
nn - number of 1/3 OCTAVE filter ∈(23 ÷ NTer)
in the case of RT60 function
48 - TOTAL Z (NTer+NTotal)
level of triggering:
24..136 dB (*10)
in the case of RT60 function and DECAY method
decay of triggering: -10dB (*10)
in other cases:
reserved
number of the records taken into account before the fulfilment of the
triggering condition ∈(1 ÷ 50)
number of the records taken into account after the fulfilment of the
triggering condition ∈(1 ÷ 200)
…
Table B.1.7. RECORDER TRIGGER parameters
Word
number
0
B-6
Name
0xnn2D
1
TriggerMode
2
TriggerSource
3
TriggerLev
4
TriggerGrad
Comment
[2D = id, nn = block’s length]
trigger mode:
0 - OFF
1 - SLOPE +
2 - SLOPE –
3 - LEVEL +
4 - LEVEL –
6 - GRAD +
source of the triggering signal:
0 - RMS(1) the RMS result from the first profile
in the case of TriggerMode=SLOPE + or SLOPE –:
1 - External I/O
level of triggering:
24..136 dB (*10)
gradient of triggering (in case of TriggerMode=GRAD +):
G7 USER MANUAL
.
5
6
…
TriggerPre
TriggerPost
…
1dB/ms..100dB/ms
reserved
reserved
…
Table B.1.8. EXTended I/O parameters
Word
number
0
Name
0xnn2E
1
Mode
2
Function
3
ActiveLevel
4
Source
5
AlarmLevel
6
AO_Direct
7
AO_DA
8
AO_Source
9
Polarisation
…
…
Comment
[2E = id, nn = block’s length]
mode:
0 - ANALOG OUT
1 - DIGITAL IN
2 - DIGITAL OUT
in case of ANALOG OUT:
reserved
in case of DIGITAL IN:
0 - EXTERNAL TRIGGER
in case of DIGITAL OUT:
0 - TRIG. PULSE
1 - ALARM PULSE
in case of DIGITAL OUT and ALARM PULSE:
0 - LOW
1 - HIGH
in other cases:
reserved
in case of DIGITAL OUT and ALARM PULSE:
0 - PEAK(1)
1 - SPL(1)
2 - LEQ(1)
in other cases reserved
in case of DIGITAL OUT and ALARM PULSE:
30 - 140 dB (*10)
in other cases reserved
in case of ANALOG OUT
0 - off, 1 - on
in other cases reserved
in case of ANALOG OUT
0 - off, 1 - on
in other cases reserved
in case of ANALOG OUT and AO_DA:
0-A
1-C
2-Z
in other cases reserved
in case of DIGITAL OUT and TRIG. PULSE:
0 - POSITIVE
1 - NEGATIVE
in other cases:
reserved
…
B-7
G7 USER MANUAL
.
Table B.1.9_SLM. Special settings for profiles in the case of SLM mode
Word
number
Name
Comment
0
0xnn05
[05 = id, nn = block’s length]
1
0x0307
[used_profile, profile’s mask]
2
0xmm06
[06 = id, mm = sub-block’s length]
DetectorP[1]
detector type in the 1 profile:
0 - IMP.
1 - FAST
2 - SLOW
FilterP[1]
filter type in the 1 profile:
0-Z
2-A
3-C
5
BufferP[1]
logger contents in the 1 profile defined as a sum of:
0 - none
1 - PEAK
2 - MAX
4 - MIN
8 - RMS
6
CalibrFactor[1]
calibration factor (*10 dB) in the 1 profile
7
ProfileFlags[1]
flags in the 1 profile
8
0xmm06
[06 = id, mm = sub-block’s length]
DetectorP[2]
detector type in the 2 profile:
0 - IMP.
1 - FAST
2 - SLOW
FilterP[2]
filter type in the 2 profile:
0-Z
2-A
3-C
11
BufferP[2]
logger contents in the 2 profile defined as a sum of:
0 - none
1 - PEAK
2 - MAX
4 - MIN
8 - RMS
12
CalibrFactor[2]
calibration factor (*10 dB) in the 2 profile
13
ProfileFlags[2]
flags in the 2 profile
14
0xmm06
[06 = id, mm = sub-block’s length]
DetectorP[3]
Detector type in the 3 profile:
0 - IMP.
1 - FAST
2 - SLOW
FilterP[3]
filter type in the 3 profile:
0-Z
2-A
st
3
st
4
st
st
st
nd
9
nd
10
nd
nd
nd
rd
15
rd
16
B-8
G7 USER MANUAL
.
3-C
rd
17
BufferP[3]
logger contents in the 3 profile defined as a sum of:
0 - none
1 - PEAK
2 - MAX
4 - MIN
8 - RMS
18
CalibrFactor[3]
calibration factor (*10 dB) in the 3 profile
19
…
ProfileFlags[3]
…
flags in the 3 profile
rd
rd
…
Table B.1.9_VLM. Special settings for profiles in the case of VLM mode
Word
number
0
1
2
Name
Comment
0xnn05
0x0307
[05 = id, nn = block’s length]
[used_profile, profile’s mask]
0xmm06
[06 = id, mm = sub-block’s length]
DetectorP[1]
detector type in the 1 profile:
0 - 100 ms
1 - 125 ms
2 - 200 ms
3 - 500 ms
4-1s
5-2s
6-5s
7 - 10 s
FilterP[1]
filter type in the 1 profile:
0-Z
1 - HP1
2 - HP3
3 - HP10
4 - Vel1
5 - Vel3
6 - Vel10
7 - VelMF
8 - Dil1
9 - Dil3
10 - Dil10
15 - KB
16 - Wk
17 - Wd
18 - Wc
19 - Wj
20 - Wm
21 - Wh
22 - Wg
23 - Wb
BufferP[1]
logger contents in the 1 profile defined as a sum of:
0 - none
1 - PEAK
2 - P–P
st
3
st
4
st
5
B-9
G7 USER MANUAL
.
4 - MAX
8 - RMS
st
6
CalibrFactor[1]
calibration factor (*10 dB) in the 1 profile
7
ProfileFlags[1]
flags in the 1 profile
8
0xmm06
[06 = id, mm = sub-block’s length]
DetectorP[2]
detector type in the 2 profile:
0 - 100 ms
1 - 125 ms
2 - 200 ms
3 - 500 ms
4-1s
5-2s
6-5s
7 - 10 s
FilterP[2]
filter type in the 2 profile:
0-Z
1 - HP1
2 - HP3
3 - HP10
4 - Vel1
5 - Vel3
6 - Vel10
7 - VelMF
8 - Dil1
9 - Dil3
10 - Dil10
15 - KB
16 - Wk
17 - Wd
18 - Wc
19 - Wj
20 - Wm
21 - Wh
22 - Wg
23 - Wb
11
BufferP[2]
logger contents in the 2 profile defined as a sum of:
0 - none
1 - PEAK
2 - P–P
4 - MAX
8 - RMS
12
CalibrFactor[2]
calibration factor (*10 dB) in the 2 profile
13
ProfileFlags[2]
flags in the 2 profile
14
0xmm06
[06 = id, mm = sub-block’s length]
DetectorP[3]
detector type in the 3 profile:
0 - 100 ms
1 - 125 ms
2 - 200 ms
3 - 500 ms
4-1s
st
nd
9
nd
10
nd
nd
nd
rd
15
B-10
G7 USER MANUAL
.
16
FilterP[3]
17
BufferP[3]
18
19
…
CalibrFactor[3]
ProfileFlags[3]
…
5-2s
6-5s
7 - 10 s
rd
filter type in the 3 profile:
0-Z
1 - HP1
2 - HP3
3 - HP10
4 - Vel1
5 - Vel3
6 - Vel10
7 - VelMF
8 - Dil1
9 - Dil3
10 - Dil10
15 - KB
16 - Wk
17 - Wd
18 - Wc
19 - Wj
20 - Wm
21 - Wh
22 - Wg
23 - Wb
rd
logger contents in the 3 profile defined as a sum of:
0 - none
1 - PEAK
2 - P–P
4 - MAX
8 - RMS
rd
calibration factor (*10 dB) in the 3 profile
rd
flags in the 3 profile
…
Table B.1.10_SLM. Main results in the case of SLM mode
Word
number
Name
Comment
0
0xnn07
[07 = id, nn = block’s length]
1
0x0307
[used_profile, profile’s mask]
2
0xmm08
[08 = id, mm = sub-block’s length]
MeasureTime
time of the measurement
5
Result[1][1]
PEAK value in the 1 profile
6
Result[1][2]
reserved
7
Result[1][3]
maximal value (MAX) in the 1 profile
8
Result[1][4]
minimal value (MIN) in the 1 profile
3..4
st
st
st
st
9
Result[1][5]
SPL value in the 1 profile
10
Result[1][6]
LEQ value in the 1 profile
11
Result[1][7]
Lden value in the 1 profile
st
st
B-11
G7 USER MANUAL
.
st
12
Result[1][8]
Ltm3 value in the 1 profile
13
Result[1][9]
Ltm5 value in the 1 profile
14
Result[1][10]
reserved
15
Result[1][11]
reserved
16
UnderRes[1]
underrange value in the 1 profile
17
0xmm08
[08 = id, mm = sub-block’s length]
OVL
overload time
20
Result[2][1]
PEAK value in the 2 profile
21
Result[2][2]
reserved
22
Result[2][3]
maximal value (MAX) in the 2 profile
23
Result[2][4]
minimal value (MIN) in the 2 profile
24
Result[2][5]
SPL value in the 2 profile
25
Result[2][6]
LEQ value in the 2 profile
26
Result[2][7]
Lden value in the 2 profile
27
Result[2][8]
Ltm3 value in the 2 profile
28
Result[2][9]
Ltm5 value in the 2 profile
29
Result[2][10]
reserved
30
Result[2][11]
reserved
31
UnderRes[2]
underrange value in the 2 profile
32
0xmm08
[08 = id, mm = sub-block’s length]
33..34
Reserved
reserved
35
Result[3][1]
PEAK value in the 3 profile
36
Result[3][2]
reserved
37
Result[3][3]
maximal value (MAX) in the 3 profile
38
Result[3][4]
minimal value (MIN) in the 3 profile
18..19
st
st
nd
nd
nd
nd
nd
nd
nd
nd
nd
rd
rd
rd
rd
39
Result[3][5]
SPL value in the 3 profile
40
Result[3][6]
LEQ value in the 3 profile
41
Result[3][7]
Lden value in the 3 profile
42
Result[3][8]
Ltm3 value in the 3 profile
43
Result[3][9]
Ltm5 value in the 3 profile
44
Result[3][10]
reserved
45
Result[3][11]
reserved
46
UnderRes[3]
underrange value in the 3 profile
…
…
rd
rd
rd
rd
rd
…
Table B.1.10_DM. Main results in DOSE METER mode
Word
number
B-12
Name
Comment
0
0xnn07
[07 = id, nn = block’s length]
1
0x0307
[used_profile, profile’s mask]
G7 USER MANUAL
.
0xmm08
[08 = id, mm = sub-block’s length]
MeasureTime
time of the measurement
5
Result[1][1]
PEAK value in the 1 profile
6
Result[1][2]
reserved
7
maximal value (MAX) in the 1 profile
8
Result[1][3]
Result[1][4]
9
Result[1][5]
SPL value in the 1 profile
10
Result[1][6]
LEQ value in the 1 profile
11
Result[1][7]
Lden value in the 1 profile
12
Result[1][8]
Ltm3 value in the 1 profile
13
Result[1][9]
Ltm5 value in the 1 profile
14
Result[1][10]
LAV value in the 1 profile
15
Result[1][11]
TLAV value in the 1 profile
16
UnderRes[1]
underrange value in the 1 profile
17
0xmm08
[08 = id, mm = sub-block’s length]
OVL
overload time
20
Result[2][1]
PEAK value in the 2 profile
21
Result[2][2]
reserved
22
Result[2][3]
maximal value (MAX) in the 2 profile
23
Result[2][4]
minimal value (MIN) in the 2 profile
2
3..4
18..19
st
st
st
minimal value (MIN) in the 1 profile
st
st
st
st
st
st
st
st
nd
nd
nd
nd
24
Result[2][5]
SPL value in the 2 profile
25
Result[2][6]
LEQ value in the 2 profile
26
Result[2][7]
Lden value in the 2 profile
27
Result[2][8]
Ltm3 value in the 2 profile
28
Result[2][9]
Ltm5 value in the 2 profile
29
Result[2][10]
LAV value in the 2 profile
30
Result[2][11]
TLAV value in the 2 profile
31
UnderRes[2]
underrange value in the 2 profile
32
0xmm08
[08 = id, mm = sub-block’s length]
33..34
Reserved
reserved
35
Result[3][1]
PEAK value in the 3 profile
36
Result[3][2]
reserved
37
Result[3][3]
maximal value (MAX) in the 3 profile
38
Result[3][4]
minimal value (MIN) in the 3 profile
39
Result[3][5]
SPL value in the 3 profile
40
Result[3][6]
LEQ value in the 3 profile
41
Result[3][7]
Lden value in the 3 profile
42
Result[3][8]
Ltm3 value in the 3 profile
43
Result[3][9]
Ltm5 value in the 3 profile
44
Result[3][10]
LAV value in the 3 profile
45
Result[3][11]
TLAV value in the 3 profile
46
UnderRes[3]
underrange value in the 3 profile
…
…
nd
nd
nd
nd
nd
nd
nd
rd
rd
rd
rd
rd
rd
rd
rd
rd
rd
rd
…
B-13
G7 USER MANUAL
.
Table B.1.10_VLM. Main results in the case of VLM mode
Word
number
0
1
Name
Comment
0xnn07
0x0307
[07 = id, nn = block’s length]
[used_profile, profile’s mask]
2
3..4
5
6
7
8
9
10
11
12
13
14
15
16
0xmm08
MeasureTime
Result[1][1]
Result[1][2]
Result[1][3]
Result[1][4]
Result[1][5]
Result[1][6]
Result[1][7]
Result[1][8]
Result[1][9]
Result[1][10]
Result[1][11]
UnderRes[1]
[08 = id, mm = sub-block’s length]
time of the measurement
st
PEAK value in the 1 profile
st
P–P value in the 1 profile
st
maximal value (MAX) in the 1 profile
st
minimal value (MIN) in the 1 profile
st
SPL value in the 1 profile
st
RMS value in the 1 profile
st
VDV value in the 1 profile
reserved
reserved
reserved
reserved
st
underrange value in the 1 profile
17
18..19
20
21
22
23
24
25
26
27
28
29
30
31
0xmm08
OVL
Result[2][1]
Result[2][2]
Result[2][3]
Result[2][4]
Result[2][5]
Result[2][6]
Result[2][7]
Result[2][8]
Result[2][9]
Result[2][10]
Result[2][11]
UnderRes[2]
[08 = id, mm = sub-block’s length]
overload time
nd
PEAK value in the 2 profile
nd
P–P value in the 2 profile
nd
maximal value (MAX) in the 2 profile
nd
minimal value (MIN) in the 2 profile
nd
SPL value in the 2 profile
nd
RMS value in the 2 profile
nd
VDV value in the 2 profile
reserved
reserved
reserved
reserved
nd
underrange value in the 2 profile
32
33..34
35
36
37
38
39
40
41
42
0xmm08
Reserved
Result[3][1]
Result[3][2]
Result[3][3]
Result[3][4]
Result[3][5]
Result[3][6]
Result[3][7]
Result[3][8]
[08 = id, mm = sub-block’s length]
reserved
rd
PEAK value in the 3 profile
rd
P–P value in the 3 profile
rd
maximal value (MAX) in the 3 profile
rd
minimal value (MIN) in the 3 profile
rd
SPL value in the 3 profile
rd
RMS value in the 3 profile
rd
VDV value in the 3 profile
reserved
B-14
G7 USER MANUAL
.
43
44
45
46
…
Result[3][9]
Result[3][10]
Result[3][11]
UnderRes[3]
…
reserved
reserved
reserved
rd
underrange value in the 3 profile
…
Table B.1.11. 1/1 OCTAVE analysis results
Word
number
Name
0
0xnn0E, 0xnn26,
0xnn27
1
0x0101
2
LowestFreq
3
NOct
4
NOctTot
5…20
…
Octave[i]
…
Comment
[block_id, nn=block_length]
0xnnOE - averaged spectrum results,
0xnn26 - min. spectrum results,
0xnn27 - max. spectrum results
[used_profile, profile’s mask]
the lowest 1/1 OCTAVE frequency (*100 Hz):
100 (FULL BAND) or 3150 (AUDIO BAND)
number of 1/1 OCTAVE values:
15 (FULL BAND) or 10 (AUDIO BAND)
number of TOTAL values: 3
1/1 octave[i] value (*10 dB); i=1..NOct+NoctTot (1..16)
…
Table B.1.12. 1/3 OCTAVE analysis results
Word
number
Name
0
0xnn10, 0xnn28,
0xnn29
1
0x0101
2
LowestFreq
3
NTer
4
NTerTot
5...50
…
Tercje[i]
…
Comment
[block_id, nn=block_length]
0xnn10 - averaged spectrum results,
0xnn28 - min. spectrum results,
0xnn29 - max. spectrum results
[used_profile, profile’s mask]
the lowest 1/3 OCTAVE frequency (*100 Hz):
80 (FULL BAND) or 2000 (AUDIO BAND)
number of 1/3 OCTAVE values:
45 (FULL BAND) or 31 (AUDIO BAND)
number of TOTAL values: 3
1/3 octave[i] value (*10 dB); i=1..NTer+NTerTot (1..46)
…
Table B.1.13. Header of the FFT analysis
Word
Name
Comment
B-15
G7 USER MANUAL
number
0
1
2
3
4
.
0xnn11
reserved
LowestFreqNo
NFft
NFftTot
5
FftBand
6
FftWindow
7
FftAverag
8..9
10
11
…
FftSampFreq
FFT_wfactor
reserved
…
[11 = id, nn = block’s length]
reserved
number of the first line in the FFT spectrum
number of lines in the spectrum = 1920
number of TOTAL lines in the spectrum = 1
band of the FFT analysis:
1 - 22.4 kHz
2 - 11.2 kHz
3 - 5.6 kHz
4 - 2.8 kHz
5 - 1.4 kHz
6 - 700 Hz
7 - 350 Hz
8 - 175 Hz
9 - 87.5 Hz
window in the FFT analysis:
0 - HANNING
1 - RECTANGLE
2 - FLAT TOP
3 - KAISER–BESSEL
type of averaging in the FFT analysis:
0 - LINEAR
sampling frequency
…
Table B.1.14. FFT analysis results
Word
number
0
1
2..1922
Name
0x0012
FftBlockLength
FFT[i]
Comment
[12 = id, 0 (block is longer than 256 words, the length is given in
the second word)]
2 + NFft + NFftTot = 2 + 1920 + 1 = 1923
value of the FFT line (*10 dB); i = 1..1921
Table B.1.15. Statistical levels
Word
number
0
1
2
3+i*(pp+1)
Name
0xnn17
0xpprr
N_stat_level
nn[i]
3+i*(pp+1)+
Lnn[i,p]
p
…
B-16
…
Comment
[17 = id, nn = block’s length]
[pp=used_profile, rr=profile’s mask]
number of statistical levels = N
number of the Lnn statistics;
i=0..N-1
value of the Lnn statistics
for profile p (p=1..pp)
…
G7 USER MANUAL
.
Table B.1.16. Header of the statistical analysis in profiles
Word
number
0
1
Name
Comment
0xnn09
0x0703
[09 = id, nn = block’s length]
[03=number of profiles, 07=active profiles mask]
2
3
4
5
0xmm0A
NofClasses[1]
BottomClass[1]
ClassWidth[1]
[0A = id, mm = sub-block’s length]
st
number of classes in the 1 profile (120)
st
bottom class boundary (*10 dB) in the 1 profile
st
class width (*10 dB) in the 1 profile
6
7
8
9
0xmm0A
NofClasses[2]
BottomClass[2]
ClassWidth[2]
[0A = id, mm = sub-block’s length]
nd
number of classes in the 2 profile (120)
nd
bottom class boundary (*10 dB) in the 2 profile
nd
class width (*10 dB) in the 2 profile
10
11
12
13
…
0xmm0A
NofClasses[3]
BottomClass[3]
ClassWidth[3]
…
[0A = id, mm = sub-block’s length]
rd
number of classes in the 3 profile (120)
rd
bottom class boundary (*10 dB) in the 3 profile
rd
class width (*10 dB) in the 3 profile
…
Table B.1.17. Results of the statistical analysis in profiles
Word
number
0
1
2..3
4..5
...
0x010B
Sub-blockLength
Histogram[1][1]
Histogram[1][2]
...
[0B = id, prof_mask#1]
st
2 * number of classes in the 1 profile + 2
st
the first counter in the 1 profile
st
the second counter in the 1 profile
...
0
1
2..3
4..5
...
0x020B
Sub-blockLength
Histogram[2][1]
Histogram[2][2]
...
[0B = id, prof_mask#2]
nd
2 * number of classes in the 2 profile + 2
nd
the first counter in the 2 profile
nd
the second counter in the 2 profile
...
0
1
2..3
4..5
...
0x040B
Sub-blockLength
Histogram[3][1]
Histogram[3][2]
...
[0B = id, prof_mask#3]
rd
2 * number of classes in the 3 profile + 2
rd
the first counter in the 3 profile
rd
the second counter in the 3 profile
...
Name
Comment
B-17
G7 USER MANUAL
.
Table B.1.18. Header of the statistical analysis made in 1/1 OCTAVE or 1/3 OCTAVE mode
Word
number
0
0xnn13
1
NofHist
2
3
4
…
NofClasses
BottomClass
ClassWidth
…
Name
Comment
[13 = id, nn = block’s length]
number of histograms (number of 1/1 OCTAVE (15) or
1/3 OCTAVE (45) filters and TOTAL value (1))
number of classes in the histogram (120)
bottom class boundary (*10 dB)
class width (*10 dB)
…
Table B.1.19. Results of the statistical analysis made in 1/1 OCTAVE or 1/3 OCTAVE mode
Word
number
0
1
2..3
4..5
...
0
Name
0x0114
Sub-blockLength
Histogram[1][1]
Histogram[1][2]
...
0x0214
1
2..3
Sub-blockLength
Histogram[2][1]
4..5
Histogram[2][2]
...
...
...
...
0
1
2..3
4..5
...
0xnn14
Sub-blockLength
Histogram[nn][1]
Histogram[nn][2]
...
Comment
[14 = id, 01 = number of the histogram (1/1 OCTAVE or
1/3 OCTAVE)]
2 * NofClasses + 2 (242)
first counter for the first 1/1 OCTAVE or 1/3 OCTAVE filter
second counter for the first 1/1 OCTAVE or 1/3 OCTAVE filter
...
[14 = id, 02 = number of the histogram (1/1 OCTAVE or
1/3 OCTAVE)]
2 * NofClasses + 2 (242)
first counter for the second 1/1 OCTAVE or 1/3 OCTAVE filter
second counter for the second 1/1 OCTAVE or 1/3 OCTAVE
filter
...
...
[14 = id, nn = NofHist = number of the last histogram
(1/1 OCTAVE or 1/3 OCTAVE)]
2 * NofClasses + 2 (242)
first counter for the last 1/1 OCTAVE or 1/3 OCTAVE filter
second counter for the last 1/1 OCTAVE or 1/3 OCTAVE filter
...
Table B.1.20. RT60 parameters block
Word
number
0
1
B-18
Name
0xnn1A
RT60SaveMode
Comment
[1A = id, nn = block’s length]
type of results in block 1B:
1 - results,
2 - averaged results
G7 USER MANUAL
.
2
RT60Method_p
3
RT60Spectrum
4
5
6
7
8
buff_step_p
ResponseTime_p
Reserved
DispSmooth
NoiseMargin
9
RT60Averaging
10
…
RT60MeasureNo
…
calculation method:
1 - DECAY
2 - IMPULSE
type of spectrum:
1 - 1/1 OCTAVE
2 - 1/3 OCTAVE
logger time step in milliseconds
1..30
reserved
0..15
0..20 (*10dB)
0 - Off,
1 - On
averaging number
…
Table B.1.21. RT60 results block
Word
number
0
1
2
3
4
5
6
0x001B
BlockLength
LowestFreq
NTer
NTotal
N1_rt60_freq
N2_rt60_freq
7+i
calculated[i]
8+i
edt[i]
9+i
rt_20[i]
10+i
rt_30[i]
11+i
rt_user[i]
12+i
cor_edt[i]
13+i
cor_rt_20[i]
14+i
cor_rt_30[i]
15+i
cor_rt_user[i]
…
Name
…
Comment
[1B = id, 00 = block’s length in the second word]
7 + ((N2_rt60_freq-N1_rt60_freq+1)+N_max_total)*9)
the lowest 1/3 OCTAVE frequency (*100 Hz) = 80
i=N1_rt60_freq..N2_rt60_freq;
i=N_tercje.. N_tercje+N_max_total-1
i=N1_rt60_freq..N2_rt60_freq;
i=N_tercje.. N_tercje+N_max_total-1
i=N1_rt60_freq..N2_rt60_freq;
i=N_tercje.. N_tercje+N_max_total-1
i=N1_rt60_freq..N2_rt60_freq;
i=N_tercje.. N_tercje+N_max_total-1
i=N1_rt60_freq..N2_rt60_freq;
i=N_tercje.. N_tercje+N_max_total-1
i=N1_rt60_freq..N2_rt60_freq;
i=N_tercje.. N_tercje+N_max_total-1
i=N1_rt60_freq..N2_rt60_freq;
i=N_tercje.. N_tercje+N_max_total-1
i=N1_rt60_freq..N2_rt60_freq;
i=N_tercje.. N_tercje+N_max_total-1
i=N1_rt60_freq..N2_rt60_freq;
i=N_tercje.. N_tercje+N_max_total-1
…
Table B.1.22. RT60 averaged results block
B-19
G7 USER MANUAL
.
Word
number
0
1
2
3
4
5
6
0x001C
BlockLength
LowestFreq
NTer
NTotal
N1_rt60_freq
N2_rt60_freq
7+i
calculated[i]
8+i
edt[i]
9+i
rt_20[i]
10+i
rt_30[i]
11+i
rt_user[i]
12+i
cor_edt[i]
13+i
cor_rt_20[i]
14+i
cor_rt_30[i]
15+i
cor_rt_user[i]
Name
…
…
Comment
[1C = id, 00 = block’s length in the second word]
7 + ((N2_rt60_freq-N1_rt60_freq+1)+N_max_total)*9)
the lowest 1/3 OCTAVE frequency (*100 Hz) = 80
i=N1_rt60_freq..N2_rt60_freq;
i=N_tercje.. N_tercje+N_max_total-1
i=N1_rt60_freq..N2_rt60_freq;
i=N_tercje.. N_tercje+N_max_total-1
i=N1_rt60_freq..N2_rt60_freq;
i=N_tercje.. N_tercje+N_max_total-1
i=N1_rt60_freq..N2_rt60_freq;
i=N_tercje.. N_tercje+N_max_total-1
i=N1_rt60_freq..N2_rt60_freq;
i=N_tercje.. N_tercje+N_max_total-1
i=N1_rt60_freq..N2_rt60_freq;
i=N_tercje.. N_tercje+N_max_total-1
i=N1_rt60_freq..N2_rt60_freq;
i=N_tercje.. N_tercje+N_max_total-1
i=N1_rt60_freq..N2_rt60_freq;
i=N_tercje.. N_tercje+N_max_total-1
i=N1_rt60_freq..N2_rt60_freq;
i=N_tercje.. N_tercje+N_max_total-1
…
Table B.1.23. RPM results (the presence depends on the RPM_On position)
Word
number
0
1
2
3
4
5
6
…
Name
0xnn1F
f_RpmRes.rpm[0]
f_RpmRes.rpm[1]
F_RpmRes.rpmx[0]
F_RpmRes.rpmx[1]
F_RpmRes.rpmn[0]
F_RpmRes.rpmn[1]
…
Comment
[1F = id, nn = block’s length]
RPM[0]
RPM[1]
RPM Max[0]
RPM Max[1]
RPM Min[0]
RPM Min[1]
…
Table B.1.24. SETUP data
Word number
0
1
2..BlockLength-1
B-20
Name
0x0020
BlockLength
Comment
[20 = id, 00 = block’s length in the second word]
length of the block
SetupData
saved setup values
G7 USER MANUAL
.
Table B.1.25. Header of the file from the logger
Word
number
0
1
2
3
4
5
6..7
8..9
10..11
Name
0xnn0F
BuffTSec
BuffTMilisec
LowestFreq
NOctTer
NOctTerTot
BuffLength
RecsInBuff
RecsInObserv
Comment
[0F = id, nn = header’s length]
logger time step - full seconds part
logger time step - milliseconds part
the lowest 1/1 OCTAVE or 1/3 OCTAVE frequency (*100 Hz)
number of 1/1 OCTAVE or 1/3 OCTAVE results
number of TOTAL values
logger length (bytes)
number of records in the logger
number of records in the observation period equal to:
number of records in the logger + number of records not saved
Note: The current logger time step in seconds can be obtained from the formulae:
T = BuffTSec + BuffTMilisec / 1000.
Table B.1.26. Contents of the file from the logger
Word number
Name
0..(BuffLength/2-1)
Comment
result#1, result#2, ... result#(BuffLength/2-1)
Table B.1.27. File-end-marker
Word
number
0
Name
0xFFFF
Comment
file end marker
B.2. Structure of the file containing results from logger’s file
File header - cf. Tab. B.1.1.
Unit and software specification - cf. Tab. B.1.2.
USER’S text - cf. Tab. B.1.3.
Parameters and global settings - cf. Tab. B.1.4_SLM or Tab. B.1.4_VLM.
MEASUREMENT TRIGGER settings - cf. Tab. B.1.5.
LOGGER TRIGGER settings - cf. Tab. B.1.6.
B-21
G7 USER MANUAL
.
RECORDER TRIGGER settings - cf. Tab. B.1.7.
EXTended I/O settings - cf. Tab. B.1.8.
Special settings for profiles - cf. Tab. B.1.9_SLM or Tab. B.1.9_VLM.
Header of the FFT analysis - cf. Tab. B.1.13.
Header of the file from the logger - cf. Tab. B.1.25.
Contents of the file from the logger - cf. Tab. B.1.26. and the description in B.2.1.
File-end-marker - cf. Tab. B.1.27.
B.2.1 The contents of the files in the logger
The records with the results and (starting from the internal software version 2.30) the records with the
state of the markers as well as the records with the breaks in the results registration are saved in the files
in the logger.
B.2.1.1 Record with the results
The contents of the record with the results depends on the selected device mode, measurement function
and the value set in the LOGGER position of the PROFILE x and SPECTRUM sub-lists. The following
elements can be present (in the given sequence):
(1) results of the measurement from the first profile if the corresponding LOGGER position was active
(paths: MENU / INPUT / PROFILE 1 / LOGGER PEAK; MENU / INPUT / PROFILE 1 /
LOGGER MAX; MENU / INPUT / PROFILE 1 / LOGGER MIN; INPUT / PROFILE 1 /
LOGGER RMS); up to four words are written:
<result1> - PEAK result, depending on the value of BufferP[1] (cf. Tab. B.1.9)
<result2> - MAX result, depending on the value of BufferP[1] (cf. Tab. B.1.9)
<result3> - MIN result, depending on the value of BufferP[1] (cf. Tab. B.1.9)
<result4> - RMS result, depending on the value of BufferP[1] (cf. Tab. B.1.9)
(2) results of the measurement from the second profile if the corresponding LOGGER position was
active (paths: MENU / INPUT / PROFILE 2 / LOGGER PEAK; MENU / INPUT / PROFILE 2 /
LOGGER MAX; MENU / INPUT / PROFILE 2 / LOGGER MIN; INPUT / PROFILE 2 /
LOGGER RMS); up to four words are written:
<result1> - PEAK result, depending on the value of BufferP[2] (cf. Tab. B.1.9)
<result2> - MAX result, depending on the value of BufferP[2] (cf. Tab. B.1.9)
<result3> - MIN result, depending on the value of BufferP[2] (cf. Tab. B.1.9)
<result4> - RMS result, depending on the value of BufferP[2] (cf. Tab. B.1.9)
(3) results of the measurement from the third profile if the corresponding LOGGER position was active
(paths: MENU / INPUT / PROFILE 3 / LOGGER PEAK; MENU / INPUT / PROFILE 3 /
LOGGER MAX; MENU / INPUT / PROFILE 3 / LOGGER MIN; INPUT / PROFILE 3 /
LOGGER RMS); up to four words are written:
<result1> - PEAK result, depending on the value of BufferP[3] (cf. Tab. B.1.9)
<result2> - MAX result, depending on the value of BufferP[3] (cf. Tab. B.1.9)
<result3> - MIN result, depending on the value of BufferP[3] (cf. Tab. B.1.9)
<result4> - RMS result, depending on the value of BufferP[3] (cf. Tab. B.1.9)
(4) results of 1/1 OCTAVE analysis if 1/1 OCTAVE analysis was selected as the measurement function
and the LOGGER position of the SPECTRUM sub-list was activated (path: MENU / INPUT /
SPECTRUM / LOGGER: [√]); the sequence of words is written:
<flags> <Octave[1]> <Octave[2]> ... <Octave[NOct+NOctTot]>
where:
flags = 1- the overload detected, 0 - the overload not detected
Octave[i] - the result of 1/1 OCTAVE analysis (*10 dB); i = 1..NOct+NOctTot (1..16)
(5) results of 1/3 OCTAVE analysis if 1/3 OCTAVE analysis was selected as the measurement function
and the LOGGER position of the SPECTRUM sub-list was activated (path: MENU / INPUT /
SPECTRUM / LOGGER: [√]); the sequence of words is written:
<flags> <Terave[1]> <Terave [2]> ... <Terave[NT]>
B-22
G7 USER MANUAL
.
where:
flags = 1- the overload detected, 0 - the overload not detected
Terave[i] - the result of 1/3 OCTAVE analysis (*10 dB); i = 1..NT (1..46 or 1..31)
The value of NT parameter depends on the LOGGER STEP selection (path: MENU / INPUT /
MEASUREMENT SETUP / LOGGER STEP). For the logger steps greater than 2 ms the value of
NT is equal to NTer+NTerTot: the outputs from all 1/3 OCTAVE filters from 0.8 Hz up to 20 kHz and
the TOTAL value are written (45 + 1 = 46). For the logger step equal to 2 ms the value of NT is
equal to 31: the outputs from 1/3 OCTAVE filters from 25 Hz up to 20 kHz and the TOTAL values
are written (30 + 1 = 31).
(6) RPM result if the corresponding LOGGER position was active (path: MENU / INPUT / RPM / RPM)
written as two words:
<word1><word2>
WYK_OKR_OBR = 64
m = ((res[1] & 0x00007f)<<16) | ((res[0] & 0x007fff)<<1)
w = ((res[1]>>8) & 0x00007f)-23-WYK_OKR_OBR
d=m*pow(2.0,w)
RPS = 1/d
RPM = 60/d
B.2.1.2 Record with the state of the markers
The record with the state of the markers consists of one word:
<0x8nnn>
in which 12 bits nnn denote the state of the markers:
b11 = state of #12 marker
b10 = state of #11 marker
...
b1 = state of #2 marker
b0 = state of #1 marker
B.2.1.3 Record with the breaks in the results registration
The record with the breaks in the results registration consists of four words:
<0xB0ii> <0xB1jj> <0xB2kk> <0xB3nn>
in which ii, jj, kk, nn bytes denote 4-bytes counter of left or skipped records: nnkkjjii (ii is the least
significant byte, nn – the most significant byte).
B.3. Structure of the file with the results from the SLM mode
File header - cf. Tab. B.1.1.
Unit and software specification - cf. Tab. B.1.2.
USER’S text - cf. Tab. B.1.3.
Parameters and global settings - cf. Tab. B.1.4_SLM or Tab. B.1.4_VLM.
MEASUREMENT TRIGGER settings - cf. Tab. B.1.5.
LOGGER TRIGGER settings - cf. Tab. B.1.6.
RECORDER TRIGGER settings - cf. Tab. B.1.7.
EXTended I/O settings - cf. Tab. B.1.8.
Special settings for profiles - cf. Tab. B.1.9_SLM.
Main results - cf. Tab. B.1.10_SLM.
Statistical levels - cf. Tab. B.1.15.
Header of the statistical analysis in profiles (the presence depends on the SAVE STAT. position) - cf. Tab.
B.1.16.
B-23
G7 USER MANUAL
.
Results of the statistical analysis in profiles (the presence depends on the SAVE STAT. position) - cf. Tab.
B.1.17.
File-end-marker - cf. Tab. B.1.27.
B.4. Structure of the file with the results from the VLM mode
File header - cf. Tab. B.1.1.
Unit and software specification - cf. Tab. B.1.2.
USER’S text - cf. Tab. B.1.3.
Parameters and global settings - cf. Tab. B.1.4_SLM or Tab. B.1.4_VLM.
MEASUREMENT TRIGGER settings - cf. Tab. B.1.5.
LOGGER TRIGGER settings - cf. Tab. B.1.6.
RECORDER TRIGGER settings - cf. Tab. B.1.7.
EXTended I/O settings - cf. Tab. B.1.8.
Special settings for profiles - cf. Tab. B.1.9_VLM.
Main results - cf. Tab. B.1.10_VLM.
RPM results - cf. Tab. B.1.23. (the presence depends on the RPM_On flag).
File-end-marker - cf. Tab. B.1.27.
B.5. Structure of the file with the results from the DOSE METER mode
File header - cf. Tab. B.1.1.
Unit and software specification - cf. Tab. B.1.2.
USER’S text - cf. Tab. B.1.3.
Parameters and global settings - cf. Tab. B.1.4_SLM or Tab. B.1.4_VLM.
MEASUREMENT TRIGGER settings - cf. Tab. B.1.5.
LOGGER TRIGGER settings - cf. Tab. B.1.6.
RECORDER TRIGGER settings - cf. Tab. B.1.7.
EXTended I/O settings - cf. Tab. B.1.8.
Special settings for profiles - cf. Tab. B.1.9.
Main results - cf. Tab. B.1.10_DM.
Statistical levels - cf. Tab. B.1.15.
Header of the statistical analysis (the presence depends on the SAVE STAT. position) - cf. Tab. B.1.16.
Results of the statistical analysis (the presence depends on the SAVE STAT. position) - cf. Tab. B.1.17.
File-end-marker - cf. Tab. B.1.27.
B.6. Structure of the file with 1/1 OCTAVE analysis results
File header - cf. Tab. B.1.1.
Unit and software specification - cf. Tab. B.1.2.
USER’S text - cf. Tab. B.1.3.
Parameters and global settings - cf. Tab. B.1.4_SLM or Tab. B.1.4_VLM.
MEASUREMENT TRIGGER settings - cf. Tab. B.1.5.
LOGGER TRIGGER settings - cf. Tab. B.1.6.
RECORDER TRIGGER settings - cf. Tab. B.1.7.
EXTended I/O settings - cf. Tab. B.1.8.
Special settings for profiles - cf. Tab. B.1.9_SLM or Tab. B.1.9_VLM.
Main results - cf. Tab. B.1.10_SLM or Tab. B.1.10_VLM.
Statistical levels - cf. Tab. B.1.15.
RPM results - cf. Tab. B.1.23. (VLM only - the presence depends on the RPM_On flag).
1/1 OCTAVE analysis results - cf. Tab. B.1.11.
1/1 OCTAVE analysis MIN-results (the presence depends on the MIN SPECT. position) cf. Tab. B.1.11.
B-24
G7 USER MANUAL
.
1/1 OCTAVE analysis MAX-results (the presence depends on the MAX SPECT. position) cf. Tab. B.1.11.
Header of the statistical analysis (the presence depends on the SAVE STAT. position) - cf. Tab. B.1.16.
Results of the statistical analysis (the presence depends on the SAVE STAT. position) - cf. Tab. B.1.17.
Header of the statistical analysis performed in 1/1 OCTAVE mode (SLM only - the presence depends on
the SAVE STAT. position) - cf. Tab. B.1.18.
Results of the statistical analysis performed in 1/1 OCTAVE mode (SLM only - the presence depends on
the SAVE STAT. position) - cf. Tab. B.1.19.
File-end-marker - cf. Tab. B.1.27.
B.7. Structure of the file with 1/3 OCTAVE analysis results
File header - cf. Tab. B.1.1.
Unit and software specification - cf. Tab. B.1.2.
USER’S text - cf. Tab. B.1.3.
Parameters and global settings - cf. Tab. B.1.4_SLM or Tab. B.1.4_VLM.
MEASUREMENT TRIGGER settings - cf. Tab. B.1.5.
LOGGER TRIGGER settings - cf. Tab. B.1.6.
RECORDER TRIGGER settings - cf. Tab. B.1.7.
EXTended I/O settings - cf. Tab. B.1.8.
Special settings for profiles - cf. Tab. B.1.9_SLM or Tab. B.1.9_VLM.
Main results - cf. Tab. B.1.10_SLM or Tab. B.1.10_VLM.
Statistical levels - cf. Tab. B.1.15.
RPM results - cf. Tab. B.1.23. (VLM only - the presence depends on the RPM_On flag).
1/1 OCTAVE analysis results - cf. Tab. B.1.11.
1/1 OCTAVE analysis MIN-results (the presence depends on the MIN SPECT. position) cf. Tab. B.1.11.
1/1 OCTAVE analysis MAX-results (the presence depends on the MAX SPECT. position) cf. Tab. B.1.11.
Header of the statistical analysis (the presence depends on the SAVE STAT. position) - cf. Tab. B.1.16.
Results of the statistical analysis (the presence depends on the SAVE STAT. position) - cf. Tab. B.1.17.
Header of the statistical analysis performed in 1/3 OCTAVE mode (SLM only - the presence depends on
the SAVE STAT. position) - cf. Tab. B.1.18.
Results of the statistical analysis performed in 1/3 OCTAVE mode (SLM only - the presence depends on
the SAVE STAT. position) - cf. Tab. B.1.19.
File-end-marker - cf. Tab. B.1.27.
B.8. Structure of the file with the FFT analysis results
File header - cf. Tab. B.1.1.
Unit and software specification - cf. Tab. B.1.2.
USER’S text - cf. Tab. B.1.3.
Parameters and global settings - cf. Tab. B.1.4_SLM or Tab. B.1.4_VLM.
MEASUREMENT TRIGGER settings - cf. Tab. B.1.5.
LOGGER TRIGGER settings - cf. Tab. B.1.6.
RECORDER TRIGGER settings - cf. Tab. B.1.7.
EXTended I/O settings - cf. Tab. B.1.8.
Special settings for profiles - cf. Tab. B.1.9_SLM or Tab. B.1.9_VLM.
Main results - cf. Tab. B.1.10_SLM or Tab. B.1.10_VLM.
Statistical levels - cf. Tab. B.1.15.
RPM results - cf. Tab. B.1.23. (VLM only - the presence depends on the RPM_On flag).
Header of the FFT analysis - cf. Tab. B.1.13.
FFT analysis results - cf. Tab. B.1.14.
Header of the statistical analysis (the presence depends on the SAVE STAT. position) - cf. Tab. B.1.16.
Results of the statistical analysis (the presence depends on the SAVE STAT. position) - cf. Tab. B.1.17.
File-end-marker - cf. Tab. B.1.27.
B-25
G7 USER MANUAL
B.9. Structure of the file containing RT60 functions results
File header - cf. Tab. B.1.1.
Unit and software specification - cf. Tab. B.1.2.
USER’S text - cf. Tab. B.1.3.
Parameters and global settings - cf. Tab. B.1.4_SLM or Tab. B.1.4_VLM.
MEASUREMENT TRIGGER settings - cf. Tab. B.1.5.
LOGGER TRIGGER settings - cf. Tab. B.1.6.
RECORDER TRIGGER settings - cf. Tab. B.1.7.
EXTended I/O settings - cf. Tab. B.1.8.
Special settings for profiles - cf. Tab. B.1.9_SLM.
Main results - cf. Tab. B.1.10_SLM.
Statistical levels - cf. Tab. B.1.15.
RT60 parameters block - cf. Tab. B.1.20.
RT60 results - cf. Tab. B.1.21. or RT60 averaged results - cf. Tab. B.1.22.
File-end-marker - cf. Tab. B.1.27.
B.10.
Structure of the SETUP file
File header - cf. Tab. B.1.1.
Unit and software specification - cf. Tab. B.1.2.
SETUP data - cf. Tab. B.1.24
File-end-marker - cf. Tab. B.1.27.
B.11.
DATE and TIME
Following function written in C explains how the date and time are coded:
void ExtractDateTime(int date, int time, int dt[])
{
int sec,year;
sec =
dt[0]
dt[1]
dt[2]
((0xffff&time)<<1); /* time<<1; */
= sec%60; /* sec */
= (sec/60)%60; /* min */
= sec/3600; /* hour */
dt[3] = date&0x1F; /* day */
dt[4] = (date>>5)&0x0F; /* month */
year = (date>>9) & 0x07F;
dt[5] = year+2000; /* year */
}
B-26
.
G7 USER MANUAL
C. DATA SPECIFICATIONS
C.1. Specification of G7 as sound level meter
The G7 instrument working as the SLM meets requirements of the IEC 61672-1 for Type 1 instruments.
System configuration:
• G7 sound analyser
• SV 12L microphone preamplifier
• ACO 7052H measuring prepolarised free-field microphone (1/2", nominal sensitivity 22 mV / Pa,
polarisation 0 V)
• SV 30A acoustic calibrator (or equivalent e.g. B&K 4231)
Accessories included:
SV 12L
SC 16
SC 35
Microphone preamplifier
USB 1.1 cable
Cinch (plug) to BNC (plug) cable (2 m)
Accessories available:
SC 26
SA 17A
SA 22
Extension cable TNC (plug) to TNC (socket) (3 m)
External battery pack
Windscreen
Measured quantities
The measured quantities for SLM mode are: PEAK, SPL, MAX, MIN, LEQ, RMS, SEL, Ltm3, Ltm5,
LEPd, OVL, Lnn and additionally, the measured quantities for DOSE METER mode are: DOSE, D8_h,
LAV, TLAV, SEL8, PSEL, E, E_8h. The definitions for mentioned parameters are given in Appendix D.
Additional functions:
Overload: See chapter 3 or Appendix A.
Under-range: See Appendix A.
Battery state indication: See chapter 3.
Conformance testing
This chapter contains the information needed to conduct conformance testing according to the
IEC 616772 standard.
Mounting for acoustical tests
The microphone ACO 7052H and preamplifier SV 12L can be connected to the instrument in two different
ways:
• directly attached on meter
• with microphone preamplifier holder connected with SLM with the SC 26 extension cable
Electrical substitute for microphones
To obtain a BNC type electrical input, a microphone must be replaced by electrical microphone
impedance and cartridge capacitance 18 pF.
Notice: For all electrical tests the microphone compensation filter must be set to OFF!
(path: MENU / SETUP / COMPENSATION FILTER / OFF).
C-1
G7 USER MANUAL
_
Notice: For all free field tests the FREE FIELD filter must be set to ON! (path: MENU /
SETUP / COMPENSATION FILTER / FREE FIELD).
Measuring ranges:
“LOW” and "HIGH"
Linear operating ranges for the LEQ values
The starting point at which user shall begin tests of level linearity is 94.0 dB for the frequencies specifies
below.
Table C.1. Linear operating ranges for LEQ value (1 kHz sinusoidal signal, different weighting filters)
RANGE
Linear operating range (with the error < 0.7 dB)
(LEQ for the sinusoidal signal and microphone sensitivity 22 mV/Pa)
LOW
from 25 dB “A” - weighting
to 120 dB “A” - weighting
LOW
from 25 dB “C” - weighting
to 120 dB “C” - weighting
LOW
from 33 dB “Z” - weighting
to 120 dB “Z” - weighting
HIGH
from 36 dB “A” - weighting
to 137 dB “A” - weighting
HIGH
from 36 dB “C” - weighting
to 137 dB “C” - weighting
HIGH
from 46 dB “Z” - weighting
to 137 dB “Z” - weighting
Table C.2. Linear operating ranges for LEQ value (31.5 Hz sinusoidal signal, different weighting filters)
RANGE
Linear operating range for frequency 31.5 Hz
(LEQ for the sinusoidal signal and
nominal microphone sensitivity 22 mV/Pa)
LOW
from 25 dB “A”- weighting
to 75.6 dB “A”- weighting
HIGH
from 36 dB “A”- weighting
to 98.6 dB “A”- weighting
Table C.3. Linear operating ranges for LEQ value (4 kHz sinusoidal signal, different weighting filters)
RANGE
Linear operating range for frequency 4 kHz
(LEQ for the sinusoidal signal and
nominal microphone sensitivity 22 mV/Pa)
LOW
from 25 dB “A”- weighting
to 116 dB “A”- weighting
HIGH
from 36 dB “A”- weighting
to 139 dB “A”- weighting
Table C.5. Linear operating ranges for LEQ value (8 kHz sinusoidal signal, different weighting filters)
RANGE
C-2
Linear operating range for frequency 8 kHz
(LEQ for the sinusoidal signal and
nominal microphone sensitivity 22 mV/Pa)
LOW
from 25 dB “A”- weighting
to 113.9 dB “A”- weighting
HIGH
from 36 dB “A”- weighting
to 136.9 dB “A”- weighting
G7 USER MANUAL
Table C.5. Linear operating ranges for LEQ value (12.5 kHz sinusoidal signal, different weighting filters)
Linear operating range for frequency 12.5 kHz
(LEQ for the sinusoidal signal and
nominal microphone sensitivity 22 mV/Pa)
RANGE
LOW
from 25 dB “A”- weighting
to 110.7 dB “A”- weighting
HIGH
from 36 dB “A”- weighting
to 133.7 dB “A”- weighting
Measuring range for the Peak value:
Table C.6. Linear operating ranges for PEAK value (1 kHz sinusoidal signal, different weighting filters)
Linear operating range PEAK
(for the microphone sensitivity 22 mV/Pa)
RANGE
Max Peak value
LOW
123 dB “A” - weighting
LOW
123 dB “C” - weighting
LOW
123 dB “Z” - weighting
HIGH
140 dB “A” - weighting
HIGH
140 dB “C” - weighting
HIGH
140 dB “Z” - weighting
Notice: For the signals with the crest factor n >1.41 upper measuring range of the RMS
(LEQ and SPL) is reduced. The valid upper limit can be calculated according to the below given formula:
(
)
An = 137 − 20 log n 2 , where A is the upper limit for the sinusoidal signal
Example: For the crest factor n = 10 the upper limit is A10 = 120 dB
Measuring frequency range of the acoustic pressure (-3 dB):
10 Hz ÷ 20 000 Hz
Basic measurement error of the acoustic pressure:
< 0.7 dB (measured for reference
conditions, see below).
Weighting filters (see appendix D):
• Z meeting requirements of the IEC 61672-1 standard for the Type 1 “Z“ filter
• A meeting requirements of the IEC 651 and IEC 61672-1 standard for the Type 1 “A” filter
• C meeting requirements of the IEC 651 and IEC 61672-1 standard for the Type 1 “C” filter
Special filter:
• Diffuse field compensation filter
filter changing the complete instrument acoustic
frequency response in the diffuse acoustic field.
Self-generated noise
(measured with the microphone equivalent impedance 18 pF)
• ”Z” weighting
< 11 µVRMS
• ”A” weighting
< 6 µVRMS
C-3
G7 USER MANUAL
_
• ”C” weighting
< 6 µVRMS
RMS detector:
•
Digital
“True RMS“ with Peak detection
•
Resolution
0.1 dB
•
Range
999.9 dB
•
Crest Factor
unlimited (for signals in 20 kHz band)
Time weighting characteristics (Exponential averaging)
SLOW:
FAST:
IMPULSE:
“S“ according to IEC 61672 Type 1, Equivalent Time Constant 1000 ms
“F” according to IEC 61672 Type 1, Equivalent Time Constant 250 ms
“I” according to IEC 61672 Type 1, Equivalent Time Constant 35 ms, Hold Time 1500 s
Reference conditions:
• Type of the acoustic field
free
• Reference acoustic pressure:
114.0 dB (related to 20 µPa)
• Reference frequency:
1000 Hz
• Reference temperature:
+20°C
• Reference relative humidity:
65 %
• Reference static pressure:
1013 hPa
• Reference incidence direction:
perpendicular to the microphone diaphragm
Calibration:
Acoustical - with the SV 30A acoustic calibrator (or equivalent)
Reference level for free field calibration
113.9 dB
Reference level for diffuse field calibration 114.0 dB
(See ACO 7052H free field correction table below)
Microphone
ACO 7052H
type: prepolarised free-field ½” condenser microphone
nominal sensitivity: 22 mV/Pa (corresponding to -33 dBV/Pa re 1 V/Pa)
capacitance: 18 pF
preamplifier SV 12L
nominal preamplifier attenuation: 0.7 dB
Maximum level of sound pressure level, which can affect the microphone without its destruction:
155 dB.
Maximum peak voltage of input sinusoidal signal, which can be applied to the SLM without its
destruction: 30 V Peak–Peak.
Environmental, electrostatic and radio frequency criteria:
Warm-up time:
C-4
1 min. (for 0.1 dB accuracy)
G7 USER MANUAL
Typical stabilisation time after change in environmental conditions is 1 minute.
Typical stabilisation time after change the temperature in environmental conditions by 20°C is 1 hour.
Notice: When the instruments are moved from a warm environment with high humidity,
to a colder environment, care should be taken not to produce condensation inside
the instruments. In this case, much longer stabilization periods may be necessary.
Effect of humidity:
< 0.5 dB (for 30%<RH<90% at 40°C and 1000 Hz)
Effect of magnetic filed:
< 15 dB (A) or < 25 dB (Z) (for 80 A/m and 50 Hz)
Effect of radio frequency fields:
– meet requirements of IEC 61672-1
The greatest susceptibility (the least immunity) is achieved when in the SLM the Z weighting filter and
FAST time weighting are selected and the SPL measurements are considered.
The greatest susceptibility is achieved when the SLM is placed parallel to the radio frequency field.
In addition, if there is an extension cable, the greatest susceptibility is achieved when the SLM and cable
is placed along field and the cable is coiled as solenoid.
Effect of electrostatic discharge:
– meet requirements of IEC 61672-1
The electrostatic discharge may temporarily affect on the measurement results. The influence disappears
immediately in the absence of exposure to the electrostatic discharges. The changes in instrument’s
operation state or its configuration and any corruption of stored data were not observed.
Effect of ambient pressure:
< 0.01 dB/kPa
Effect of temperature:
< 0.5 dB (from -10°C to + 50°C)
Operating range – from -10°C to + 50°C
Storage – from -20°C to + 60°C
Effect of Vibration:
< 72 dB (from 20 Hz to 1000 Hz at 1 m/s )
2
Microphone type ACO 7052H and the preamplifier type SV 12L on the SLM are mounted on the shaker.
Vibration is applied in a direction perpendicular or parallel to the plane of the microphone diaphragm.
C-5
G7 USER MANUAL
_
Effect of mechanical vibration perpendicular to the plane
of the microphone diaphragm
80,00
70,00
60,00
[dB]
50,00
40,00
30,00
20,00
10,00
0,00
15,6
31,25
62,5
125
250
500
1000
2000
Freq [Hz]
Effect of mechanical vibration perpendicular to the plane of microphone diaphragm
Table C.7. Typical effect of vibration perpendicular to the plane of microphone diaphragm
f (Hz)
15.6
Typical effect of vibration
66.13
[dB]
31.25
62.5
125
250
500
1000
2000
66.36
67.03
64.55
67.46
71.66
57.59
61.58
Effect of mechanical vibration parallel to the plane of the microphone
diaphragm
70,00
60,00
[dB]
50,00
40,00
30,00
20,00
10,00
0,00
15,6
31,25
62,5
125
250
500
1000
2000
Freq [Hz]
Effect of mechanical vibration parallel to the plane of microphone diaphragm
Table C.9. Typical effect of vibration parallel to the plane of microphone diaphragm
f (Hz)
Typical effect of vibration
[dB]
C-6
15.6
31.25
62.5
125
250
500
1000
2000
48.99
54.98
57.19
54.25
52.11
54.89
59.60
57.07
G7 USER MANUAL
Effect of accessories:
-0,5
19027
16951
15102
13454
11986
10679
9514
8476
7127
5657
4490
3564
2828
2245
1587
1000
630
397
-2,5
250
-1,5
[dB]
0,5
1,5
Effect of the SA 22 windscreen
f [Hz]
SA 22 Free Field Characteristics
Table C.10. Effect of the SA 22 windscreen
Frequency [Hz]
250
315
400
500
630
800
1000
1250
1600
2000
Effect of the SA 22
windscreen [dB]
0.06
0.06
0.08
0.10
0.08
0.16
0.20
0.30
0.35
0.43
Frequency [Hz]
2500
3150
4000
5000
6300
8000
10000
12500
16000
20000
Effect of the SA 22
windscreen [dB]
0.45
0.41
0.12
-0.10
0.02
-0.18
-0.20
-0.77
-0.73
-1.48
Table C.11. ACO 7052H microphone’s pressure free field correction coefficients for the 0 deg
incidence
Freq.
units
20
Hz
25
Hz
31.5
Hz
40
Hz
50
Hz
63
Hz
80
Hz
100
Hz
125
Hz
160
Hz
200
Hz
250
Hz
315
Hz
400
Hz
500
Hz
630
Hz
0 deg
[dB]
0.00
0.00
0.00
0.00
0.00
0.00
0.00
0.00
0.00
0.00
0.00
0.00 -0.01 0.01
0.01
0.04
Freq.
units
800
Hz
1.0
kHz
1.25
kHz
1.6
kHz
2.0
kHz
2.5
kHz
3.15
kHz
4.0
kHz
5.0
kHz
6.3
kHz
8.0
kHz
10.0
kHz
12.5
Hz
16.0
kHz
20.0
kHz
0 deg
[dB]
0.08
0.08
0.12
0.19
0.33
0.62
0.79
1.27
2.06
2.99
4.01
3.82
6.81
9.22
10.9
0
C-7
G7 USER MANUAL
_
Diffuse field compensation filter
Diffuse field filter implemented in G7 instrument
Effect of an Extension cable length 3 and 10 meters
Table C.12. Typical effect of vibration perpendicular to the plane of microphone diaphragm
Attenuation [dB] for
Input voltage 1 VRMS
f [Hz]
10
12.5
16
20
25
31.5
40
50
63
80
100
125
160
200
250
315
400
500
630
800
1000
1250
1600
2000
C-8
Input voltage 4 VRMS
with
with
with
with
with SV 12L
with SV 12L
preamplifier SC 26 / 3 m SC 26 / 10 m preamplifier SC 26 / 3 m SC 26 / 10 m
3.1
2.2
1.5
1.0
0.7
0.5
0.3
0.2
0.1
0.1
0.1
0.1
0.0
0.0
0.0
0.0
0.0
0.0
0.0
0.0
0.0
0.0
0.0
0.0
3.1
2.2
1.6
1.0
0.7
0.4
0.3
0.2
0.1
0.1
0.1
0.0
0.0
0.0
0.0
0.0
0.0
0.0
0.0
0.0
0.0
0.0
0.0
0.0
3.1
2.2
1.5
1.1
0.7
0.5
0.3
0.2
0.1
0.1
0.1
0.0
0.0
0.0
0.0
0.0
0.0
0.0
0.0
0.0
0.0
0.0
0.0
0.0
3.2
2.2
1.5
1.0
0.6
0.4
0.3
0.2
0.1
0.1
0.0
0.0
0.0
0.0
0.0
0.0
0.0
0.0
0.0
0.0
0.0
0.0
0.0
0.0
3.2
2.2
1.5
1.0
0.6
0.4
0.2
0.1
0.1
0.0
0.0
0.0
0.0
0.0
0.0
0.0
0.0
0.0
0.0
0.0
0.0
0.0
0.0
0.0
3.2
2.2
1.5
1.0
0.6
0.4
0.2
0.1
0.1
0.0
0.0
0.0
0.0
0.0
0.0
0.0
0.0
0.0
0.0
0.0
0.0
0.0
0.0
0.0
G7 USER MANUAL
2500
3150
4000
5000
6300
8000
10000
12500
16000
20000
0.0
0.0
0.0
0.0
0.0
0.0
0.0
0.0
0.0
0.1
0.0
0.0
0.0
0.0
0.0
0.0
0.0
0.0
0.0
0.1
0.0
0.0
0.0
0.0
0.0
0.0
0.0
0.0
0.0
0.1
0.0
0.0
0.0
0.0
0.0
0.0
0.1
0.0
0.0
0.1
0.0
0.0
0.0
0.0
0.0
0.0
0.0
0.0
0.0
0.1
0.0
0.0
0.0
0.0
0.0
0.0
0.0
0.0
0.0
0.1
16
00
0
10
00
0
63
00
40
00
25
00
16
00
10
00
63
0
40
0
25
0
16
0
10
0
63
40
25
10
16
f [Hz]
0,0
0,5
A [dB]
1,0
1,5
2,0
2,5
3,0
3,5
with preamplifier
SC26 3m
SC26 10m
Effect of extension cable for the measurements with Z filter for Uin=1VRMS
Free Field frequency response
Effect of reflections and diffraction from the case of the SLM
Srednia
dla
obudowy
1,50
Case Effect Algorith 03
Microphone 7052H response
Algorithm 03 with SA22
Algorithm 03 with Case Comp Filter
Algorithm 03 free field response
1,00
0,50
0,00
100,0
160,0
250,0
400,0
630,0
1000,0 1600,0 2240,0 2820,0 3550,0 4470,0 5600,0 7100,0 8400,0 9400,0 10600,011900,016000,0
-0,50
-1,00
-1,50
-2,00
Typical free field frequency response of G7 instrument
C-9
G7 USER MANUAL
_
Table C.13. Effect of reflections and diffraction from the case of the SLM
f [Hz]
G7 frequency
response (typical)
100.0
125.0
160.0
200.0
250.0
315.0
400.0
500.0
630.0
800.0
1000.0
1250.0
1600.0
2000.0
2240.0
2500.0
2820.0
3150.0
3550.0
4000.0
4470.0
5000.0
5600.0
6300.0
7100.0
8000.0
8400.0
8900.0
9400.0
10000.0
10600.0
11200.0
11900.0
12500.0
16000.0
20000.0
0.0
0.0
0.0
0.0
0.0
0.1
0.1
0.0
-0.2
-0.1
0.4
0.3
-0.9
0.0
0.4
0.1
0.2
-0.1
-0.1
0.7
0.5
0.7
0.4
0.8
0.9
1.0
-0.6
-0.1
-0.2
-0.3
-0.5
0.1
-0.1
0.0
0.3
-0.9
C-10
Microphone 7052H
free field response
(typical)
0.00
0.00
0.00
0.00
0.00
0.00
0.00
0.00
0.00
0.00
-0.05
0.00
0.00
0.00
0.03
0.05
0.08
0.10
0.10
0.10
0.13
0.15
0.25
0.35
0.18
0.00
-0.25
-0.50
-0.75
-1.00
-0.83
-0.65
-0.30
-0.05
0.15
-1.05
G7 case effect
G7 with SA 22 frequency
response (typical)
0.00
0.00
0.00
0.00
0.00
0.10
0.09
-0.02
-0.23
-0.05
0.48
0.29
-0.88
0.03
0.35
0.04
0.12
-0.23
-0.17
0.57
0.35
0.51
0.17
0.50
0.70
1.00
-0.38
0.44
0.57
0.72
0.35
0.80
0.19
0.10
0.18
0.12
0.00
0.00
0.00
0.00
0.10
0.20
0.20
0.10
-0.10
0.20
0.70
0.60
-0.50
0.50
0.80
0.60
0.60
0.20
0.20
0.80
0.60
0.70
0.50
0.80
0.80
0.90
-0.70
-0.20
-0.40
-0.50
-0.70
-0.10
-0.40
-0.30
-0.40
-1.80
G7 USER MANUAL
Algorithm 03 Case Effect
Compensation Filter
Compensated Case Effect
1,50
1,00
0,50
16000
11900
10600
9400
8400
7100
5600
4470
3550
2820
2240
1600
1000
630
400
250
160
100
0,00
-0,50
-1,00
-1,50
Typical case effect of G7 instrument and compensation filters characteristics
See “Case effect” and results after “Case compensation” on the Figure and the Table below.
Table C.14. The effect of the windscreen and case effect of G7
Case compensation Case effect after
filter [dB]
compensation [dB]
f [Hz]
Case effect [dB]
100.0
0.00
-0.059532018
-0.06
125.0
0.00
-0.064265446
-0.06
160.0
0.00
-0.071586079
-0.07
200.0
0.00
-0.078788819
-0.08
250.0
0.00
-0.082444783
-0.08
315.0
0.10
-0.072904441
0.03
400.0
0.09
-0.033811826
0.06
500.0
-0.02
0.042657203
0.02
630.0
-0.23
0.119792113
-0.11
800.0
-0.05
-0.004424002
-0.05
1000.0
0.48
-0.445074651
0.03
1250.0
0.29
-0.459474889
-0.17
1600.0
-0.88
0.803966206
-0.08
2000.0
0.03
-0.013049722
0.02
2240.0
0.35
-0.444071285
-0.10
2500.0
0.04
-0.021245411
0.02
C-11
G7 USER MANUAL
_
2820.0
0.12
-0.112923794
0.00
3150.0
-0.23
0.043943765
-0.19
3550.0
-0.17
0.322327216
0.15
4000.0
0.57
-0.512218726
0.06
4470.0
0.35
-0.375648693
-0.03
5000.0
0.51
-0.269436004
0.24
5600.0
0.17
-0.0301991
0.14
6300.0
0.50
-0.290948905
0.21
7100.0
0.70
-0.649880548
0.06
8000.0
1.00
-0.909905836
0.09
8400.0
-0.38
0.434172102
0.05
8900.0
0.44
-0.393991273
0.05
9400.0
0.57
-0.756209137
-0.19
10000.0
0.72
-0.59554601
0.12
10600.0
0.35
-0.050889768
0.30
11200.0
0.80
-0.681313089
0.12
11900.0
0.19
-0.171463618
0.02
12500.0
0.10
-0.179992382
-0.08
16000.0
0.18
-0.086878998
0.09
20000.0
0.12
0.203881982
0.32
Directional characteristics
C-12
315 Hz
250 Hz
Directional response for SLM Type G7 with microphone type ACO 7052H and preamplifier type SV 12L
for specified frequencies are presented below. The round charts show the directional characteristic and
the charts below shows the errors and tolerance limits for particular angle.
400 Hz
500 Hz
630 Hz
800 Hz
G7 USER MANUAL
C-13
C-14
1600 Hz
2000 Hz
2240 Hz
2500 Hz
1250 Hz
1000 Hz
G7 USER MANUAL
_
2800 Hz
3150 Hz
3550 Hz
4000 Hz
G7 USER MANUAL
C-15
C-16
5600 Hz
6300 Hz
7100 Hz
8000 Hz
5000 Hz
4500 Hz
G7 USER MANUAL
_
8500 Hz
9000 Hz
9500 Hz
10000 Hz
G7 USER MANUAL
C-17
11200 Hz
_
12500 Hz
11800 Hz
10600 Hz
G7 USER MANUAL
G7 directional response with ACO 7052H and SV 12L for given frequencies
C-18
G7 USER MANUAL
Total directional characteristics of G7 with ACO 7052H microphone and SV 12L preamplifier
Table C.15. Directional response for G7, including microphone type ACO 7052H
Angle [o]
0-5
5-10
10-15
15-20
f [Hz]
20-25
25-30
30-35
35-40
40-45
[dB]
250
0.00
0.01
0.02
0.03
0.00
0.03
0.04
0.05
0.00
315
0.00
-0.01
0.00
-0.01
0.00
-0.01
0.00
-0.01
0.00
400
0.01
0.03
0.04
0.06
0.07
0.09
0.11
0.14
0.15
500
-0.01
-0.02
-0.03
0.00
-0.04
0.00
-0.04
-0.05
0.00
630
-0.01
0.00
-0.02
-0.04
-0.05
-0.07
-0.08
-0.11
0.00
800
0.00
0.00
0.00
0.00
0.01
0.02
0.03
0.05
0.06
1000
0.01
0.00
0.00
-0.01
-0.03
-0.04
-0.06
-0.11
-0.15
1250
0.01
0.00
-0.03
-0.07
-0.13
-0.20
-0.28
-0.47
-0.55
1600
0.01
0.02
0.03
0.04
0.08
0.13
0.20
0.36
0.42
2000
0.02
0.00
-0.08
-0.17
-0.24
-0.32
-0.39
-0.48
-0.56
2240
0.01
0.00
-0.03
-0.10
-0.18
-0.29
-0.42
-0.69
-0.79
2500
0.02
0.07
0.16
0.28
0.43
0.56
0.66
0.70
0.00
2800
-0.01
-0.04
-0.11
-0.26
-0.45
-0.64
-0.78
-0.79
0.00
3150
-0.01
-0.07
-0.13
-0.14
0.00
-0.10
0.00
-0.21
-0.34
3550
0.01
0.04
0.13
0.28
0.46
0.56
0.00
0.31
0.00
4000
0.03
0.10
0.15
0.00
-0.04
-0.24
-0.46
-0.69
0.00
4500
-0.09
-0.21
-0.34
-0.44
-0.54
-0.68
-0.71
0.00
-1.05
C-19
G7 USER MANUAL
_
5000
0.19
0.31
0.34
0.00
0.14
0.00
-0.10
-0.30
-0.41
5600
-0.02
6300
-0.02
0.00
0.08
0.00
-0.07
0.14
0.00
-0.11
-0.43
-0.82
-0.85
0.00
-0.08
-0.25
-0.44
-0.59
-0.60
7100
-0.02
-0.08
-0.23
-0.44
-0.59
0.00
-0.50
-1.11
-1.26
8000
0.01
0.04
0.00
-0.11
-0.31
-0.69
-0.82
-0.98
-1.31
8500
9000
-0.02
0.05
0.08
0.00
0.02
-0.22
-0.63
-0.70
-0.98
0.21
0.00
0.00
-0.31
-0.47
-0.63
-0.80
-0.97
-1.37
9500
-0.07
-0.26
-0.55
-0.67
-0.77
-1.10
-1.34
-1.48
-1.67
10000
0.00
-0.02
-0.07
-0.23
-0.42
-0.50
-0.69
-0.81
-1.55
10600
-0.01
0.09
0.20
0.28
0.00
-0.21
-0.22
-0.85
-1.02
11200
0.05
0.00
-0.40
-0.54
0.00
-0.92
-1.17
-1.43
-2.04
11800
-0.68
-0.73
-0.79
-0.94
-1.21
-1.64
-1.87
-2.03
-2.51
12500
-0.43
-0.82
-0.95
-0.98
-1.37
-1.51
-1.99
-2.35
-2.78
Angle [o]
45-50
50-55
55-60
60-65
65-70
70-75
75-80
80-85
85-90
f [Hz]
[dB]
250
0.04
0.00
0.04
0.00
0.01
0.00
-0.02
-0.04
-0.07
315
0.00
0.01
0.00
0.02
0.03
0.04
0.07
0.08
0.00
400
0.16
0.00
0.16
0.00
0.15
0.00
0.10
0.00
-0.02
500
-0.05
-0.06
-0.07
-0.08
-0.09
-0.10
-0.13
-0.15
-0.18
630
-0.11
0.00
-0.09
0.00
-0.06
0.00
-0.02
0.00
0.01
800
0.07
0.08
0.09
0.10
0.00
0.11
0.14
0.17
0.19
1000
-0.20
-0.23
-0.28
-0.33
-0.38
-0.41
-0.42
0.00
-0.28
1250
-0.60
-0.63
0.00
-0.60
0.00
-0.53
-0.54
-0.57
-0.59
1600
0.46
0.00
0.34
0.00
0.08
0.00
-0.18
0.00
-0.09
2000
-0.66
-0.71
0.00
-0.43
0.00
-0.03
-0.23
-0.54
-0.83
2240
-0.85
-0.91
-1.05
-1.16
0.00
-0.88
-0.42
-0.46
-0.73
2500
0.27
0.00
0.02
0.03
-0.05
-0.19
-0.23
0.00
0.25
2800
-0.31
0.00
-0.44
-0.76
-1.01
0.00
-0.99
-1.02
0.00
3150
-0.46
0.00
-0.18
0.00
-0.14
-0.52
-0.82
0.00
-0.73
3550
-0.11
-0.15
0.00
-0.23
0.00
0.00
-0.57
-0.85
-0.87
4000
-0.45
-0.81
-1.14
-1.26
0.00
-1.13
-0.98
-1.49
-1.91
4500
0.00
-0.86
-1.07
-1.48
-1.82
0.00
-1.37
0.00
-2.41
5000
-0.46
-0.60
-0.93
0.00
-0.48
-0.85
-1.44
-1.59
0.00
5600
0.00
-0.90
-1.08
-1.28
-1.43
-1.85
-1.21
-1.98
-2.69
6300
-0.90
-1.07
-1.25
-1.36
-1.38
-1.71
-2.16
-2.17
0.00
7100
-1.37
-1.53
-1.65
-1.89
-2.16
-2.43
-2.65
-2.98
-3.10
8000
0.00
-1.53
-2.05
0.00
-2.14
-2.71
-3.04
0.00
-3.64
8500
-1.24
-1.28
-1.81
-2.08
-2.10
-2.71
-3.12
0.00
-3.86
9000
-1.54
-1.95
-2.43
-2.85
-2.94
-3.40
-3.58
-4.05
0.00
9500
-1.91
-2.48
-2.79
-3.02
-3.42
0.00
-3.94
-4.02
-4.16
10000
-1.84
-1.99
-2.50
-2.81
-3.05
-3.49
-3.80
-4.03
-4.72
10600
-1.22
-1.84
-1.97
-2.32
-2.67
-3.18
-3.87
-4.08
-4.37
11200
-2.61
-2.94
-3.42
-3.67
-4.22
-4.31
-4.92
-5.17
-5.95
11800
-2.95
-3.31
-4.21
-4.57
-4.89
-5.53
-5.65
-6.34
-6.43
12500
-3.05
-3.54
-3.93
-4.28
-4.96
-5.19
-6.24
-6.40
-6.96
C-20
G7 USER MANUAL
Angle [o]
90-95
95-100
100-105
105-110
f [Hz]
110-115
115-120
120-125
125-130
130-135
[dB]
250
-0.11
-0.15
-0.20
-0.21
0.00
-0.24
-0.25
0.00
-0.25
315
0.10
0.12
0.14
0.17
0.20
0.25
0.28
0.31
0.34
400
-0.06
-0.11
-0.17
-0.22
-0.27
-0.38
-0.42
-0.46
-0.50
500
-0.20
-0.21
-0.23
-0.24
0.00
-0.24
0.00
-0.20
0.00
630
0.00
-0.01
-0.04
-0.07
-0.10
-0.17
-0.20
-0.23
-0.24
800
0.21
0.00
0.17
0.00
0.03
-0.17
-0.27
-0.35
-0.40
1000
0.00
-0.18
0.00
-0.16
-0.18
-0.28
-0.36
-0.45
-0.55
1250
0.00
-0.54
0.00
-0.45
0.00
-0.36
-0.40
-0.50
-0.65
1600
-0.14
-0.27
-0.40
-0.43
0.00
-0.15
0.00
0.10
0.00
2000
-0.89
0.00
-0.63
-0.67
-0.81
-0.89
0.00
-0.34
0.00
2240
-1.05
-1.22
0.00
-1.01
0.00
-1.18
0.00
-0.85
0.00
2500
0.00
-0.24
-0.48
0.00
-0.17
-0.24
0.00
-0.06
0.16
2800
-0.51
-0.58
-0.95
-1.27
-1.30
-1.07
-1.13
0.00
-0.70
3150
0.00
-0.39
0.00
-0.66
-1.02
-0.63
0.00
-0.72
0.00
3550
0.00
-0.63
0.00
-0.42
-0.83
-1.14
0.00
-0.83
-0.86
4000
0.00
-1.53
0.00
-1.44
-1.59
-2.22
0.00
-1.69
-1.93
4500
0.00
-2.02
0.00
-1.86
-2.01
-2.39
-2.47
0.00
-2.18
5000
-1.17
-2.10
0.00
-1.24
-1.52
-1.84
-1.85
-1.92
0.00
5600
0.00
-1.94
-2.04
-3.03
0.00
-2.62
0.00
-3.10
0.00
6300
-2.97
0.00
-2.23
-2.28
-3.41
-2.66
0.00
-3.15
-3.18
7100
0.00
-3.57
-3.89
0.00
-3.33
-4.42
0.00
-3.37
-4.38
8000
-3.71
0.00
-3.90
-4.82
0.00
-5.33
0.00
-4.01
-4.22
8500
0.00
-3.18
-4.46
0.00
-3.24
-4.58
0.00
-3.73
-4.63
9000
-5.02
0.00
-4.68
-5.89
0.00
-6.36
0.00
-5.07
-5.62
9500
-4.50
-4.97
-5.55
0.00
-4.34
-6.09
0.00
-4.89
-5.17
10000
0.00
-5.89
0.00
-5.52
-6.50
0.00
-6.27
0.00
-5.77
10600
-4.99
-5.01
-5.33
-5.99
0.00
-7.05
0.00
-7.21
0.00
11200
0.00
-6.86
0.00
-6.68
0.00
-5.82
-7.44
0.00
-6.13
11800
-7.05
00.0
-7.30
-8.04
-9.05
0.00
-8.63
0.00
-7.78
12500
-7.09
-7.99
0.00
-8.83
0.00
-9.22
0.00
-9.51
0.00
Angle [o]
135-140
140-145
145-150
150-155
155-160
160-165
165-170
170-175
175-180
-0.32
0.00
-0.32
-0.33
f [Hz]
250
[dB]
-0.27
-0.29
0.00
-0.28
-0.31
315
0.37
0.40
0.42
0.45
0.50
0.51
0.52
0.53
0.54
400
-0.54
-0.57
-0.59
-0.61
-0.64
-0.65
-0.66
-0.67
-0.68
500
-0.16
0.00
-0.07
0.00
-0.01
0.01
0.02
0.03
0.00
630
-0.25
0.00
-0.25
0.00
-0.22
0.00
-0.18
0.00
-0.16
800
-0.44
0.00
-0.43
0.00
-0.37
0.00
-0.25
0.00
-0.20
1000
-0.62
-0.65
-0.66
0.00
-0.61
0.00
-0.44
0.00
-0.35
1250
-0.79
-0.88
-0.92
0.00
-0.85
0.00
-0.67
0.00
-0.65
1600
-0.08
-0.21
-0.28
0.00
-0.18
0.00
0.13
0.20
0.23
2000
-0.36
-0.54
-0.68
-0.71
-0.48
0.00
-0.17
0.00
0.00
2240
-0.68
-0.86
-1.12
-1.31
-1.11
0.00
-0.56
0.00
-0.26
C-21
G7 USER MANUAL
2500
_
0.23
0.00
-0.32
-0.63
-0.65
0.00
0.28
0.45
0.51
2800
0.00
-0.40
-0.67
-1.09
-1.32
0.00
-0.39
0.00
-0.09
3150
-0.03
0.00
-0.41
-0.85
-1.08
0.00
-0.35
0.00
0.00
3550
0.00
-0.18
-0.29
-0.80
-1.31
0.00
-0.19
0.00
0.19
4000
0.00
-1.31
0.00
-1.77
-2.48
0.00
-1.25
0.00
-0.89
4500
0.00
-1.29
-1.73
-2.55
-2.85
0.00
-1.35
0.00
-1.15
5000
-1.74
0.00
-0.98
0.00
-1.85
-2.47
0.00
-1.23
0.00
5600
-2.71
0.00
-2.61
0.00
-2.57
-3.54
0.00
-2.15
0.00
6300
0.00
-2.87
0.00
-2.60
-2.37
-3.44
-3.56
0.00
-1.59
7100
0.00
-3.66
0.00
-3.23
-2.96
-4.06
-4.42
0.00
-2.13
8000
-5.13
-4.45
0.00
-3.81
0.00
-4.16
-5.21
0.00
-2.76
8500
0.00
-3.79
0.00
-3.00
-3.37
-4.62
0.00
-2.41
0.00
9000
-5.88
0.00
-5.72
0.00
-4.50
-4.74
-6.15
0.00
-3.58
9500
-5.92
0.00
-5.38
-4.50
0.00
-5.64
0.00
-4.01
0.00
10000
-6.45
0.00
-5.99
0.00
-5.13
0.00
-6.54
0.00
-4.41
10600
-6.32
-6.97
0.00
-6.50
-5.84
0.00
-6.88
-6.92
0.00
11200
-6.34
0.00
-6.27
0.00
-5.42
-6.42
-7.18
0.00
-5.19
11800
-8.10
-8.23
0.00
-8.00
0.00
-7.01
-7.53
0.00
-6.61
12500
-8.70
-8.93
0.00
-7.99
-8.07
-8.19
-9.16
0.00
-7.07
Angle [o]
180-185
185-190
190-195
195-200
200-205
205-210
210-215
215-220
220-225
f [Hz]
C-22
[dB]
250
-0.35
0.00
-0.34
-0.36
0.00
-0.34
0.00
-0.34
0.00
315
0.00
0.54
0.00
0.52
0.00
0.47
0.00
0.42
0.00
400
-0.69
-0.70
0.00
-0.71
0.00
-0.71
0.00
-0.69
0.00
500
0.02
0.00
0.00
-0.02
-0.05
-0.07
-0.10
-0.13
-0.16
630
-0.17
0.00
-0.19
-0.23
-0.26
-0.29
-0.32
-0.35
-0.37
800
0.00
-0.17
-0.18
-0.21
-0.24
-0.27
-0.30
-0.33
-0.34
1000
0.00
-0.30
0.00
-0.33
-0.36
-0.39
-0.42
0.00
-0.41
1250
-0.68
-0.74
-0.82
-1.03
-1.13
-1.21
-1.22
0.00
-1.01
1600
0.00
0.20
0.00
0.05
-0.12
-0.14
0.00
0.03
0.16
2000
0.00
-0.05
-0.16
-0.44
-0.54
0.00
-0.33
0.00
0.09
2240
-0.28
-0.42
-0.65
-1.12
-1.17
0.00
-0.77
0.00
-0.53
2500
0.00
0.27
0.00
-0.65
0.00
-0.35
0.00
0.18
0.00
2800
-0.20
-0.48
-0.89
-1.40
0.00
-0.70
0.00
-0.37
-0.65
3150
-0.13
-0.43
-0.81
-1.17
0.00
-0.42
0.00
-0.41
-0.86
3550
0.00
-0.41
-0.97
-1.33
0.00
-0.14
-0.23
-0.69
-0.94
4000
-1.06
-1.51
-2.13
-2.39
0.00
-1.13
-1.55
-1.96
0.00
4500
-1.92
-2.70
-2.71
0.00
-1.28
-1.53
-2.16
0.00
-2.38
5000
-1.06
-1.86
-2.44
0.00
-1.13
-1.64
-1.74
0.00
-1.87
5600
-1.48
-2.07
-3.00
-3.33
0.00
-2.40
-2.65
0.00
-2.80
6300
0.00
-2.40
-3.37
-2.39
0.00
-2.55
-2.68
-2.88
0.00
7100
-2.14
-3.30
-4.59
-2.89
-3.04
-3.40
-3.53
-3.63
0.00
8000
-3.76
-5.03
0.00
-3.36
-3.87
-4.00
-4.33
-4.82
0.00
8500
-3.55
-4.59
0.00
-2.97
-3.36
-3.59
-3.85
-4.76
0.00
9000
-4.77
-6.27
0.00
-4.54
-4.65
-5.02
-5.11
-5.80
0.00
9500
-4.99
-5.77
0.00
-4.38
-4.48
-5.08
-5.39
0.00
-4.75
G7 USER MANUAL
10000
-5.87
-6.41
0.00
-5.30
-5.34
-5.42
-6.53
0.00
10600
-4.69
-6.50
-7.01
-5.96
-6.09
11200
-6.82
0.00
-6.05
-6.45
-6.57
11800
-8.70
0.00
-7.80
-7.90
12500
-8.96
0.00
-8.10
Angle [o]
225-230
230-235
235-240
-6.53
0.00
-6.97
0.00
-6.59
-7.19
0.00
-6.68
-8.26
0.00
-8.59
-8.93
0.00
0.00
-8.65
0.00
-8.69
-8.75
0.00
240-245
245-250
250-255
255-260
260-265
265-270
-0.24
0.00
-0.24
0.00
-0.21
f [Hz]
250
-5.62
[dB]
-0.31
0.00
-0.30
0.00
315
0.38
400
-0.65
0.00
0.33
0.00
0.26
0.00
0.22
0.00
0.18
0.00
-0.59
0.00
-0.46
0.00
-0.36
0.00
-0.26
500
-0.17
0.00
-0.17
0.00
-0.14
0.00
-0.09
0.00
-0.05
630
-0.38
0.00
-0.38
0.00
-0.30
0.00
-0.23
0.00
-0.16
800
-0.35
0.00
-0.29
0.00
-0.10
0.00
-0.01
0.01
0.00
1000
0.00
-0.33
-0.25
0.00
-0.23
-0.24
-0.27
-0.31
-0.36
1250
0.00
-0.68
-0.54
-0.56
-0.62
-0.68
-0.73
-0.76
-0.77
1600
0.28
0.34
0.23
0.00
-0.09
-0.14
0.00
0.04
0.07
2000
0.00
-0.09
-0.61
-0.63
0.00
-0.46
-0.57
-0.76
-0.80
2240
-0.72
-0.99
-1.17
0.00
-1.03
-1.22
-1.34
0.00
-0.88
2500
-0.20
-0.36
-0.20
-0.22
-0.45
-0.50
0.00
0.10
0.27
2800
-0.91
-0.98
-0.98
-1.23
0.00
-0.95
0.00
-0.54
-0.77
3150
-0.89
0.00
-1.08
0.00
-0.58
0.00
-0.44
-0.59
-0.74
3550
0.00
-0.60
-1.12
0.00
-0.31
-0.45
-0.50
-0.61
-0.86
4000
-1.59
-2.05
-2.09
0.00
-1.34
-1.35
-1.70
-1.85
0.00
4500
-2.43
0.00
-1.85
0.00
-1.85
-2.17
-2.40
0.00
-1.42
5000
0.00
-1.78
0.00
-1.23
-1.39
-1.87
-2.06
0.00
-0.80
5600
-2.86
-2.92
-2.10
-2.49
-2.88
-2.97
0.00
-1.81
-2.33
6300
-3.11
-3.13
-2.57
-3.01
-3.28
0.00
-2.08
-2.70
-2.88
7100
-4.38
0.00
-3.77
-4.45
0.00
-2.92
-3.90
0.00
-2.53
8000
-3.77
-3.90
-5.16
0.00
-3.23
-4.54
0.00
-3.44
-3.67
8500
-3.57
-4.12
-4.85
0.00
-4.65
0.00
-3.27
-3.91
0.00
9000
-4.50
-5.42
-3.84
-5.12
0.00
-3.71
-4.39
0.00
-3.50
9500
-4.86
-6.13
0.00
-4.65
-5.89
0.00
-5.06
0.00
-4.19
10000
-6.20
-6.83
0.00
-6.30
0.00
-5.97
0.00
-4.68
0.00
10600
-6.03
-6.94
-5.49
-6.97
0.00
-5.63
0.00
-4.88
-4.93
11200
0.00
-6.99
-7.58
0.00
-7.52
0.00
-6.32
0.00
-5.46
11800
-9.47
0.00
-9.23
0.00
-8.07
0.00
-7.15
-7.42
0.00
12500
-8.69
0.00
-9.39
0.00
-7.38
-7.77
0.00
-6.78
0.00
Angle [o]
270-275
275-280
280-285
285-290
290-295
295-300
300-305
305-310
310-315
0.00
-0.16
0.00
-0.15
f [Hz]
[dB]
250
-0.22
-0.23
0.00
315
400
-0.18
-0.19
0.00
0.14
0.00
-0.17
0.00
0.09
0.00
0.06
0.00
0.03
0.00
0.00
-0.07
0.00
-0.03
0.00
-0.01
0.00
500
0.00
-0.02
0.00
0.01
0.02
0.03
0.00
0.03
0.00
630
0.00
-0.12
0.00
-0.11
0.00
-0.11
0.00
-0.11
0.00
C-23
G7 USER MANUAL
_
800
0.00
-0.03
0.00
-0.03
0.00
-0.01
0.00
0.00
0.00
1000
-0.42
-0.50
1250
0.00
-0.69
-0.51
0.00
0.00
-0.54
-0.45
0.00
-0.33
0.00
-0.27
-0.55
-0.57
-0.58
0.00
-0.51
1600
0.00
-0.11
0.00
0.08
0.24
0.39
0.49
0.53
0.00
2000
0.00
-0.30
0.00
-0.02
-0.25
-0.51
-0.66
0.00
-0.55
2240
0.00
2500
0.00
-0.68
-0.92
-1.14
-1.19
0.00
-0.97
0.00
-0.90
-0.20
0.00
-0.06
0.00
-0.01
0.05
0.26
0.50
2800
-0.91
-0.92
-1.05
0.00
-0.74
0.00
-0.26
-0.30
-0.46
3150
-0.87
-0.92
0.00
-0.13
0.00
-0.32
-0.44
0.00
-0.26
3550
0.00
-0.43
0.00
-0.12
-0.16
0.00
-0.16
0.00
0.02
4000
-1.12
-0.90
-1.01
-1.17
0.00
-0.80
0.00
-0.35
-0.54
4500
-1.56
-1.81
0.00
-1.13
0.00
-0.77
-0.90
0.00
-0.68
5000
-1.52
0.00
-0.98
0.00
-0.71
-0.98
0.00
-0.40
0.00
5600
-2.64
-1.27
-1.67
-1.85
0.00
-1.36
0.00
-0.84
0.00
6300
0.00
-2.14
0.00
-1.64
0.00
-1.35
0.00
-1.10
0.00
7100
-3.07
-2.57
0.00
-2.33
0.00
-1.87
0.00
-1.49
0.00
8000
0.00
-2.94
0.00
-2.49
0.00
-2.09
0.00
-1.22
-1.26
8500
-2.93
0.00
-2.03
0.00
-1.75
0.00
-1.08
0.00
-0.60
9000
0.00
-3.18
0.00
-2.49
0.00
-1.84
0.00
-1.25
0.00
9500
-4.22
0.00
-3.46
0.00
-2.91
0.00
-2.41
-1.77
0.00
10000
-4.03
0.00
-3.58
0.00
-2.57
0.00
-1.90
0.00
-1.35
10600
0.00
-4.06
0.00
-3.21
0.00
-2.46
0.00
-1.97
0.00
11200
0.00
-4.51
0.00
-3.56
0.00
-2.81
0.00
-1.96
0.00
11800
-6.44
0.00
-5.60
0.00
-4.28
0.00
-3.45
0.00
-2.65
12500
-6.09
0.00
-5.30
0.00
-4.33
0.00
-3.12
0.00
-2.39
Angle [o]
315-320
320-325
325-330
330-335
335-340
340-345
345-350
350-355
355-360
f [Hz]
C-24
[dB]
250
-0.14
0.00
-0.10
0.00
-0.01
0.00
0.01
0.00
0.00
315
0.01
0.00
-0.01
-0.02
0.00
0.01
0.00
-0.01
0.00
400
-0.01
0.00
-0.02
0.00
-0.02
0.00
-0.02
-0.01
0.01
500
0.03
0.00
0.02
0.00
0.01
0.00
0.01
0.00
-0.01
630
-0.10
0.00
-0.08
0.00
-0.06
0.00
-0.06
-0.05
-0.01
800
0.01
0.00
0.01
0.00
0.01
0.00
-0.01
-0.02
0.00
1000
-0.23
0.00
-0.19
0.00
-0.12
0.00
-0.06
-0.01
0.01
1250
-0.40
0.00
-0.28
0.00
-0.16
0.00
-0.04
0.01
0.01
1600
0.44
0.00
0.14
0.00
0.03
0.00
0.00
0.02
0.01
2000
-0.45
0.00
-0.37
0.00
-0.28
0.00
-0.09
0.00
0.02
2240
-0.68
0.00
-0.31
0.00
-0.06
0.00
0.03
0.04
0.01
2500
0.75
0.00
0.59
0.00
0.27
0.00
0.04
0.01
0.02
2800
-0.80
0.00
-0.65
0.00
-0.26
0.00
-0.04
0.01
-0.01
3150
-0.13
-0.15
-0.17
-0.19
0.00
-0.14
0.00
-0.05
-0.01
3550
0.39
0.54
0.56
0.00
0.21
0.00
0.01
-0.01
0.01
4000
-0.65
0.00
-0.06
0.00
0.10
0.14
0.00
0.08
0.03
4500
0.00
-0.53
0.00
-0.38
0.00
-0.09
0.00
-0.04
-0.09
5000
-0.34
0.00
0.21
0.29
0.35
0.00
0.22
0.00
0.19
5600
-0.84
0.00
-0.48
0.00
0.05
0.12
0.00
0.03
-0.02
G7 USER MANUAL
6300
-0.54
-0.57
0.00
-0.27
0.00
7100
8000
-0.02
0.00
0.04
-0.02
-1.23
0.00
-0.41
-0.57
0.00
-0.80
0.00
-0.32
-0.65
0.00
-0.24
0.05
-0.02
0.00
-0.03
0.00
0.04
0.01
8500
0.00
-0.30
0.00
0.23
0.24
0.00
-0.08
0.06
-0.02
9000
-0.63
0.00
-0.49
0.00
-0.04
0.20
0.00
0.06
0.21
9500
-1.37
0.00
-0.80
0.00
-0.69
0.00
-0.09
0.04
-0.07
10000
0.00
-0.73
0.00
-0.32
0.00
-0.06
0.01
0.00
0.00
10600
-1.14
0.00
-0.32
0.00
-0.08
0.27
0.00
0.13
-0.01
11200
-1.02
0.00
-0.50
0.00
-0.06
0.00
0.08
0.00
0.05
11800
0.00
-1.87
0.00
-1.41
0.00
-0.81
0.00
-0.33
-0.68
12500
0.00
-1.54
0.00
-1.09
0.00
-0.84
0.00
-0.1
-0.43
C-25
G7 USER MANUAL
_
C.2. Specification of G7 as 1/1 OCTAVE, 1/3 OCTAVE and FFT sound analyser
The G7 instrument as 1/1 OCTAVE, 1/3 OCTAVE or FFT sound analyser conforms to the to he Type 1
of the international standards IEC 61672 sound level meters and the IEC 61260 standard for the pass
band filters.
See Appendix C.1. for the basic specification.
Antialiasing filter:
Built-in antialiasing filter ensuring correct sampling of the measured signal.
Pass band (-1 dB):
Stop band :
Attenuation in the stop band:
24.2 kHz,
27.1 kHz,
> 100 dB.
Sampling frequency:
48 kHz (internal only)
Analogue to digital converter:
24 bit
Reference range:
HIGH
Input attenuator accuracy (for f = 1 kHz and T = +23°C):
± 0.1 dB
Internal oscillator accuracy (for f = 1 kHz and T = +23°C):
0.01 %
Digital Filters (see Appendix D)
High pass filter Z
cut-off frequency 27.0 Hz / -0.1 dB (10.0 Hz / -3.0 dB),
pass-band ripple < 0.1 dB, roll-off 6 dB / octave.
1/1 OCTAVE
15 filters with centre frequencies from 1 Hz to 16 kHz (base 2), meeting
DIN 45651, IEC 1260 (Annex B) and ANSI S1.11-1986 for Type 1.
1/3 OCTAVE
45 filters with centre frequencies from 0.8 Hz to 20 kHz (base 2), meeting
DIN 45651, IEC 1260 (Annex B) and ANSI S1.11-1986 for Type 1.
FFT Analysis:
1920 lines of the power spectrum calculated in real time with Overlapping and linear averaging.
Overlapping factor:
> 37%
for 22.4 kHz band
> 68%
for 11.2 kHz band
> 84%
for 5.6 kHz band
> 92%
for 2.8 kHz band
> 96%
for 1.4 kHz band
C-26
G7 USER MANUAL
> 98%
> 99%
> 99%
> 99%
Time window:
for 700 Hz band
for 350 Hz band
for 175 Hz band
for 87.5 Hz band
Hanning
Averaging: Linear
C-27
G7 USER MANUAL
_
C.3. Specification of G7 as vibration level meter
System configuration:
G7 with SV 39A seat accelerometer or 3032M2 accelerometer.
Accessories included:
SC 61
TNC to BNC integrated connector
Accessories available:
SV 39A
3023M2
SC 39S
-2
Seat Triaxial accelerometer, 100 mV / g (10 mV / ms ), from 0.5 Hz to 3 kHz
-2
Triaxial accelerometer, 10 mV / g (1 mV / ms ), 4 pin side connector, M3 hole mounting
Cable used to connect the Seat Accelerometer SV 39A or triaxial accelerometer 3023M2
System conforms to the ISO 8041, ISO 2631-1, ISO 5349 and ISO 10816 standards.
Notice: With DYTRAN 3023M2 accelerometer the overall system specification
conforms to the ISO 5349 standards for the Human Hand-Arm response to the mechanical
vibration meeting requirements for Type 1 Meter.
See Appendix C.1. for other available accessories.
Measured quantities
The measured quantities in the vibration meter mode are RMS, PEAK, P–P, MTVV or MAX.
The definitions for mentioned parameters are given in Appendix D.
Linear operating ranges for the acceleration
-2
-2
Two ranges with the nominal values: 17.8 ms (LOW), 316 ms (HIGH)
-6
-2
(145 dB, 170 dB related to 10 ms ).
-2
Notice: With the accelerometer of the sensitivity equal to 1 mV/ms
-2
-2
ranges are equal to 178 ms and the 3160 ms .
the nominal
Mounting for vibration tests
The accelerometer can be connected with the VLM using proper cable provided by the manufacturer.
The accelerometer can be mounted on the plate in various ways:
•
using threaded stud onto a flat, smooth surface
•
using thin layer of bees-wax for sticking the accelerometer into the plate
•
using mica washer and isolates stud, where the body of accelerometer should be electrically isolated
from the measuring object
•
using permanent magnet, which also electrically isolates the accelerometer.
C-28
G7 USER MANUAL
Values of the measured acceleration using the accelerometer
-2
with the nominal sensitivity equal to 10 mV / ms (e.g. the SV 39A seat accelerometer):
• Linear measurement with the W–Bc, W–Bxy, and W–Bz filters:
-2
-2
from 0.001 ms to 354 ms (the sinusoidal signal RMS)
-2
-2
from 0.003 ms to 500 ms (PEAK)
Table C.16. Linear operating ranges with the W–Bc, W–Bxy and W–Bz filters
RANGE (RMS)
Linear operating ranges
-2
LOW
from 1.00 mms (60.0 dB)
HIGH
from 10 mms (80.0 dB)
-2
-2
to 56.2 ms (155.0 dB)
-2
to 354 ms (171.0 dB)
• Linear measurement with the HP filter:
-2
-2
from 0.003 ms to 354 ms (the sinusoidal signal RMS)
-2
-2
from 0.03 ms to 500 ms (PEAK)
Table C.17. Linear operating ranges with the HP filter
RANGE (RMS)
Linear operating ranges
-2
LOW
from 3.16 mms (70.0 dB)
HIGH
from 33 mms (90.4 dB)
-2
-2
to 56.2 ms (155.0 dB)
-2
to 354 ms (171.0 dB)
Values of the measured acceleration using the accelerometer
-2
with the nominal sensitivity equal to 1 mV / ms (e.g. 3023M2):
• Linear measurement with the Wh filter:
-2
-2
from 0.01 ms to 3540 ms (the sinusoidal signal RMS)
-2
-2
from 0.03 ms to 5000 ms (PEAK)
Table C.18. Linear operating ranges with the Wh filter
RANGE (RMS)
Linear operating ranges
-2
do 562 ms (175.0 dB)
-2
do 3540 ms (191.0 dB)
LOW
od 10 mms (80.0 dB)
HIGH
od 100 mms (100.0 dB)
-2
-2
• Linear measurement with the HP filter:
-2
-2
from 0.03 ms to 3540 ms (the sinusoidal signal RMS)
-2
-2
from 0.3 ms to 5000 ms (PEAK)
Table C.19. Linear operating ranges with the HP filter
RANGE (RMS)
Linear operating ranges
-2
LOW
from 31.6 mms (90.0 dB)
HIGH
from 330 mms (110.4 dB)
-2
-2
to 562 ms (175.0 dB)
-2
to 3540 ms (191.0 dB)
Notice: In the measurement of the signal with the crest factor n > 1.41 the upper linear
operating range for the RMS value is reduced. Its value can be calculated from the equation:
An = A +10 - 20log (n / 2 ) [m], where A is the given range for the sinusoidal signal. E.g. for n = 10 and
A = 140 the value of A10 is equal to = 133 dB.
C-29
G7 USER MANUAL
_
Notice: In the measurement conditions with the strong electromagnetic disturbances
(e.g. near the high-voltage transmission lines) the lower measurement limit can be drastically shifted
as the result of the external field influence on the measurement cables. In such cases, the careful
shielding of the measurement cables is strongly recommended. It is worth to underline that
the estimation of the external influence can be performed in-site by the observations of the measurement
signal spectrum.
Frequency range for the acceleration measurement (+/- 10%):
0.5 Hz ÷ 5 kHz in the linear measurements with the HP filter
Notice: With the application of another vibration transducer, the frequency range given
above for the HP filter can be different (i.e. wider).
Basic error for the acceleration measurement:
Pre-heating time:
< ± 0.5 dB
1 minute
Calibration:
Direct: by
the
measurement
by the external vibration calibrator
Indirect:
of
the
standard
signal
generated
by the declaration of the transducer's sensitivity
Calibration procedure is given in Chapter 4 of the Manual.
Accelerometer input:
Connector:
Impedance:
Vibration transducers powering:
Range of the measured voltage:
TNC
40 kΩ / 100 pF (typical)
28 V / 1.5 mA current source
Lower level - filter depended (see below)
Upper level - 7.5 VRMS (137 dB related to 1 µVRMS or 177 dB related
2
to 1 µm/s RMS)
Internal noise level
Wideband noise level measured with the voltage input short-circuit (20 kHz band):
• with the HP filter:
< 17 µVRMS
• with the W–Bxy filter:
< 3 µVRMS
• \with the W–Bz filter:
< 3 µVRMS
• with the W–Bc filter:
< 3 µVRMS
• with the Wh filter:
< 3 µVRMS
Reference range:
170 dB
Level indication range:
from -100 dB to +10.2 dB related to the nominal range level plus
the calibration factor
C-30
G7 USER MANUAL
Basic accuracy:
< ± 0.2 dB for the temperature T=+23°C ± 5°C for sinusoidal signal
140 dBRMS in the band 10 Hz ÷ 20 kHz with the Wh input filter
Measurement error in the full temperature range:
< ± 0.3 dB when the temperature is from -10°C to +50°C
for the sinusoidal signal 140 dBRMS in the band 10 Hz ÷ 20 kHz
with the H-A input filter
Input divider accuracy:
± 0.1 dB
Digital filters
Low-pass filters:
8 eighth-order elliptic filters with the cut-off frequencies from 10 kHz to 78.125 Hz in the binary sequence.
Ripple in the pass band:
Attenuation in the stop band:
± 0.1 dB
> 100 dB
High-pass filter:
HP filter
see Appendix D. for the frequency response characteristics
Weighting filters (see Appendix D. for the frequency response characteristics):
•
•
•
•
W–Bxy
W–Bz
W–Bc
Wh
from
from
from
from
1 Hz to 330 Hz
3 Hz to 1000 Hz
3 Hz to 1000 Hz
1 Hz to 330 Hz
C-31
G7 USER MANUAL
_
C4. Miscellaneous specification of G7
Display
Graphical, the liquid crystals (LCD) type with the backlight, 128x64 pixels and icons.
Memory
16 MB flash memory and 128 kB of the RAM memory.
Flash memory divided between:
• buffer for the registration of the time history and spectra (ca. 49 % of the installed memory)
• FLASH-disk for storing the measurement data files (ca. 46 % of the installed memory)
• internal program (ca. 5 % of installed memory)
Real Time Clock
Built-in, real time with the accuracy better than 1 minute/month. If there is not any power, supply
in the instrument for longer than one hour the real time clock is reset.
Weight
600 grams with the batteries, microphone and preamplifier
Dimensions:
42x82x333 mm
Environmental parameters
• Working temperature range:
-10°C ÷ +50°C
• Storing temperature range:
-20°C ÷ +50°C
Signal input
The measured signal, coming from the microphone preamplifier, is connected to a TNC socket presented
below.
TNC connector (external view)
Table C.20. Pin-out of the TNC connector
Pin number
TNC
Central
Input
Shield
Ground
Power supply & Ext. Pow.
Four replaceable AA batteries are the main source of instrument’s powering. The power consumption
from the 6 V source is < 120 mA (at + 20°C).
C-32
G7 USER MANUAL
Therefore, typical operating time from four AA alkaline batteries should be about 15 hours.
For the temperatures below 0°C, the operating time can be shorter (depending on the batteries).
The instrument can be also powered from the external source (e.g. SA 17A or car battery) with the DC
voltage from 6 V to 15 V. The voltage ripple should not exceed ± 5%.
The external power requirement is voltage dependant:
for 6 V
- 150 mA DC
for 15 V
- 100 mA DC
Power supply connector 5.5 / 2.1 mm (external view)
Table C.21. Pin-out of 5.5 / 2.1 connector
Pin number
5.5 / 2.1
Shield
Ground
1
+ 6 V ÷ 15 V
The instrument can be also powered from the USB port of a PC. In this case the following conditions and
limitations should be considered:
• Until the internal batteries voltage is higher than ca. 4.6 V, the instrument operates from this source.
• When the internal batteries voltage decreases below 4.6 V and the USB is connected to a PC,
the instrument switches to operate from the USB (that is indicated by the removal of the "Battery" icon
from the display).
• Current capability of the USB port should be as high as 250 mA. In the case of battery-powered PCs
the user should consider this additional current requirement.
• When an external power supply (e.g. SA 17A or car battery) is connected to Ext. Power terminal, the
current is not drawn from the USB, as well as from internal batteries.
EXT I/O (Extended Input/Output) - digital Input / Output pin; 3.3 V input & output levels.
User programmable Input / Output connector
RCA Jack - “Cinch” (external view)
Table C.22. Pin-out of the RCA Jack connector
Pin Number
RCA Jack
1
Output/Input
Shield
Ground
Chassis
Ground
C-33
G7 USER MANUAL
_
Socket:
RCA Jack (“CINCH”) type
Output Voltage:
63.1 mVRMS (± 5 %) at 114 dB reference level of the instrument, when the
calibration factor is set to 0.0 dB
1 VRMS (± 5 %) at 138 dB indication of the instrument, when calibration factor is
set to 0.0 dB
Frequency Band (-3 dB) - 1.0 Hz ÷ 22.6 kHz
Output impedance:
51 Ω / 1%
The user in MENU / SETUP / EXTERNAL I/O SETUP window may set one of EXT I/O modes, which are
available in the instrument: ANALOG OUT, DIGITAL IN, DIGITAL OUT
1. ANALOG OUT, when the measured signal from the measurement channel is fed to EXT I/O
connector, the output levels and the impedance are as shown above
2. DIGITAL IN, when the EXT. TRIGGER function is activated, the external triggering of the instrument
may be provided. In order to do that the user has to select TRIGGER and to set SOURCE: EXT. IO
(path: MENU / INPUT / TRIGGER SETUP / MEASURE TRIGGER). The external signal for triggering is
specified as follows:
2.1. Trigger voltage threshold level is set to +1 V
2.2. Trigger voltage slope (path: MENU / INPUT / TRIGGER SETUP / MEASURE TRIGGER /
TRIGGER:) set by the user as SLOPE+ (uprising, default) or SLOPE– (falling, auxiliary)
2.3. Minimal duration of the trigger impulse: 10 µseconds
2.4. 100 µsec release time after previous measurement is necessary before next trigger
2.5. Recommended trigger voltage should not exceed ± 5 V
2.6. Input impedance in this DIGITAL IN mode - ca. 10 kOhm / 100pF, ESD type safety
2.7. When the instrument is switched-off in the DIGITAL IN mode, the voltage impulse on the EXT I/O
will be able to switch-on the instrument, however in this case the minimal duration of the trigger
impulse of 100 msec is necessary, with uprising voltage slope
3. DIGITAL OUT - two different functions are available in this mode:
3.1. FUNCTION: TRIG. PULSE, when this function is selected, the EXT I/O terminal is set as output,
which enables one to trigger another instrument (one instrument or more with trigger inputs
connected together in parallel), output trigger impulse meets specification given below:
a) trigger impulse is generated before every measurement
b) output voltage range from 0 V or 3 V
c) triggering slope: uprising
d) output impedance: 51 Ohm
e) duration of the impulse: ca. 30 µsec
3.2. FUNCTION: ALARM PULSE, when this function is selected, the EXT I/O terminal is set as
output, which changes its output level, when current result of measurement exceeds userprogrammable threshold level. In this case the EXT I/O output operates as output of analogue
comparator with user-programmable threshold. This feature enables one to control an external
device as alarm-indicator or similar
a) electrical specification of this output are as follows: 0 V to 3 V voltage range, 51 Ohm output
impedance
b) output produces a voltage level (not impulse)
c) ACTIVE LEVEL setting may be selected by the user in menu as LOW or HIGH. If HIGH is
selected, the output alternates from 0 V to 3 V till measurement result is greater than threshold
value
d) SOURCE setting selects source of measurement result to be compared with the threshold
value. One of three results sources may be selected PEAK(1), SPL(1) or LEQ(1)
e) ALARM LEVEL enables one setting-up threshold value
C-34
G7 USER MANUAL
Interface USB
The G7 USB interface enables remote control of the instrument and data transfer up to attainable with
12 MHz clock.
There are two USB ports available on the G7 bottom panel.
USB “Device” port
USB socket (external view)
Table C.23. Pin-out of the USB-Device connector
Pin number
USB
1
Vbus
2
D-
3
D+
4
GND
Shield
Ground
“Host” USB port
USB socket (external view)
Table C.24. Pin-out of the USB-Host connector
Pin number
USB
1
Vbus
2
D-
3
D+
4
GND
Shield
Ground
C-35
G7 USER MANUAL
_
RS 232 interface (optional)
The RS 232 interface option for the G7 is provided by means of the SV 55 interface. It conforms to the EIA
Standard RS 232C. It enables the user to programme remotely all instrument functions
and the transmissions to and from the analyser with the speed from 300 bit/s to 115200 bit/s.
The SV 55 must be connected to the G7 USB Host port and proper operation of this port has to be
set-up in the instrument’s SETUP Menu before!
Below, the SV 55 - DB 09 F - pin female connector pin-out is given.
Table C.25. SV 55 interface description
PC RS 232,
9 - pin connector
Signal name
SV 55 connector
(DB 09 F)
Pin number
1 – LSD
1 (not connected)
2 – RXD
3
3 – TXD
2
4 – DTR
6 connected to pin 4
5 – GND
5
6 – DSR
4 connected to pin 6
7 – RTS
8
8 – CTS
7
9 – GND
9 (not connected)
Electromagnetic Compatibility (EMC)
The product described above is compliant with the following EMC standards:
1. For the EMC emissions specification, according to IEC 61672-1 (chapter 5.18) and IEC 61672-2
(chapter 9), with test methods applied according to CISPR 22:1997 and CISPR 16:1999
2. For the EMC immunity specification, according to IEC 61672-1 (chapter 6.5 and 6.6) and IEC 61672-2
(chapter 7.9 and 7.10), with test methods applied according to IEC 61000-4-2 and IEC 61000-43:2002.
Notice: EMC compatibility is guaranteed only with the original accessories supplied
by SVANTEK!
Safety
The product described above is compliant with following standards:
EN 61010-1:2001 and IEC 61010-1:2001
Compliance with EU Directives
CE mark indicates compliance with EMC Directive 89/336/EEC and Low Voltage Directive 2006/95/EC
C-36
G7 USER MANUAL
Normative references
The following referenced documents are indispensable for application of this document. For dated
references, only the edition cited applies. For undated references, the latest edition of the referenced
document applies.
IEC 61672-1:2005 Electroacoustics - Sound level meters - Part 1: Specifications
IEC 61672-2:2005 Electroacoustics - Sound level meters - Part 2: Pattern evaluation tests
IEC 651 Sound level meters
IEC 61260 Electroacoustics - Octave-band and fractional-octave-band filters
CISPR 22:1997 Information technology equipment - Radio disturbance characteristics - Limits and
methods of measurement
CISPR 16:1999 Specification for radio disturbance and immunity measuring apparatus and methods
IEC 61000-4-2 Electromagnetic compatibility (EMC)- Part 4-2: Testing and measurement techniques Electrostatic discharge immunity test
IEC 61000-4-3:2002 Electromagnetic compatibility (EMC) - Part 4-3 : Testing and measurement
techniques - Radiated, radio-frequency, electromagnetic field immunity test
EN 61010-1:2001 or IEC 61010-1:2001 Safety requirements for electrical equipment for measurement,
control, and laboratory use - Part 1: General requirements
EMC Directive 89/336/EEC
Low Voltage Directive Directive 2006/95/EC
C-37
G7 USER MANUAL
D. DEFINITIONS AND FILTER CHARACTERISTICS
D.1 Definitions and formulae
D.1.1 Basic symbols and notation
T-
current period of the measurement.
Tb -
period after which the results are saved in the logger set in the LOGGER STEP (path:
MENU / INPUT / MEASUREMENT SETUP / LOGGER STEP).
Tc -
period of the measurement is set in the INTEGR. PERIOD (path: MENU / INPUT /
MEASUREMENT SETUP / INTEGR. PERIOD).
Te -
exposure time (period during which a person is exposed to the action of noise).
This parameter can be set in the EXPOSURE TIME (path: MENU / SETUP /
EXPOSURE TIME). The available values are from 1 minute to 8 hours with 1 minute step.
T8h -
period equal to 8 hours (28 800 seconds).
τ-
detector time constant is set in the DETECTOR (equal to IMPULSE, FAST or SLOW
in the case of sound mode and equal to 100 ms, 125 ms, 200 ms, 500 ms, 1 s, 2 s, 5 s
or 10 s in the case of vibration mode; path: MENU / INPUT / PROFILE x / DETECTOR).
The available values are equal to IMPULSE, FAST or SLOW.
a W (t ) - the temporary value of the measured sound with the weighting filter W (equal to A, C or Z
in the case of sound mode and equal to HP1, HP3, HP10, KB, Wk, Wd, Wc, Wj, Wm,
Wh, Wg, Wb in the case of vibration mode; path: MENU / INPUT / PROFILE x / FILTER)
on the input of the RMS detector.
p W (t ) - the temporary value of the measured sound with the weighting filter W (equal to A, C or Z
in the case of sound mode and equal to HP1, HP3, HP10, KB, Wk, Wd, Wc, Wj, Wm,
Wh, Wg, Wb in the case of vibration mode; path: MENU / INPUT / PROFILE x / FILTER)
on the output of the RMS detector calculated from the equation:
1 t
t −t
p W (t ) =
a 2W (t x )exp x
dt x
τ
τ
−∞
1
2
∫
where:
tx -
time (variable of the integration).
rW (t ) =
a W (t )
p W (t )
p0 -
the reference value equal to 20 µPa.
Q-
the exchange rate in decibels equal to 2, 3, 4 or 5 and is set in the EXCHANGE RATE
(path: MENU / INPUT / DOSIMETER SETUP / EXCHANGE RATE). The value of Q
influences the calculations of dose meter results, namely DOSE, D_8h and LAV.
The exposure rate equal to 3 complies with ISO R 1999 “Assessment of Occupational
Noise Exposure for Hearing Conservation Purposes”, while Q equal to 5 complies
with the American “Occupational Safety and Health Act” – OSHA. The value of q used
in the calculations of DOSE, D_8h and LAV is taken from the formula:
path : MENU / SETUP / RMS INTEGRATION / LINEAR
path : MENU / SETUP / RMS INTEGRATION / EXPONENTIA L
Q
q = log 2
10
for
Q≠3
for
Q=3
D-1
G7 USER MANUAL
_
LT -
the threshold sound level is set in the THRESHOLD LEVEL (path: MENU / INPUT /
DOSIMETER SETUP / THRESHOLD LEVEL). The available values are as follows: None,
75 dB, 80 dB, 85 dB or 90 dB.
Lc -
the criterion sound level is set in the CRITERION LEVEL (path: MENU / INPUT /
DOSIMETER SETUP / CRITERION LEVEL). The available values are as follows: 80 dB,
84 dB, 85 dB or 90 dB.
L(t ) -
sound level (a function of time) measured with the selected time constant (IMPULSE,
FAST or SLOW; path: MENU / INPUT / PROFILE x / FILTER) and the weighting filter
(equal to A, C or Z) calculated from the formula:
L(t ) = 20 log
L d (t ) -
p W (t )
p0
sound level (a function of time), depends on the selected threshold level. In the case when
the None option was selected:
L d (t ) = L(t )
In the other cases (when the THRESHOLD LEVEL (path: MENU / INPUT / DOSIMETER SETUP /
THRESHOLD LEVEL) is equal to 75 dB, 80 dB, 85 dB or 90 dB) this sound level is taken
from the formula:
L(t )
L d (t ) =
− ∞
for
for
L(t ) ≥ L T
L(t ) < L T
D.1.2 Definitions of the quantities measured in sound mode
PEAK value
The PEAK value (Peak Sound Pressure or Peak Sound Level) depends on the weighting filter W
(equal to A, C or Z) and is calculated for the given T from the formula:
a (t )
PEAK = 20 log max T W
p 0
In the case of the PEAK value saved as the main result T = Tc. When the PEAK value is saved
in the files of the logger (time history) - T = Tb.
SPL function
The SPL function (Sound Pressure Level) - gives an equivalent of the Sound Level Meter
according to the IEC 651 Standard (meeting the requirements for the Type "1" instrument). The value
of the functions depends on the weighting filter W (equal to A, C or Z; path: MENU / INPUT / PROFILE x /
FILTER) and is calculated from the formula:
p (t )
SPL = 20 log max T1 W
p0
where:
T1 -
D-2
the last second of the measurement.
G7 USER MANUAL
MAX result
The MAX result means the maximal value on the detector output for the integration period.
The MAX result for the period of 1 second is equal to the value of the SPL function. The MAX result
is calculated according to the formula:
p (t )
MAX = 20 log max T W
p0
In the case of the MAX value saved as the main result T = Tc. When the MAX value is saved
in the files of the logger (time history) - T = Tb.
MIN result
The MIN result is calculated according to the formula:
p (t )
MIN = 20 log minT W
p0
In the case of the MIN value saved as the main result T = Tc. When the MIN value is saved
in the files of the logger (time history) - T = Tb.
LEQ function
The LEQ function enables the user to calculate the RMS value of sound pressure in the given time
period. The instrument operates as the standard Integrating Sound Level Meter and conforms
to the IEC 804 Standard (meeting the requirements for the Type 1 instrument). The value of the LEQ
function is calculated according to the formula:
1
1T
2
2
LEQ = 20 log
(rW (t ) p 0 ) dt
T
0
In the case the LEQ value saved as the main result T = Tc.
∫
Note: For T = Tb the LEQ values are saved in the files of the logger (time history)
as the RMS results (see below).
RMS result
The RMS result, saved in the logger’s file, is calculated according to the formula of the LEQ
function. The value of the RMS result is calculated according to the formula:
1
RMS = 20 log
Tb
(rW (t ) p 0 )2 dt
0
Tb
1
2
∫
SEL result
The SEL result (Sound Exposure Level) is essentially the subset of the LEQ function. Its value
is equal to the LEQ result referred to the integration time equal to one second
(so, for the INT. TIME=1 s, SEL is always equal to LEQ). The value of the SEL function is calculated
according to the formula:
D-3
G7 USER MANUAL
_
1
T
2
T [s]
2
SEL = 20 log (rW (t ) p 0 ) dt = LEQ + 10 ⋅ log
1 [s]
0
In the case of the SEL value saved as the main result T = Tc. The SEL value is not saved
in the files of the logger (time history).
∫
Ltm3 and Ltm5 results
The Ltm3 and Ltm5 results (Takt-Maximal Levels) are calculated according to the German standard
TA Larm.
LEPd result
The LEPd result (Exposure level related to 8-hours working day) is calculated on the base
of the LEQ from the formula:
T
LEPd = LEQ + 10 ⋅ log e
T8h
OVL result
The OVL result (Overload) presents the percentage of the overloaded input signal, which occurred
during the selected Tc - measurement time set in the INTEGR. PERIOD (path: MENU / INPUT /
MEASUREMENT SETUP / INTEGR. PERIOD).
Statistical Levels Ln
The noise level L(t) is the continuous random variable. The probability that the temporary noise
level L(t) belongs to the interval L k , L k + ∆L is called the class density and it can be expressed
by the equation:
Pk [ Lk ≤ L(t ) ≤ Lk + ∆L] =
n
∑ ∆t
i
P
i =1
where:
∆t i
- time intervals, in which the noise level L(t ) ∈ Lk , L k + ∆L occurs,
∆L
P
- so-called class interval or distribution class of the series,
- total observation period.
In the case when the class interval approaches infinity, the probability of L(t) tends
to the probability of Lk . In practice, ∆L value is strictly determined and it depends mainly
on the dynamics of the measurements performed in the instrument. In G7 instrument, there are 120
classes and the width of each class is equal to 1 dB.
The histogram is the set of the class density values calculated for all classes. In the G7 instrument
the histogram is saved in the result files if the SAVE STATISTICS (path: MENU / FILE / SAVE OPTIONS /
SAVE STATISTICS) is activated (cf. the detailed description of the relevant table in App. B).
The statistical distribution function, which determines the probability (expressed in %) of the noise
occurrence on the level equal or less than Lk + ∆L is given by the formulae:
[
] ∑ Pk (L)
P L(t ) ≤ L j =
j
k =1
The cumulative density function, expressed by the equation:
[
]
[
P L(t ) > L j = 1 − P L(t ) ≤ L j
]
is directly used to determine so-called statistical levels Ln or position parameters of the distribution.
D-4
G7 USER MANUAL
The Ln is the certain boundary level
surpassed by the temporary noise level
values in not more than n% of
the observation period.
Cumulative Density
97
Example: Let us assume that L35 is
equal to 76.8 dB. It means that during
the measurements the noise level 76.8 dB
was exceeded in not more than 35%
of the observation period.
The display in G7 instrument has only
64 pixels on the vertical axis and 128
on the horizontal one. It is obvious that
the change of the axes is more suitable for
the presentation of 99 statistical levels. In this
case, the user has to draw the vertical cursor
and the value on it gives the required
statistical level (the value of the noise level,
which happened during the performed
measurements in not more than selected
percentage of the observation period).
85
79
73
67
61
Probability
The cumulative density function
for the exemplary data is presented in Figure
on the right side. In order to determine the Ln
level one has to draw the horizontal cursor
and find out the crossing point between
the cumulative density function and
the cursor. In G7 instrument the user can
determine 99 statistical levels - from L01 to
L99 (1% step of observation period).
91
55
Test
49
43
37
31
25
19
13
7
1
35,00 45,00 55,00 65,00 75,00 85,00
Sound Level
Ln presentation in G7
Sound Level
85,00
75,00
65,00
Test
55,00
45,00
35,00
1
9
17 25 33
41 49 57
65 73 81
89 97
Statistical Levels Ln
Two presentation modes of the statistical levels are available in the G7 instrument. In both modes,
the Ln values, selected by the cursor, are displayed in the bottom line together with its value and units
(dB). The P value indicating the observation period equal to 100 ms (it means that the statistical results
are updated every 100 ms) is placed at the end of the bottom line. The profile’s number the statistics are
D-5
G7 USER MANUAL
_
taken from, the RMS detector (Lin., or Exp.: Fast, Slow or Imp.), the filter’s name (A, C or Z) and real
time are displayed on the right side of the view in the first presentation mode. The selection of the profile
is made by pressing the <SHIFT> and <
> or the <SHIFT> and <
> push-buttons. The same result can
be achieved after pressing the <ALT> and <
> or <ALT> and <
> push-buttons.
Results shown in the first presentation mode of statistical levels
The selection of the Ln to be displayed is done by pressing the <
>, <
> push-buttons.
The statistics L01 is immediately available after pressing the <SHIFT> and <
> while the L99 - after
pressing the <SHIFT> and <
> push-buttons.
<
>+<SHIFT>
<
>+<SHIFT>
Results shown in the second presentation mode; the selection of the statistical level
The change of the presentation mode is done by pressing the <ALT> and <
> or the <ALT> and
<
> push-buttons. The second presentation mode of statistical levels differ slightly from the first one:
the description on the left side is shorter but on the right side the value of the statistical levels are shown.
<
>+<ALT>
<
>+<ALT>
...
<
>+<ALT>
...
Results shown in both presentation modes of statistical levels; the change of the mode
D.1.3 Definitions of the results measured in dosimeter mode
DOSE result
The DOSE result is the quantity of noise received by the worker, expressed as the percentage
of the whole day acceptable value. This result is calculated from the formula:
T
100 %
DOSE =
10
T8h
∫
L d (t )− L c
q
dt
0
D_8h result
The D_8h result is the quantity of noise received by the worker during 8 hours. This result
is calculated from the formula:
D-6
G7 USER MANUAL
T
100 %
D _ 8h =
10
T
∫
L d (t )− L c
q
dt =
0
T8h
⋅ DOSE
T
LAV result
The LAV result is the average level of the acoustic pressure for the given time period
of the measurement. This result is calculated from the formula:
T L d (t )
1
LAV = q ⋅ log
10 q dt
T 0
In the case of Q (the exchange rate) equal to 3 the LAV result has the same value as LEQ
(if the EXPONENTIAL option is selected in the RMS INTEGRATION (path: MENU / SETUP /
RMS INTEGRATION).
∫
TLAV result
The TLAV result is the average level of the acoustic pressure of the measurement. This result
is calculated from the formula:
T L d (t )
LAV = q ⋅ log 10 q dt
0
∫
SEL8 result
The SEL8 result is the SEL result corresponding to the integration time equal to 8 hours.
The SEL8 result is calculated on the base of the LEQ according to the formula:
SEL8 = LEQ + 10 ⋅ log
T8h [s]
1[s]
PSEL result
The PSEL result (individual Sound Exposure Level to the noise) is equal to the standing sound level
in a measurement period. The PSEL result is calculated on the base of the LEQ according to the formula:
PSEL = LEQ + 10 ⋅ log
T
T8h
E result
The E result (Exposition) represents the amount of the acoustical energy received by the worker
2
and it is expressed in the linear units (Pa h. The E value is calculated according to the formula:
E=
T[s] 2
p o ⋅ 10
3600
LEQ
10
E_8h result
The E_8h result (Exposition in 8 hours) represents the amount of the acoustical energy received
by the worker during 8 hours. The E_8h value is calculated according to the formula:
E _ 8h = 8[h]
⋅ p 2o
LEQ
⋅ 10 10
2
The E_8h result is expressed in the linear units (Pa h).
D-7
G7 USER MANUAL
_
D.1.4 Definitions of the quantities measured in vibration mode
PEAK value
The PEAK value is calculated for the given T from the formula:
PEAK = max T a W (t )
In the case of the PEAK value saved as the main result T = Tc. When the PEAK value is saved
in the files of the logger (time history) - T = Tb.
P–P value
The P–P result, saved in the logger’s file, is calculated according to the formula:
P − P = max T (0, a W (t )) − min T (0, a W (t ))
For the P–P result saved in the files of the logger (time history) T = Tb.
MAX result
The MAX result, saved in the logger’s file, is calculated according to the formula:
MAX = max Tb (p W (t ))
The MAX main result is calculated according to the formula:
MAX = max T (p W (t )) for τ ≠ 1 second
MTVV result
The Maximum Transient Vibration Value - MTVV, saved as the main result, is defined (according
to the ISO 8041 standard) as:
MTVV = max T (p W (t )) for τ = 1 second
RMS result
The RMS result is calculated according to the formula:
1
1T
2
2
RMS =
r (t ) dt
T W
0
For the RMS result saved in the files of the buffer (time history) T = Tb.
∫
VDV result
The fourth power vibration dose value (VDV) expressed in meters per second taken to the power
1.75
of 1.75 (m/s ) is calculated from the formula:
T
4
VDV = rW
(
t ) dt
0
∫
D-8
1
4
G7 USER MANUAL
D.2 Frequency characteristics of the implemented digital filters
D.2.1 Digital weighting filters implemented in sound mode
The sound mode is selected in the MENU / FUNCTION / MODE window (SOUND METER).
=>
=>
MENU, FUNCTION and MODE windows; sound mode selection
The weighting filters, which are available in sound mode (Z, A, and C) are selected in the MENU /
INPUT / PROFILE (x) windows.
▼
▼
▼
INPUT and PROFILE (x) windows; weighting filter selection
Z:
cut-off frequency: 10.0 Hz / -3.0 dB.
Full band frequency characteristics of the Z filter implemented in the instrument
D-9
G7 USER MANUAL
_
Low band frequency characteristics of the Z filter implemented in the instrument
A
type 1 according to the IEC 651 standard.
Frequency characteristics of the A filter implemented in the instrument
D-10
G7 USER MANUAL
C
type 1 according to the IEC 651 standard.
Frequency characteristics of the C filter implemented in the instrument
D-11
G7 USER MANUAL
_
The FREE FIELD filter is set in MENU / SETUP / COMPENSATION / FREE FIELD position
=><ENTER>=>
SETUP and COMPENSATION FILTER windows; the activation of the FREE FIELD filter
Frequency characteristics of the FREE FIELD filter implemented in the instrument
The DIFFUSE FIELD filter is set in MENU / SETUP / COMPENSATION FILTER / FREE FIELD
position
=><ENTER>=>
SETUP and COMPENSATION FILTER windows; the activation of the DIFFUSE FIELD filter
D-12
G7 USER MANUAL
Frequency characteristics of the DIFFUSE FIELD filter implemented in the instrument
The ENVIRONMENTAL filter is set in MENU / SETUP / COMPENSATION FILTER / OUTDOOR
ENVIRON. position.
=><ENTER>=>
SETUP and COMPENSATION FILTER windows; the activation of the OUTDOOR ENVIRONMENTAL
filter
D-13
G7 USER MANUAL
_
Frequency characteristics of the ENVIRONMENTAL filter implemented in the instrument
The AIRPORT filter set in MENU / SETUP / COMPENSATION FILTER / OUTDOOR AIRPORT
position.
=><ENTER>=>
SETUP and COMPENSATION FILTER windows; the activation of the OUTDOOR AIRPORT filter
Frequency characteristics of AIRPORT filter implemented in the instrument
D.2.2 Digital weighting filters implemented in vibration mode
The vibration mode of the G7 instrument is selected in the MENU / FUNCTION / MODE window
(VIBRATION METER)
=>
=>
MENU, FUNCTION and MODE windows; vibration mode selection
D.2.2.1 Digital filters implemented in the vibration mode for the acceleration measurements
D-14
G7 USER MANUAL
The weighting filters, which are available in vibration mode are selected in the MENU / INPUT /
PROFILE (x) windows. The first three of them (HP1, HP3, and HP10) are dedicated for the acceleration
measurements of the vibration signal in the different frequency ranges.
▼
▼
▼
INPUT and PROFILE (x) windows; weighting filter selection in acceleration measurements
The HP1 filter is used for the acceleration measurements (the vibration signal) in the frequency
range from 1 Hz to 20 kHz.
Characteristics of the HP1 digital filter implemented for the acceleration measurements in the VM
The HP3 filter is used for the acceleration measurements (the vibration signal) in the frequency
range from 3.5 Hz to 20 kHz.
D-15
G7 USER MANUAL
_
Characteristics of the HP3 digital filter implemented for the acceleration measurements in the VM
The HP10 filter is used for the acceleration measurements (the vibration signal) in the frequency
range from 10 Hz to 20 kHz.
Characteristics of the HP10 digital filter implemented for the acceleration measurements in the VM
D-16
G7 USER MANUAL
D.2.2.2 Digital filters implemented in the vibration mode for the velocity measurements
The following four filters (Vel1, Vel3, Vel10 and VelMF) are dedicated for the velocity
measurements of the vibration signal in the different frequency ranges.
PROFILE(1) windows; the selection of the weighting filter in velocity measurements
The Vel1 filter is used for the velocity measurements (the vibration signal) in the frequency range
from 1 Hz to 20 kHz.
Characteristics of the Vel1 digital filter implemented for the velocity measurements in the VM
The Vel3 filter is used for the velocity measurements in the frequency range from 1 Hz to 20 kHz.
Characteristics of the Vel3 digital filter implemented for the velocity measurements in the VM
D-17
G7 USER MANUAL
_
The Vel10 filter is used for the velocity measurements in the frequency range from 1 Hz to 20 kHz.
Characteristics of the Vel10 digital filter implemented for the velocity measurements in the VM
The VelMF filter is used for the evaluation of the state of the machines. This filter is used for the
measurements in the frequency range from 10 Hz to 1000 Hz and conforms to the ISO 10816 standard.
Characteristics of the VelMF digital filter implemented for the velocity measurements in the VM
D-18
G7 USER MANUAL
D.2.2.3 Digital filters implemented in the vibration mode for the displacement measurements
The following three filters (Dil1, Dil3 and Dil10) are dedicated for the displacement measurements
of the vibration signal in the different frequency ranges.
PROFILE(1) windows; the selection of the weighting filter in displacement measurements
The Dil1 filter is used for the displacement measurements in the frequency range [1 Hz to 20 kHz].
Characteristics of the Dil1 digital filter implemented for the displacement measurements in the VM
The Dil3 filter is used for the displacement measurements in the frequency range [1 Hz to 20 kHz].
D-19
G7 USER MANUAL
_
Characteristics of the Dil3 digital filter implemented for the displacement measurements in the VM
The Dil10 filter is used for the displacement measurements in the frequency range [1 Hz to 20 kHz].
Characteristics of the Dil10 digital filter implemented for the displacement measurements in the VM
D.2.2.4 Digital filters used in the HUMAN VIBRATION investigations
The HUMAN VIBRATION FILTERS are the optional feature of the G7 instrument. They should be
activated by the introduction of a special code, unique for the serial number of the meter. The mentioned
code has to be input in the ENTER CODE window opened after pressing the <ENTER> push-button in the
SETUP list with the HUMAN VIB. FILT. text selected.
=>
SETUP and ENTER CODE windows; the activation of human vibration option
After the successful introduction of the activation code, the HUMAN VIB. FILT. text is removed
from the SETUP list and will not be visible any more even after the upgrade of the internal software.
SETUP windows after the successful activation of human vibration option
In the G7 instrument there are various filters conforming to old ISO 2631 and ISO 8041 (version
dated as 1990-07-15) standards (W–Bxy, W–Bz, H–A and W–Bc), still used in certain countries for the
assessment of the influence of the vibration signal on the human body. The mentioned above filters can
be set in the same manner as other filters, in the PROFILE (x) windows.
D-20
G7 USER MANUAL
PROFILE(1) windows; the selection of old weighting filters in human vibration option
The mentioned above filters can be set in the same manner as the other filters, in the PROFILE (x)
windows. The first one of them, the W–Bxy filter, is used for the assessment of the influence of the
vibration signal on the human body in the horizontal direction. It conforms to the ISO 2631 and ISO 8041
(rev. dated as 1990-07-15) standards.
Characteristics of the W-Bxy digital filter implemented in the instrument in the VM
The W–Bz filter is used for the assessment of the vibration signal influence on the human body
in the vertical direction. It conforms to the ISO 2631 and ISO 8041 (rev. dated as 1990-07-15) standards.
Characteristics of the W-Bz digital filter implemented in the instrument in the VM
D-21
G7 USER MANUAL
_
The H–A filter is used for the assessment of the influence of the local vibration signal on the human
body. It conforms to the ISO 2631 and ISO 8041 (rev. dated as 1990-07-15) standards.
Characteristics of the H-A digital filter implemented in the instrument in the VM
The W–Bc filter is used for the assessment of the influence of the vibration signal on the human
body during the seat-back measurements. It conforms to the ISO 2631 and ISO 8041 (rev. dated as 199007-15) standards.
Characteristics of the W-Bc digital filter implemented in the instrument in the VM
D-22
G7 USER MANUAL
In the G7 instrument there are also various filters conforming to new ISO 2631-1-97 and ISO 8041
(revision dated as 1999-11-01) standards (Wk, Wd, Wc, Wj, Wm, Wh, Wg and Wb). They are currently
used in many countries for the assessment of the influence of the vibration signal on the human body.
PROFILE(1) windows; the selection of new weighting filters in human vibration option
The mentioned above filters can be set in the same manner as other filters, in the PROFILE (x)
windows. The Wk filter is used for the assessment of the influence of the vibration signal on the human
body in the z direction and for vertical recumbent direction. It conforms to the ISO 2631-1-97 and
ISO 8041 (revision dated as 1999-11-01) standards.
Characteristics of the Wk digital filter implemented in the instrument in the HVM
D-23
G7 USER MANUAL
_
The Wd filter is used for the assessment of the influence of the vibration signal on the human body
in the x and y directions and for horizontal recumbent direction. It conforms to the ISO 2631-1-97 and
ISO 8041 (revision dated as 1999-11-01) standards.
Characteristics of the Wd digital filter implemented in the instrument in the HVM
The Wc filter is used for the assessment of the influence of the vibration signal on the human body
during the seat-back measurements. It conforms to the ISO 2631-1-97 and ISO 8041 (revision dated as
1999-11-01) standards.
Characteristics of the Wc digital filter implemented in the instrument in the HVM
D-24
G7 USER MANUAL
The Wj filter is used for the assessment of the influence of the vibration signal under the head of
the recumbent person. It conforms to the ISO 2631-1-97 and ISO 8041 (revision dated as 1999-11-01)
standards.
Characteristics of the Wj digital filter implemented in the instrument in the HVM
The Wm filter is used for the assessment of the influence of the vibration signal on the human body.
It conforms to the ISO 2631-1-97 and ISO 8041 (revision dated as 1999-11-01) standards.
Characteristics of the Wm digital filter implemented in the instrument in the HVM
D-25
G7 USER MANUAL
_
The Wh filter is used for the assessment of the influence of the vibration signal on the human body.
It conforms to the ISO 2631-1-97 and ISO 8041 (revision dated as 1999-11-01) standards.
Characteristics of the Wh digital filter implemented in the instrument in the HVM
The Wg filter is used for the assessment of the influence of the vibration signal on the human body.
It conforms to the BS 6841:1987 standard.
Characteristics of the Wg digital filter implemented in the instrument in the HVM
D-26
G7 USER MANUAL
The Wb filter is used for the assessment of the influence of the vibration signal on the human body.
It conforms to the ISO/FDIS 8041:2004(E) standard.
Characteristics of the Wb digital filter implemented in the instrument in the HVM
D.2.2.4 Digital filter used for vibration measurements on ships
PROFILE(1) window; the selection of the KB filter
The KB filter is used for the vibration measurements on ships. Its characteristics, presented below,
is taken from the formulae: KB = W–Bc +28.9 dB.
Characteristics of the KB digital filter implemented in the instrument in the VM
D-27
G7 USER MANUAL
D.2.3 Digital HP filter implemented in 1/1 & 1/3 OCTAVE and FFT analysis
Characteristics of the HP digital filter implemented in the instrument in 1/1 OCTAVE, 1/3 OCTAVE and
FFT analysis
D.2.4 Digital 1/1 OCTAVE and 1/3 OCTAVE filters implemented in the G7
Characteristics of the exemplary digital 1/1 OCTAVE filter implemented in the instrument
D-28
_
G7 USER MANUAL
Characteristics of the exemplary lower digital 1/3 OCTAVE filter implemented in the instrument
Characteristics of the exemplary middle digital 1/3 OCTAVE filter implemented in the instrument
Characteristics of the exemplary upper digital 1/3 OCTAVE filter implemented in the instrument
D-29