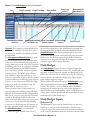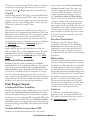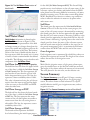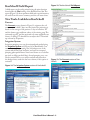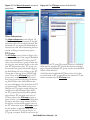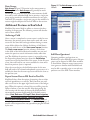
1
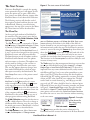
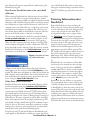
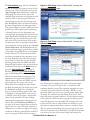
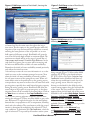
KanSched2
An ET-Based Irrigation Scheduling Tool
Danny H. Rogers and Mahbub Alam
Biological and Agricultural Engineering
K-State Research and Extension
KanSched2 is a program designed to help monitor the
root zone soil profile water balance and schedule irrigation events on a field using evapotranspiration (ET)
data. The program can also be used to monitor the soil
profile water content of non-irrigated fields. ET-based
irrigation scheduling can help determine when and
how much irrigation water to apply. The basic process
involves using data on crop water use (crop evapotranspiration or ETc), rainfall, and soil water storage
to assess when an irrigation event is needed and how
much water could be applied.
The original version of KanSched program was
developed as part of the Mobile Irrigation Lab,
which is supported by a partnership between K-State
Research and Extension, the Kansas Water Office
with State Water Plan Funds, Kansas Water Resources
Research Institute, the Kansas Corn Commission,
and the Ogallala Aquifer Program . This new release,
KanSched2, offers some new features, in response to
requests from irrigators. These include additional crop
options, including a built-in feature to account for
cutting cycles on alfalfa, an irrigation forecast, irrigation fuel cost accounting, and a water record page for
individual fields. However, users of the first version of
KanSched should find KanSched2 very familiar and
have little or no difficulty in adapting.
General Overview
Irrigation scheduling that uses evapotranspiration
(ET) information is much like checkbook accounting
procedures where the valued commodities are tracked.
In this case, soil water, rather than money, is the valued
commodity and the debit is crop water use while
credits are rainfall and irrigation. One notable difference is that the water balance can be in excess as well
as deficient. ETc, short for crop evapotranspiration, is
the amount of water that a crop withdraws from the
soil water reserve in the crop root zone. Deposits to
the soil water reserve are rainfall and applied irrigation.
The major goal of the accounting procedure is to help
the irrigation manager keep the amount of water in
reserve above a minimum acceptable soil water balance
level to prevent water stress to the growing crop. The
upper limit to the account is the amount of water that
can be physically stored in the root zone area of the
soil profile. Deposits of water, once the upper limit is
exceeded, result in the water being lost as either deep
percolation or surface runoff.
Irrigation scheduling can help minimize deep
percolation losses, although even the most rigorously
followed schedule cannot prevent all losses since large
rainfall events can exceed soil water storage capacity
by themselves. The benefits of irrigation scheduling
generally translate into increased net returns through
several possible avenues. Irrigation scheduling may
reduce irrigation labor and equipment operation
pumping cost, and may result in improved yields
due to less water stress or less loss of fertilizer due to
leaching.
One of the major obstacles to adoption of on-farm
irrigation scheduling has been the time management
problem of gathering, processing, and implementing scheduling on a daily irrigation cycle period.
Computer technology presents the opportunity for
information gathering, transferring, and processing to
be done much more easily, efficiently, and sometimes
automatically. Scheduling software, communication, and control technology exists that can provide
management recommendations which could then
be remotely implemented. This manual describes the
input and output windows of KanSched2.
KanSched2 User’s Manual – The Start Screen
Figure 1. The start screen of KanSched2.
Each time KanSched2 is started, the opening
screen pictured in Figure 1 will appear. At this
point, the options are to open a field collection, create a new field collection, import older
KanSched data or load a demo field collection.
The following sections will describe each of
these options in detail and how they are used
in KanSched2. However, several functions
appear across the top of the screen in the Menu
bar. These functions will be described first.
The Menu Bar
At the top of each window in KanSched2 is
the menu bar. The start screen’s menu bar has
five main menus: File, Field Collection, Field
Options, Tools, and About.
The File menu contains commands of 1) New
field collection, 2) Open field collection, 3) Save,
4) Save As, 5) Print, 6) Print setup, 7) Import
Older KanSched and 8) Exit KanSched. Items 1,
2, and 7 can also be managed from the opening
KanSched2 screen and are discussed below.
The Save function records all updates made to
KanSched2 while Save As saves the updates
with new names or locations. The updates can
also be made by clicking on the save bar on
top of the pages that follow the start screen.
This save bar appears whenever changes have
been made. KanSched2 has a built in printable report accessed by the Print button. The
Print Setup allows access of the printer control
options.
KanSched2 can be exited using the Exit
KanSched on the File menu but it is more
easily accomplished by clicking the x button
at the top right corner of the KanSched
window. The
button to the left expands the
KanSched2 screen to the maximum screen size
of the computer, while the
will minimize
KanSched2 to the toolbar to allow you use of
other programs without exiting KanSched.
The Field Collection menu has the function to
rename a field collection. The tool to change to
a different field collection, once the user is past
the initial start screen of KanSched2, is located
under the File menu as described above.
The Field Options menu allows Start a new
season, Season options of Change season
year and Delete a season, and Delete this field. Start a new
season advances all the dates in the fields of the field collection forward by one year and retains the previous season’s
information intact under that year. The field data for previous
seasons is accessed by using the Season drop down menu just
above the Field Setup control bar on the left hand side of the
screen. In the first year of use, there will only be one season
available for view unless data from previous years is imported.
The functions in the Season options would most likely be used
in event of entry errors.
The Tools menu has data management functions to move data
into or out of KanSched2, using either Import ET or Export
Budget Page or Load Demo Field Collection. ET data can be
imported from any comma delimited text file, easily created
with Microsoft Excel (.csv) or any other spreadsheet or text
editor (.txt). The ET data file must have the date listed first,
followed by the ET reading, separated by a comma. Each pair
of date and ET value should be on a separate line. The date
can be listed in several formats (e.g. mm/dd/yyyy, mm-ddyyyy, m-d-yy), ET values should be listed as a decimal point
followed by at least one digit. Formatting examples are shown
in Figure 2. Export Budget Page creates the types data files
described for Import ET. Load Demo Field Collection is the
same option as discussed in the Other Start Screen Functions
but allows the users to access this function without returning
to the start screen.
Figure 2. Examples
of the format for
files when using
Import ET.
The About menu provides the version information for
KanSched2 and the contact information for K-State Research
KanSched2 User’s Manual – and Extension Engineers responsible for administering the
KanSched2 program.
Start Screen: For the first time or for a new field
collection
When entering KanSched2 for the first time, the most likely
course of action will be to create a field collection. A field
collection is a grouping of fields. an individual producer would
likely have only one field collection, while a consultant would
most likely want to make a field collection for each client. In
computer terms, the field collection is a file that can be easily
transferred from computer to computer. The collection contains all the data needed for KanSched2 to operate. All information for all fields within a collection is transferred.
To start a new field collection, click the control bar labeled
Create new field collection. A new window (Figure 3) will
appear asking for the field collection name. After typing a
name and either returning the enter button or clicking OK, a
similar window will appear to ask for a field name. This will
be the first field in that collection. Once this name is entered,
KanSched2 will advance to the Field Setup Screen, where the
information on the field and crop will be entered, as shown
Figure 3. Window for naming a field collection.
in Figure 4 and will be discussed later. The field collection
name appears on the screen just below Field Options on the
toolbar. The field name will appear in a blue bar just below the
field collection name and the date. Once a field collection has
been established, the collection can be opened from the start
screen using the Open Field Collection button.
Other Start Screen Functions
year of KanSched2. Be certain to enter crop
emergence and water budget start date data for
2006. ET and Rain groups will be discussed
later.
Entering Information into
KanSched
Before KanSched2 can begin tracking the
field’s soil water content and crop water usage,
it needs information about the crop, growing
season, and soil type for each field. This is
accomplished using a series of pages under
the Field Setup control, beginning with the
general information page. Once the field name
is entered, the crop type is entered. Click on
the down arrow on the right side of the crop
type box and the crops that have been preloaded into KanSched2 appear. Click on the
appropriate crop and it will be selected. The
ET and Rain Group options will be discussed
later. After selecting the crop, click on the
Next button. This advances KanSched2 to the
Season Dates information screen (See Figure
5).
KanSched2 has a new feature to allow additional crops to be entered into the crop type
list by clicking on the blue line of Add/Edit
custom crops. The use of this section requires
specialized information. Contact the authors
of KanSched2 if this option is needed. Their
contact information can be found by clicking
on the About button on the menu bar.
KanSched2 also has alfalfa as a crop option.
To accommodate the in-season cutting cycles
of alfalfa, a budget sheet column will appear
in KanSched2 to allow the cutting date to be
entered. This will re-start the crop growth cycle
within KanSched2. The season dates and crop
coefficient entry pages for alfalfa will request
slightly different information than for summer
planted crops. However the information entry
will follow the same format as described below.
KanSched2 does come with an initial field collection, which
can be activated by using the Load Demo Field Collection
button on the Start Screen. The historical field collection
contains the actual alfalfa reference ET (ETr) information
and rainfall data for three years from the Northwest Kansas
Research and Extension Center of Kansas State University at
Colby, Kansas. The years of record are 1996, 1998, and 2002.
These years represent low ETr and high rainfall, average ETr
and rainfall, and low rainfall and high ETr conditions respectively for the site. This data is provided so producers or water
managers have access to some actual data to use when familiarizing themselves with the KanSched program.
Even though the ET and rainfall data are identified by year,
it will appear in KanSched2 as a 2006 year season, the release
KanSched2 User’s Manual – Figure 4. Field Setup section of KanSched2, showing the
The Season Dates page asks for information
General Information page.
needed to describe the growing season for the
selected crop. Click on the down arrow at the
Crop Emergence date window and a calendar
will pop up. The arrows on the top of the
calendar allow movement to the proper month
and then click on the emergence date and
repeat the process for the water budget start
date. KanSched2 allows the option of starting
the water budget before the emergence date.
This option might be used if a deficit soil water
profile exists and irrigation prior to planting
is desired. In this case, the beginning crop
root zone and the managed root zone must be
equal. KanSched2 will indicate this automatically. Soil root zones will be discussed in the
next section. The season length of the crop is
Figure 5. Field Setup section of KanSched2, showing the
the next entry. Once an emergence date and a
Season Dates page.
season length is entered, click on the Calculate
Growth Stage Dates and KanSched2 will calculate important stage of growth dates needed
to determine the modifications to the weather
based reference ET information that will be
used later to determine the crop water use of
the crop. Remember the end of the growing
season refers to when the crop has reached
physiological maturity (no additional yield
potential) and not when it has reached harvest
conditions. Then click on the Next button to
go to the Soils and Roots page, Figure 6.
The first entry box on the Soils and Roots
page is Soil Texture. This box has a drop
down menu that allow the selection of the
appropriate soil type for the field. The soil
texture options are from the NRSC textural
classes found in the county soil surveys.
tion. The initial root depth at the start of the water budget
Many fields have multiple soil types within
is entered in the next box. Six inches is considered as the
the field. Generally the soil texture class used
minimum depth for entry. The maximum managed root zone
for KanSched would be the soil with the
is entered next and is limited to 48 inches. While it is true
lowest soil water holding capacity. This value
that many field crops have roots at much greater depths than
is displayed on the page when a soil texture
48 inches, the extraction amount below 48 inches is small,
is selected. Once the soil type is selected the
especially under irrigated conditions. Good irrigation managevalues for the available soil water holding
ment guidelines would not want to purposely put irrigation
capacity and the permanent wilting point are
water that deep into the soil profile. The managed root zone
shown. The initial Soil Water Availability at
can be much less due to either shallow rooted crops or soils
the start of the water budget date can now be
that limit root penetration due to texture or restrictive layers.
entered. In most cases, the initial condition is
The two options for handling the crop root zone are 1) grow
100 percent, or at least very high, since spring
the roots as would occur in the field or 2) establish the mature
conditions in Kansas generally have rainfall in
root zone at the start of the water budget and manage the
excess of crop needs and soil water evaporaKanSched2 User’s Manual – Figure 6. Field Setup section of KanSched2, showing the
Soils and Roots page.
Figure 7. Field Setup section of KanSched2,
showing the Crop Coefficient page.
Figure 8. Field Setup section of KanSched2,
showing the Advanced page.
soil water level for the entire zone throughout the irrigation season. The first option is the general practice when full
irrigation of the crops and normal early rainfall has occurred,
meaning the lower portions of the soil profile is at or near
field capacity (full water storage). KanSched2 will grow the
roots from the initial depth entered to maximum depth. The
maximum root depth will be at the stage of growth date of
Crop canopy cover exceeds 70 to 80% of the field area. As the
crop (and roots) grows, the root zone will be increasing and
the new root added will be at 100% soil water availability.
Remember the initial soil water availability entered previously
only effects the initial root zone.
A second way to enter the root zone information is to set the
initial root zone to the maximum managed root zone. Now
when the initial soil water availability is entered, it reflects
the soil water content of the managed root zone. When soil
water deficits exist in the profile prior to the growing season,
some producers may want to increase the soil water levels with
pre-irrigation, especially those with limited irrigation capacity
during the active growing season. KanSched2 will allow the
water budget to begin prior to crop emergence, so that these
irrigation events can be recorded in the water budget. Click on
the Next button to advance to the Crop Coefficients screen.
There are two common reference crop bases used for determining the reference ET. These are either alfalfa or grass reference. Reference ET might be thought of as the atmospheric
demand that a crop experiences due to temperature, humidity,
wind, and solar radiation. The actual water used by the crop of
interest is determined by multiplying the reference ET by a
crop coefficient. To determine the Crop Coefficients, select the
type of reference ET crop used by the weather station system
being accessed (Figure 7). Select either alfalfa
reference ET (ETr) or grass based reference
ET (ETo). Next, click on the Calculate Crop
Coefficients button. KanSched will then calculate the crop coefficient for each day of the
crop’s growing season. After the crop coefficients are calculated for the field, the other
control buttons appear along the left hand side
of the screen. The new control bars that have
appeared along the left hand side of the screen
available for use include Daily Budget, Season
Summary, Soil Water Chart, Forecast,
Irrigation System and Water Information.
However, one other Field Setup option is still
available. Click on the Next button to go to the
Advanced screen information.
Options available on the Advanced page
are Management Allowed Deficit (MAD),
the Irrigation Efficiency and the Rainfall
KanSched2 User’s Manual – Figure 9. The Daily Budget section of KanSched2.
Day
Ref ET (in/day) Crop ET (in/day)
Calculated Soil Water
Avail (%)
Rain (inches)
Gross Irrig
(inches)
Calculated Available Root Zone Water Effective Rain
Soil Water (in)
Deficit (inches)
(inches)
Discount. These options contain default values
which can be modified if desired. If no other
information is available, the default values are
recommended.
The Management Allowed Deficit is a guideline on what percentage of the available water
in the soil can be removed by the crop without
causing water stress to the crop. Most irrigation
scheduling goals are to try to prevent soil water
levels from dropping below MAD; however,
this is not always possible with low irrigation
capacity systems. The MAD value will vary
across different crops and according to how
risk averse a producer might be, but the general
recommendaiton for commonly grown crops in
Kansas is to use a 50 percent MAD. For high
value crops, such as horticultural crops, the
MAD may be 40 percent or less.
There are many sources of information on
irrigation efficiency, including several K-State
Research & Extension bulletins. (See the MIL
Web site at www.oznet.ksu.edu/mil.) The value
needed by KanSched should be selected to
reflect a seasonal daily average for the irrigation
system in use. Some producers participating
in various cost share programs will need to use
the value specified by the contracting agency.
The Rainfall Discount is an estimate of
how much any given rainfall event is lost to
Measured Soil
Water Avail (%)
Total Cost ($)
quick surface evaporation. Any rainfall amount entered into
the daily water budget will be reduced by KanSched by the
Rainfall Discount value. Some producers prefer to use the
gross rainfall amount catch in the field rain gauge, but others
prefer to use the discount, especially producers enrolled in
some cost share programs and have their irrigation schedules
evaluated as part of continuing eligibility.
Daily Budget
The Daily Budget (Figure 9) consists of rows of input for
each day. These inputs include reference ET, rainfall, and gross
irrigation. As these inputs are entered into KanSched, it calculates the soil water that is available to a crop. The following
sections describe the individual budget page inputs requirements and the program’s output.
When alfalfa is the indicated crop, the Daily Budget screen
will have an additional column appear to the left of the date
column. This column is used to indicate when the alfalfa is
cut by using the mouse cursor to click on the appropriate
date. The date entry is indicated by a check mark. Whenever a
cutting date is marked, KanSched2 will re-initialize the crop
coefficient cycle of the alfalfa crop.
Daily Budget Inputs
Reference ET
The Reference ET values can be obtained from on-site measurements or from an automated weather station in your
county or region. This value needs to be entered for each day
of the season as KanSched tracks the soil water content. Daily
KanSched2 User’s Manual – ET values are required, but the ET values from several days
can be entered at one time. The reference ET can also be
updated using the ET Groups option that is described later.
Crop ET
After the daily reference ET value is entered, KanSched will
calculate and display the crop ET. This value is the amount of
water (in inches) the crop used during each of the listed days.
KanSched uses the crop coefficient values and the reference
ET values to calculate the crop ET value.
Rain
Whenever the crop receives rainfall, enter the value in the
Rain column for the appropriate day in KanSched. This value
will then be used to calculate the soil’s current water content.
Enter the on-site measured value of rainfall. If desired, a
rainfall discount can be automatically subtracted from this
measured value using the rainfall discount option available in
the Field Setup tool under the Advanced option tool.
Gross Irrigation
Input irrigation amounts into KanSched every time the
field is irrigated. This is a Gross Irrigation amount. The Gross
Irrigation amount will be multiplied by the irrigation efficiency value entered in the Advanced option of the Field
Setup tool.
Measured Soil Water Availability
KanSched gives the option of updating the Soil Water
Availability value. If an in-field measurement is observed, the
value can be entered into KanSched in the Measured Soil
Water Availability column. Remember, KanSched only tracks
one location in the field, usually the start point of an irrigation cycle. Soil water observations must be from the same
area as represented by KanSched. Any values entered into this
column will over-ride the value within KanSched and will be
the basis for the next set of water budget calculations.
Daily Budget Outputs
Calculated Soil Water Availability
KanSched’s calculation of the available water in the soil is displayed in the Calculated Soil Water Availability column. This
value can be defined as the percent of water that is available
for the crop to use from the available water profile. When this
value drops below the MAD value, the Calculated Soil Water
Availability numbers turn red. A value of zero (0%) represents
permanent wilting point (PWP), while 100% represents field
capacity.
water content is in the Calculated Available
Soil Water Content column. This value is an
estimate of approximately how much water
is in the soil that the crop can use before it
reaches the permanent wilting point (e.g. if
the Calculated Available Soil Water Content
value is 1.5 inches, this means that 1.5 inches
of water is available in the soil for the crop to
use). However, keep in mind that when the
water content reaches the MAD value, the crop
has withdrawn the readily available soil water
and the crop may begin to experience some
stress. However, most field crops do not suffer
major stress until the soil profile is much less
then 50% depleted.
Root Zone Water Deficit
How much water will it take to fill the
soil profile to full capacity? The Root Zone
Water Deficit value answers that question by
displaying how much water (in inches) the
managed root zone soil profile needs before
the water would be lost either to runoff or deep
percolation.
Effective Rain
How does KanSched handle rainfall events on a
soil that is already at field capacity? It calculates
the effective rain. Basically, when the soil profile
is at field capacity, any water that is applied to
the field will either run off or be lost in the soil
through deep percolation. KanSched keeps track
of the soil’s current profile status and will ignore
any rainfall or irrigation events that occur when
the soil root zone has reached field capacity.
This ensures that the program will not credit
the soil with more water than it can hold when
it receives many rainfall events (or one large
rainfall event) in a short period of time.
Total Cost
The fuel costs associated with irrigation
pumping can also be tracked in KanSched2.
This option is discussed in the later section on
the Irrigation System screen option.
Available Soil Water Content above PWP
Another way that KanSched interprets the soil’s current
KanSched2 User’s Manual – Figure 10. The Soil Water Chart section of
KanSched2.
for the field (Soil Water Storage at MAD). This line will help
provide an easy visual reference to the soil water status. As the
soil water content goes further and further below the MAD
value, plants have increasing difficulty in extracting soil water,
therefore increasing stress. As the water content drops below
MAD, KanSched has a function to reduces crop coefficient
value to reflect the reduction in water use by plants when
under water stress.
Soil Water
Soil Water Chart
Daily Budget information is charted on the
Soil Water Chart, shown in Figure 10. This
chart shows a visual representation of the field
soil water content as it changes throughout the
season. The rainfall and irrigation events are displayed at the bottom of the chart. The horizontal axis of the chart is labeled with the dates of
the crop season, while the vertical axis is in units
of inches of water contained within the defined
soil profile. The following section describes each
component of the Soil Water Chart.
Soil Water Storage at Field Capacity
The dark blue line that forms the upper boundary of the chart is called the Soil Water Storage
at Field Capacity line. This line represents the
total amount of water that the soil can hold
before deep percolation occurs. This line also
represents a water availability value of 100%.
This value is determined using the soil characteristics from the input screen and the depth
of the root zone, as are the PWP and MAD
values described next.
Soil Water Storage at PWP
The dotted green line represents the Calculated Soil Water
Content of the soil. As the days in the season progress, the
status of the soil’s water content is determined by monitoring
this dotted green line. As the line approaches the upper dark
blue line, the soil’s water content is increasing. Likewise, as the
dotted green line approaches the lower dark red line, the soil’s
water content is decreasing. A quick glance at the trend in the
dotted green line shows the status of the soil water content
and how much water might be available to the crop. One of
the general management goals is to maintain the field water
content above the MAD value until the end of the season.
Gross Irrigation
Each irrigation event is represented by a dark blue column on
the date the irrigation was received. The height of the column
reflects the amount of the irrigation event.
Rain
Much like the irrigation events, a light green column represents the rainfall events on the date the rainfall was received.
The height of the column reflects the amount of rain received.
The value plotted is the rain value, not the effective rain.
Season Summary
The Season Summary screen (Figure 11) keeps a running
total of the various water budget factors for the irrigation
season. The values shown are total reference ET, crop ET,
rainfall, effective rainfall, gross irrigation amounts, and net
irrigation amounts.
Figure 11. The Season Summary section of KanSched2.
The dark red line that forms the lower boundary of the chart is called the Soil Water Storage
at PWP line. This line represents the water
content of the soil where plants are unable to
extract water from the soil, causing them to
wilt and die. This line also represents a water
availability value of 0%.
Soil Water Storage at MAD
The dotted red line represents the MAD
level selected during the initial input process
KanSched2 User’s Manual – KanSched2 Field Report
Figure 12. The KanSched2 Field Report.
A field report can be easily printed using the print function
found under the File heading of the KanSched tool bar. The
report (Figure 12) shows pertinent field and crop information,
the totals from the season summary, and the soil water chart.
New Tools Available in KanSched2
Forecast
The Forecast screen, shown in Figure 13, estimates the soil
water status of a field 5 days into the future. The projection is
based on the average of the previous 5 days of reference ET
and the future crop coefficient values of the existing crop. The
estimated crop ET and the projected soil water availability are
shown. A sliding ET demand bar can adjust the ET demand
up or down by 20 percent.
Irrigation System
Irrigation pumping costs can be estimated and tracked using
the Irrigation System tool (Figure 14) of KanSched2. Cost
estimates, using the pumping rate, lift and pressure of the
system and the fuel type and price, are based on accepted
pumping plant performance criteria and shown as on a dollarper-inch or dollar-per-field basis. Actual pumping costs can
also be entered. These costs will be tracked and entered on
the budget sheet, under the fuel cost column, if this option is
activated.
Figure 13. The Forecast section of KanSched2.
Figure 14. The Irrigation System section of KanSched2.
KanSched2 User’s Manual – Figure 15. The Water Information section of
KanSched2.
Figure 16. The ET Groups section of KanSched2.
Water Information
The Water Information section (Figure 15)
of KanSched2 allows information on the well
and water right to be recorded, if desired. This
information is not required for KanSched2 to
function but could aid in maintaining business
records or filling out annual water reports.
ET Groups
The ET Groups section, shown in Figure 16, is
a carry over function of the original KanSched
which was called Quick ET. It allows the ET
values to be entered into a group of fields that
are using the same weather station as the reference ET information source. ET groups can
be accessed from general information page of
the Field Setup tool or by clicking on the ET
Groups bar on the top of every KanSChed2
screen. Once at the ET Groups page, an ET
group can be established by clicking on the
new group control bar and typing an identifying name. Fields in the field collection that
are active will appear in the box below the ET
groups name box. These fields can be associated with an ET group by simply clicking the
small box next the field name. Once fields
are ET grouped, these fields will be updated
with reference ET data with every entry of
ET data, either in the ET Groups section or
when an entry is made into an individual field.
Producers may have a large number of fields
but will use a county based weather station as
the ET information source. ET Groups simplifies the updates of individual fields and since
only one reference ET entry per day for an
ET group is required. Fields do not have to be
entered into an ET group. They would function as individual
fields with the reference ET entered directly into the budget
page of that field. Multiple ET groups can also be established
within a field collection.
A field that has had individual ET data entries and is then
associated with an ET group will have the reference ET data
entries overwritten by the ET Groups data.
KanSched2 User’s Manual – 10
Rain Groups
Rain Groups (Figure 17) function in the same manner as
ET Groups; however Rain Groups will generally be much
smaller, possibly only two fields. Rain measurements should
be made for each individual field, but in practice a single rain
gauge might provide the rainfall measurement for two adjacent fields. For example, a single rain gauge in the middle of a
section might be adequate for the four fields in that section.
Figure 17. The Rain Groups section of KanSched2.
Additional Features in KanSched
KanSched has several built in utilities to increase the functionality of the program. The following section will describe
each of these utilities.
Archiving a Field
Once a season is completed or a new season is ready for new
data entry, the previous season data can be saved and a new
season for the same field can begin without having to create
a new field or delete the old data. Archiving of field data is
made easy with the use of the Start a new season function.
The Start a new season function advances all the dates
in the fields of the field collection forward by one year and
retains the previous season’s information intact under that
year. The field data for previous seasons is accessed by using
the Season drop down menu just about the Field Setup
control bar on the left hand side of the screen. In the first year
of use, there will only be one season available for view unless
data from previous years is imported.
Once the season begins, the field information for the new
field will need to be reviewed and updated as necessary as it is
unlikely the dates for the new crop season will be the same as
the previous year.
Still Have Questions?
Operating problems and questions on
KanSched or other Mobile Irrigation Lab programs can be directed to MIL team members
as listed below. However, many county extension agents are familiar with KanSched and
may be able to provide assist or can refer any
questions on to the MIL Team members.
Export Season Data to MS Excel or Text File
KanSched2 does allow the option of exporting data to either
an Excel spreadsheet or a text file. These functions are available as tool bars in the upper right hand corner of the budget
page. When this option is selected, the user will be given the
option of where to save the text file. After designating the
save location and the name of the text file, KanSched will
automatically generate the file with all of the daily season
values (Date, Reference ET, Crop ET, Rain, Gross Irrigation,
Measured Soil Water Content, Calculate Soil Water
Content, Root Zone Water Deficit, and Effective Rain) of
water budget and soil water contents from the budget page. A
text file can be imported into any spreadsheet program desired
by the user.
KanSched2 User’s Manual – 11
L. Kent Shaw
Mobile Irrigation Lab Project Coordinator
Department of Biological and Agricultural Engineering
Danny H. Rogers, PE, PhD
Kansas State University
Professor and Extension Agricultural Engineer,
Southwest Research and Extension Center
Irrigation
4500 E. Mary, Garden City, KS 67846
Kansas State University Research
Phone: (620)-275-9164, Fax: (620)-276-6028
and Extension
E-mail: [email protected]
Department of Biological and Agricultural
Engineering
147 Seaton Hall
Acknowledgements:
Manhattan, KS 66506
Funds from the Kansas Water Office, the USDA Irrigation
Telephone: 785-532-5813, Fax: 785-532-6944 Water Conservation Project, and the Ogallala Aquifer
Program (KanSched2 project) support the development of
[email protected]
this program.
MIL Team members:
Mahbub Alam, PhD
Professor and Extension Irrigation Engineer
Department of Biological and Agricultural
Engineering
Kansas State University
Southwest Research and Extension Center
4500 E. Mary, Garden City, KS 67846
Phone: (620)-275-9164, Fax: (620)-276-6028
E-mail: [email protected]
Disclaimer
KanSched2 helps in making irrigation decisions; however,
results will depend on other crop production factors and
soundness of decision.
Brand names appearing in this publication are for product identification purposes only. No endorsement is intended,
nor is criticism implied of similar products not mentioned.
Publications from Kansas State University are available on the World Wide Web at: www.oznet.ksu.edu
Contents of this publication may be freely reproduced for educational purposes. All other rights reserved. In each case, credit
Danny H. Rogers and Mahbub Alam, KanSched2: An ET-Based Irrigation Scheduling Tool,
Kansas State University, February 2007.
Kansas State University Agricultural Experiment Station and Cooperative Extension Service
EP129
December 2007
K-State Research and Extension is an equal opportunity provider and employer. Issued in furtherance of Cooperative Extension Work, Acts of May 8 and June 30, 1914, as
amended. Kansas State University, County Extension Councils, Extension Districts, and United States Department of Agriculture Cooperating, Fred A. Cholick, Director.