1
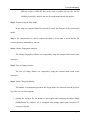
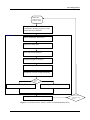
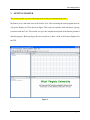
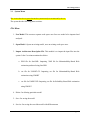
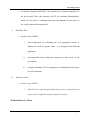
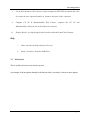
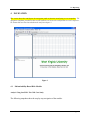
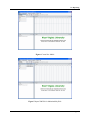
USER’S
MANUAL
Software Architecture Risk Assessment
(SARA) Tool
Khader Basha Shaik
Jan, 2007
USER'S MANUAL
TABLE OF CONTENTS
Page #
1
GENERAL INFORMATION ............................................................................................. 1-1
1.1
System Overview.....................................................................................................................1-1
1.2
Pre-requisites for the SARA Tool .........................................................................................1-2
1.3
Repository set up before starting with tool ..........................................................................1-3
2
Overview of the Steps supported by SARA......................................................................... 2-1
3
GETTING STARTED......................................................................................................... 3-1
4
5
3.1
System Menu ...........................................................................................................................3-3
3.2
Exit System..............................................................................................................................3-7
NAVIGATION .................................................................................................................... 4-1
4.1
Maintainability-Based Risk Module .....................................................................................4-1
4.2
Reliability Risk Module........................................................................................................4-12
4.3
Requirement Risk Module ...................................................................................................4-14
4.4
PLA Module:.........................................................................................................................4-14
4.5
Architecture-level metrics Menu.........................................................................................4-16
References: ........................................................................................................................ 5-19
User’s Manual
Page ii
TABLE OF FIGURES
Figure 1 Overall Process flow chart for SARA Tool (Maintainability Risk) ............................................2-1
Figure 2 ......................................................................................................................................................3-1
Figure 3 ......................................................................................................................................................4-1
Figure 4 Create New Model.......................................................................................................................4-2
Figure 5 Import XMI file for Maintainability Risk....................................................................................4-2
Figure 6 After importing file......................................................................................................................4-3
Figure 7 Compute Change Propagations Metrics ......................................................................................4-3
Figure 8 ......................................................................................................................................................4-4
Figure 9 Size of change metrics calculation ..............................................................................................4-5
Figure 10 Import file for ICP: ....................................................................................................................4-5
Figure 11 ....................................................................................................................................................4-6
Figure 12 Compute Corrective ICP ...........................................................................................................4-6
Figure 13 Compute Adaptive ICP..............................................................................................................4-7
Figure 14 Compute Corrective Maintainability Risk.................................................................................4-7
Figure 15 ....................................................................................................................................................4-8
Figure 16 Compute Adaptive Maintainability Risk ...................................................................................4-8
Figure 17 Import file..................................................................................................................................4-9
Figure 18 Compute Change Propagation ...................................................................................................4-9
Figure 19 Size of Change:........................................................................................................................4-10
Figure 20 Compute Maintainability Risk.................................................................................................4-11
Figure 21 Import IEP file.........................................................................................................................4-12
Figure 22 Error Propagation: ...................................................................................................................4-12
Figure 23 Compute Reliability Risk: .......................................................................................................4-13
Figure 24 Select severity (after importing test6.txt file) ..........................................................................4-14
User’s Manual
Page iii
1.0 General Information
The User’s Manual provides the information necessary for the user to effectively use the SARA Tool
1
GENERAL INFORMATION
This manual helps the user in 2 ways.
•
When the user needs to use the tool for conducting risk analysis or producing
architectural metrics of architectural description models and product line architecture
models developed using UML. .
•
When the user wants to deploy the tool in his PC .
To work with the SARA Tool the user needs to have architectural model artifacts developed
using either StarUML or UML-RT model development tools.
1.1
System Overview
The SARA tool provides estimates for maintainability-based risk, reliability-based risk, and
requirements-based risk. The tool also provides several of architectural level metrics related to
size, coupling, and complexity. The tool extends our earlier Architectural-level Risk Assessment
Tool (ARAT) by providing support for more architectural models such as Product line
architectures It also provides different perspective of risk assessment other than reliability-based
risk such as risk based on maintainability or requirements. The tool can be extended to support
performance-based risk, and other forms of risk assessment at the architecture level.
The current version of the tool provides software developers and analysts with the ability to
quantitatively analyze the following architectural risk factors
User’s Manual
Page 1-1
1.0 General Information
1.2
•
Maintainability-based Risk
•
Reliability-based Risk
•
Requirements-based Risk
•
Architectural metrics based on size, coupling, and complexity
Pre-requisites for the SARA Tool
This tool analyzes UML architectural models described using class diagrams, sequence
diagrams, and state charts. The tool accepts architectural models from two different UML
modeling tools, an open source tool, and a commercial tool. These tools are StarUML or UMLRT. StarUML is an open source UML model development tool [3] that supports the newly
adopted UML 2 version of UML. UMLRT is a commercial UML modeling tool developed by
IBM Rational that is suitable for developing and simulating UML models for real-time systems
[4].
Models developed using StarUML can be extracted into XMI files which contain the model
information. These xmi files can then be imported into SARA for conducting risk analysis. For
UML-RT, we developed script code using a scripting language supported by UML-RT to extract
the model information and produce a text file contain in the model information. This text file can
then be imported into the tool for conducting risk analysis.
The SARA tool expresses several metrics and risk factors calculated from the imported UML
models in terms of bar charts using a commercial tool called Espress chart Manager. This tool
User’s Manual
Page 1-2
1.0 General Information
needs to be installed before using the SARA for risk analysis. The tool can be down loaded and
installed free for 30 days.
The possible inputs for the SARA tool are as follows:
•
XMI file generated from StarUML containing architectural information (class diagrams,
sequence diagrams and state chart diagram)
•
.txt input file generated from UML-RT script containing architectural information (class
diagrams, sequence diagrams and state chart diagram)
•
.txt input file for Initial Change Probabilities (ICP) estimation(optional)
•
Start Espress chart Manager before running the SARA Tool. This is the commercial tool
used for visualizing the analysis results using bar charts.
1.3
Repository set up before starting with tool
1. Place the directories “khader” and “input” provided along with the tool in the C:
directory.
For the methodologies used in the implementation of the SARAT please refer to the references
provided in [1].
User’s Manual
Page 1-3
2.0 System Summary
2
Overview of the Steps supported by SARA
This section briefly describes and depicts graphically the steps and overall flow of data in the
SARA Tool. We describe briefly the user-oriented steps and the description of the method used
to store and maintain data.
Figure 1 shows a diagram of the steps and the data flow supported in the tool. These steps are
briefly described as follows:
Step 1: The initial step is uploading the input files.
For Maintainability Risk analysis of UML models developed with the StarUML, the
input files needed are as follows:
1. An XMI file exported by StarUML containing the architecture model description
based on sequence diagrams, class diagrams and state charts.
2. A text file .txt file prepared by the user which contains the error or change reports of
the components of the architecture (optional). This file is optional since the tool provides
analysis based the worst case where all components will changes with probability one.
For reliability-based risk analysis and requirements-based risk analysis of UML RT
models, the following input file is needed:
1. A text file produced by UML-RT script that contains the architecture description
based on sequence diagram, class diagrams and state charts. There are two
User’s Manual
Page 2-1
2.0 System Summary
different scripts in UML-RT that can be used to produce the text file, one for
reliability-based risk analysis and one for requirements-based risk analysis
Step 2: Preprocessing the data model
In this stage the imported data file is parsed to extract the elements of the architectural
model .
Step 3: The extracted data is used to compute the metrics. So the data is stored into the file
system repository maintained by the tool.
Step 4: Change Propagation Analysis
The Change Propagation Metrics are computed by using the extracted data stored in the
repository.
Step 5: Size of Change Analysis
The Size of Change Metrics are computed by using the extracted data stored in the
repository.
Step 6: Initial Change Probability
The number of components present in the design model are extracted from the previous
step. Here we have three options.
1. parsing the .txt input file for change or error reports and computing the Initial change
probabilities(ICP). Adaptive ICP is computed using change reports and Corrective ICP
using error reports.
User’s Manual
Page 2-2
2.0 System Summary
2. setting the ICP by the user by checking one of the following options:
a. worst case scenario i.e. setting to 1.0
b. accepting user direct input
3. Parsing the state chart diagram data from XMI input file and computing Cyclomatic
Complexity. Use this data in place of ICP
Step 7: Maintainability Risk
Finally Maintainability Risk factors
are computed using the research methodology
described by Walid Abdelmoez in his Ph.D dissertation [2]. The risk factors are displayed for
each component and are shown in bar chart using the espress chart in tool.
User’s Manual
Page 2-3
3.0 Getting Started
Build UML
model of target
software system
Using StarUML or UML-RT
extensibility interface to convert visual
model into text or XMI file
SARA Tool
Import modal data into SARAT
Preprocess model data
Save data into the database
Change Propagation Analysis
Size of Change Analysis
Estimation of Initial Change Probability
Change/
Bug ?
Corrective Maintainability Risk
Adaptive Maintainability Risk
Identify Critical Components
Figure 1 Overall Process flow chart for SARA Tool (Maintainability Risk)
User’s Manual
Is the architecture
quality of the target
software?
3.0 Getting Started
3
GETTING STARTED
This section provides a general walkthrough of the system from initiation through exit.
MyFrame1.java is the main class of the SARA Tool. After executing the main program the user
will get the display of GUI as shown in figure. This is the user interface with which user is going
to interact with the Tool. This section is to give the complete description of the Menus presented
and their purpose. Before going to the next section let us have a look at the frames displayed in
the GUI.
Figure 2
User’s Manual
Page 3-1
3.0 Getting Started
The complete Frame is divided into 4 parts.
•
Model Frame
•
Result Frame
•
Log Frame
•
Chart Frame.
Model Frame: This frame provides information about the type of model he is working on,
hierarchy of the files uploaded. It provides information for target software systems management,
for instance, user can analyze many different software systems simultaneously. This is especially
useful when the user wants to compare multiple solutions of UML models for the same target
system.
Result Frame: To display the output/result of the different modules in tabular format. The size
of the table is limited here to 14*14. This is one of the limitation of the tool. If the number of
components in the system design exceeded this then the tool give error.
Log Frame: The left lower frame is a log window; it records every user action applied to the
SARA Tool system. In case some accidental actions happen, the user can follow the log to
reverse the user action, and erase the error made by the accident.
Chart Frame: To display the results in the chart format . It supports both 3-D and 2-D charts. It
allows user to analyze the results by focusing into different styles provided by Espress chart API.
User’s Manual
Page 3-2
3.0 Getting Started
3.1
System Menu
This section describes in general terms the system menu first encountered by the use
The system has the following menu sections:
File Menu
1. New Model: This creates a separate work space area for a new model to be imported and
analyzed.
2. Open Model : Opens an existing model, uses an existing work space area.
3. Import Architecture Description File: This module is to import the input files into the
system. It has 3 sections mentioned as below:
a. XMI file for StarUML: Importing .XMI file for Maintainability-Based Risk
estimation produced using StarUML
b. .txt file for UMLRT-CP: Importing .txt file for Maintainability-Based Risk
estimation using UMLRT
c. .txt file for UMLRT-EP: Importing .txt file for Reliability-Based Risk estimation
using UMLRT
4. Delete: for deleting particular model
5. Save: for saving the model
6. SaveAs: for saving the saved the model with different name
User’s Manual
Page 3-3
3.0 Getting Started
7. Exit: To exit the tool
Risk Menu
i.
Maintainability Risk:
a. Analysis using StarUML:
i.
Change Propagation: for computing the Change Propagation Metrics
ii.
Size of Change: for computing Size of change metrics
iii.
Compute Maintainability Risk: for computing Maintainability Risk
factors
1. Corrective maintainability Risk: Compute Maintainability Risk
factors based on bugs
2. Adaptive maintainability Risk : Compute Maintainability Risk
factors based on changes
b. Analysis using UMLRT
i.
Change Propagation: for computing the Change Propagation Metrics
ii.
Size of Change: for computing Size of change metrics
iii.
Compute Maintainability Risk: for computing Maintainability Risk
factors
User’s Manual
Page 3-4
3.0 Getting Started
1. Corrective maintainability Risk: Compute Maintainability Risk
factors based on bugs
2. Adaptive maintainability Risk : Compute Maintainability Risk
factors based on changes
c. Import file for initial change probabilities (ICP):
i.
Import file: for importing .txt file which contains error and change
reports. This has to be done after computing CP and SC and before
estimating the Maintainability-based risk.
ii.
Choose options: This is a frame for setting Initial Change Probabilities if
data is not available to the user. It giving two options to the user.
1. choosing the worst case scenario ,i.e setting all the probabilities to
1.0
2. providing separate frame for entering user defined probabilities
component wise.
d. Compute Initial Change Probability(ICP):
i.
Corrective ICP : Computing corrective ICP w.r.t bugs report imported
from c.i section
ii.
Adaptive ICP : Computing corrective ICP w.r.t changes report imported
from c.i section
User’s Manual
Page 3-5
3.0 Getting Started
e. Cyclomatic Complexity(StarUML): This estimates the cyclomatic complexity for
the given model. This is the alternative for ICP for estimating Maintainabilitybased risk. This metric is computed using state chart diagrams for the classes in
the in the architecture description file.
ii.
Reliability Risk
a. Analysis using UMLRT
i.
Error Propagation: for calculating the error propagation metrics. It
displays the result in separate frame . it is integrated from different
application.
ii.
setComponentSeverity: setting the component severity levels for the
given model.
iii.
Compute Reliability risk: for computing the reliability-based risk factor
for each component.
iii.
Requirement Risk:
a. Analysis using UMLRT
i.
Select Severity : takes the input file(test6.txt), process it and presents the
scenario level complexities and their optional severities.
ProductLineArch. Menu
User’s Manual
Page 3-6
3.0 Getting Started
i.
Create PLA Instances: Here the user needs to import the XMI PLA description file, then
he creates the user requested number of instances and store in the repository.
ii.
Compute CP, SC & Maintainability Risk Factors: computes the CP, SC and
Maintainability risk factor for each Product Line instance.
iii.
Display Results : for displaying the final results in both table and Chart Formats.
Help
3.2
i.
Index: provides the help window for the user
ii.
About : Just know about the SARA Tool
Exit System
This is used by the user to exit from the system.
An example of the navigation through each function with a case study is shown in next chapter:
User’s Manual
Page 3-7
7.0 Reporting
4
NAVIGATION
This section describes and depicts the navigation paths to functions noted using screen snapshots . The
navigation snapshots provided in this section leads the user to use the each function in correct sequence.
We assume that user has learned about the tool from chapter 3.
Figure 3
4.1
Maintainability-Based Risk Module
Analysis Using StarUML: The CM1 Case Study
The following snapshots show the step-by-step navigation of the module:
User’s Manual
Page 4-1
7.0 Reporting
Figure 4 Create New Model
Figure 5 Import XMI file for Maintainability Risk
User’s Manual
Page 4-2
7.0 Reporting
Figure 6 After importing file
Figure 7 Compute Change Propagations Metrics
User’s Manual
Page 4-3
7.0 Reporting
Figure 8
User’s Manual
Page 4-4
7.0 Reporting
Figure 9 Size of change metrics calculation
Figure 10 Import file for ICP:
User’s Manual
Page 4-5
7.0 Reporting
Figure 11
Figure 12 Compute Corrective ICP
User’s Manual
Page 4-6
7.0 Reporting
Figure 13 Compute Adaptive ICP
Figure 14 Compute Corrective Maintainability Risk
User’s Manual
Page 4-7
7.0 Reporting
Figure 15
Figure 16 Compute Adaptive Maintainability Risk
User’s Manual
Page 4-8
7.0 Reporting
Analysis Using UMLRT: CM1 case study
Figure 17 Import file
Figure 18 Compute Change Propagation
User’s Manual
Page 4-9
7.0 Reporting
Figure 19 Size of Change:
User’s Manual
Page 4-10
7.0 Reporting
Setting the value of Initial Change Probability
Figure 20 Compute Maintainability Risk
User’s Manual
Page 4-11
7.0 Reporting
4.2
Reliability Risk Module
Analysis using UMLRT:
Figure 21 Import IEP file
Figure 22 Error Propagation:
User’s Manual
Page 4-12
7.0 Reporting
Set Component Severity: Minor = 0.25, Major = 0.5, Critical = 0.75, and catastrophic = 0.99
Figure 23 Compute Reliability Risk:
User’s Manual
Page 4-13
7.0 Reporting
4.3
Requirement Risk Module
Analysis using UMLRT:
Figure 24 Select severity (after importing test6.txt file)
4.4
PLA Module:
Create Instance:
User need to enter the number of instances to be created after importing the PLA XMI file as
shown in the snapshot below
Compute metrics and maintainability risk factors:
Computation is done at back end and the time taken for each instance is provided as shown in the
snapshot below
User’s Manual
Page 4-14
7.0 Reporting
Display Results: For 5 Instances
User’s Manual
Page 4-15
7.0 Reporting
4.5
Architecture-level metrics Menu
After importing XMI file
Size Metrics: Method Count
Coupling metrics: CBO
User’s Manual
Page 4-16
7.0 Reporting
Information Coupling:
Complexity: Cyclomatic Complexity
Note: Need state chart diagrams in the XMI file for this section
User’s Manual
Page 4-17
7.0 Reporting
Help Menu: Index
About:
User’s Manual
Page 4-18
7.0 Reporting
5
REFERENCES:
[1] [Khader 2007]. Khader Shaik, Software Architecture Risk Assessment Tool, M.S, Problem
Report, West Virginia University, Morgantown, West Virginia, USA.
[2] [Walid 2006]. Walid M.Abdelmoez, Model-Based Risk Assessment, PhD. Thesis, West Virginia
University.
[3] StarUML - The Open Source UML/MDA Platform http://staruml.sourceforge.net/en/
[4] Rational Rose Realtime, Rational Software Corporation, http://www.rational.com
User’s Manual
Page 5-19