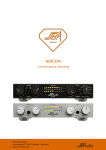
1
MODELS VA-16XX/RK, VA-16XX/LCD Y VA-16XX/LCD-P VA 16X Virtual Analyzer FM digital monitor User’s Manual 3 de Febrero 3254 (CP 1429) Buenos Aires - Argentina Phone: +54 11 4702 0090 e-mail: [email protected] Fax: +54 11 4702 2375 Web site: www.SolidynePRO.com Last revision: January 2013 SOLIDYNE VA 16 Virtual Monitor 2 Table of contents Chapter 1 – Installation ....................5 Chapter 3 – Measurement features 13 1.1 Description...............................................5 3.1 Signal Transmission..............................13 1.2 Rear pannel – conections .......................5 1.2.1 Power source..................................................5 1.2.2 Connecting the Antenna................................5 1.2.2.1 Calibration.........................................................5 3.1.1 Modulation Meter..........................................13 3.1.2 Field Intensity................................................13 3.1.3 Carrier Deviation...........................................14 3.1.4 Pilot Signal Level..........................................14 1.2.3 Modulation Meter Calibrator (optional).........5 3.1.5 Pilot Signal Frequency Error.......................14 1.2.5 Slow time (only models VA 16X).....................6 3.1.6 RDS signal.....................................................14 1.2.6 RDS analyzer (opcional VA-16X).....................6 3.1.7 MultiPath Distortion......................................14 1.2.7 RS 232..............................................................6 3.1.8 Spectrum Analyzer.......................................14 1.2.7.1 USB a RS-232 adapter ....................................6 3.1.9 FM Band Scanner.........................................15 1.3 VA-16X/P/LCD Models.............................6 1.4 Software Installation................................6 3.1.10 Spectral Zoom Analyzer............................15 3.1.11 3D Spectrum Analyzer................................15 1.4.1.1 USB to RS-232 adapter....................................6 3.2 Measurement of Audio Quality Parameters...................................................17 1.4.2 IP CONNECTION.............................................7 3.2.1 L & R Audio Level (Stereo Audio Level).....17 1.4.2.1 Set up...............................................................7 1.4.2.2 Accessing from the LAN...................................8 1.4.2.3 Access from Internet.........................................9 3.2.2 L+R & L-R Audio Level.................................17 1.4.1 SERIAL port.....................................................6 1.5 Alarms Panel............................................9 1.5.1 vaPanel............................................................9 1.5.2 vaAlarm.........................................................10 1.5.3 Software Upgrades:...........................................10 3.2.3 L & R Noise Level.........................................17 3.2.4 Crosstalk.......................................................17 3.2.5 Effective Radiated Power.............................17 3.2.6 Stereo Phase Vector.....................................18 3.2.7 Frequency Response...................................18 3.2.8 Harmonic Distortion.....................................19 Chapter 2 – Operation ................... 11 2.1 Introduction............................................11 3.3 Measurement of the Operating Parameters...................................................20 2.2 Tuning adjustment.................................11 Chapter 4 – Append LCD Models ... 21 2.3 How to print the information..................11 4.1 Models VA16/LCD & /P with LCD ..........21 2.3.1 Text Mode......................................................11 4.1.2 Menu Options................................................21 2.3.2 Graphic Mode................................................12 4.1.3 Tuning in a radio station..............................21 2.3.3 Printing the tuned station............................12 4.1.4 Other Options from the Menu......................21 2.3.4 Remote Printing............................................12 4.1.5 Information Visualization Displays.............21 4.2 Cristal calibration (only units with option /CAL) ..........................22 SOLIDYNE VA 16 Virtual Monitor 3 Chapter 5 – Tech. specifications .... 23 5.1 Input & output........................................23 5.2 FM digital receiver..................................23 5.3 Stereo decoder ......................................23 5.4 Test measurements & digital processing ..............................23 5.5 Printed records of on-air performance .24 5.6 Models & options...................................24 SOLIDYNE VA 16 Virtual Monitor 4 Chapter 1 -Installation1.1 Description 1.2.2.1 Calibration The system Monitor VA-16X is composed by: Each receiver VA-16X it is individually calibrated at factory to indicate the field intensity present at the BNC connector. This value is measured in dB/uV (dB with reference to a microvolt for meter of field intensity). The maximum value is 100 dB/uV. • VA-16XX digital receiver. • CD-ROM with the application software (runs under Windows XP/2003/Vista/Seven). • Connection cable RS-232. • USB to RS232 adapter with installation disc. • FM antenna with magnetic base. The models VA-16X/RK, VA-16X/LCD and VA16X/P/LCD are designed to operate in areas with high field intensity. They possess metallic cabinet that can be mounted in rack or also, eliminating the lateral supports, they can be used as table cabinet. They include a vertical antenna of solid construction, with magnetic base, to be located at the top of the rack or in the roof of a car. 1.2 Rear pannel – conections Therefore the VA-16X will always give perfect relative indications of the intensities of field of the stations of radio of the dial. However to get absolute measurements it is required a constant of calibration for antenna. The software of the VA-16X allows to enter this constant. To modify this value go to Memory Frequency Manager. Pressing SET a keypad appears with 16 frequencies, pressing ADVANCED you can set the sensibility correction value in dB. This value is added to the field indication present at the input of the VA-16X (Correction in positive values) or it is subtracted when directional antennas with high gain are used (the antenna gain is entered as a negative value). For example, our quarter-wave antenna has a loss of 6 dB (approximately) with relationship to an ideal dipole, we will place +6 dB in the dialogue box and the measurements presented on screen they will be increased by 6 dB. To change this value we must press MODIFY. 1.2.1 Power source The receiver will be connected to 117/220 volts. Make sure that the voltage is the correct one observing the voltage switch in the rear panel of the receiver. NEVER CONNECT THE EQUIPMENT WITHOUT CHECK IT! 1.2.2 Connecting the Antenna VA-16X (all models) has a BNC connector for antenna. Connect here the whip antenna that comes with the equipment or an external antenna if you want monitoring radios outside the primary area of coverage (fields smaller than 1 mV/m, that is to say 60 dBuV). The operation of the quarter-wave antenna provided will be satisfactory in the reception of local stations. In particular a location near big windows is always preferable. When the building is a one or two plants and construction of bricks, the operation with internal antenna is satisfactory. However if it is an offices building with concrete and steel beams, it will be necessary to use (mainly to measure FM stations far away) an external antenna. This antenna can be omni directional or directive (Yaghi type of several elements) and it must be connected with coaxial cable RG-58 or similar. SOLIDYNE The quarter-wave antenna with magnetic base that comes with the equipment requires a constant of +6 dB to indicate absolute values of field intensity. This is applied when it is mounted over the car's roof or in a terrace. This value is approximated since the included antenna is not a patron antenna. For assembly in interiors, please remember that the field inside a building is very different that in the outside. Also remember that it should be added a "field correction for antenna height" since the charts of field attenuation with distance, used in Radio broadcasting, usually uses antenna heights from 9 to 12 meters. 1.2.3 Modulation Meter Calibrator (optional) VA-16X units are factory calibrated, but if you want, they can incorporate a Modulation Meter Calibration (optional), in order to adjust the 100% modulation measurement. In the rear panel, there is a ‘TEST’ button and a ‘SET 100%’ preset. • To start the calibration, disconnect the antenna and press ‘TEST’. A 100% modulation signal will be generated (+/- 0.1%). • Just adjust the ‘SET 100%’ preset to obtain a read of 100% (+/- 0.5%) on screen (Modulation Meter). VA 16 Virtual Monitor 5 1.2.5 Integration time (only models VA 16X) Dip Switch Weighting 0,5 mS 1 mS 2 mS 5 mS Defines the peak weighting for modulation meter in average mode. Peak weighting is a method for allowing brief modulation peaks to be ignored by the indicator. Measurements in peak mode are without integration time. Indication mode switches from the PC software 'VirtualAnalyzer'. In models with LCD (Va16X /LCD y VA16X /LCD/P) the modulation meter will ALWAYS indicates PEAK values when the unit is used not linked to VirtualAnalyzer software. When VA16X is controlled by software, LCD shows Peak or Integrated according to software settings. 1.2.6 RDS analyzer (opcional VA-16X) This optional module allows to decode an analyze all the RDS features. For details, please contact us at [email protected] 1.2.7 RS 232 The RS-232 have a D9 connector to connect to the computer, using the cable provided with VA16. If the distance between the PC and the VA-16X it’s big, because you need to connect the receiver far from the PC, an extension cable can be built very easily that replaces the one given by factory. If you want to make this cable yourself, you need a shielded cable with two wires (type microphone). The connection is: Connection between two D-9 connectors: In both ends ground to pin 5. The pins 2 connected between them. The pins 3 connected between them. 1.2.7.1 USB a RS-232 adapter If your computer only has USB ports, using USB to RS232 supplied with the equipment. When connecting the adapter to the computer, Windows will ask the drivers to be installed using the CD-ROM provided with the adapter cable. measure the 12 main parameters to carry out an excellent remote measurement of the Radio. But, if you prefer, a Laptop can be used to keep data in the Hard Disk. When you inserts the connector D9 of the RS232 output, the VA16 leaves of being controlled from the JOG wheel and it becomes controlled from the PC. But the LCD will continue marking in parallel the same values that in the screen of the PC. When the portable system is used in a car, the antenna should be placed in the center of the roof of the car. This way you get constant and precise readings. 1.4 Software Installation VA-16X software runs on Windows XP/2003/Vista/Seven. Browse at VirtualAnalyzer CD-ROM and install running SETUP.EXE CD-ROM includes 8 audio files for the frequency response tests. They are located at the AUDIO folder, and they are 8 files for the 8 frequencies to measure. They come in standard WAV format and can be played using any soundcard. They are also included into CD-ROM like audio tracks that can be played with any CD player. Copy the 8 files to the corresponding folders of your on-air automation software. The 8 frequencies in ascending order, from 30 Hz, must be programmed to be aired (we suggest during the night) once per hour. File length are only 5 seconds. This way, when concluding the eighth file, VA16 can draw the curve of frequency response of your station. If you want immediate information, the test files can be programmed one after other one, but use a small separator between the test files. 1.4.1 SERIAL port VA16 connects to the PC using a standard RS-232 cable (provided with the unit). If the length were insufficient, you can use a prolongation. By default VA-16X software uses the COM 1 (port 1). If you need to connect VA16 to another port you must edit the SERIAL.INI file in the following line (only ports 1 to 9 are supported). In Windows 7 you nedd to open the file with administrator [comm] port=2; comm port (1 ..9) [default 1] 1.4.1.1 USB to RS-232 adapter 1.3 VA-16X/P/LCD Models The connection is similar to the already seen, but, obviously, they don't require permanent connection to the AC power. They operate with autonomy bigger than 4 hours, having an on-off switch located at the front side and lightly sunken to avoid accidental switch on. When they are connected to the AC power, the batteries of Nickel-cadmium are recharged. A complete charge requires 20 hours. If the VA-16X/P/LCD remains for several weeks without using, it’s recommended to recharge them before using. If your computer don't have serial port; use the RS232 to USB adapter cable provided with VA-16X. Drivers are installed by VirtualAnalyzer software (if the correspondent check box remains enabled). Once installed, check the COM assigned by Windows, to enter it in the VA-16XX config file. In Windows, go to "Control Panel → System → Hardware → Device Manager” option "COM & LPT Ports”). When the equipment is used in outside measurements, doesn't require the use of a PC since the LCD allows to SOLIDYNE VA 16 Virtual Monitor 6 1.4.2 IP CONNECTION Models /IP allows to manage the unit via TCP/IP protocol. Before the detailed explanation, a brief enumeration on the settings needed to use VA-16X via IP is: a) Connect VA16 to the LAN b) Check the IP address of the unit using “DS Manager” software. c) A PC will be used to run the software and to access to the VA16 hardware. We call to this PC “remote computer”. Install in the “remote computer” the “VA16 Monitor” software. d) Install in the “remote computer” the Virtual Serial Port”. If there is a Firewall (software or hardware) it must enable port 1001 for the communication with the VA-16X. e) Configure VA16 software so it use this virtual port (serial.ini) f) To access from outside the LAN, please refers to “1.2.7.3 Access from Internet”. 1.4.2.1 Set up In case that the assigned port number was bigger than COM9, it must be changed manually within the range COM1-COM9, right clicking on USB-to-Serial and choose "Properties". Connect VA-16X to the LAN and turn on. Next to the connector RJ45 a green LED will light. If amber LED lights then the network detected is of 100Mbps. Install and run “DS Manager” tool, which provides in VA-16X CDROM (folder CONEXION-IP). This tool will show all active VA-16X units connected to your LAN. Each unit has a MAC address (Ethernet card address) that is unique and comes fixed from factory; and an IP address that you can change freely. Press on “Advanced options...” and change the port number using from menu “COM number”. By default, VA-16X software uses port 1. If you wants to use another port, you must edit the config file SERIAL.INI (C:\Program Files\Solidyne 16X) at line [comm]: port=1. SOLIDYNE VA- Select the unit from the list and press the button [Settings]. Here you can define a new IP. In the showed example the local area network uses directions type 192.168.0.x, to accede from any terminal of that network to VA-16X is necessary that IP address is compatible. Assign a fixed IP that it does not generate conflicts with other terminals (in our example 192.168.0.11). If you have a DHCP server you can obtain a dynamic IP address, although if IP changes frequently will require changes in the configuration of the clients (or in the LAN like for the access from Internet). VA 16 Virtual Monitor 7 Also assign the Gateway address (usually 192.168.0.1), and the subnet mask. This is necessary if you wish to accede to VA-16X from outside of your LAN. If you don’t know these values, contacts to your network administrator. The used port is 1001, you can change it if appears conflicts with another application in the terminal client who uses the same port, but this is little probable. In the ‘Serial Port’ section, ensures that the DTR mode is set to: 1- Indicate connection status. Once configured, you can make a PING to verify the access to VA16 from the terminal. Another option is to use the button [BUZZ] from the main window of the DS Manager and you will see the LEDS of connector RJ45 to blink during one second. 1.4.2.2 Accessing from the LAN The client PC must have installed TCP/IP protocol. If there is a Firewall (software or hardware) it must enable port 1001 for the communication with the VA-16X. You must install the driver `Virtual serial port' that allows to communicate with the VA-16X/IP. The tool is 'Connection Wizard', with this you must create a new serial-port<-> IP address connection. Virtual serial port must install in each PC from which it is desired to accede to VA-16X/IP. Once installed the virtual serial port it must appear in the Windows Devices Manager. Finally, set the VA16 software so that it uses the new serial port (in example COM2). Application VA-16X defines its serial port in the configuration file SERIAL.INI. SOLIDYNE VA 16 Virtual Monitor 8 1.4.2.3 Access from Internet 1.5 Alarms Panel If you want access to a VA-16X located outside your LAN; there are two possible ways in which the device can be connected to the network. The Alarm Panel is made up of two applications: vaPanel and vaAlarm. The device is connected directly to Internet: In this case you must enter the IP address assigned by the Internet provider (ISP). The device is connected in another LAN (with shared Internet access): In order to accede from an remote PC to the LAN you must configure the router of that LAN to redirect the packages incoming by port 1001 to local IP address assigned to VA16 (in our example 192.168.0.11), and redirect also the port 65535. The following is an illustrative example; the screen of present configuration depends on your router. vaPanel runs with VA-16X and monitoring the state of all the variables. When a variable exceeds the allowed value vaPanel sends a notification to vaAlarm, which can be running in any terminal of the LAN or even on a remote PC connected to Internet. vaAlarm receives the notification and reacts warning the user in that terminal on parameter outside range (it pop ups on the screen), and sending mails and SMS to cellular telephones to the designated addressees. Next both modules are explained. 1.5.1 vaPanel vaPanel operates as Alarm Settings Panel. For each parameter available you can define the value for the alarm activation. Some routers offer the option `Virtual Server', that is similar but more outpost than the ‘Port Forwarding'. Soon you will have to install in your PC (with ‘Connection Wizard') the virtual serial port. The IP address here entered is the external address of the local area network. In order to know the external IP you must see the settings information of your router. Now you can run VA16X end user software so that that it communicates with your VA-16X unit via Internet. SOLIDYNE The alarm is repeated hourly if the anomalous value stays. vaPanel sends a warning via TCP/IP to the application vaAlarm and this one sends mails to the corresponding indicated addressees. vaPanel must be working in the same computer that the VA-16X.EXE. VA 16 Virtual Monitor 9 Three parameters are supervised: MODULATION; CARRIER LEVEL; AUDIO LEVEL. Each alarm has its own addressee, e-mail and telephone. As well, each alarm allows defining the text of the message that will be sent (Msg). It agrees to use short phrases (supports up to 80 characters), since this text will be the “title” or “subject of the message, being the body the values of the measurement. The window "Events" takes a registry of the exceeded values. TEST button sends an alarm to verify the reception. Once the data is entered and checked, press "Minimize" to leave the program running in background. 1.5.2 vaAlarm Send alarm to host: it defines the network terminal that will receive the alarm warning. In this terminal vaAlarm must be running. The application vaAlarm can be running on a PC of the LAN or in a remote Internet terminal. You can define the computer name (i.e: LABO2005), IP address, or URL name (i.e: gerenciatecnica.radiomundo.com). vaPanel uses port 9091 to send the notifications to the remote terminal. Make sure that no firewall blocks that port. E-mail: in each parameter defines the address to send an e-mail notifying the event. Fields "E-mail account" located on the foot of the window allows to enter the user name and password of the e-mail account that vaPanel will use to send the mails to the destiny address. Cell phone: The SMS notifications are sent using the Gateways provided by the mobile telephony companies (i.e.: personal-net.com.to.ar), using protocol smtp (email). The use of this service can generate additional costs. Consult with your cell-phone provider the conditions of use of this service (e-mail to SMS). Example: In Argentine is required the area code without the cell-phones extension "15". So the mobile in Buenos Aires: 15 4447 7308 must be entered into the "Cell phone" field as following: 1144477308 that is to say with the area extension (11 - Buenos Aires) and without "15". If this number is in the company "Telecom Personal" an e-mail can be sent to this number writing to [email protected]. The cell-phone will receive the e-mail as SMS. The drop-down menu allows to choose a cellular telephony provider, not being necessary to enter the complete e-mail address in “Cellphone”. You only need to select your company from the listing and to enter the number as it was explained above. If your company is not in the list, you can enter the complete e-mail in the field "cellphone". vaPanel will use that direction ignoring the predetermined company. SOLIDYNE This application must runs in the destiny terminal. The events keep indicating date and hour. Whenever it appears an event the application jumps to first plane showing the event that firing the alarm. vaAlarm can receive messages of several VA-16X terminals. The application runs in background and appears as an icon in the Systray. vaAlarm uses port 9091 to receive the notifications from vaPanel. If the terminal this in a LAN and the notification comes from a remote PC from Internet; you must configure your router to redirect the packages that use this port to the vaAlarm terminal. In case of conflict of port with another application you can change the default port by editing the vaPanel.INI and defining another port. For example: [Settings] port=9090 ; default is 9091 In order to install vaAlarm in another terminal you only needs to copy vaAlarm.EXE. Config file vaPanel.INI must be copied ONLY if the port used in not the default port. SOLIDYNE LICENSEES YOU TO USE vaAlarm in OTHER PC different that's using VA-16X. vaAlarm client can receive notifications from several VA-16X units. 1.5.3 Software updates: The improvements in the software can be downloaded from our WEBSITE: www.solidynepro.com VA 16 Virtual Monitor 10 Chapter 2 -Operation2.1 Introduction The importance of measuring the technical parameters of an FM transmission is unquestionable. Some of them, such as the modulation percentage, pilot tone level, AM residual modulation, intensity of field, etc., are subject to severe regulatory rules, due to their potential capacity to generate interference to third parties. Others, such as the channel separation, signal-noise ratio, harmonic distortion, response to frequencies, etc., are those responsible for the "quality of sound" perceived by the listener (and which affect the commercial income of the radio station). Until now, no equipment existed which would allow for measuring all the technical parameters of an FM transmission. In fact, in order to measure a few of them it was necessary to invest a great deal of money in various instruments, which were operated manually, situated inside the transmission plant itself, as also a considerable amount of effort on the part of engineers and technicians. For these reasons we have invested considerable research efforts to create a practical system which allows one to control all technical parameters that define a stereo FM transmission. The control is carried out taking the air signal of any FM transmission station within its primary coverage area, by means of an FM digital receiver with a capacity for processing the information digitally and autonomously. This digital receiver is connected to a conventional PC by means of an RS-232 cable to allow for reading on screen the 16 measuring instruments which provide the data, as also to register the data permanently and print it subsequently. The software operates on Windows 98/XP/2000/NT , allowing for the simultaneous use of the PC with other programs. 2.2 Tuning adjustment To select the tuning of the FM stations we are monitoring, there are two procedures: a) immediate tuning with the Remote Control; b) to have up to 16 preset frequencies. ERASING FROM THE MEMORY: Press Set, then the key with the number in the memory, and finally press Delete. The preset memories window is closed by pressing OK. PRESET OPERATION VALUES: If, at the former window, we press Advanced, a dialog box will open to: a) Modify the gain value for the antenna to achieve a correct field intensity. This has already been seen under 1. Installation; b) Also, a check mark can be placed (with the mouse) in the square which enables saving on the Hard Disk the operating data of the radio station, day by day (Make Log Files). If this square is activated, the VA-16X software will make out an up-dated log each day, which can then be seen on screen and printed out (see further on the mode Analyze Data). This file contains information about the selected radio, and not about the 16 quick access memories. The format of this file is YYMMDD.log. It can be printed in another PC copying the YYMMDD.log files and using VA-16X software running in DEMO mode. This mode is confirmed by closing the dialog box with OK. 2.3 How to print the information 2.3.1 Text Mode You can print the next reports in text mode: In order to change the frequency, we must go to the Tuner. If we press Remote a remote control is opened which is very convenient for quick operation and for use with a touch screen PC. This control can be moved to any part of the screen. To select a frequency, we press the numbers in sequence (for example, for 105.1 we press in succession 1 - 0 - 5 - 1) and then OK to confirm it. To erase that frequency, we press Cls and then we can input the new frequency. To close the remote control, press the key at upper left. In order to have radio stations pre-tuned, we open the adjustment window by pressing Set and a keyboard with 16 keys opens up. On pressing them, we change the different radio stations pre-tuned. To add or modify a radio station, the procedure is as follows: SOLIDYNE a) Press the key corresponding to the new memory we wish to add or modify, i.e. key 12 b) Press Set c) Using the mouse, go to the frequency window and type the frequency selected; omitting the decimal point. Now with the mouse mark the text window and write the name of the radio station, for example FM Sunshine d) Press Save and the new radio station will remain recorded in the memory. 1) Average Radiated Power / hour 2) Maximum Modulation Values 3) Pauses per hour (silences that lasts more than 3 sec’s). VA 16 Virtual Monitor 11 4) Inverted Phase (Occurrences / hour) 5) L & R Level average 6) Phase Vector average 2.3.3 Printing the tuned station In order to print this valuable information, press Text Mode at the ON AIR PERFORMANCE section of the main screen. You will see this screen. Press PRINT, if you wish to print this values. Only the tuned radio station will make this control files, named YYMMDD.log. That is: if you need to control Radio-A during a full week, then the VA-16X must be tuned at Radio-A during that week. These values are stored in AAMMDD.log files (YearMonth-Day). These files will be created only when the MAKE LOG FILES option is activated in the ADVANCED window. 2.3.2 Graphic Mode You can print all the graphics, in full color, like the Main Screen, Spectrum Analyzer, FM Band Scanner, Frequency response and Analyze Data. In all the cases you must press the PRINT MODE button in order to make a preview of the graphic to be printed and then, press PRINT. Take in mind that when the option “Make Log Files” activates, which allows to create files that soon will be printed, the current tuned radio is who generates these files. Therefore if you want to have files of another station during one week, VA-16X must remain tuned one week in that radio station. 2.3.4 Remote Printing You can print from any PC computer, not connected to the VA-16X receiver. Please load the VA-16X software in the PC you wish to use for printing. Then run the software. When the PC do not find the VA-16X connected at the RS-232 port, it gives you the choice of running it in DEMO MODE. Choose this option and then you will be able to print all the Analyze Data parameters. You must transport the YYMMDD.log files using a pendrive or the LAN (Local Area Network) or from a different City using a Modem or Internet. This feature allows a Radio Network to have information of all the broadcasting network located in several cities from a central PC location. Having several VA16 units located at different cities, the LOG files can be downloaded from the Central PC via Internet. If you need interactive control from a Central PC station to one or several slaves, a software like Carbon Copy; PC Anywhere or Real VNC can be used to link via Internet or Modem both computers. Then, from the central location, you can perform a remote Scan analysis or Spectrum or Bandwidth analysis of all the remote affiliated Radio stations, and, of course, of all FM radios of that area. Please refer to Chapter 4 for detail on IP access. You can print a complete and valuable 24 Hour Report, in graphic mode, about the following measurrements: Modulation, Radiated Power, L & R levels, Pauses (Silences), Phase and Inverted Phase. For print this reports, press Performance Log in the general VA16 screen. Then, press PRINT MODE and you will see a preview of the graphics. For a detailed view, expand the image using the ZOOM control. The COMMENTS area is used for a commentary text that can be printed with the graphics. Pressing PRINT the impression will start. SOLIDYNE VA 16 Virtual Monitor 12 Chapter 3 - Measurement features3.1 Signal Transmission 3.1.1 Modulation Meter The exact value of the instantaneous maximum peak is measured. This value must be at 100% in order not to infringe the transmission standards that regulate the activity. In most countries of the world, modulating above 100% gives rise to fines or warnings for the FM stations. Modulation excess produces interference at other radio stations. The modulation meter, on a wide scale, possesses a virtual reality format which likens it to the optical galvanometers. Its ballistics are instantaneous attack, and semi-slow recovery. Also, the VA-16X indicates the Frequency Deviation in KHz (100% modulation = 75KHz). The indicator registers the instantaneous peak of the Deviation, and the recovery constant is very slow to make the reading easier. Both the Modulation and the Deviation can be measured with the instantaneous peak or with integration constant (settled on rear panel). In some countries, the integrated value with 2 ms. is accepted as the maximum value. Finally, the indicator to the right of the Modulation Meter marks the amount of overmodulation peaks per minute (Pk/Min). That is to say, each time 105% modulation is reached, one pulse is added to the counter and the value of pulses per minute is shown. This is done for those radio stations which occasionally decide to overmodulate, in SOLIDYNE order to know the density of the overmodulation peaks they are transmitting. It should be remembered that in several countries, the FCC's (USA) recommendations on modulation are followed. Recommendation 73,268 indicates that the FM modulation should be kept as high as possible, but without exceeding 100% on frequently recurring peaks ("In no case is it to exceed 100% on peaks of frequent recurrence"). This indicates that on momentary peaks (and which are not frequent), 100% modulation can be exceeded while still remaining within the legal framework. In order to calculate the peak recurrence VA16X includes a peak per minute counter. “Peak” are modulation transients that exceeds 105%. In some country’s the laws do not tolerate any modulation peak. 3.1.2 Field Intensity This is measured in dB/uV (dB relative to a field intensity of ONE microvolt/metro) and so that this value shall be reasonably exact, the receiver should be subject to a correction coefficient to compensate the gain of the antenna and its location within the building, as seen in Chapter 1). VA 16 Virtual Monitor 13 3.1.3 Carrier Deviation The deviation in KHz of the FM carrier is measured. This value normally is very small. A deviation may appear only if the FM transmitter has flaws. According to the laws of each countries, deviation values from 1KHz to 2KHz are accepted. 3.1.4 Pilot Signal Level bandwidth (300 KHz) to another narrow band of only 10 KHz. The Modulation Bandwidth graph is a graphical representation of the Modulation vs. Bandwidth. This curve brings to you a clear image of the modulation intensity produced inside and outside the 75 KHz band. To generate this curve, press the RUN button, the VA16XX will take samples of the maximum values of energy, using for this analysis a bandwidth of 10 KHz. The level of the 19 KHz pilot signal is measured in percentages. This value is fixed, by transmission standards, at approximately 10%, and values between 8% and 12% can be acceptable. 3.1.5 Pilot Signal Frequency Error (19 KHz Frequency Error) Measurement of the error is made on a 19 KHz frequency with a precision of +/-0.5 Hz. Modern stereo generators are usually controlled by crystal, and therefore the error must be less than +/-2 Hz. 3.1.6 RDS signal RDS Level: Indicates the modulation depth of the RDS subcarrier. This value usually is around 3 to 5%. In some regions the laws fix values to the RDS modulation. Important: The RDS modulation, like happens with the stereo pilot subcarrier, contributes to the total modulation of the FM carrier, therefore, the higher the RDS modulation, the lower the modulation available for the audio band. 57 KHz freq. error: Indicates la deviation of the subcarrier RDS. This indication must show a variable value due to the digital modulation. A fixed vale could be indicate a problem in the RDS signal. 3.1.7 MultiPath Distortion The FM signal arrives at the receiver aerial using multiple paths. One is the direct path and the others are reflected paths. This situation deteriorates the sound quality, the stereo separation and the measured FM modulation. In order to be sure that the VA-16X measurements are correct and exact, the Multipath indicator must be at GOOD, without blinking. A BAD indication could generate measurement errors, reduced signal/noise or audio distortion. The signal energy changes according to the modulation. The values obtained in each pass are compared with the previous measurements, maintaining always the maximum ones. Each pass means a complete analysis from 0 to 150 KHz. At the top of this graphic, the indication SAMPLES: XX show how many loops has been performed. We recommend to make 10 samples as minimum, to obtain precise values. When the number of desired samples are completed, press STOP. 3.1.9 FM Band Scanner This allows for the complete FM band to be shown on screen (or printed), together with all the stations that are operating, and their levels of field intensity in dB/uV. In this way, an analysis is made of the field levels placed in different areas in which the VA-16XX is operated and they are compared with the signals of competitors' stations. 3.1.8 Spectrum Analyzer This measurement makes it possible to determine whether the transmission spectrum of the modulated carrier fulfills the operating conditions imposed by the legislation of each country. The Digital Receiver obviously also measures every other signal present on the channel, for which reason this measurement is only exact when the VA16 is near a radio station. To carry out this measurement, the Digital Receiver modifies its usual SOLIDYNE To make a scan, press 'Open' at main window, and then 'New Run' on 'Band Scanner' window. VA-16XX will scan the entire FM band (odd and right channels) and takes VA 16 Virtual Monitor 14 less than a minute. During this time, the VA-16X stops transmitting other data. The presence of radios on the band is indicated by their field intensities, measured in dB/uV. In this way, it is easy to compare the field intensities of each one of them. chart "3D-Spectrum" indicate values with zero probability, which means that never happened. Using the options “Channels” you can see: The graphic shows (see below) all values of the field intensity (dB/uV), inclusive of overlapped stations, that is to say, over the RF level of the carrier and side bands (as if all the radio stations had been turned off to measure). • • • • all channels only odd channels only right channels at intervals of 250 KHz (used in some countries). Requires a NEW SCANNING. To make the reading of the graph easier, each channel is marked by a color bar, which indicates the frequency decimal of each channel. For example, for the odd channels the color-code are: RED = channels ending in .1MHz GREEN = channels ending in .3MHz BLUE = channels ending in .5MHz YELLOW = channels ending in .7MHz VIOLET = channels ending in .9 MHz What is the utility of 3D spectrum? Noise floor: Shows the noise floor of each area of the FM band due to intermodulation among FM stations and spurious emissions FM transmitters. The evaluation of the noise floor is very important in making various decisions. For example: if you are planning a new radio station outside the city, the background noise is very important to evaluate the power you need to get a good reception in the city center. It is very common to hear a broadcaster wonder why your radio reaches to the city 'A' and difficulty reaching the city 'B' if both are at the same distance. Coverage mapping: Knowing the noise floor yields an accurate map of the coverage area, considering not only the level of field strength at the antenna but how much of that level is the carrier of interest. All graphics can be printed pressing 'PRINT MODE' button. 3.1.10 Spectral Zoom Analyzer You define the start and end frequencies and the VA-16X makes a detailed analysis with 10 KHz wide band. Central frequencies and FM lateral bands appears showing antenna or transmitter problems. Distant radio stations: As said, VA-16X can detect the presence of distant radio stations and their field strength measured even when the signal is under major radio stations. These signals allow you to evaluate two things: a) The reduction of the S/R effective powerful local radio, with the consequent degradation of sound quality. b) Calculates, in case we move away from the city, how far distant radio signal interferes with the radio. And know that directive diagram of the antenna diagram, or increase in power will be convenient to avoid this problem. Interference: As a statistical method, it is possible to detect the presence of intermittent signals. This is of great importance when assessing the interference problems which are difficult to record and diagnose. 3.1.11 3D Spectrum Analyzer This diagram advanced mathematical algorithms used to show the probability of occurrence of signals at each point on the graph, which represents the field intensity versus frequency. To achieve VA16X spectrum analysis performed hundreds of times, to calculate statistical values, which are represented by a color nomenclature. Red indicates a high probability of occurrence, yellow a low occurrence and green medium occurrence. The black portions of the SOLIDYNE VA 16 Virtual Monitor 15 3D Spectrum Analyzer To generate a measurement, click 'Add'. A window appears where you enter a name with which the measurement is stored. You can also enter the geographic location where the measurement is being made. To start scanning, press Start (arrow). Note that the scan "3D Spectrum", unlike "zoom Spectral analyzer", does not make a single band scan, but it is a cumulative process. So the more number of scans performed, more accurately will the 3D graphic. There are situations where it is necessary to operate for several hours for a complete statistical SUMMARY: To get a quick view of the spectrum, use the mode "Spectral Zoom". To have a statistical display deemed minimal surface 60 sweeps (each full band scan delay 10 seconds). Lower values are meaningless, because in that case will be used as "Spectral zoom" To generate a deeper statistical graph must cease operating the computer for hours. How many hours is a decision that depends on the measurement objective. For SOLIDYNE example, if you want to know the noise floor of the channel, 60 to 90 minutes is sufficient. But if you are looking intermittent interference, will require longer periods. 3.2 Parameters of Audio Quality 3.2.1 L & R Audio Level (Stereo Audio Level) There are two VU-meters with double reading of average audio level (ballistic VU) and value of highest peak retained. The highest peak is indicated by two red vertical bars whose recovery is slow. For this measurement, the L & R key must be activated. At the right of VU bars, the values are showed in dB's for a more exact indication. The Zero VU value has been factory calibrated to coincide with a stereo signal modulating 100% at 1 KHz. Audio signals above 0 dB value often implies being overmodulated. However, there are an audio processing techniques which allow supermodulation of complex audio signals, in such a way as to achieve audio levels higher than 0 dB without exceeding 100 % modulation. VA 16 Virtual Monitor 16 3.2.2 L+R & L-R Audio Level On the same indicator referred to previously, activating the L+R/L-R key, one can measure the addition and subtraction levels of the L and R channels. Therefore, on the upper VU meter, the mono component (L+R) of the signal transmitted will be indicated, and on the lower VU meter, the component of the L-R channel difference (which is the one that modulates the 38 KHz stereo subcarrier). 3.2.3 L & R Noise Level The background noise is measured and expressed in dB(A) referred to 100% modulation. For this purpose an "A" weighting filter is available which measures between 30 Hz - 10 KHz. The DSP processor takes 10 samples per second and always retains on the memory the maximum S/N value. In this way, during the brief fragments of silence (50 ms are sufficient), the signal/noise ratio is measured for both stereo channels. It is therefore not necessary to have a special test signal, nor to go off-air the transmission. The real value of S/R can take several hours to obtain, since there must be a fraction of a second's silence. On some radio stations this happens often, but on others with denser formats this can take more time. The measurement of noise is associated with the radio which has been preset at the tuner, so that when it is tuned into again, the former value measured appears. If the reset (RST) key is pressed, this process reverts to zero and the measurement begins again. It is important to note, as we have done before, that this measurement involves the whole audio and RF chain of the radio station, as also possible interference from other far away stations. It is a real and effective value, generally with a lower S/R ratio than the laboratory measurements. Relative Radiated Power) is of a magnitude whose unit RRP = 1 indicates "the RF nominal power of the FM radio station, using a wide band, instantaneous attack audio compressor and slow recovery". With the human voice or music, a compressor of this standard type has a ratio between the peak of the signal and the program average of about 12dB. This is the reference value. When using modern multiband processors with peak simmetrizers and clippers, the ratio between the peak and the average value of the program signal increases. This indicates that we are airing more power on the lateral bands (which are the ones that finally reach the receivers). That is to say, as already known, we convert the carrier's RF power (which does not transmit information) into power for the lateral bands, which do transmit it. This phenomenon is the one which allows modern audio processors to increase the range of an FM radio station. But until now, this effect was known but no method for practical measurement existed. The first theoretical method was proposed by Mr. Bonello, of Solidyne, quite some time ago ("New Improvements in Audio Signal Processing", O.Bonello, AES Journal, New York, June 1976); nevertheless, only now does a device exist which is capable of measuring it economically and efficiently. The measurement is based on the fact that as the power radiated on lateral bands is proportional to the demodulated audio power, it will be proportional to the square of the demodulated audio tension, Va. That is to say that the instantaneous power is: Pw = K .Va2 Where K is a proportionality constant whose value is not of interest because we shall measure relative power and not absolute power. To arrive at the power exercised throughout time by a processed audio signal, we must integrate this instantaneous power in this way: t P( w ) = 3.2.4 Crosstalk a 2 dt 0 With a similar methodology to that applied for measuring S/R, the L/R channels separation is measured. In this case, the signal on L channel is compared instantaneously with the residual on R channel; and vice versa. The maximum values are stored and displayed on screen. After a certain amount of time, the value becomes stable, indicating the crosstalk. In this case, a test signal is not required either. This value is memorized in association with the preset radio. 3.2.5 Effective Radiated Power This important parameter is measured for the first time in FM radio transmissions. Its purpose is to inform the FM radio engineer of the effectiveness of the audio processing chain. This Effective Power with Processing (called RRP, SOLIDYNE ∫ K .V The VA-16X digital receiver, with its internal computer, works out this integral continuously, limiting the period of integration to a few seconds and continually displaying the result, in relative values P(w)/P(ref), where P(ref) is the value obtained with that same signal if it had had a peak/average ratio of 12 dB, corresponding to a single band compressor. VA16 instruments indication implies the multiplication factor of the transmitter power. For example, if a 1 KW transmitter indicates a value of 2.5 RRP, this indicates that with that processor (and that processing settings), it will have the same coverage area as a 2.5 kW transmitter equipped with a conventional audio compressor. Another application is to compare different processing adjustments. For example, a radio station has a 10 KW transmitter and operates with an RRP of 1.5. If now you changes the processing to obtain RRP=2, this means that you have increased the effective power to 10 x 2.0 / 1.5 = 13.3 kW. In other words, you will have the same coverage area reducing the power to: 10 x 1.5 / 2.0 = 7.5 KW. VA 16 Virtual Monitor 17 3.2.6 Stereo Phase Vector An important indicator of the quality of transmission sound is the Phase Vector, because it indicates the degree of stereo sensation the FM radio station transmits. This is linked, quite clearly, to the satisfaction index that the listener feels, and to the sensation of sound quality. In the long run, this also affects the radio station's income (for good or for bad...). The Phase Vector indicator is calibrated in degrees of phase difference. This simplifies the understanding of the values read for the radio technicians. That is to say that if we input a senoidal wave on L and on R, with different phases, what the Audio Vector will show us is the position of the phase vector on a 180 degree quadrant, indicating underneath, in numbers, the phase difference. In other words, if the value is 90 degrees, it will mark a vertical segment on the quadrant. If the phase difference is zero degrees (mono signal) it will mark a horizontal segment on the right hand quadrant. We wonder, however, what happens when we are not dealing with sinusoidal waves but with complex signals such as music and the spoken word. In this case, what the VA-16X indicates is a somewhat more complex value to define, which is the phase correlation between two functions (in this case the left channel's signal and the right one). This correlation value between two complex signals which are variable in time attains its maximum value when the two signals are the same (mono signal). The calculation of this function and its final expression in degrees is done internally by the VA-16X. An interesting additional piece of information that this measurement technique allows us is the possibility of detecting the phase inversion between both channels. This produces a bothersome effect on FM reception, particularly with small receivers such as radio-taperecorders where, because they operate monaural, singers' voices, radio announcers and even news are canceled out. In spite of the complexity of the subject, the measurement of the Phase Vector provides a simple way of seeing in graphic form the sensation of stereo effect that the listener will have. The greater the value of the phase vector in degrees, the better will be the effect. A radio station with little stereo effect will have values of less than 60 degrees. A good stereo sensation is achieved between 60 and 90 degrees, and an excellent one, surpassing 110 degrees. 3.2.7 Frequency Response The frequency response is the only parameter measured by the VA-16X which requires a test signal. However, far from having to stop transmission to measure it, it is possible to do this during transmission of normal programming. SOLIDYNE The first topic to consider is the audio processor's behavior. When a sound engineer carries out response tests, the normal thing is to adjust the processor to flat response. This gives us very flattened out curves... but which have nothing to do with reality. This is due to the fact that modern processors have dynamic audio equalizers (the band compressors are essentially dynamic equalizers) and the response obtained will depend on the adjustment of the audio processor. The technology which we have developed for a real and effective measurement is as follows. VA16 CD-Rom includes 8 test files. On the left channel they have the audio tones recorded, each one of them with a different frequency, from 30 Hz to 15 KHz. The recording level is reduced in several frequencies so as not to bother the listener and also not to saturate the transmitter. The right channel contains a musical arpeggio which is specially reprocessed digitally to have a flat spectral energy (like the pink noise test signal) measured with an analyzer in thirds of an octave. The test files are aired in with the commercials Ads or radio promotions. Normal procedure is to place one each hour. In this way, in 8 hours we have the result, without the audience noticing that we are carrying out tests, because they will only hear a 5 second arpeggio and in some cases an audio tone (in extreme frequencies, the tone is masked by the arpeggio). To make this measurement, on the Frequency Response window of the PC screen, the OFF key should be activated, which will then be ON. In this way the measuring system is activated and ready to capture the different frequency tones. Under these conditions, the VA16X permanently carries out a DSP spectral analysis of the left channel to detect the presence of an invariable frequency pure tone. When it detects one, it measures its value and stores it in its memory. When the 8 values have been completed, they are entered on the PC to be seen by the user in the form of a curve and also printed in color if so wished. The response curve appears in the reduced mode on the VA-16X general screen. To see it enlarged, activate Open. The values measured are memorized and remain associated with the preset radio station. Note 1: The measurement procedure is based on the fact that audio processors analyze the two channels separately, but take a joint decision which involves the same compression or equalization value for the left channel as for the right. Therefore, on receiving the arpeggio, which because of its higher level governs both channels, the band compression acquires maximum flatness because the energy on each band is the same (in fact, the arpeggio has the same spectrum as the pink noise). It is under those ideal conditions that the VA-16X measures the response to frequencies, indicating the real value of the existing chain between the VA 16 Virtual Monitor 18 console and the audio transmitter. For the first time, this value includes the equalization of the audio processor. Note 2: The measuring of frequencies response requires at least 25 dB separation between L and R channels. Note 3: Make sure that the radio station doesn’t transmit with L/R channels inverted. If this occurs, the VA-16X test tones will not be recognized, and the frequency response measurement will fail. Remember: the test tones must be played on the air on the left channel. Note 4: After activation of the frequency response test, when the key is ON, you can close the VA-16X program or you can switch off the PC. The internal VA-16X computer will perform the job needed to get the frequency response. When you reopen the VA-16X software, you will find the activation KEY in OFF and the frequency response displayed. Note 5: If you find that sometimes the frequency test is not performed, probably it is due to heavy noise in the FM reception during one of the eight tone-tests. Or maybe, the radio operator misses to send the test tone to air. In this case you will notice that the activation key remains ON. Then you might to press the ON key (it changes to OFF) and the response curve is displayed using the available test tones (you need at least 2 tones). At the bottom of the curve display you will find the available frequencies (and then you will know which test tones are missing). signals present in the transmission below 4 Hz. This subsonic signal will contain components proportional to the harmonic distortion. But in order that a percentual value can be extracted from them, their value must be correlated with that of the audio signal present in the musical program or in the announcer's voice. This is done by means of extraction algorithms with DSP processing. In the VA-16X the mean value increases with time because the algorithms need to find a specific ratio between the harmonic components of the radio station's program signal. After about one hour, this value becomes stable. If the tuning in of the radio station is maintained during many hours, we shall detect the maximum distortion value which occurs in conditions of maximum modulation. On occasions, the maximum value is not wanted, but rather an average value. For that, the key that reverts to zero or reset (RST) should be pressed, and in this way the memory is erased and the process begins again. The distortion values are stored in the memory and are brought to the screen again together with the preset memory on returning to that radio station. Note 6: Audio test tones are also included in the CD as CD audio tracks. If you introduce the CD into a standard CD player, you can play the audio test tones with no more equipment. Note 7: Since the measurements are instantaneous, different measures may have slight differences. If possible, it should repeat the measurement of frequency response, to average the results. 3.2.8 Harmonic Distortion The importance of measuring this parameter is unquestionable. Nevertheless, until now it had been considered impossible to achieve without interrupting transmission to place a test signal (1 KHz sinusoidal wave). The VA-16X employs a new method. The normal program signal of a radio station is far from being a pure sinusoidal wave which can be used to measure its harmonic components. Also, the harmonics of a signal between 30 Hz and 15 KHz are either masked by the signal itself, or outside the band (over 15 KHz where they are masked by the signal band [L-R] centered on 38KHz). To all intents and purposes, the direct measurement of harmonics appears to be impossible. Nevertheless, during the exhaustive investigation carried out, a phenomenon appeared concurrently with the distortion process, the appearance of subsonic components due to the DC components and intermodulation products linked to the harmonic distortion process. From the mathematical analysis of the distortion process of a polyharmonic signal, the appearance of a DC component can be seen, which is associated to the D value of distortion by second harmonic, as also a frequency difference component. These components are located outside the program's signal band and therefore are not masked by it. The possibility exists, then, of employing a very selective subsonic filter to recover the SOLIDYNE The distortion values measured are total because they involve the audio processor (under a dynamic state, not a static one as is generally measured), as also the stereo coder, the transmitter, the antenna, the propagation multipath distortion, and the existence of other far distant radio stations which affect the lateral stereo bands of the FM station. For this reason, the value measured is in general worse than the specification value of each one of the pieces of equipment. 3.3 Measurement of the Operating Parameters The system proposed stores the results of the analysis on the PC's Hard Disk for its later analysis, always provided that that option has been requested on the Advanced mode (see Introduction, Preset Values). The values for each transmission hour are stored, to be displayed on graphics during 24 hours a day, and information can be stored for many months. The items stored are: 1) Average energy broadcast per hour; 2) Maximum modulation value; 3) Number of silence gaps per hour (silences lasting more than 3 seconds); 4) Number of cases of inverted phases per hour; 5) Average L & R level; 6) Average of the Phase Vector (stereo sensation). Four of these values are displayed permanently on the screen, corresponding to the last hour of transmission, for the operator's information, (ON-AIR performance). In order to see in detail the historic records of these transmission quality values, press the Analyze key in the ON-AIR performance sector, and an analysis window will open up. VA 16 Virtual Monitor 19 If we press the arrow on the File window, we see all the daily registers in the format: Year-Month-Day, the year having its four digits, and the Month and Day two each. We select a day and on screen in the form of a perforated paper, like paper registers, the six values will appear, hour by hour. This allows for important analyses of the behavior of the equipment, and of the procedures used at the radio station during each one of the operation shifts. This graphic can be printed out by pressing the Print Screen key, which enables Windows to print out a screen. We can also verify these numbers, value by value. For that we press Text Mode and a window will appear with each one of the numerical values of each hour of transmission. SOLIDYNE VA 16 Virtual Monitor 20 4 Append -LCD Models- 4.1 Models VA16/LCD & /P with LCD VA16 models with LCD (liquid crystal display) are stand alone units that do not need a host PC, although for some measurements to be performed a computer must be connected to the unit. If a RS232 Serial cable is connected to the VA 16/LCD, the internal control from the LCD display is disabled as the PC controls now the unit. Nevertheless, the LCD will still show all information in slave mode. VA 16/LCD adds extra versatility to Virtual Analyzers, as it can be easily placed near the FM transmitter, or even on the processor rack as a stand alone unit used for fine tuning of technical settings. At the same time, a remote PC at the Studios can be connected to perform 24 hours log of all the measured parameters. The LCD standalone unit is able to display almost all the transmission data. The only ones measurements that mandatory needs a computer are Spectrum Analysis, Band Scanner, Freq. Response and 24 Hs logging. Jog the wheel until the cursor is placed above the frequency, then push the knob to confirm. Now the blinking cursor disappears. Turning the wheel will change tuning frequency. Frequency moves in 50 KHz steps to accommodate any station throughout the world. When the desired frequency is displayed push the knob to confirm. The VA16 Synthesizer will tune to it. Turn left the JOG wheel and select QUIT, then push the knob to leave the tuning menu. 4.1.4 Other Options from the Menu There are four more options in the Main Menu of the VA16. To change these options use the same procedure just described above. The parameters that can be modified are the following: The portable VA 16/LCD/P model avoids the use of Laptop computers for on the field measurements, while at the same time giving reliable measures in a rugged one piece of equipment; transforming the VA 16 in the ultimate machine for make measurements of the FM Radio performance on the field. a) Change Vu-Meters from standard L/R Mode (Left and Right level meters) to L+R/L-R Mode (sum of channels at L-VU and difference at R-VU) 4.1.2 Menu Options c) LCD models have a backlight energy saver which is very useful when battery operated. This timer shuts off the LCD backlight, after a presetable amount of time. If the backlight is set to ON, then it will never turn off. Each time the JOG is moved the backlight is turned on again for NN seconds. All VA 16/LCD units have a front panel JOG wheel with push button from which the unit is controlled. Rotating the wheel the different options form the menu are selected. In order to select a certain option the JOB wheel has to be pressed down. To display the Menu Option just push down the JOG wheel once. A blinking cursor will show the selected option from the menu. Turn the wheel and push it once to select an option. To leave the Menu turn select the QUIT option using the JOG wheel, and push the knob to confirm. 4.1.3 Tuning in a radio station While in the Menu, jog the wheel until the cursor is on the TUNE option. Push the knob to change frequency: SOLIDYNE b) RESET to zero THD measurement, Channel Separation and Noise Level meters. See Operation Manual for details d) FIELD option allows the user to set an antenna gain correction factor in order to calibrate the Field Intensity meter for the specific antenna (and coax length in use). Please see Operation Manual, for details 4.1.5 Information Visualization Displays In order to exit the Main Menu turn the wheel to QUIT option and push the knob. Now you can navigate (using the wheel) between the four screens of the VA16. In them you will find all the technical Information that the VA16 measure. Turn the JOG to change the screens. The screens are the following: VA 16 Virtual Monitor 21 Note that the Mp indicator (first screen) is a multipath distortion meter that helps the user to locate the antenna in a multipath free location. If the meter shows a “GOOD” caption, then all measurements are reliable. In portable models at the upper right corner of the second screen the battery charge indicator appears. When the battery is very low, a warning label appear in all the screens. The unit should be charged as soon as possible to extend battery life. Calibration card viewed from components side. To access remove the top cover. 4.2 Cristal calibration (only units with option /CAL) It is an absolute system of calibration developed by Solidyne to guarantee precision of laboratory in the measurement of 100% of FM modulation. It consists of two frequency generators controlled by crystal that allow a fine readjustment for calibration in factory. These generators are commuted at 400 Hertz to generate a square wave in frequency modulation. The signal of the calipers is injected to the Intermediate frequency of the VA16 replacing to the air signal. The correct values can be readjusted if the frequency deviation error surpasses 0.1% (it corresponds to 75 Hertz of frequency error). Use trimmers associate to each oscillator to make the readjusted. The frequency generators are fit to 10.7 MHz +/- 75 KHz, that is to say: F1 = 10.775 KHz; F2 = 10.625 KHz These values are calibrated in Solidyne using a Hewlett Packard 5328A with Certification of TMI Labs, USA, tracing in NIST. The allowed maximum error is 10 Hertz, which gives exactitude of 100% of modulation on the Crystal Calipers of 0.015% Measurement Tracing If for legal reasons you wish to verify this calibration, you can measure frequencies F1 and F2 at the test points indicated in the following figure. For make this, you must use a digital Frequency meter of 8 digits with base of time of one second. SOLIDYNE VA 16 Virtual Monitor 22 Chapter 5 Technical specifications 5.1 Input & Output • • • • • • • • • • RF INPUT: BNC connector AUDIO OUTPUT: L&R two XLR balanced +4 dBu MPX INPUT: 1Vrms for 100% mod. MPX OUTPUT: 1Vrms for 100% mod. Z out = 220 ohm HEADPHONE: (front panel) 1/8” Stereo, volume control . (32 – 600 ohm) PEAK WEIGHTING SELECTOR: DIP switch 5 – 2 – 1 – 0,5 msec RS232 CONTROL: 9 pin D Female Connector OPTIONAL: Ethernet TCP/IP Control Module, RJ45 RDS ANALYZER: USB connector type B, status led's, aux. Headphone output MODULATION CALIBRATOR: Test button – preset adjust 5.2 FM Digital receiver • • • • • • • • • • • FREQUENCY RANGE: 87.5 - 108 MHz FM CHANNELS: 50 KHz steps PRESET FM STATIONS: 16 Preset Memories, including Name FRONT END: Dual Gate Mosfet IMAGE REJECTION: 50 dB IF REJECTION: 80 dB SENSIBILITY: 40 dB/uV for 12bB SINAD NOISE: S/N ratio > 60 dBa THD: > 0,5% at 1 KHz 100% mod. IF BANDWIDTH: 270 KHz for audio / 10 KHz Bandwidth and Spectrum FREQ RESPONSE: 20 - 60 KHz, +/- 0,2 dB 5.3 Stereo Decoder • • • • • • Output Level: + 4 dBu Balanced SNR: > 85 dBA THD: > 0,02% Mono & Stereo Stereo Separation: 50 dB @ 1Khz Pilot Tone attenuation: 50 dB De-emphasis: 75 usec 5.4 Test measurements and digital processing • MODULATION: FM Modulation from 1 to 160% • • • • • • • • • • • • • • Error: less than 2 % at 100% modulation 0,1 % precision crystal calibrator for 100% Modulation Fast Peak: measure less than 200 uS or Peak Weighting 5, 2, 1, 0.5 msec FM deviation peak from 0 to 112 KHz OVERMODULATION: peaks/minute counter over 105 % FIELD INTENSITY: 40 to 99 dBuv with user defined correction factor for antenna gain. Error les than 2 dB at 100 MHz PILOT TONE LEVEL: 19 KHz pilot level, from 0 to 20 % in 0.1 % steps +/- 0.5 % PILOT TONE FREQUENCY: Frequency error from -99 to + 99 Hz +/- 0.5 Hz RDS SUBCARRIER LEVEL: 57 KHz pilot level, from 0 to 10 % in 0.1 % steps +/- 0.5 % PILOT FREQUENCY: Frequency error from -99 to + 99 Hz +/- 0.5 Hz CARRIER DEVIATION: Digital display, + / - 9,9 KHz in 0,1 KHz steps / Error < 0,2 KHz STEREO LEVEL: -20 to + 5 dB L/R & L-R Mode, user selected 2 state VU: Ballistic & Peak STEREO PHASE: Phase Correlation from 0 to 180 degrees. It indicates the true stereo sensation the audience is hearing. Analog Vectorscope and Digital mode. MONO & INVERSE phase RADIATED POWER: Relative radiated power, measured from 0 to 5; it indicates the increase at the RF power due to the audio SOLIDYNE VA 16 Virtual Monitor 23 processing chain. A unity value means a standard audio compressor (12 dB peak/average ratio). A value of "4" indicates a 100 % modulation with continuous sine wave • • • • • • • • MULTIPATH DISTORTION: Relative indication from BAD to 5 levels of GOOD NOISE: L & R noise level; -40 to -90 dBa, +/- 3 dB; 20-10 KHz, «A» weighted. Automatic measure using brief samples of the silences associated with the normal FM program. STEREO CROSSTALK: L-R and R-L separation, from 0 to 50 dBa, +/- 2 dB. Automatic measurement during brief samples of music with panning effects used by recording engineers. HARMONIC DISTORTION: 0.02 % to 5 %. It measures 2nd and even harmonic distortion due to the FM modulation process. Automatic measurement is performed using the speaker voice and measuring the Modulation Transfer Function of the voice. Then, is processed (DSP), using the Bonello algorithms. FREQ RESPONSE: 30 Hz to 15 KHz; +/- 1 dB Automatic measurement using 8 spots of 5 sec each, to be aired during night (only one spot each hour is enough). The spots are provided with the VA-16XX CD-ROM (WAV files). SPECTRUM ANALYZER: Selectable frequency span, from +/- 250 KHz to +/- 1 MHz in 25, 50 and 100 KHz steps. Bandwidth is 10 KHz. Measure range = 50 dB, +/- 3 dB. MODULATION BANDWIDTH: Graph of % MOD from zero to +/- 150 KHz, BW of measure = 10 KHz SCANNER: Frequency scan of all the odd FM band channels, from 87.5 to 108 MHz in 100 kHz or 50 kHz steps. 5.5 Printed records of on-air performance The VA-16XX can store, at the PC computer, record files of the total performance of the FM Radio, 24 hrs a day, one file each day. Several months can be stored and sent by E-mail to the main Engineering Office to be audited. The On-Air performance can be seen from the PC screen or can be printed in color. It is updated every hour and has the following items: RADIATED POWER: Average of radiated power during each hour. Last hour is shown on screen. It gives information about the quality of the audio processing chain and the average coverage area of the Radio. MAX MODULATION: The peak value of modulation is stored each hour. Last hour is shown on screen. It gives valuable information about the quality of the audio processors and the efforts of your Chief Engineer to avoid overmodulation. 3 SEC SILENCE: If a silence of 3 sec or more is produced (program gap), this event is stored. You can control the number of gaps/hour. Last hour shown on screen. It allows the manager to know the commitment level of the djs and audio operators. REVERSE PHASE: Each time a spot, commercial, musical tune, etc, is aired with its stereo phase reversed, the event is stored. Last hour is shown on screen. It gives information about the care your Engineers take to avoid bad audio connections. L & R LEVEL: Left & Right average audio level is recorded each hour. STEREO PHASE: The stereo correlation phase is averaged and recorded each hour. It gives information about the average stereo quality sensation of the CDs and music sound sources the Radio is using. 24 Hrs printed log includes all the above and: Field Intensity, Channel Separation, L-Noise, R-Noise, Pilot Error, Pilot Level, Carrier Deviation and THD Distortion. 5.6 Models & options VA 16X/RK Model for use in rack or table top, with steel case and vertical whip antenna with magnetic base. VA 16X/LCD Idem model RK, PC operated or stand-alone unit. With 2 x 40 backlighted LCD display VA 16X/P/LCD Portable model, with carring bag and whip antenna.. Internal Battery; 4 hs continuous operation for stand-alone or Laptop use. Internal battery charger, 220 / 117 V 50/60 Hz operation. /CAL Crystal calibrator for 0,1 % modulation precision /IP Ethernet connection for working with remote control without PC /AR202 Software for 2 channels recording at the PC Then the sound of the radio station is available from any place using Internet /ADA102 This encoder allows for real time MP3 streaming transmission of the tuned radio station /RDS Additional internal RDS receiver and decoder for RDS parameters analyzer DIMENSIONS: 19" rack mount. Module one (44,4 mm) Weight: 6 Kg POWER: 100 V - 240V (user selectable) 50/60 Hz, or Ni-Cad battery in models /P SOLIDYNE VA 16 Virtual Monitor 24